Attached files
| file | filename |
|---|---|
| EX-99.1 - EXHIBIT 99.1 - Metropolitan Bank Holding Corp. | tm2025333d1_ex99-1.htm |
| 8-K - FORM 8-K - Metropolitan Bank Holding Corp. | tm2025333d1_8k.htm |
Exhibit 99.2
Investor Presentation 2020 Q2
1 Forward - looking Statement This presentation contains “forward - looking statements” within the meaning of the Private Securities Litigation Reform Act of 1995 . Examples of forward - looking statements include but are not limited to the Company’s financial condition and capital ratios, results of operations and the Company’s outlook and business . Forward - looking statements are not historical facts . Such statements may be identified by the use of such words as “may”, “believe”, “expect”, “anticipate”, “plan”, “continue”, or similar terminology . These statements relate to future events or our future financial performance and involve risks and uncertainties that may cause our actual results, levels of activity, performance or achievements to differ materially from those expressed or implied by these forward - looking statements . Although we believe that the expectations reflected in the forward - looking statements are reasonable, we caution you not to place undue reliance on these forward - looking statements . Factors which may cause our forward - looking statements to be materially inaccurate include, but are not limited to those discussed under the heading “Risk Factors” in our Annual Report on Form 10 - K and Quarterly Reports on Form 10 - Q, as well as an unexpected deterioration in our loan portfolio, unexpected increases in our expenses, greater than anticipated growth and our ability to manage such growth, unanticipated regulatory action, unexpected changes in interest rates, an unanticipated decrease in deposits, an unanticipated loss of key personnel, an unanticipated loss of existing customers, competition from other institutions resulting in unanticipated changes in our loan or deposit rates, unanticipated increases in Federal Deposit Insurance Corporation costs and unanticipated adverse changes in our customers’ economic conditions or economic conditions in our local area in general . Further, given its ongoing and dynamic nature, it is difficult to predict the full impact of the Coronavirus (“COVID - 19 ”) outbreak on our business . The extent of such impact will depend on future developments, which are highly uncertain, including when the coronavirus can be controlled and abated and when and how the economy may be reopened . As the result of the COVID - 19 pandemic and the related adverse local and national economic consequences, we could be subject to any of the following risks, any of which could have a material, adverse effect on our business, financial condition, liquidity, and results of operations : the demand for our products and services may decline, making it difficult to grow assets and income ; if the economy is unable to substantially reopen, and high levels of unemployment continue for an extended period of time, loan delinquencies, problem assets, and foreclosures may increase, resulting in increased charges and reduced income ; collateral for loans, especially real estate, may decline in value, which could cause loan losses to increase ; our allowance for loan losses may increase if borrowers experience financial difficulties, which will adversely affect our net income ; the net worth and liquidity of loan guarantors may decline, impairing their ability to honor commitments to us ; as the result of the decline in the Federal Reserve Board’s target federal funds rate to near 0 % , the yield on our assets may decline to a greater extent than the decline in our cost of interest - bearing liabilities, reducing our net interest margin and spread and reducing net income ; our cyber security risks are increased as the result of an increase in the number of employees working remotely ; and FDIC premiums may increase if the agency experience additional resolution costs . Forward - looking statements speak only as of the date of this presentation . We do not undertake any obligation to update or revise any forward - looking statement, whether the result of new information, future events or otherwise .
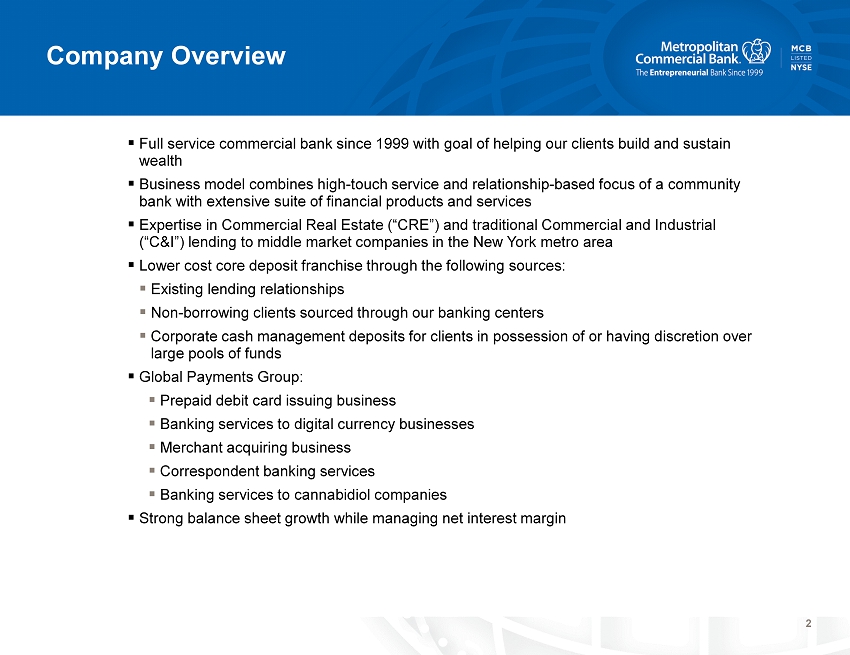
2 Company Overview ▪ Full service commercial bank since 1999 with goal of helping our clients build and sustain wealth ▪ Business model combines high - touch service and relationship - based focus of a community bank with extensive suite of financial products and services ▪ Expertise in Commercial Rea l E state (“CRE”) and traditional Commercial and Industrial (“C&I”) lending to middle market companies in the New York metro area ▪ Lower cost core deposit franchise through the following sources: ▪ Existing lending relationships ▪ Non - borrowing clients sourced through our banking centers ▪ Corporate cash management deposits for clients in possession of or having discretion over large pools of funds ▪ Global Payments Group: ▪ Prepaid debit card issuing business ▪ Banking services to digital currency businesses ▪ Merchant acquiring business ▪ Correspondent banking services ▪ Banking services to cannabidiol companies ▪ Strong balance sheet growth while managing net interest margin
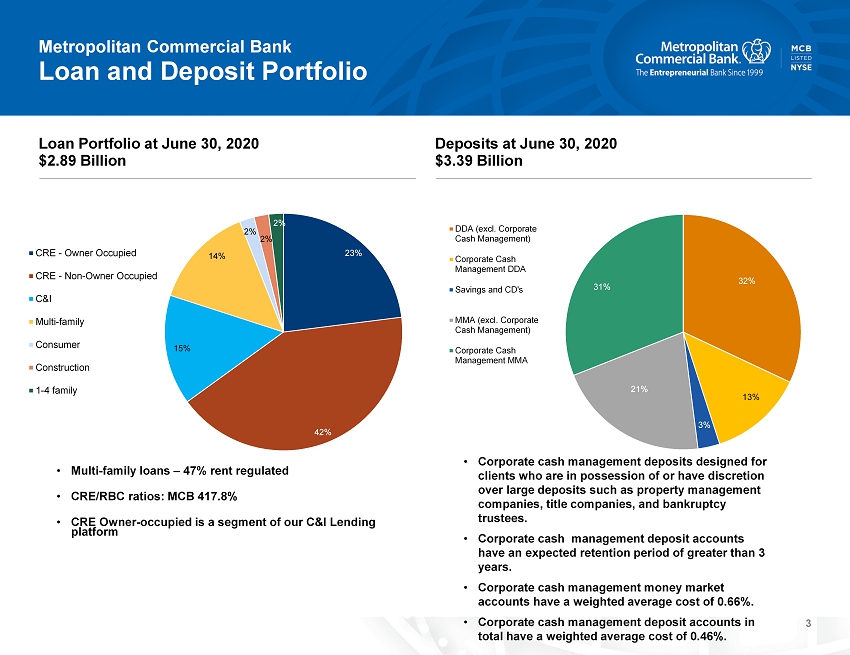
3 Loan and Deposit Portfolio Metropolitan Commercial Bank • Multi - family loans – 47% rent regulated • CRE/RBC ratios: MCB 417.8 % • CRE Owner - occupied is a segment of our C&I Lending platform Loan Portfolio at June 30, 2020 $2.89 Billion Deposits at June 30, 2020 $3.39 Billion 32% 13% 3% 21% 31% DDA (excl. Corporate Cash Management) Corporate Cash Management DDA Savings and CD's MMA (excl. Corporate Cash Management) Corporate Cash Management MMA 23% 42% 15% 14% 2% 2% 2% CRE - Owner Occupied CRE - Non-Owner Occupied C&I Multi-family Consumer Construction 1-4 family • Corporate cash management deposits designed for clients who are in possession of or have discretion over large deposits such as property management companies, title companies, and bankruptcy trustees. • Corporate cash management deposit accounts have an expected retention period of greater than 3 years. • Corporate cash management money market accounts have a weighted average cost of 0.66%. • Corporate cash management deposit accounts in total have a weighted average cost of 0.46%.
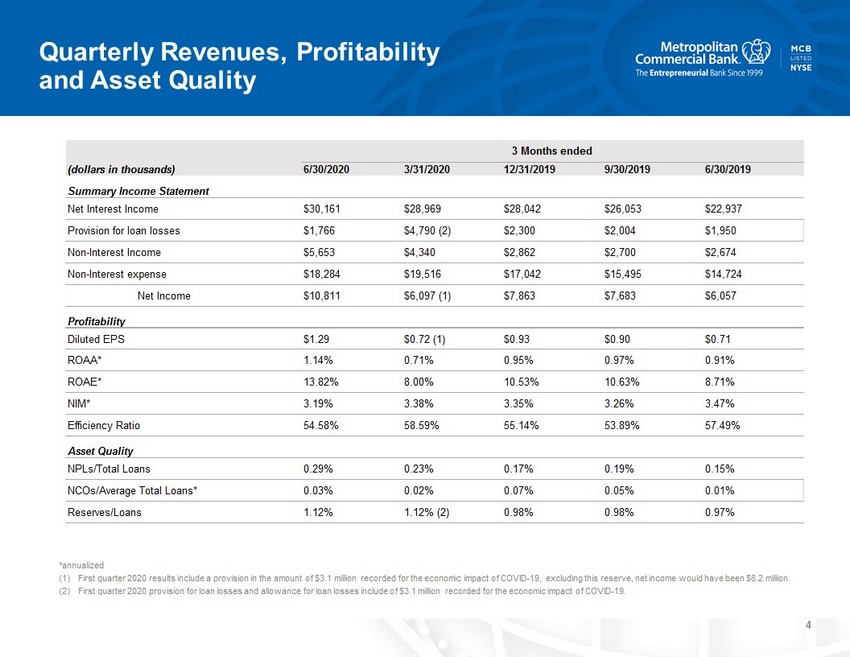
4 Quarterly Revenues, Profitability and Asset Quality * annualized (1) First quarter 2020 results include a pro vision in the amount of $3.1 million recorded for the economic impact of COVID - 19, excluding this reserve, net income would have been $8.2 million. (2) First quarter 2020 provision for loan losses and allowance for loan losses include of $3.1 million recorded for the economic imp act of COVID - 19. (dollars in thousands) 6/30/2020 3/31/2020 12/31/2019 9/30/2019 6/30/2019 Summary Income Statement Net Interest Income $30,161 $28,969 $28,042 $26,053 $22,937 Provision for loan losses $1,766 $4,790 (2) $2,300 $2,004 $1,950 Non-Interest Income $5,653 $4,340 $2,862 $2,700 $2,674 Non-Interest expense $18,284 $19,516 $17,042 $15,495 $14,724 Net Income $10,811 $6,097 (1) $7,863 $7,683 $6,057 Profitability Diluted EPS $1.29 $0.72 (1) $0.93 $0.90 $0.71 ROAA* 1.14% 0.71% 0.95% 0.97% 0.91% ROAE* 13.82% 8.00% 10.53% 10.63% 8.71% NIM* 3.19% 3.38% 3.35% 3.26% 3.47% Efficiency Ratio 54.58% 58.59% 55.14% 53.89% 57.49% Asset Quality NPLs/Total Loans 0.29% 0.23% 0.17% 0.19% 0.15% NCOs/Average Total Loans* 0.03% 0.02% 0.07% 0.05% 0.01% Reserves/Loans 1.12% 1.12% (2) 0.98% 0.98% 0.97% 3 Months ended
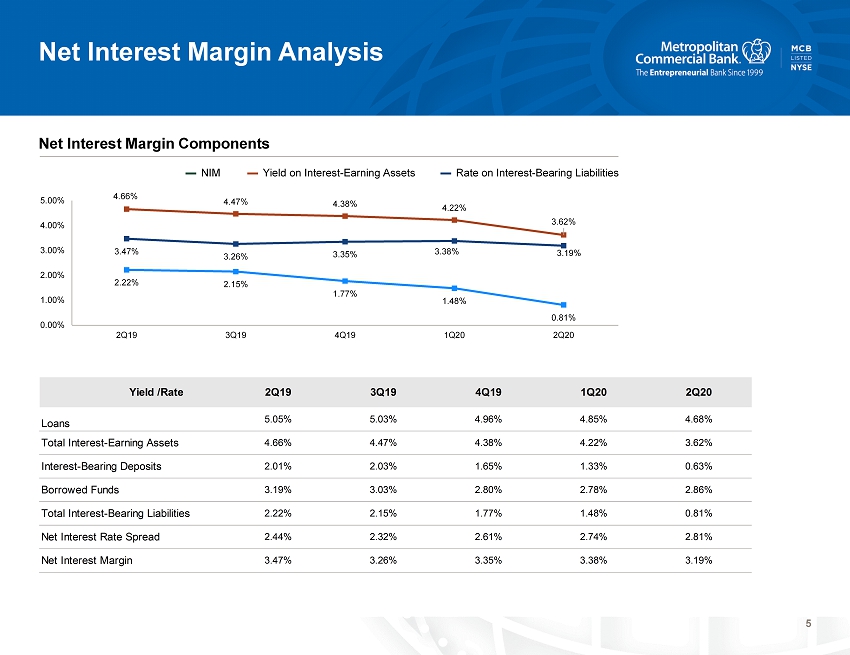
5 Net Interest Margin Analysis 3.47% 3.26% 3.35% 3.38% 3.19% 4.66% 4.47% 4.38% 4.22% 3.62% 2.22% 2.15% 1.77% 1.48% 0.81% 0.00% 1.00% 2.00% 3.00% 4.00% 5.00% 2Q19 3Q19 4Q19 1Q20 2Q20 Net Interest Margin Components ▬ NIM ▬ Yield on Interest - Earning Assets ▬ Rate on Interest - Bearing Liabilities Yield /Rate 2Q19 3Q19 4Q19 1Q20 2Q20 Loans 5.05% 5.03% 4.96% 4.85% 4.68% Total Interest-Earning Assets 4.66% 4.47% 4.38% 4.22% 3.62% Interest-Bearing Deposits 2.01% 2.03% 1.65% 1.33% 0.63% Borrowed Funds 3.19% 3.03% 2.80% 2.78% 2.86% Total Interest-Bearing Liabilities 2.22% 2.15% 1.77% 1.48% 0.81% Net Interest Rate Spread 2.44% 2.32% 2.61% 2.74% 2.81% Net Interest Margin 3.47% 3.26% 3.35% 3.38% 3.19%
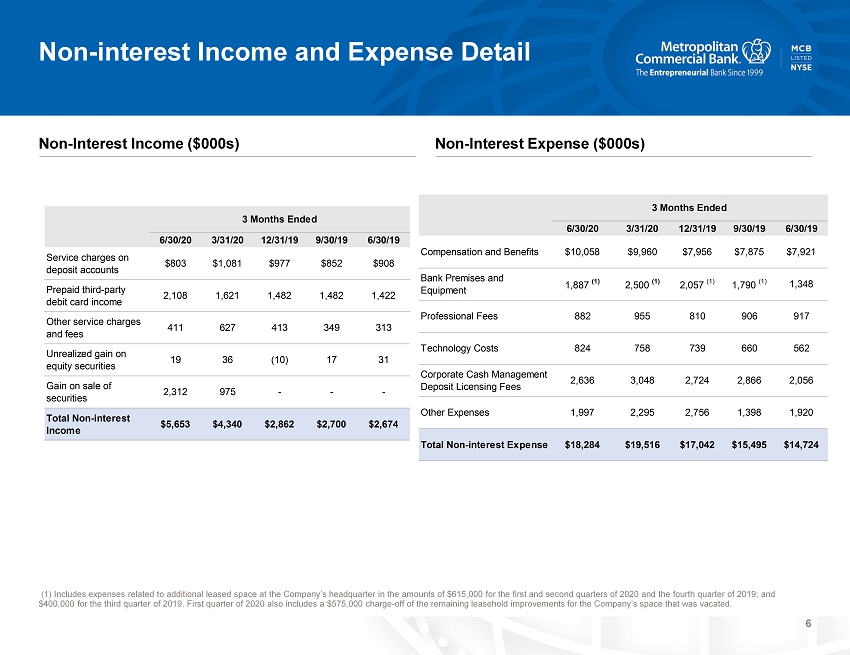
6 Non - interest Income and Expense Detail Non - Interest Income ($000s) Non - Interest Expense ($000s) (1) Includes expenses related to additional leased space at the Company’s headquarter in the amounts of $615,000 for the first and second qua rters of 2020 and the fourth quarter of 2019; and $400,000 for the third quarter of 2019. First quarter of 2020 also includes a $575,000 charge - off of the remaining leasehold imp rovements for the Company’s space that was vacated . 6/30/20 3/31/20 12/31/19 9/30/19 6/30/19 Service charges on deposit accounts $803 $1,081 $977 $852 $908 Prepaid third-party debit card income 2,108 1,621 1,482 1,482 1,422 Other service charges and fees 411 627 413 349 313 Unrealized gain on equity securities 19 36 (10) 17 31 Gain on sale of securities 2,312 975 - - - Total Non-interest Income $5,653 $4,340 $2,862 $2,700 $2,674 3 Months Ended 6/30/20 3/31/20 12/31/19 9/30/19 6/30/19 Compensation and Benefits $10,058 $9,960 $7,956 $7,875 $7,921 Bank Premises and Equipment 1,887 (1) 2,500 (1) 2,057 (1) 1,790 (1) 1,348 Professional Fees 882 955 810 906 917 Technology Costs 824 758 739 660 562 Corporate Cash Management Deposit Licensing Fees 2,636 3,048 2,724 2,866 2,056 Other Expenses 1,997 2,295 2,756 1,398 1,920 Total Non-interest Expense $18,284 $19,516 $17,042 $15,495 $14,724 3 Months Ended

7 Balance Sheet and Capital *Metropolitan Bank Holding Corp. and Metropolitan Commercial Bank meet all the requirements to be considered “Well - Capitalized” under applicable regulatory guidelines at each date shown. As of 12/31/2019 As of As of 3/31/20 6/30/19 Balance Sheet ($000's) Total Assets $3,357,572 $3,243,171 $2,960,613 $358,429 $1,009,828 Total Loans $2,672,949 $2,496,697 $2,335,573 $126,175 $556,701 Total Deposits $2,790,774 $2,705,206 $2,376,122 $373,047 $1,018,617 Capital MBHC MCB MBHC MCB MBHC MCB MBHC MCB MBHC MCB CET1* 9.9% 11.6% 9.8% 11.5% 10.1% 11.8% 10.4% 12.2% 10.7% 12.5% Total Risk-Based Capital* 12.7% 12.6% 12.1% 12.5% 12.5% 12.7% 13.0% 13.1% 13.4% 13.4% Tier 1 Leverage* 8.6% 9.2% 9.1% 9.8% 9.4% 10.1% 9.6% 10.3% 11.0% 11.2% $3,612,012 $2,766,099 $3,021,692 $3,394,739 6/30/2020 Change vs. As of 3/31/2020As of 6/30/2020 $3,970,441 $2,892,274
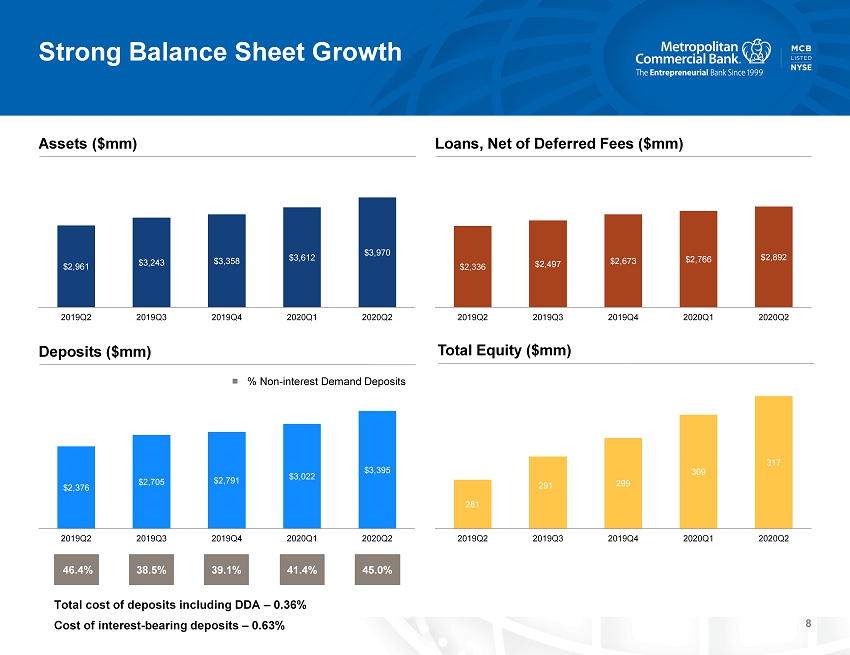
8 Strong Balance Sheet Growth Deposits ($mm) Total Equity ($mm) Assets ($mm) Loans, Net of Deferred Fees ($mm) $2,961 $3,243 $3,358 $3,612 $3,970 2019Q2 2019Q3 2019Q4 2020Q1 2020Q2 $2,336 $2,497 $2,673 $2,766 $2,892 2019Q2 2019Q3 2019Q4 2020Q1 2020Q2 $2,376 $2,705 $2,791 $3,022 $3,395 2019Q2 2019Q3 2019Q4 2020Q1 2020Q2 281 291 299 309 317 2019Q2 2019Q3 2019Q4 2020Q1 2020Q2 46.4% 38.5% 39.1% 41.4% 45.0% ■ % Non - interest Demand Deposits Total cost of deposits including DDA – 0.36% Cost of interest - bearing deposits – 0.63%
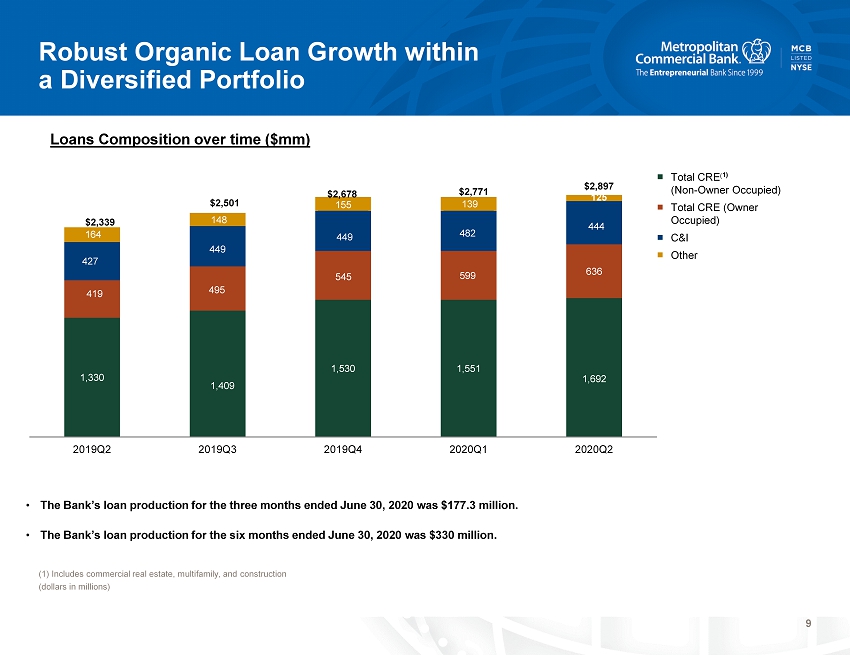
9 Robust Organic Loan Growth within a Diversified Portfolio (1) Includes commercial real estate, multifamily, and construction (dollars in millions) ■ Total CRE ( 1) (Non - Owner Occupied) ■ Total CRE (Owner Occupied) ■ C&I ■ Other • The Bank’s loan production for the three months ended June 30, 2020 was $177.3 million. • The Bank’s loan production for the six months ended June 30, 2020 was $330 million. Loans Composition over time ($mm) $2,339 $2,501 $2,678 $2,771 $2,897 125 1,330 1,409 1,530 1,551 1,692 419 495 545 599 636 427 449 449 482 444 164 148 155 139 2019Q2 2019Q3 2019Q4 2020Q1 2020Q2

10 Commercial Growth Driven by Expertise in Specific Lending Verticals General Commercial and Industrial Overview C&I Composition at June 30, 2020 Target Market Key Metrics ▪ Middle market businesses with annual revenues below $200mm ▪ Primarily concentrated in the New York MSA ▪ Well - diversified across industries ▪ Average yield of 4.97% YTD ▪ Strong historical credit performance ▪ Pledged collateral and/or personal guarantees from high net worth individuals support most loans ▪ Target borrowers have strong historical cash flows, good asset coverage and positive industry outlooks 51% 4% 24% 6% 2% 3% 1% 1% 5% 1% Healthcare Manufacturing Finance and Insurance Wholesale Trade Individuals Transportation Arts, Entertainment, and Recreation Retail Trade and RE Rental & Leasing Professional, Scientific, Technical and Other Services Accommodation and Food Services Individuals Secured 2%
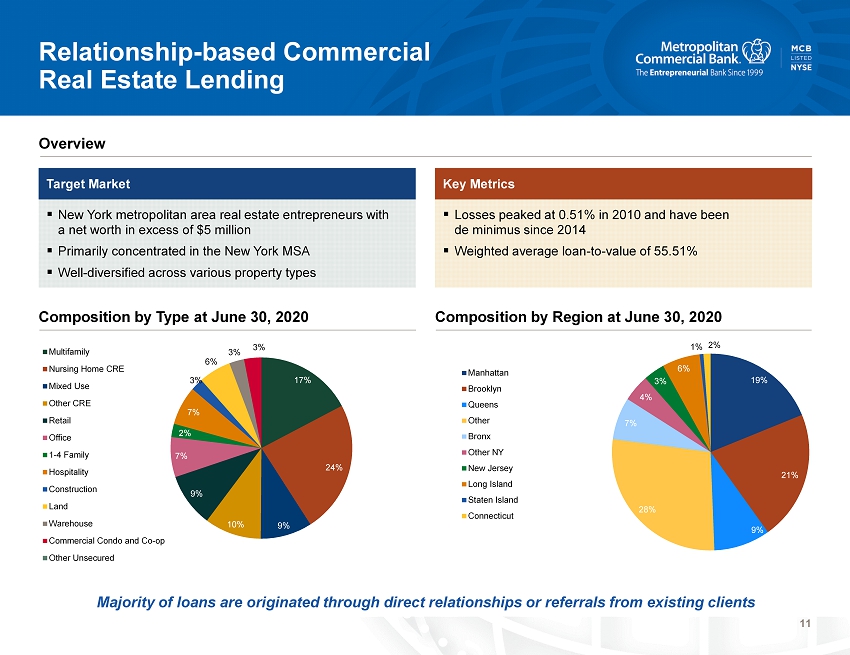
11 Relationship - based Commercial Real Estate Lending Composition by Type at June 30, 2020 Composition by Region at June 30, 2020 Overview Target Market Key Metrics ▪ New York metropolitan area real estate entrepreneurs with a net worth in excess of $5 million ▪ Primarily concentrated in the New York MSA ▪ Well - diversified across various property types ▪ Losses peaked at 0.51% in 2010 and have been de minimus since 2014 ▪ Weighted average loan - to - value of 55.51% Majority of loans are originated through direct relationships or referrals from existing clients 17% 24% 9% 10% 9% 7% 2% 7% 3% 6% 3% 3% Multifamily Nursing Home CRE Mixed Use Other CRE Retail Office 1-4 Family Hospitality Construction Land Warehouse Commercial Condo and Co-op Other Unsecured 19% 21% 9% 28% 7% 4% 3% 6% 1% 2% Manhattan Brooklyn Queens Other Bronx Other NY New Jersey Long Island Staten Island Connecticut
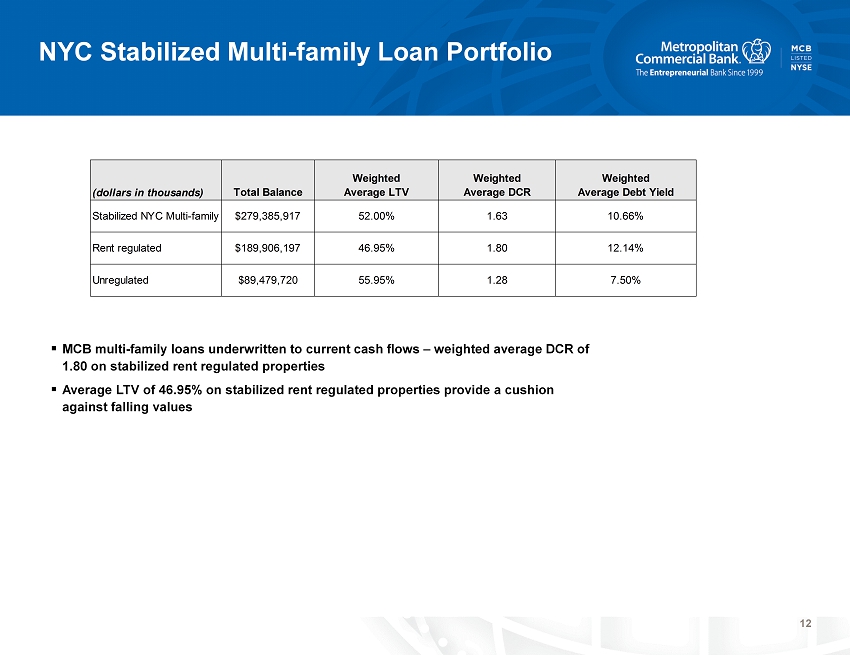
12 NYC Stabilized Multi - family Loan Portfolio ▪ MCB multi - family loans underwritten to current cash flows – weighted average DCR of 1.80 on stabilized rent regulated properties ▪ Average LTV of 46.95% on stabilized rent regulated properties provide a cushion against falling values (dollars in thousands) Total Balance Weighted Average LTV Weighted Average DCR Weighted Average Debt Yield Stabilized NYC Multi-family $279,385,917 52.00% 1.63 10.66% Rent regulated $189,906,197 46.95% 1.80 12.14% Unregulated $89,479,720 55.95% 1.28 7.50%

13 Well - Developed, Diversified Healthcare Portfolio ▪ Active in Healthcare lending since 2002 ▪ CRE – SNF – Average loan - to - value of 68% ▪ Highly selective in regards to the quality of Skilled Nursing Operators which we finance ▪ Borrowers typically have over 1,000 beds under management ▪ Loans are made only in “certificate of need” states which limits the supply of beds and supports stable occupancy rates. ▪ Sta bilized SNF – 72% of CRE SNF portfolio. Stabilized facility provides adequate cash flows to support debt service and collateral value. Borrowers primary motive for acquisition of a stabilized property is for synergies with existing portfolio of SNFs. Average debt service coverage ratio is 2.02x and average loan - to - value is 68%. Once the loans are seasoned, the mortgage portion of the bridge loan is refinanced with HUD. ▪ Stabilized loans and Non - Stabilized loans are respectively $401 million and $142 million. ▪ Non - stabilized SNF – typically “turn - around” older SNFs acquired from owners who mismanaged the business, relied too heavily on long - term care (Medicaid reimbursement) or did not stay current with changes in the market place. Opportunity for owner to create value by renovating and adding services with higher Medicaid reimbursements rates (rehabilitation services, dialysis, etc.). C& I Healthcare Composition at June 30, 2020 Diversified Healthcare Portfolio 51% 11% 8% 3% 2% 1% 20% 4% Nursing and Residential Care Facilites Doctor Office Ambulatory Health Care Services Offices and Clinics of Dentists Medical Labs Offices of Speech Therapists Misc. Health Practitioners Ambulance Services CRE Skilled Nursing Facilities (SNF) - $539 million C&I Skilled Nursing Facilities (SNF) - $111 million C&I Other Healthcare - $107 million
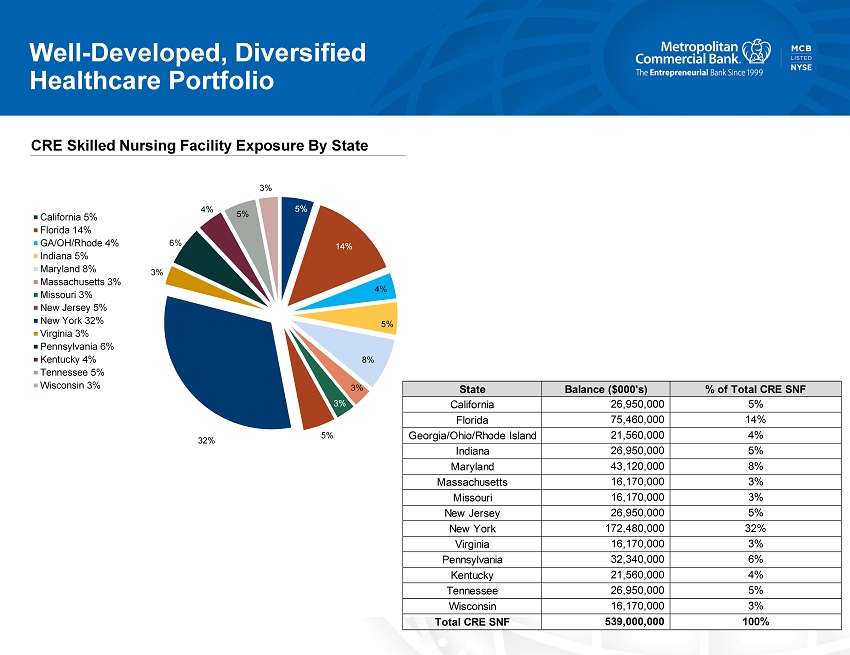
14 Well - Developed, Diversified Healthcare Portfolio CRE Skilled Nursing Facility Exposure By State Total CRE SNF 539,000,000 100% Kentucky 21,560,000 4% Tennessee 26,950,000 5% 16,170,000 3% Wisconsin Pennsylvania 32,340,000 6% New Jersey 26,950,000 5% New York 172,480,000 32% Virginia 16,170,000 3% Massachusetts 16,170,000 3% Missouri 16,170,000 3% Indiana 26,950,000 5% Maryland 43,120,000 8% Florida 75,460,000 14% Georgia/Ohio/Rhode Island 21,560,000 4% State Balance ($000's) % of Total CRE SNF California 26,950,000 5% 5% 14% 4% 5% 8% 3% 3% 5% 32% 3% 6% 4% 5% 3% California 5% Florida 14% GA/OH/Rhode 4% Indiana 5% Maryland 8% Massachusetts 3% Missouri 3% New Jersey 5% New York 32% Virginia 3% Pennsylvania 6% Kentucky 4% Tennessee 5% Wisconsin 3%

15 Well - Developed, Diversified Healthcare Portfolio C&I Skilled Nursing Facility Exposure By State 4% 6% 3% 57% 11% 20% Florida Georgia/Indiana/Wisconsin /Virginia/Ohio/Kentucky New Jersey New York Pennsylvania Tennessee Total C&I SNF 110,907 100% Pennsylvania 12,007 11% Tennessee 23,237 20% New Jersey 2,991 3% New York 62,664 57% Georgia/Indiana/Wisconsin/Virginia/Ohio/Kentucky 6,201 6% State Balance ($000's) % of Total C&I SNF Florida 3,806 3%
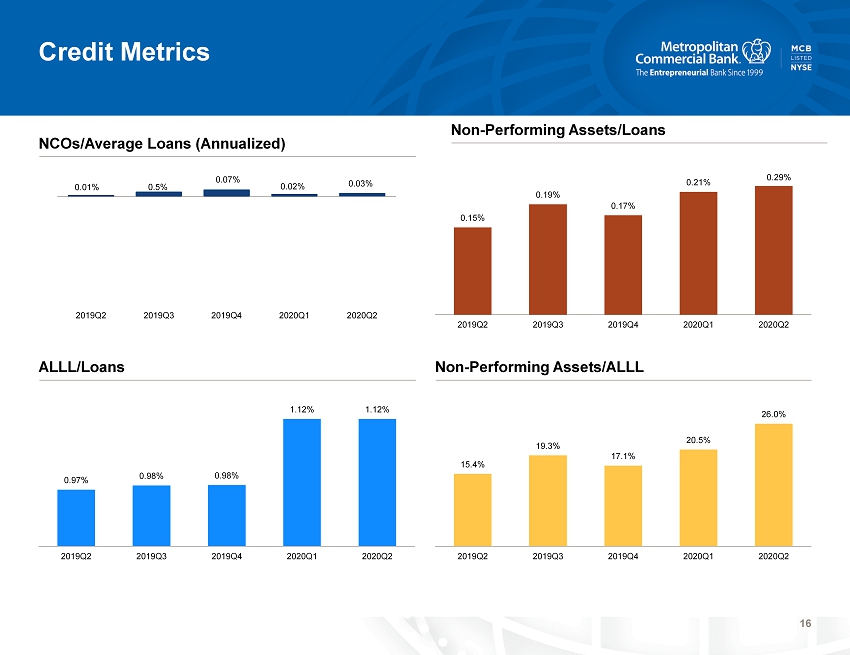
16 Credit Metrics ALLL/Loans Non - Performing Assets/ALLL NCOs/Average Loans (Annualized) Non - Performing Assets/Loans 0.97% 0.98% 0.98% 1.12% 1.12% 2019Q2 2019Q3 2019Q4 2020Q1 2020Q2 15.4% 19.3% 17.1% 20.5% 26.0% 2019Q2 2019Q3 2019Q4 2020Q1 2020Q2 0.01% 0.5% 0.07% 0.02% 2019Q2 2019Q3 2019Q4 2020Q1 2020Q2 0.03% 0.15% 0.19% 0.17% 0.21% 0.29% 2019Q2 2019Q3 2019Q4 2020Q1 2020Q2
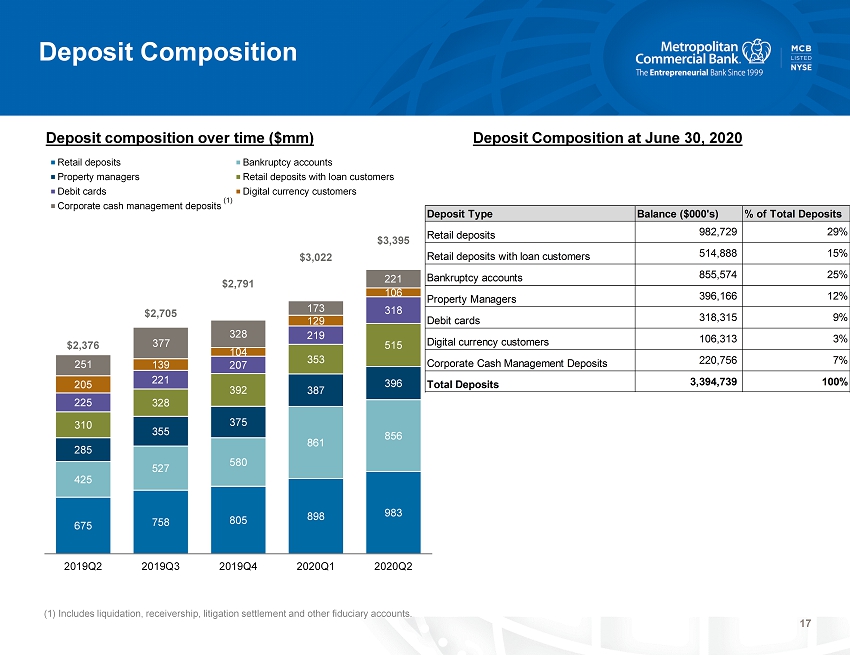
17 Deposit Composition (1) Includes liquidation, receivership, litigation settlement and other fiduciary accounts. $2,376 $2,705 $2,791 $3,022 $3,395 675 758 805 898 983 425 527 580 861 856 285 355 375 387 396 310 328 392 353 515 225 221 207 219 318 205 139 104 129 106 251 377 328 173 221 2019Q2 2019Q3 2019Q4 2020Q1 2020Q2 Retail deposits Bankruptcy accounts Property managers Retail deposits with loan customers Debit cards Digital currency customers Corporate cash management deposits (1) Deposit Composition at June 30, 2020 Deposit composition over time ($mm) Deposit Type Balance ($000's) % of Total Deposits Retail deposits 982,729 29% Retail deposits with loan customers 514,888 15% Bankruptcy accounts 855,574 25% Property Managers 396,166 12% Debit cards 318,315 9% Digital currency customers 106,313 3% Corporate Cash Management Deposits 220,756 7% Total Deposits 3,394,739 100%
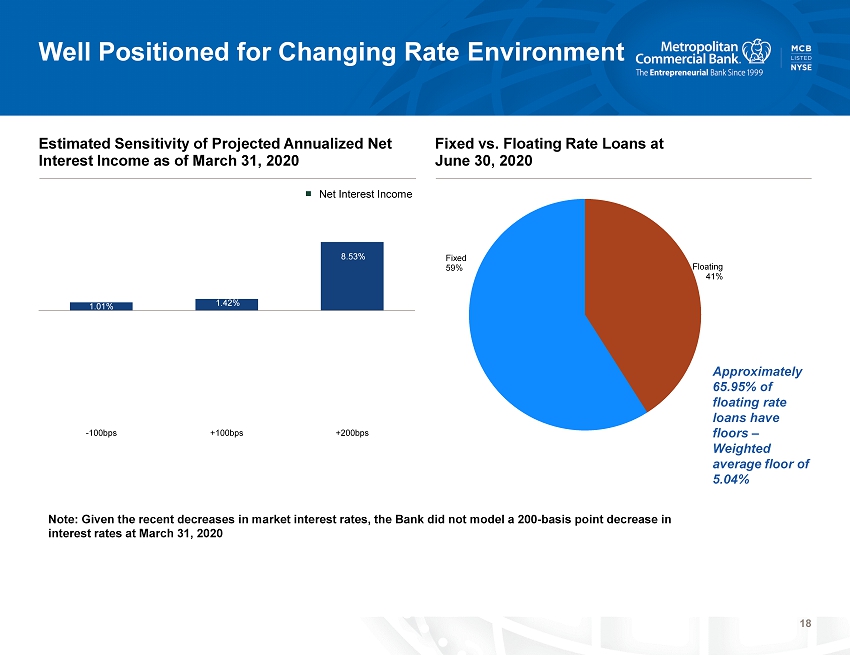
18 Well Positioned for Changing Rate Environment Estimated Sensitivity of Projected Annualized Net Interest Income as of March 31, 2020 Fixed vs. Floating Rate Loans at June 30, 2020 1.01% 1.42% 8.53% -100bps +100bps +200bps Floating 41% Fixed 59% Approximately 65.95% of floating rate loans have floors – Weighted average floor of 5.04% ■ Net Interest Income Note: Given the recent decreases in market interest rates, the Bank did not model a 200 - basis point decrease in interest rates at March 31, 2020

19 Outlook: Loan and Deposit growth, Margin Expansion, Operating Leverage Loan Growth Core Deposit Funding Performance ▪ Maintain a diversified commercial real estate portfolio ▪ Maintain CRE concentration below our internal limits ▪ Capture market share from larger competitors through differentiated service ▪ Corporate Cash Management relationships ▪ Support development of retail banking franchise ▪ Existing relationships ▪ Consider new retail banking centers ▪ Continue to provide cash management service to digital currency related clients ▪ Expand debit card issuing business to generate additional low - cost core deposits and fee income ▪ Future initiatives: Introduce merchant acquiring services and correspondent banking services ▪ Expect future profitability to be driven by organic growth ▪ Growth: Demonstrated ability to capture market share ▪ Rate benefit: Low cost, core deposits funding short duration assets ▪ Our growth initiatives will yield enhanced profitability and value to the MCB franchise. Balance Sheet Growth = Long - Term Profitable Relationships

20 Appendix
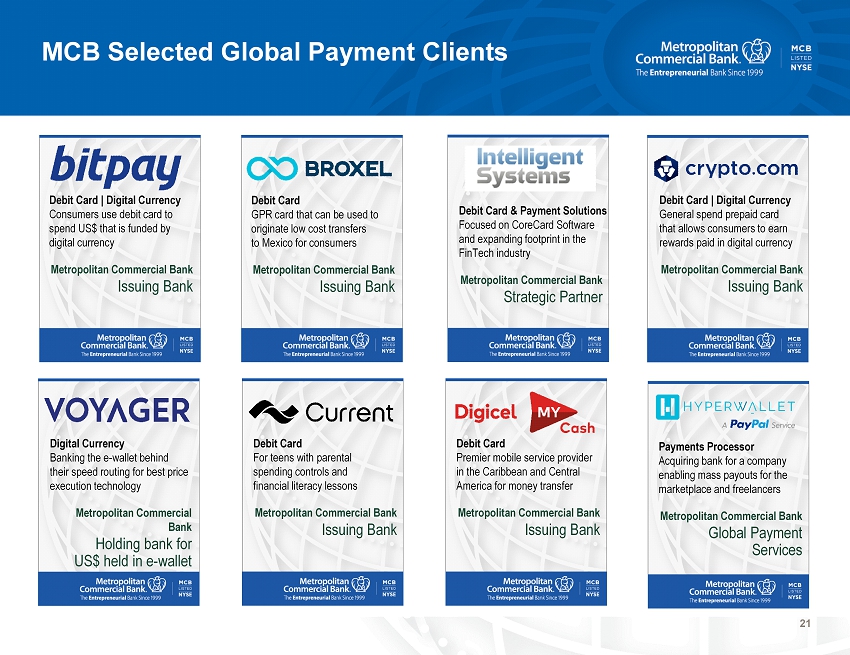
21 MCB Selected Global Payment Clients Debit Card For teens with parental spending controls and financial literacy lessons Metropolitan Commercial Bank Issuing Bank Debit Card Premier mobile service provider in the Caribbean and Central America for money transfer Metropolitan Commercial Bank Issuing Bank Debit Card | Digital Currency General spend prepaid card that allows consumers to earn rewards paid in digital currency Metropolitan Commercial Bank Issuing Bank Debit Card GPR card that can be used to originate low cost transfers to Mexico for consumers Metropolitan Commercial Bank Issuing Bank Debit Card | Digital Currency Consumers use debit card to spend US$ that is funded by digital currency Metropolitan Commercial Bank Issuing Bank Payments Processor Acquiring bank for a company enabling mass payouts for the marketplace and freelancers Metropolitan Commercial Bank Global Payment Services Digital Currency Banking the e - wallet behind their speed routing for best price execution technology Metropolitan Commercial Bank Holding bank for US$ held in e - wallet Debit Card & Payment Solutions Focused on CoreCard Software and expanding footprint in the FinTech industry Metropolitan Commercial Bank Strategic Partner

22 MCB Selected Global Payment Clients Debit Card Issuer of debit cards linked to margin accounts for the largest U.S. electronic brokerage firm Metropolitan Commercial Bank Issuing Bank Payments Platform Providing global payment services via banking relationships throughout the world Metropolitan Commercial Bank Global payment services Debit Card General Purpose Reloadable cards and remittance products using the Univision card Metropolitan Commercial Bank Acquiring Bank for Cross Border Payments Payments Processor Digital check cashing and payment services Metropolitan Commercial Bank Sponsor Bank Deposit relationships for settlement and operating accounts. Cash management services Metropolitan Commercial Bank Money Transfer Company Acquiring bank enabling money transfers domestically and cross border Metropolitan Commercial Bank Global payment services