Attached files
| file | filename |
|---|---|
| EX-99.3 - EXHIBIT 99.3 - KEYCORP /NEW/ | a2q20erex993.htm |
| EX-99.1 - EXHIBIT 99.1 - KEYCORP /NEW/ | a2q20earningsrelease.htm |
| 8-K - 8-K - KEYCORP /NEW/ | a2q20er8-k.htm |
KeyCorp Second Quarter 2020 Earnings Review July 22, 2020 Chris Gorman Don Kimble Chairman and Vice Chairman and Chief Executive Officer Chief Financial Officer
FORWARD-LOOKING STATEMENTS AND ADDITIONAL INFORMATION This communication contains forward-looking statements within the meaning of the Private Securities Litigation Reform Act of 1995 including, but not limited to, KeyCorp’s expectations or predictions of future financial or business performance or conditions. Forward-looking statements are typically identified by words such as “believe,” “seek,” “expect,” “anticipate,” “intend,” “target,” “estimate,” “continue,” “positions,” “plan,” “predict,” “project,” “forecast,” “guidance,” “goal,” “objective,” “prospects,” “possible,” “potential,” “strategy,” “opportunities,” or “trends,” by future conditional verbs such as “assume,” “will,” “would,” “should,” “could” or “may”, or by variations of such words or by similar expressions. These forward-looking statements are based on assumptions that involve risks and uncertainties, which are subject to change based on various important factors (some of which are beyond KeyCorp’s control.) Actual results may differ materially from current projections. Actual outcomes may differ materially from those expressed or implied as a result of the factors described under “Forward-looking Statements” and “Risk Factors” in KeyCorp’s Annual Report on Form 10-K for the year ended December 31, 2019 and in other filings of KeyCorp with the Securities and Exchange Commission (the “SEC”). In addition to the aforementioned factors, the COVID-19 global pandemic is adversely affecting us, our clients, and our third-party service providers, among others, and its impact may adversely affect our business and results of operations over a period of time. Risks related to COVID-19 are more fully described under “Risk Factors” in KeyCorp’s Quarterly Report on Form 10-Q for the quarter ended March 31, 2020. Such forward-looking statements speak only as of the date they are made, and we undertake no obligation to update any forward- looking statement to reflect events or circumstances after that date or to reflect the occurrence of unanticipated events. For additional information regarding KeyCorp, please refer to our SEC filings available at www.key.com/ir . Annualized, pro forma, projected and estimated numbers are used for illustrative purpose only, are not forecasts and may not reflect actual results. This presentation also includes certain non-GAAP financial measures related to “tangible common equity,” “cash efficiency ratio,” “pre-provision net revenue,” and certain financial measures excluding notable items. Notable items include certain revenue or expense items that may occur in a reporting period in which management does not consider indicative of ongoing financial performance. Management believes it is useful for the investment community to consider financial metrics with and without notable items in order to enable a better understanding of company results, facilitate comparability of period-to-period financial results, and to evaluate and forecast those results. Although Key has procedures in place to ensure that these measures are calculated using the appropriate GAAP or regulatory components, they have limitations as analytical tools and should not be considered in isolation, or as a substitute for analysis of results under GAAP. For more information on these calculations and to view the reconciliations to the most comparable GAAP measures, please refer to the appendix of this presentation, or page 44 of our Form 10-Q dated March 31, 2020. GAAP: Generally Accepted Accounting Principles 2
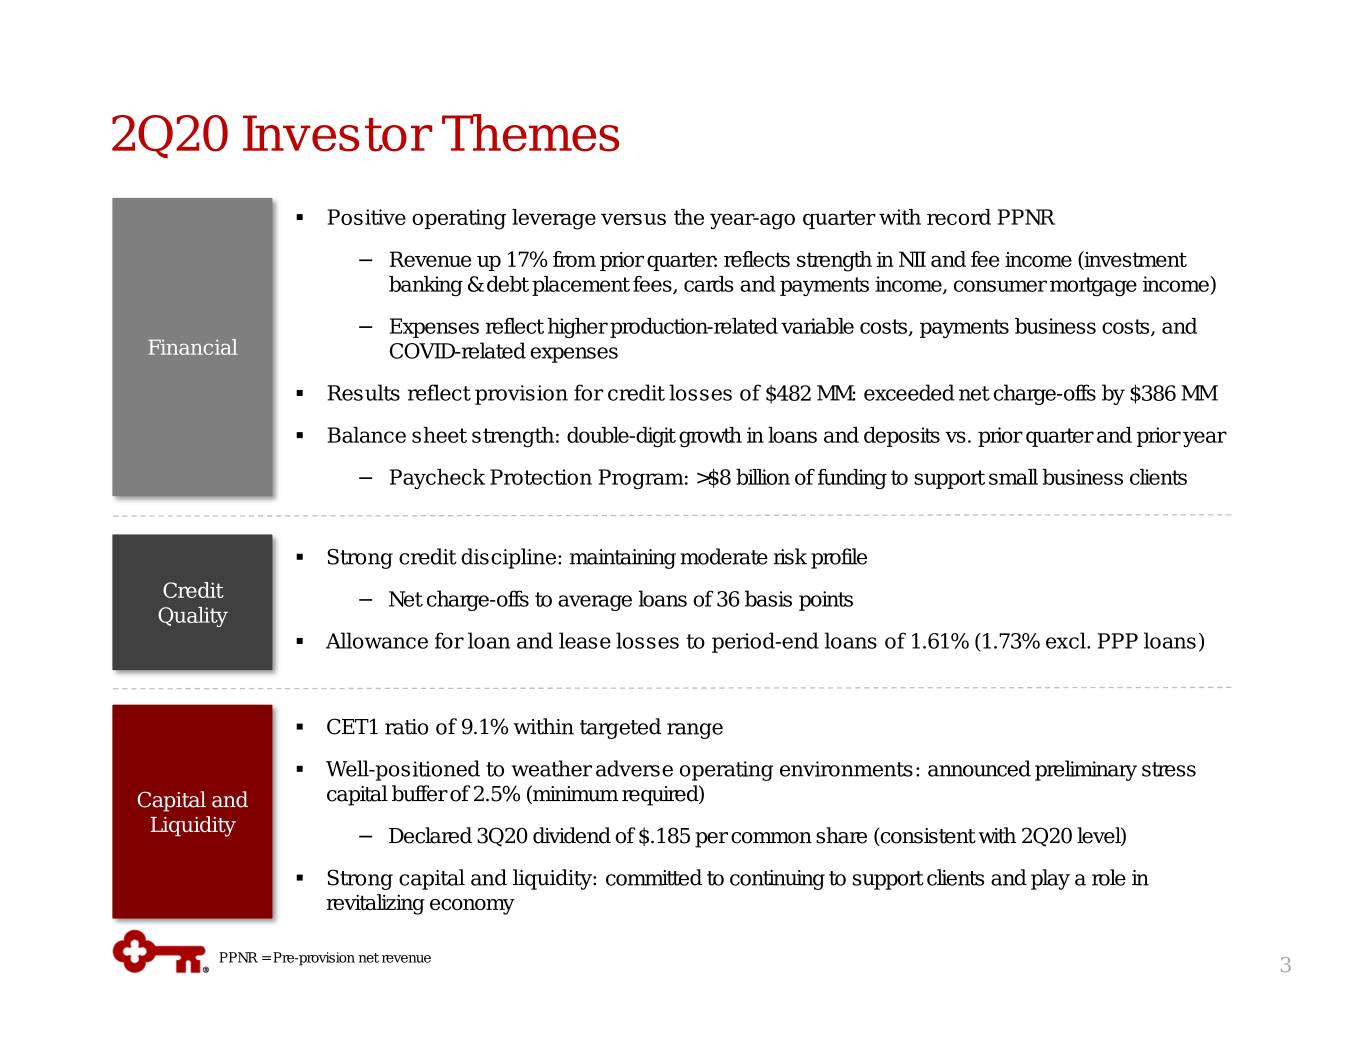
2Q20 Investor Themes . Positive operating leverage versus the year-ago quarter with record PPNR − Revenue up 17% from prior quarter: reflects strength in NII and fee income (investment banking & debt placement fees, cards and payments income, consumer mortgage income) − Expenses reflect higher production-related variable costs, payments business costs, and Financial COVID-related expenses . Results reflect provision for credit losses of $482 MM: exceeded net charge-offs by $386 MM . Balance sheet strength: double-digit growth in loans and deposits vs. prior quarter and prior year − Paycheck Protection Program: >$8 billion of funding to support small business clients . Strong credit discipline: maintaining moderate risk profile Credit − Net charge-offs to average loans of 36 basis points Quality . Allowance for loan and lease losses to period-end loans of 1.61% (1.73% excl. PPP loans) . CET1 ratio of 9.1% within targeted range . Well-positioned to weather adverse operating environments: announced preliminary stress Capital and capital buffer of 2.5% (minimum required) Liquidity − Declared 3Q20 dividend of $.185 per common share (consistent with 2Q20 level) . Strong capital and liquidity: committed to continuing to support clients and play a role in revitalizing economy PPNR = Pre-provision net revenue 3

Financial Review 4

Financial Highlights Continuing operations, unless otherwise noted 2Q20 1Q20 2Q19 LQ ∆ Y/Y ∆ EPS – assuming dilution $ .16 $ .12 $ .40 33.3 % (60.0) % Cash efficiency ratio (a) 57.9 % 62.3 % 61.9 % (440) bps (394) bps (a) Profitability Return on average tangible common equity 5.0 3.8 13.7 114 (873) Return on average total assets .45 .40 1.19 5 (74) Net interest margin 2.76 3.01 3.06 (25) (30) Common Equity Tier 1 (b) 9.1 % 8.9 % 9.6 % 20 bps (50) bps Capital Tier 1 risk-based capital (b) 10.4 10.2 11.0 22 (58) Tangible common equity to tangible assets (a) 7.6 8.3 8.6 (65) (98) NCOs to average loans .36 % .35 % .29 % 1 bps 7 bps Asset NPLs to EOP portfolio loans .72 .61 .61 11 11 Quality Allowance for loan and lease losses to EOP loans 1.61 1.32 .97 29 64 EOP = End of Period (a) Non-GAAP measure: see Appendix for reconciliations 5 (b) 6/30/20 ratios are estimated
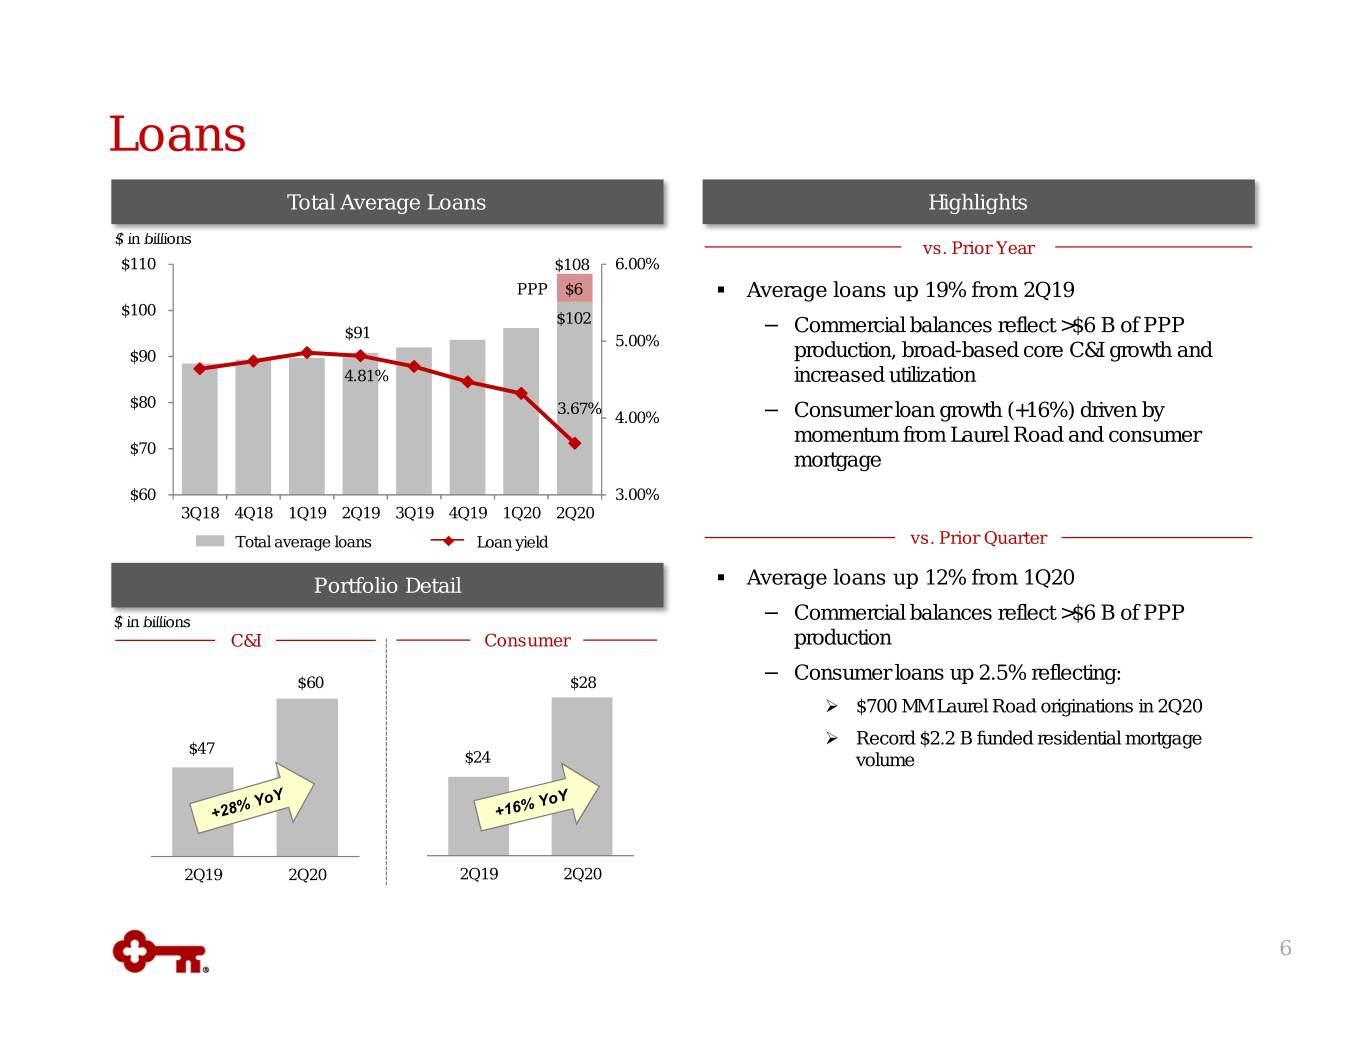
Loans Total Average Loans Highlights $ in billions vs. Prior Year $110 $108 6.00% PPP $6 . Average loans up 19% from 2Q19 $100 $102 $91 − Commercial balances reflect >$6 B of PPP 5.00% $90 production, broad-based core C&I growth and 4.81% increased utilization $80 3.67% 4.00% − Consumer loan growth (+16%) driven by momentum from Laurel Road and consumer $70 mortgage $60 3.00% 3Q18 4Q18 1Q19 2Q19 3Q19 4Q19 1Q20 2Q20 Total average loans Loan yield vs. Prior Quarter Portfolio Detail . Average loans up 12% from 1Q20 $ in billions − Commercial balances reflect >$6 B of PPP C&I Consumer production $60 $28 − Consumer loans up 2.5% reflecting: $700 MM Laurel Road originations in 2Q20 Record $2.2 B funded residential mortgage $47 $24 volume 2Q19 2Q20 2Q19 2Q20 6
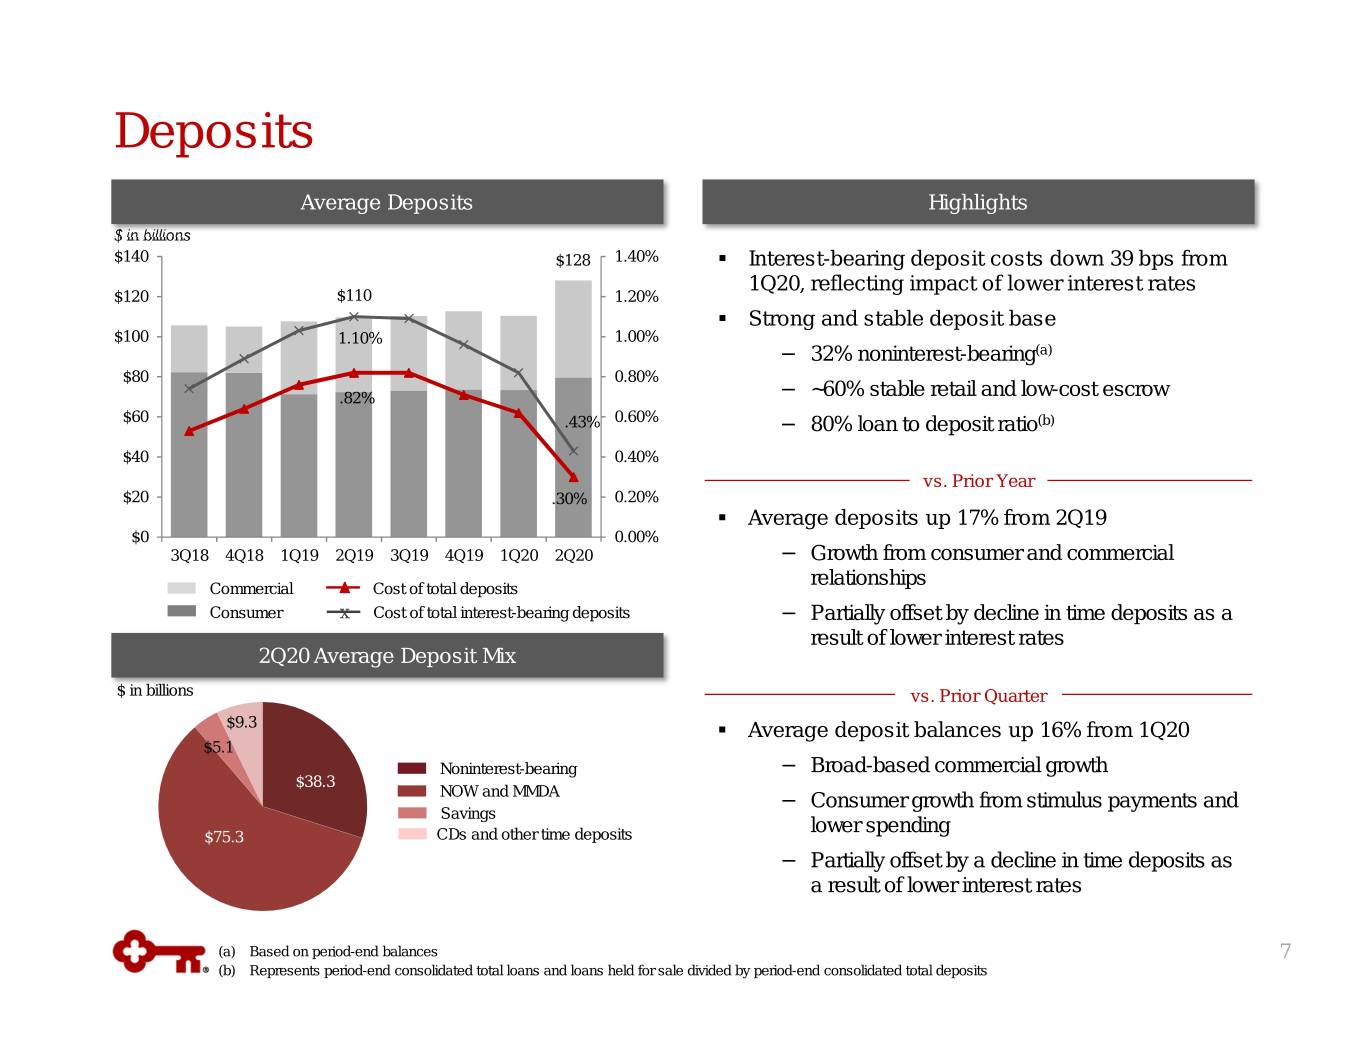
Deposits Average Deposits Highlights $ in billions $140 $128 1.40% . Interest-bearing deposit costs down 39 bps from 1Q20, reflecting impact of lower interest rates $120 $110 1.20% . Strong and stable deposit base $100 1.10% 1.00% − 32% noninterest-bearing (a) $80 0.80%34% .82% − ~60% stable retail and low-cost escrow $60 .43% 0.60% − 80% loan to deposit ratio (b) $40 0.40% vs. Prior Year $20 .30% 0.20% . Average deposits up 17% from 2Q19 $0 0.00% 3Q18 4Q18 1Q19 2Q19 3Q19 4Q19 1Q20 2Q20 − Growth from consumer and commercial relationships Commercial Cost of total deposits Consumer x Cost of total interest-bearing deposits − Partially offset by decline in time deposits as a result of lower interest rates 2Q20 Average Deposit Mix $ in billions vs. Prior Quarter $9.3 . Average deposit balances up 16% from 1Q20 $5.1 Noninterest-bearing − Broad-based commercial growth $38.3 NOW and MMDA − Consumer growth from stimulus payments and Savings lower spending $75.3 CDs and other time deposits − Partially offset by a decline in time deposits as a result of lower interest rates (a) Based on period-end balances 7 (b) Represents period-end consolidated total loans and loans held for sale divided by period-end consolidated total deposits
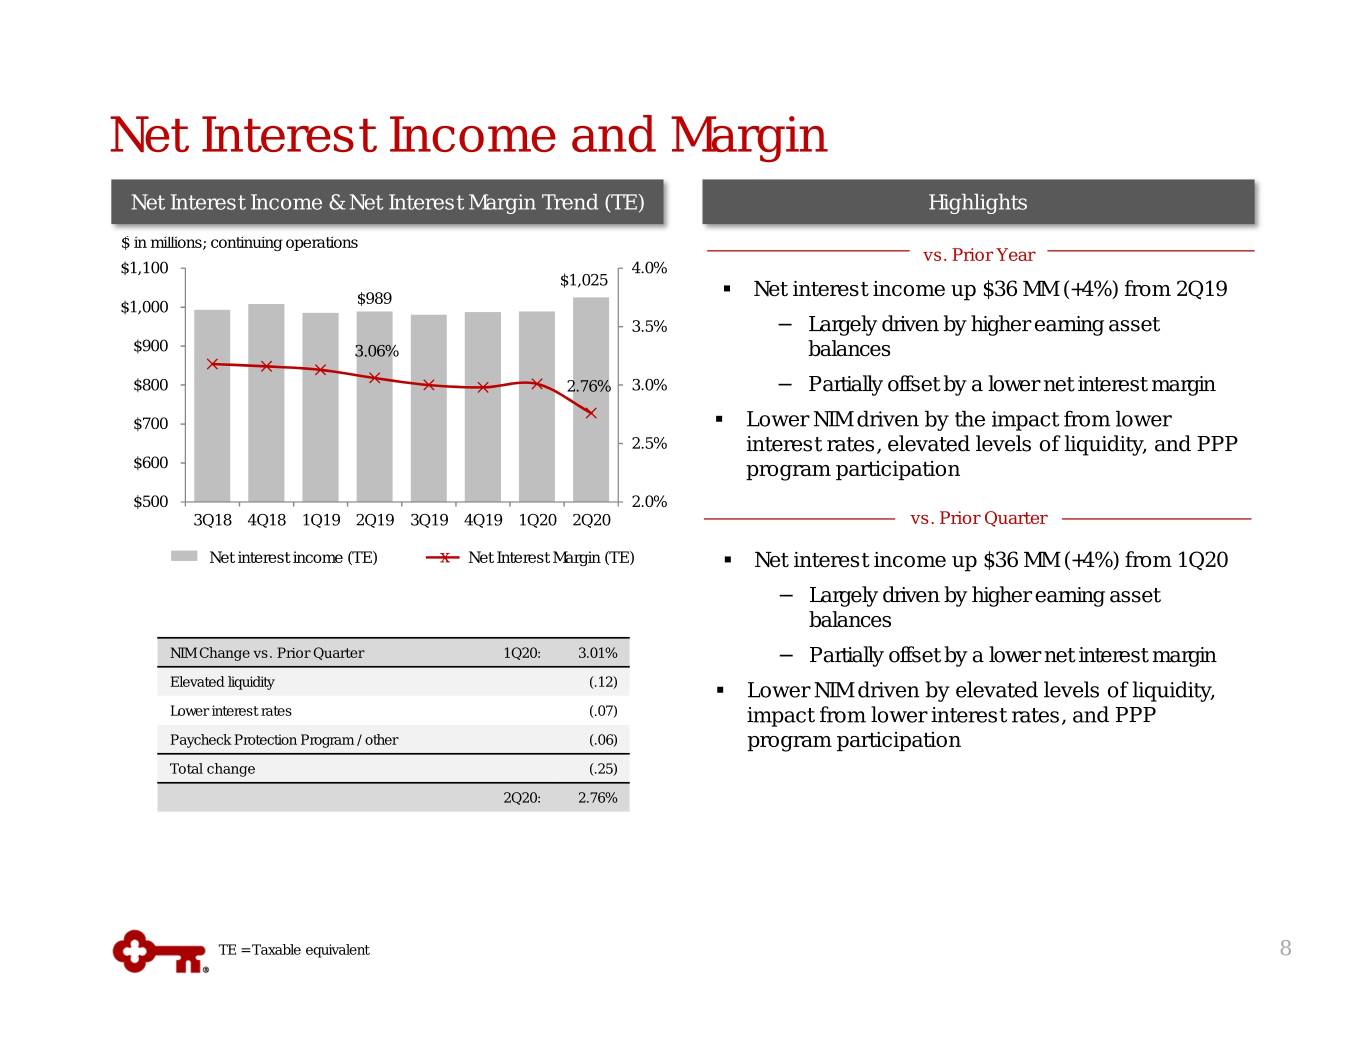
Net Interest Income and Margin Net Interest Income & Net Interest Margin Trend (TE) Highlights $ in millions; continuing operations vs. Prior Year $1,100 4.0% $1,025 $989 . Net interest income up $36 MM (+4%) from 2Q19 $1,000 3.5% − Largely driven by higher earning asset $900 3.06% balances $800 2.76% 3.0% − Partially offset by a lower net interest margin $700 . Lower NIM driven by the impact from lower 2.5% interest rates, elevated levels of liquidity, and PPP $600 program participation $500 2.0% 3Q18 4Q18 1Q19 2Q19 3Q19 4Q19 1Q20 2Q20 vs. Prior Quarter Net interest income (TE)x Net Interest Margin (TE) . Net interest income up $36 MM (+4%) from 1Q20 − Largely driven by higher earning asset balances NIM Change vs. Prior Quarter 1Q20: 3.01% − Partially offset by a lower net interest margin Elevated liquidity (.12) . Lower NIM driven by elevated levels of liquidity, Lower interest rates (.07) impact from lower interest rates, and PPP Paycheck Protection Program / other (.06) program participation Total change (.25) 2Q20: 2.76% TE = Taxable equivalent 8
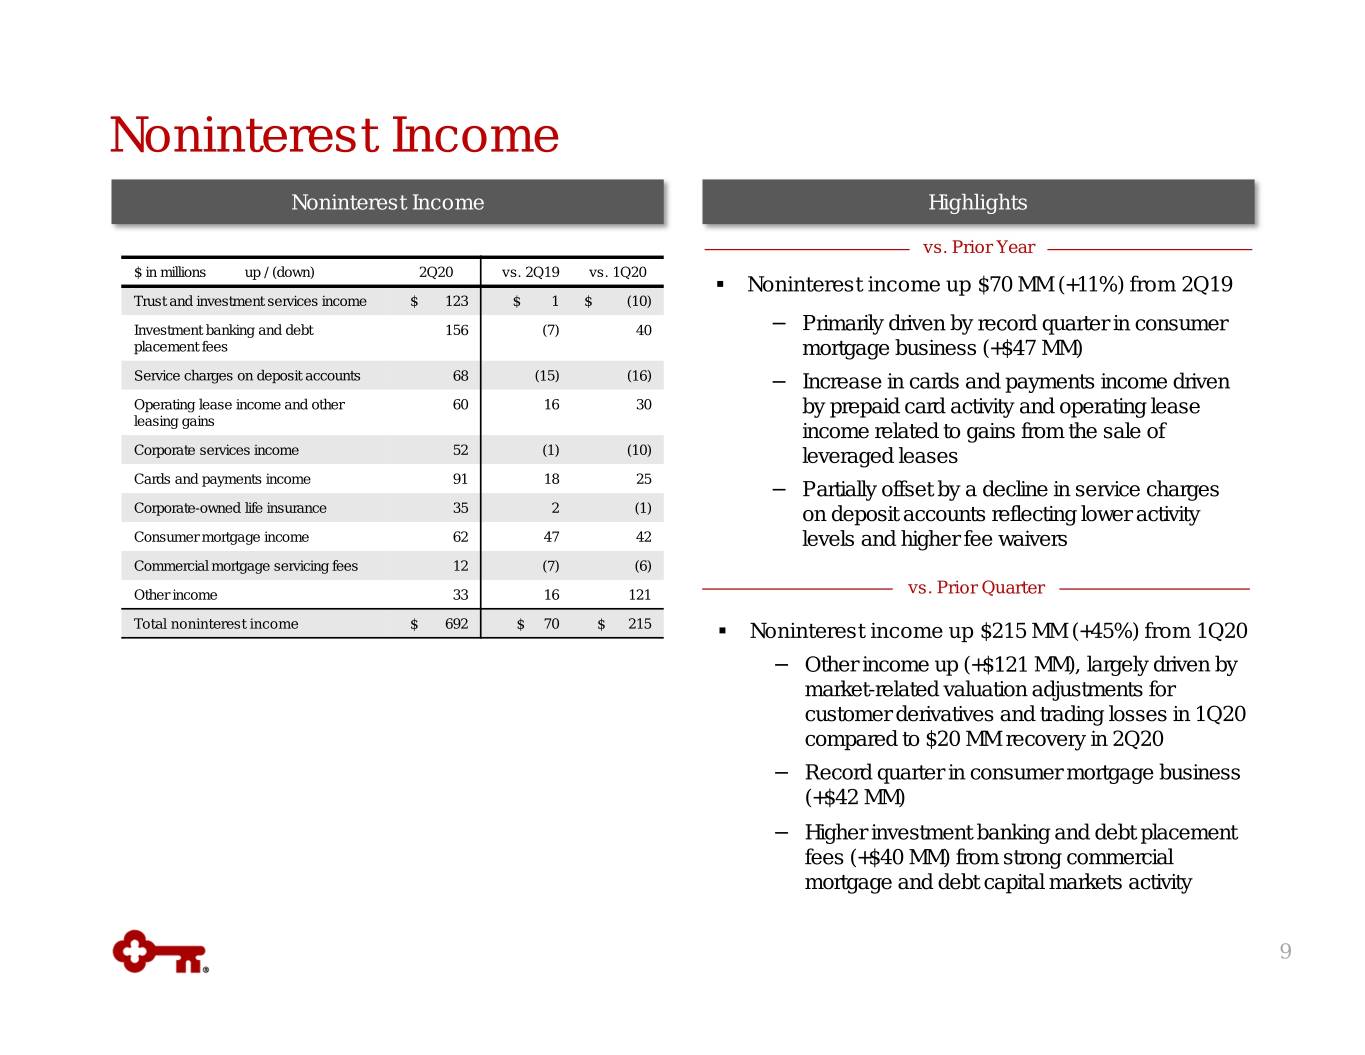
Noninterest Income Noninterest Income Highlights vs. Prior Year $ in millions up / (down) 2Q20 vs. 2Q19 vs. 1Q20 . Noninterest income up $70 MM (+11%) from 2Q19 Trust and investment services income $ 123 $ 1 $ (10) Investment banking and debt 156 (7) 40 − Primarily driven by record quarter in consumer placement fees mortgage business (+$47 MM) Service charges on deposit accounts 68 (15) (16) − Increase in cards and payments income driven Operating lease income and other 60 16 30 by prepaid card activity and operating lease leasing gains income related to gains from the sale of Corporate services income 52 (1) (10) leveraged leases Cards and payments income 91 18 25 − Partially offset by a decline in service charges Corporate-owned life insurance 35 2 (1) on deposit accounts reflecting lower activity Consumer mortgage income 62 47 42 levels and higher fee waivers Commercial mortgage servicing fees 12 (7) (6) Other income 33 16 121 vs. Prior Quarter Total noninterest income $ 692 $ 70 $ 215 . Noninterest income up $215 MM (+45%) from 1Q20 − Other income up (+$121 MM), largely driven by market-related valuation adjustments for customer derivatives and trading losses in 1Q20 compared to $20 MM recovery in 2Q20 − Record quarter in consumer mortgage business (+$42 MM) − Higher investment banking and debt placement fees (+$40 MM) from strong commercial mortgage and debt capital markets activity 9
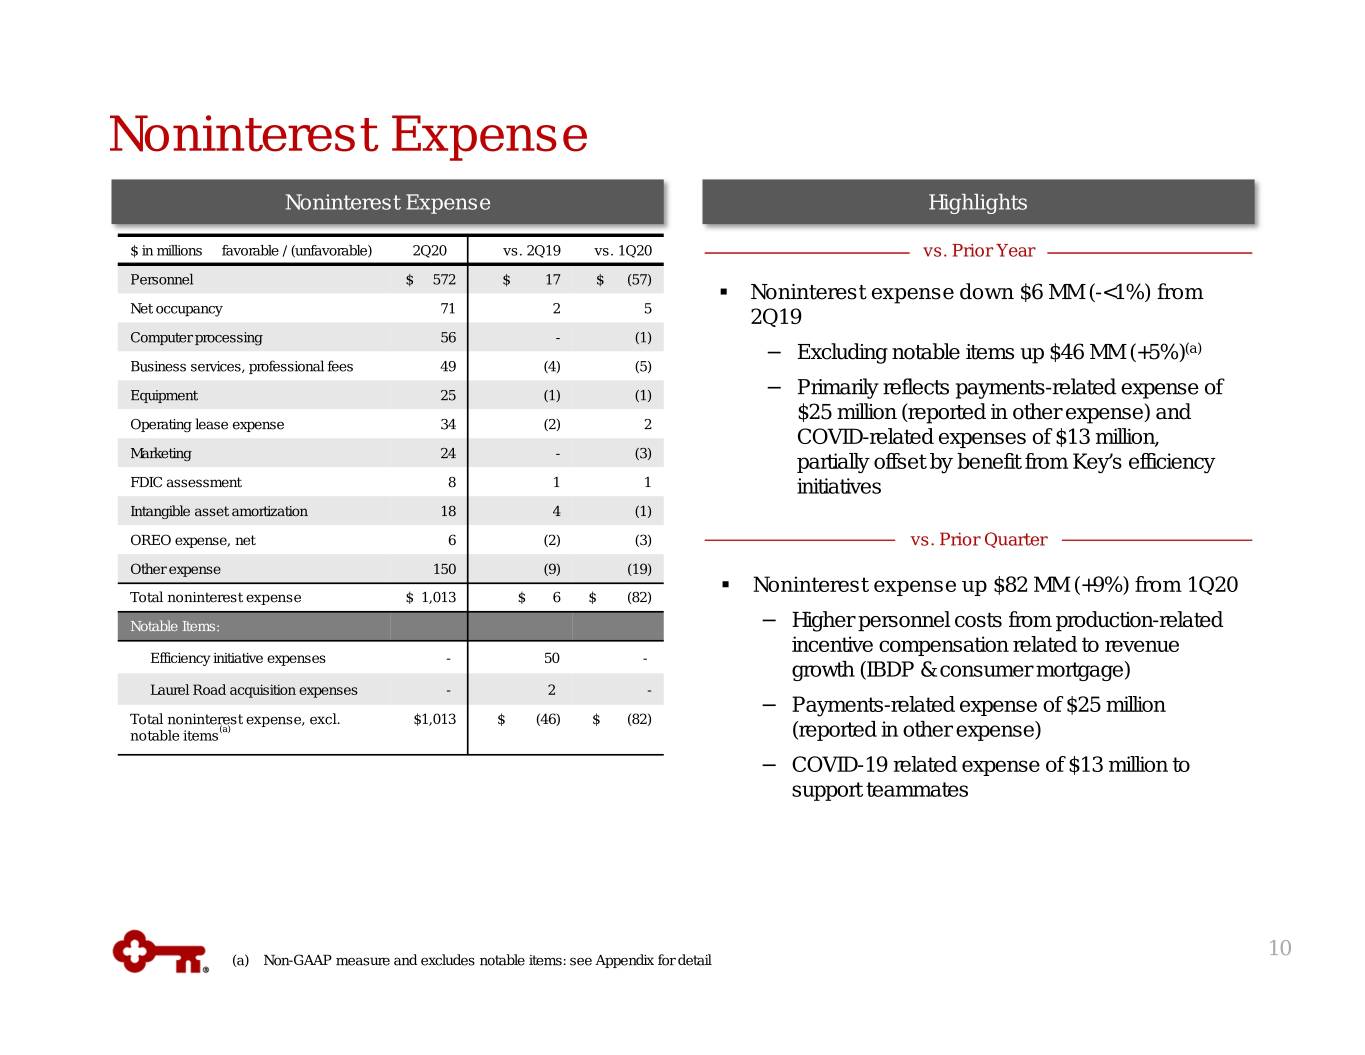
Noninterest Expense Noninterest Expense Highlights $ in millions favorable / (unfavorable) 2Q20 vs. 2Q19 vs. 1Q20 vs. Prior Year Personnel $ 572 $ 17 $ (57) . Noninterest expense down $6 MM (-<1%) from Net occupancy 71 2 5 2Q19 Computer processing 56 - (1) − Excluding notable items up $46 MM (+5%) (a) Business services, professional fees 49 (4) (5) Equipment 25 (1) (1) − Primarily reflects payments-related expense of $25 million (reported in other expense) and Operating lease expense 34 (2) 2 COVID-related expenses of $13 million, Marketing 24 - (3) partially offset by benefit from Key’s efficiency FDICassessment 8 1 1 initiatives Intangible asset amortization 18 4 (1) OREO expense, net 6 (2) (3) vs. Prior Quarter Other expense 150 (9) (19) . Noninterest expense up $82 MM (+9%) from 1Q20 Total noninterest expense $ 1,013 $ 6 $ (82) Notable Items: − Higher personnel costs from production-related incentive compensation related to revenue Efficiency initiative expenses - 50 - growth (IBDP & consumer mortgage) Laurel Road acquisition expenses - 2 - − Payments-related expense of $25 million Total noninterest expense, excl. $1,013 $ (46) $ (82) (a) notable items (reported in other expense) − COVID-19 related expense of $13 million to support teammates 10 (a) Non-GAAP measure and excludes notable items: see Appendix for detail
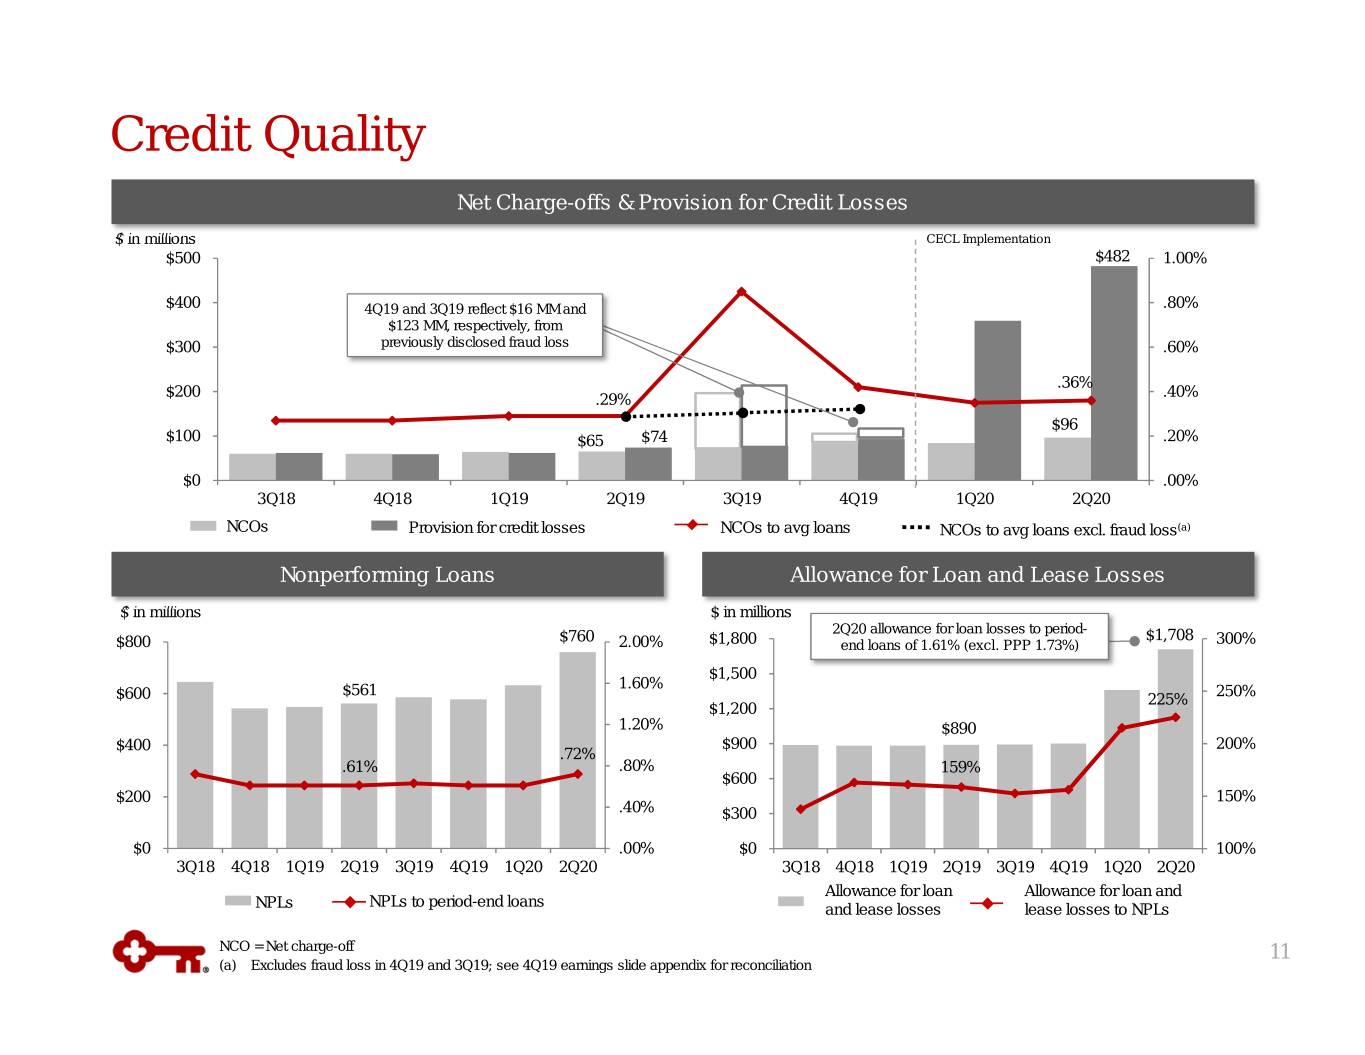
Credit Quality Net Charge-offs & Provision for Credit Losses $ in millions CECL Implementation $500 $482 1.00% $400 4Q19 and 3Q19 reflect $16 MM and .80% $123 MM, respectively, from $300 previously disclosed fraud loss .60% .36% $200 .40% .29% $96 $100 $65 $74 .20% $0 .00% 3Q18 4Q18 1Q19 2Q19 3Q19 4Q19 1Q20 2Q20 NCOs Provision for credit losses NCOs to avg loans NCOs to avg loans excl. fraud loss (a) Nonperforming Loans Allowance for Loan and Lease Losses $ in millions $ in millions $760 2Q20 allowance for loan losses to period- $1,708 $800 2.00% $1,800 end loans of 1.61% (excl. PPP 1.73%) 300% $1,500 1.60% $561 250% $600 225% $1,200 1.20% $890 $400 $900 200% .72% .61% .80% 159% $600 $200 150% .40% $300 $0 .00% $0 100% 3Q18 4Q18 1Q19 2Q19 3Q19 4Q19 1Q20 2Q20 3Q18 4Q18 1Q19 2Q19 3Q19 4Q19 1Q20 2Q20 Allowance for loan Allowance for loan and NPLs to period-end loans NPLs and lease losses lease losses to NPLs NCO = Net charge-off 11 (a) Excludes fraud loss in 4Q19 and 3Q19; see 4Q19 earnings slide appendix for reconciliation
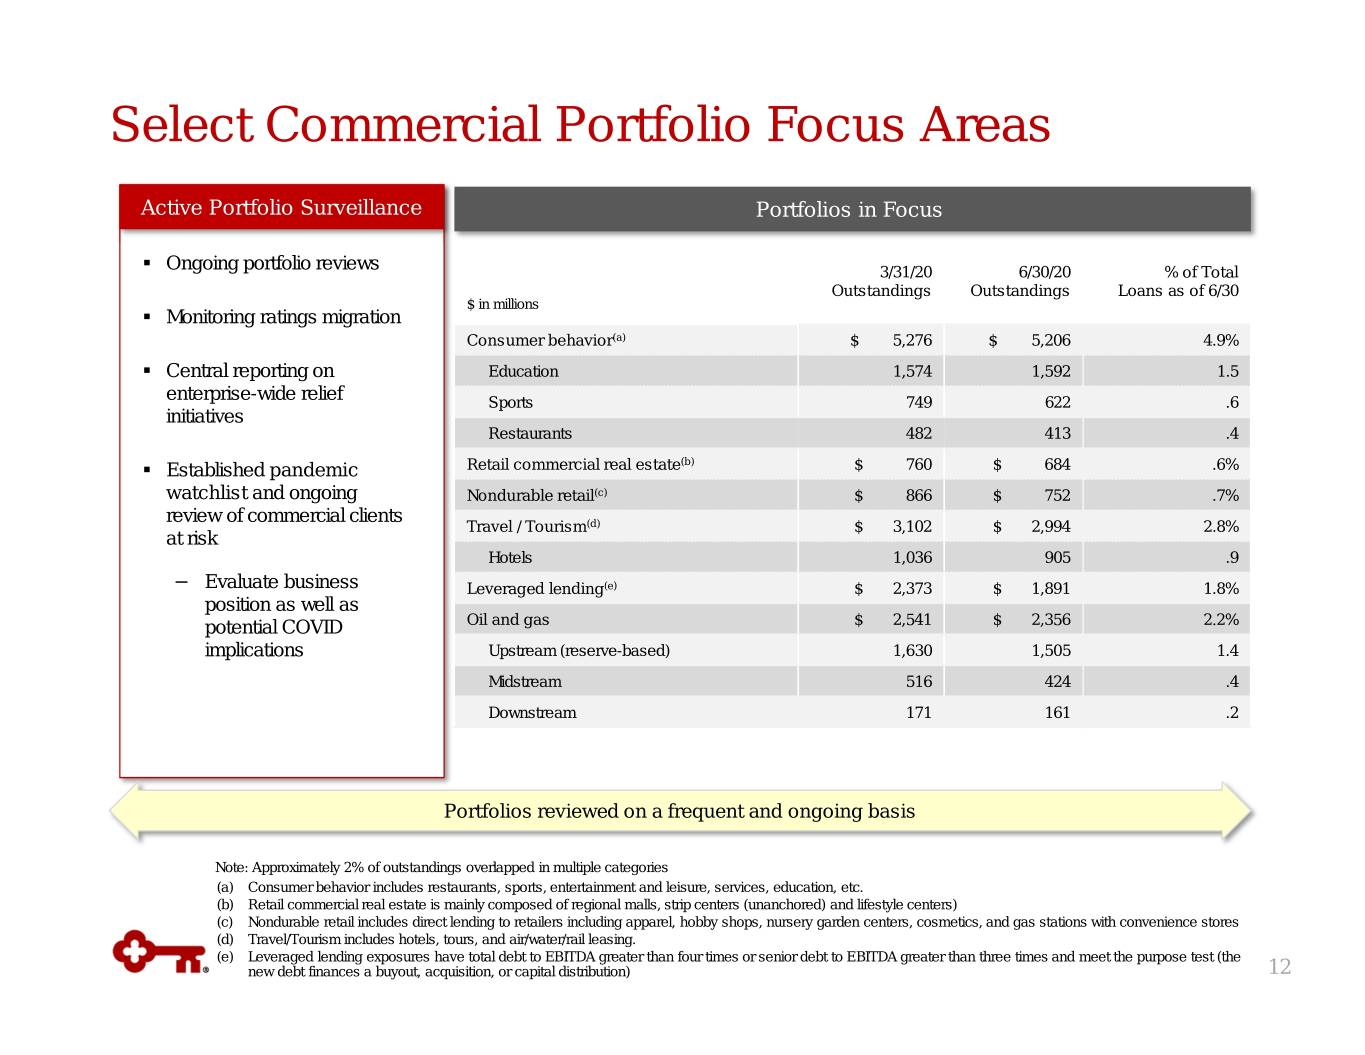
Select Commercial Portfolio Focus Areas Active Portfolio Surveillance Portfolios in Focus . Ongoing portfolio reviews 3/31/20 6/30/20 % of Total Outstandings Outstandings Loans as of 6/30 $ in millions . Monitoring ratings migration Consumer behavior (a) $ 5,276 $ 5,206 4.9% . Central reporting on Education 1,574 1,592 1.5 enterprise-wide relief Sports 749 622 .6 initiatives Restaurants 482 413 .4 . Established pandemic Retail commercial real estate (b) $ 760 $ 684 .6% watchlist and ongoing Nondurable retail (c) $ 866 $ 752 .7% review of commercial clients Travel / Tourism (d) $ 3,102 $ 2,994 2.8% at risk Hotels 1,036 905 .9 − Evaluate business Leveraged lending (e) $ 2,373 $ 1,891 1.8% position as well as potential COVID Oil and gas $ 2,541 $ 2,356 2.2% implications Upstream (reserve-based) 1,630 1,505 1.4 Midstream 516 424 .4 Downstream 171 161 .2 Portfolios reviewed on a frequent and ongoing basis Note: Approximately 2% of outstandings overlapped in multiple categories (a) Consumer behavior includes restaurants, sports, entertainment and leisure, services, education, etc. (b) Retail commercial real estate is mainly composed of regional malls, strip centers (unanchored) and lifestyle centers) (c) Nondurable retail includes direct lending to retailers including apparel, hobby shops, nursery garden centers, cosmetics, and gas stations with convenience stores (d) Travel/Tourism includes hotels, tours, and air/water/rail leasing. (e) Leveraged lending exposures have total debt to EBITDA greater than four times or senior debt to EBITDA greater than three times and meet the purpose test (the new debt finances a buyout, acquisition, or capital distribution) 12
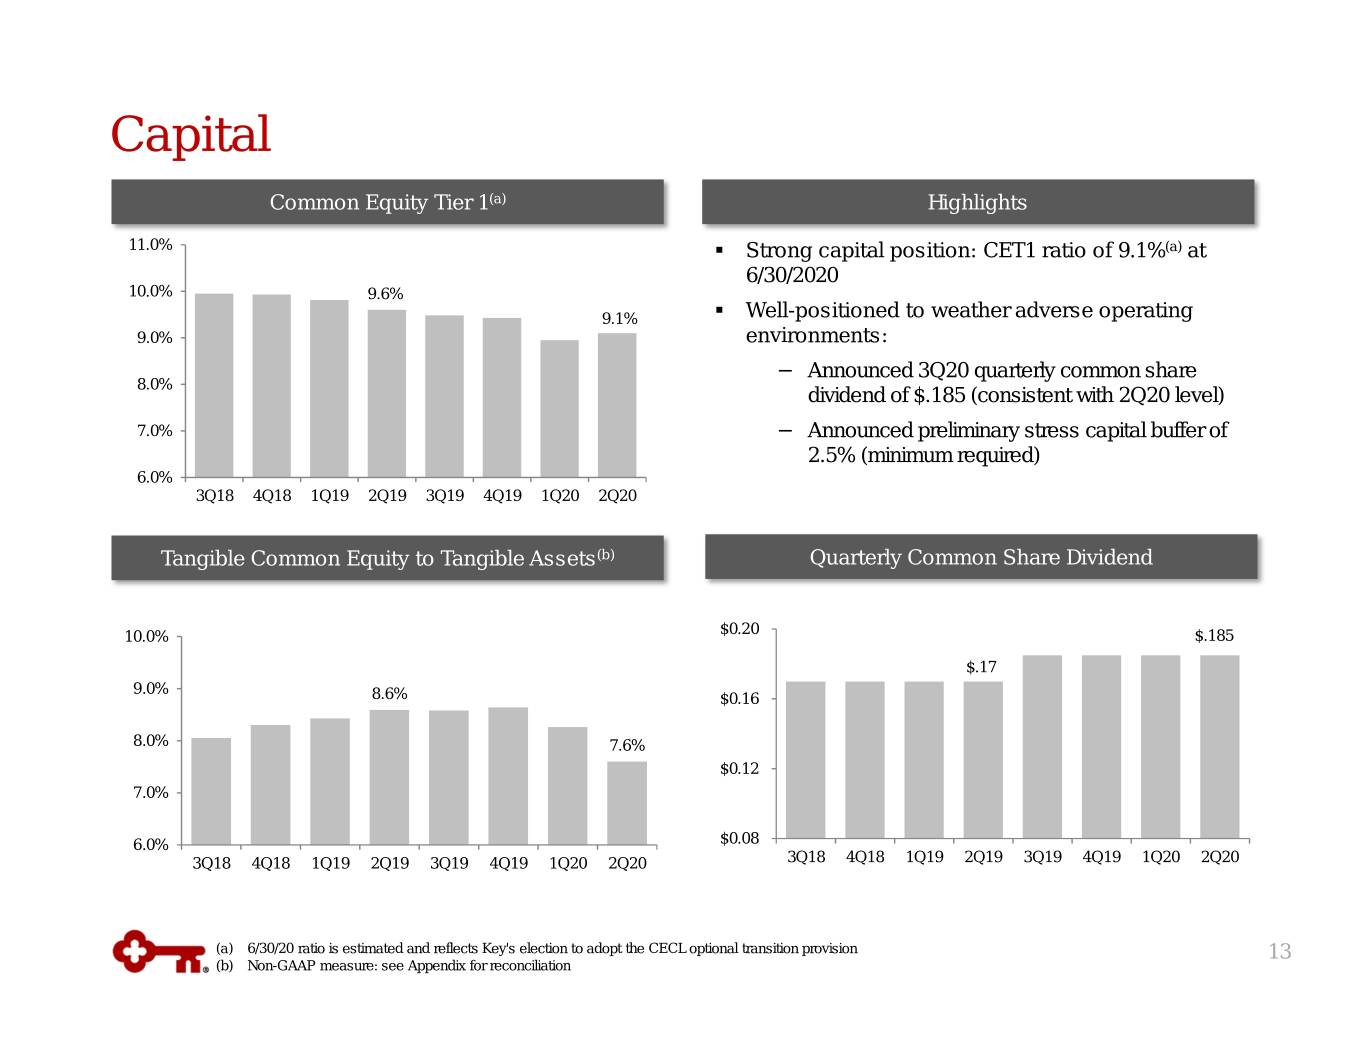
Capital Common Equity Tier 1 (a) Highlights 11.0% . Strong capital position: CET1 ratio of 9.1% (a) at 6/30/2020 10.0% 9.6% 9.1% . Well-positioned to weather adverse operating 9.0% environments: − Announced 3Q20 quarterly common share 8.0% dividend of $.185 (consistent with 2Q20 level) 7.0% − Announced preliminary stress capital buffer of 2.5% (minimum required) 6.0% 3Q18 4Q18 1Q19 2Q19 3Q19 4Q19 1Q20 2Q20 Tangible Common Equity to Tangible Assets (b) Quarterly Common Share Dividend 10.0% $0.20 $.185 $.17 9.0% 8.6% $0.16 8.0% 7.6% $0.12 7.0% 6.0% $0.08 3Q18 4Q18 1Q19 2Q19 3Q19 4Q19 1Q20 2Q20 3Q18 4Q18 1Q19 2Q19 3Q19 4Q19 1Q20 2Q20 (a) 6/30/20 ratio is estimated and reflects Key's election to adopt the CECL optional transition provision 13 (b) Non-GAAP measure: see Appendix for reconciliation
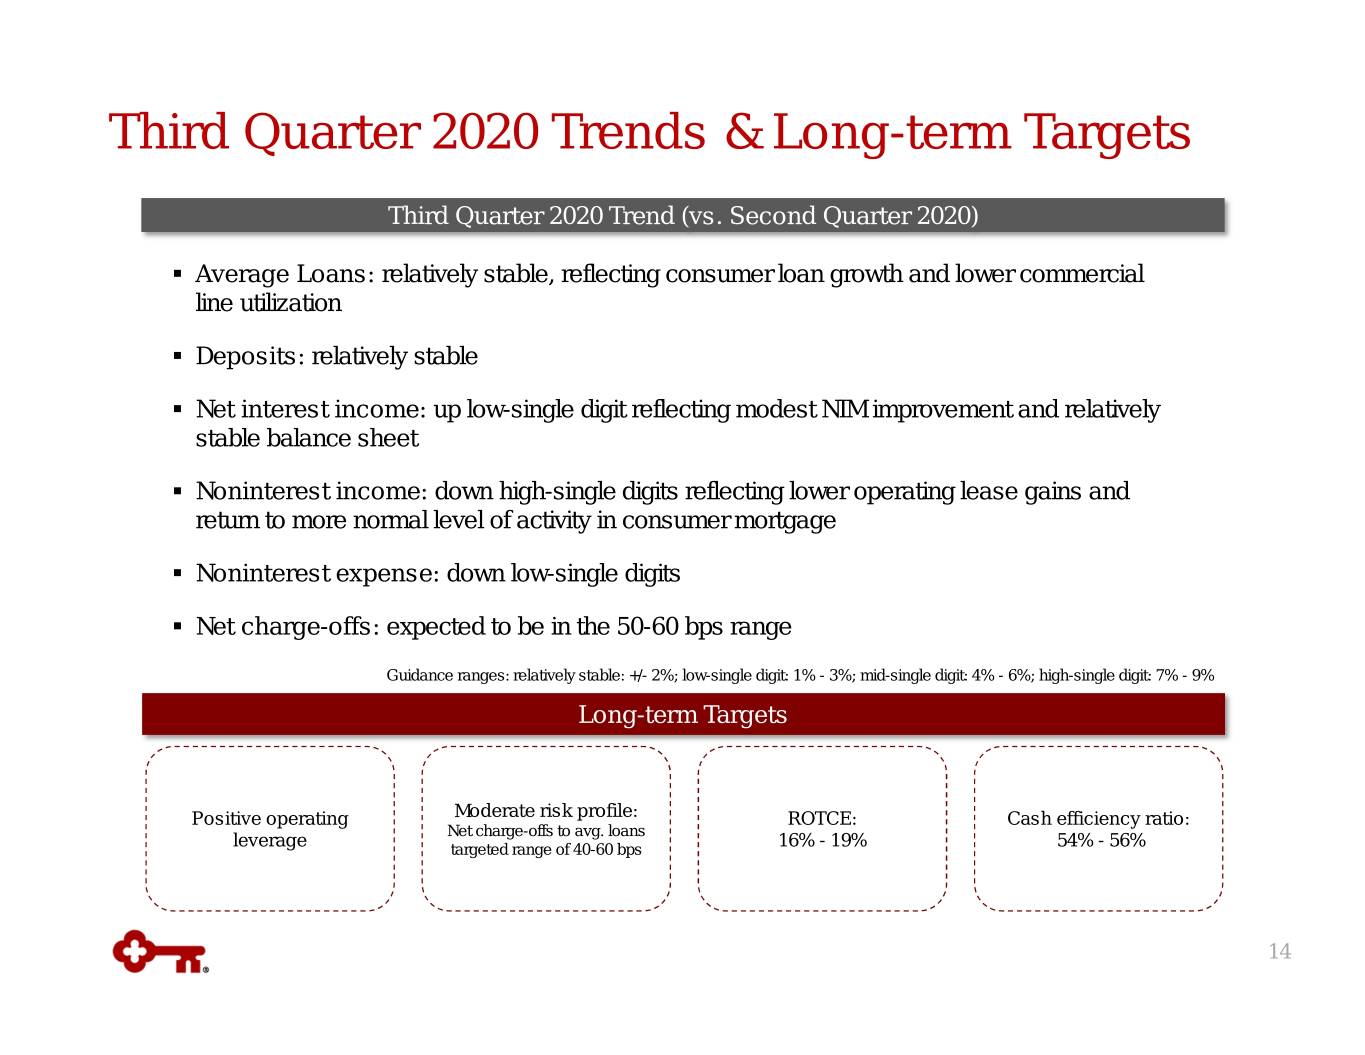
Third Quarter 2020 Trends & Long-term Targets Third Quarter 2020 Trend (vs. Second Quarter 2020) . Average Loans: relatively stable, reflecting consumer loan growth and lower commercial line utilization . Deposits: relatively stable . Net interest income: up low-single digit reflecting modest NIM improvement and relatively stable balance sheet . Noninterest income: down high-single digits reflecting lower operating lease gains and return to more normal level of activity in consumer mortgage . Noninterest expense: down low-single digits . Net charge-offs: expected to be in the 50-60 bps range Guidance ranges: relatively stable: +/- 2%; low-single digit: 1% - 3%; mid-single digit: 4% - 6%; high-single digit: 7% - 9% Long-term Targets Positive operating Moderate risk profile: ROTCE: Cash efficiency ratio: Net charge-offs to avg. loans leverage targeted range of 40-60 bps 16% - 19% 54% - 56% 14
Appendix 15
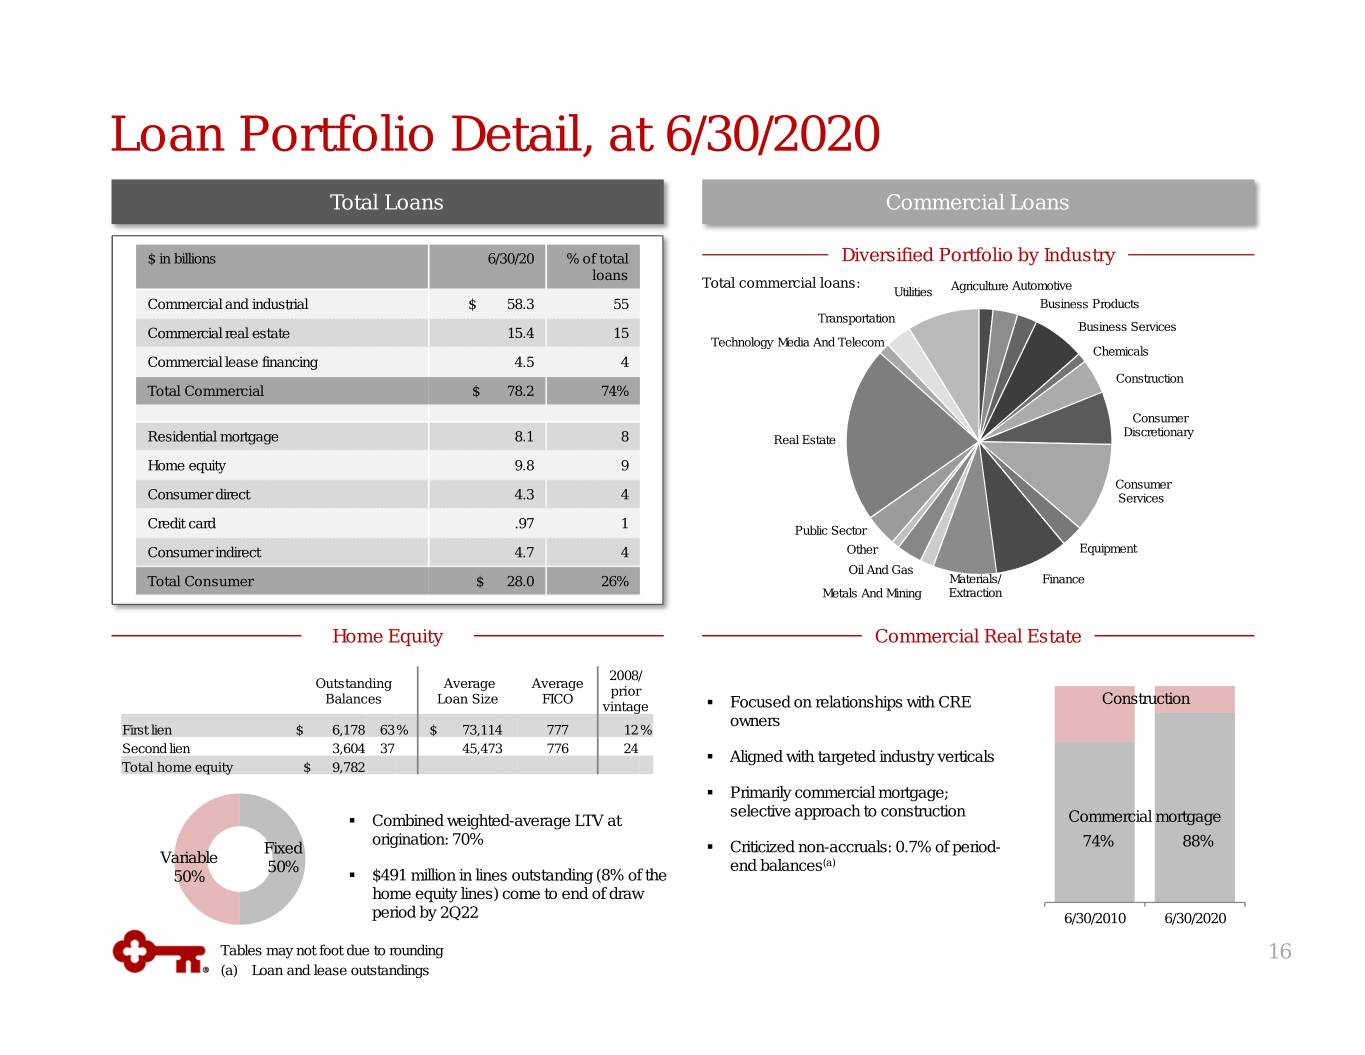
Loan Portfolio Detail, at 6/30/2020 Total Loans Commercial Loans $ in billions 6/30/20 % of total Diversified Portfolio by Industry loans Total commercial loans: Automotive Utilities Agriculture Commercial and industrial $ 58.3 55 Business Products Transportation Commercial real estate 15.4 15 Business Services Technology Media And Telecom C&I CRE Chemicals Commercial lease financing$40 4.5$18 4 Construction Total Commercial $ 78.2 74% Consumer Discretionary Residential mortgage 8.1 8 Real Estate Home equity 9.8 9 Consumer Consumer direct 4.3 4 Services Credit card .97 1 Public Sector Consumer indirect 4.7 4 Other Equipment Oil And Gas Total Consumer $ 28.0 26% Materials/ Finance Metals And Mining Extraction Home Equity Commercial Real Estate 2008/ Outstanding Average Average prior Balances Loan Size FICO Construction vintage . Focused on relationships with CRE owners First lien $ 6,178 63 % $ 73,114 777 12 % Second lien 3,604 37 45,473 776 24 . Aligned with targeted industry verticals Total home equity $ 9,782 . Primarily commercial mortgage; selective approach to construction . Combined weighted-average LTV at Commercial mortgage origination: 70% Fixed . Criticized non-accruals: 0.7% of period- 74% 88% Variable 50% end balances (a) 50% . $491 million in lines outstanding (8% of the home equity lines) come to end of draw period by 2Q22 6/30/2010 6/30/2020 Tables may not foot due to rounding 16 (a) Loan and lease outstandings
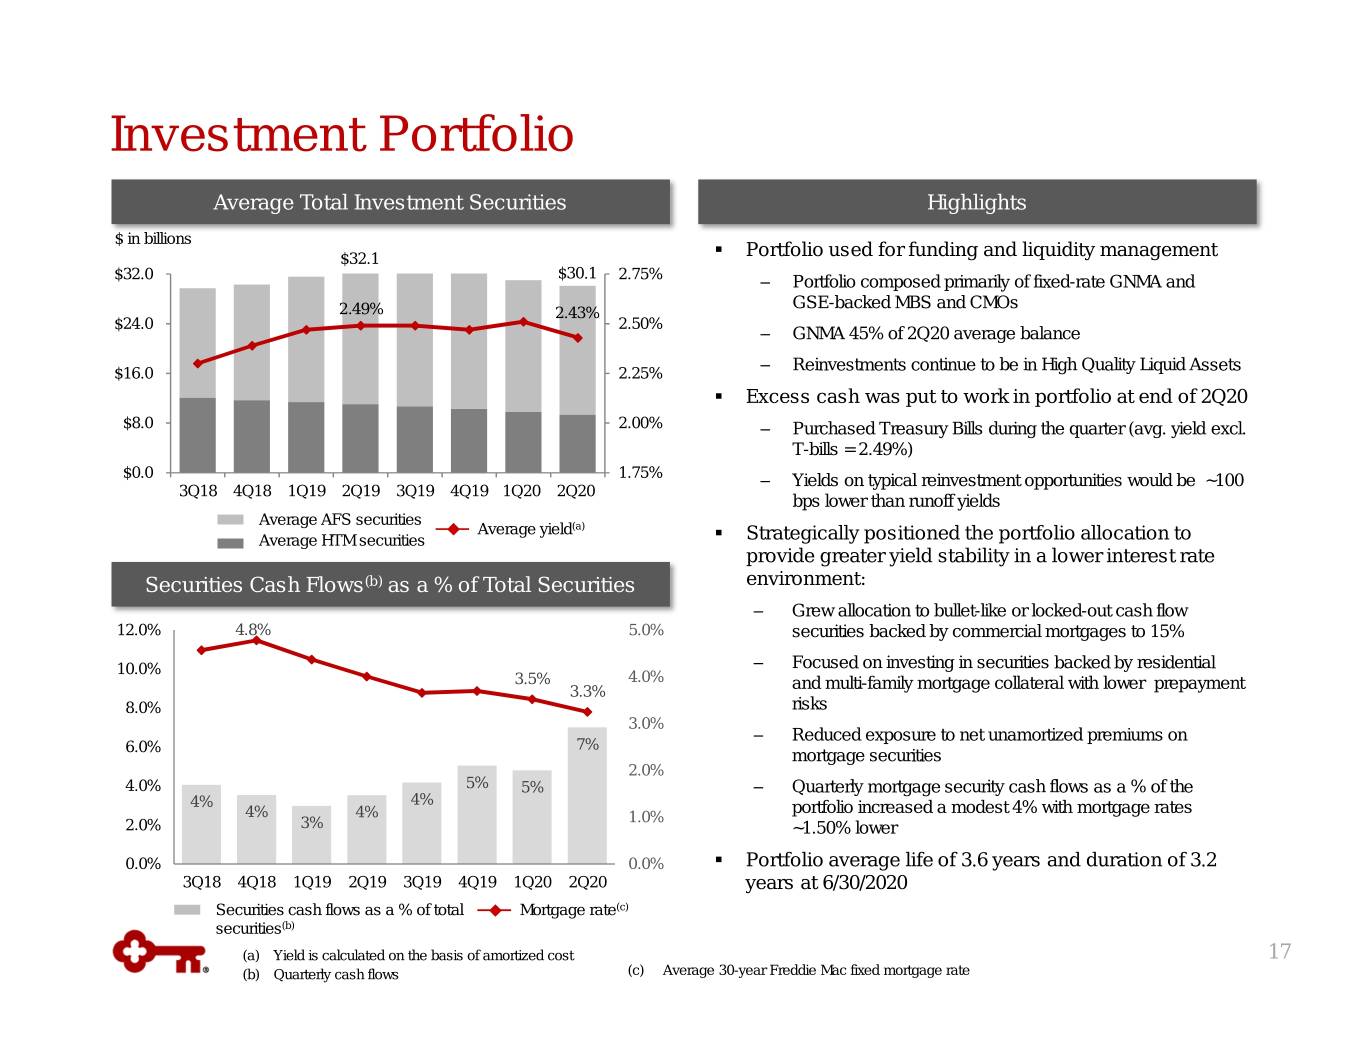
Investment Portfolio Average Total Investment Securities Highlights $ in billions $32.1 . Portfolio used for funding and liquidity management $30.1 $32.0 2.75% ‒ Portfolio composed primarily of fixed-rate GNMA and GSE-backed MBS and CMOs 2.49% 2.43% $24.0 2.50% ‒ GNMA 45% of 2Q20 average balance ‒ Reinvestments continue to be in High Quality Liquid Assets $16.0 2.25% . Excess cash was put to work in portfolio at end of 2Q20 $8.0 2.00% ‒ Purchased Treasury Bills during the quarter (avg. yield excl. T-bills = 2.49%) $0.0 1.75% ‒ Yields on typical reinvestment opportunities would be ~100 3Q18 4Q18 1Q19 2Q19 3Q19 4Q19 1Q20 2Q20 bps lower than runoff yields Average AFS securities Average yield (a) Average HTM securities . Strategically positioned the portfolio allocation to provide greater yield stability in a lower interest rate Securities Cash Flows (b) as a % of Total Securities environment: ‒ Grew allocation to bullet-like or locked-out cash flow 12.0% 4.8% 5.0% securities backed by commercial mortgages to 15% 10.0% ‒ Focused on investing in securities backed by residential 3.5% 4.0% 3.3% and multi-family mortgage collateral with lower prepayment 8.0% risks 3.0% ‒ Reduced exposure to net unamortized premiums on 6.0% 7% mortgage securities 2.0% 4.0% 5% 5% ‒ Quarterly mortgage security cash flows as a % of the 4% 4% portfolio increased a modest 4% with mortgage rates 4% 4% 1.0% 2.0% 3% ~1.50% lower 0.0% 0.0% . Portfolio average life of 3.6 years and duration of 3.2 3Q18 4Q18 1Q19 2Q19 3Q19 4Q19 1Q20 2Q20 years at 6/30/2020 Securities cash flows as a % of total Mortgage rate (c) securities (b) (a) Yield is calculated on the basis of amortized cost 17 (b) Quarterly cash flows (c) Average 30-year Freddie Mac fixed mortgage rate

Asset & Liability Management Positioning Active hedging moderates interest rate risk, protecting and enhancing net interest income 2Q20 Balance Sheet Highlights (a) Actively Managing Interest Rate Risk Position Loan Composition Deposit Mix . Declining rate exposure lower relative to 1Q20 driven by normalization of LIBOR/Fed Funds spread Prime Noninterest- − NII decline of ~.5% for a ramped 100 bps decrease from 10% bearing current rates over 12 months (subject to 25 bps floor) Fixed 32% 37% 1 month Interest- . Reducing exposure to lower and negative rates LIBOR bearing through the use of floors in loan agreements 40% 68% Other − ~75% of total LIBOR loan portfolio contains floors 7% 3 month LIBOR ‒ Implementing floors in substantially all new LIBOR-based 6% loan originations and loans entering into forbearance . Attractive business model with relationship-oriented ‒ Floors include language to apply to alternative indices lending franchise (SOFR, etc.) − Distinctive commercial capabilities drive C&I growth and . Total Hedge portfolio of $34.2 B at 6/30/2020 ~63% floating-rate loan mix − Executed $1.5 B of debt swaps in 2Q20 and $7.5 B in − Laurel Road and residential mortgage enhances fixed rate interest rate floors in 2Q20 loan volumes with attractive client profile . Strong, low-cost deposit base 2Q20 − ~60% stable retail and low-cost escrow $17.6 B $8.8 B $7.8 B − >85% from markets where Key maintains top-5 deposit or A/LM Swaps Debt Swaps Floors branch share . $31.8 B securities portfolio structured to provide . Hedging beginning in 3Q18 significantly reduced impact greater yield stability in a lower rate environment of recent rate movements (~$31B in executions through − Continued to add bullet-like securities and mortgage collateral 2Q20) with lower prepayment risks, while reducing exposure to net unamortized premiums 18 (a) Loan, deposit and securities portfolio statistics based on 6/30/2020 ending balances
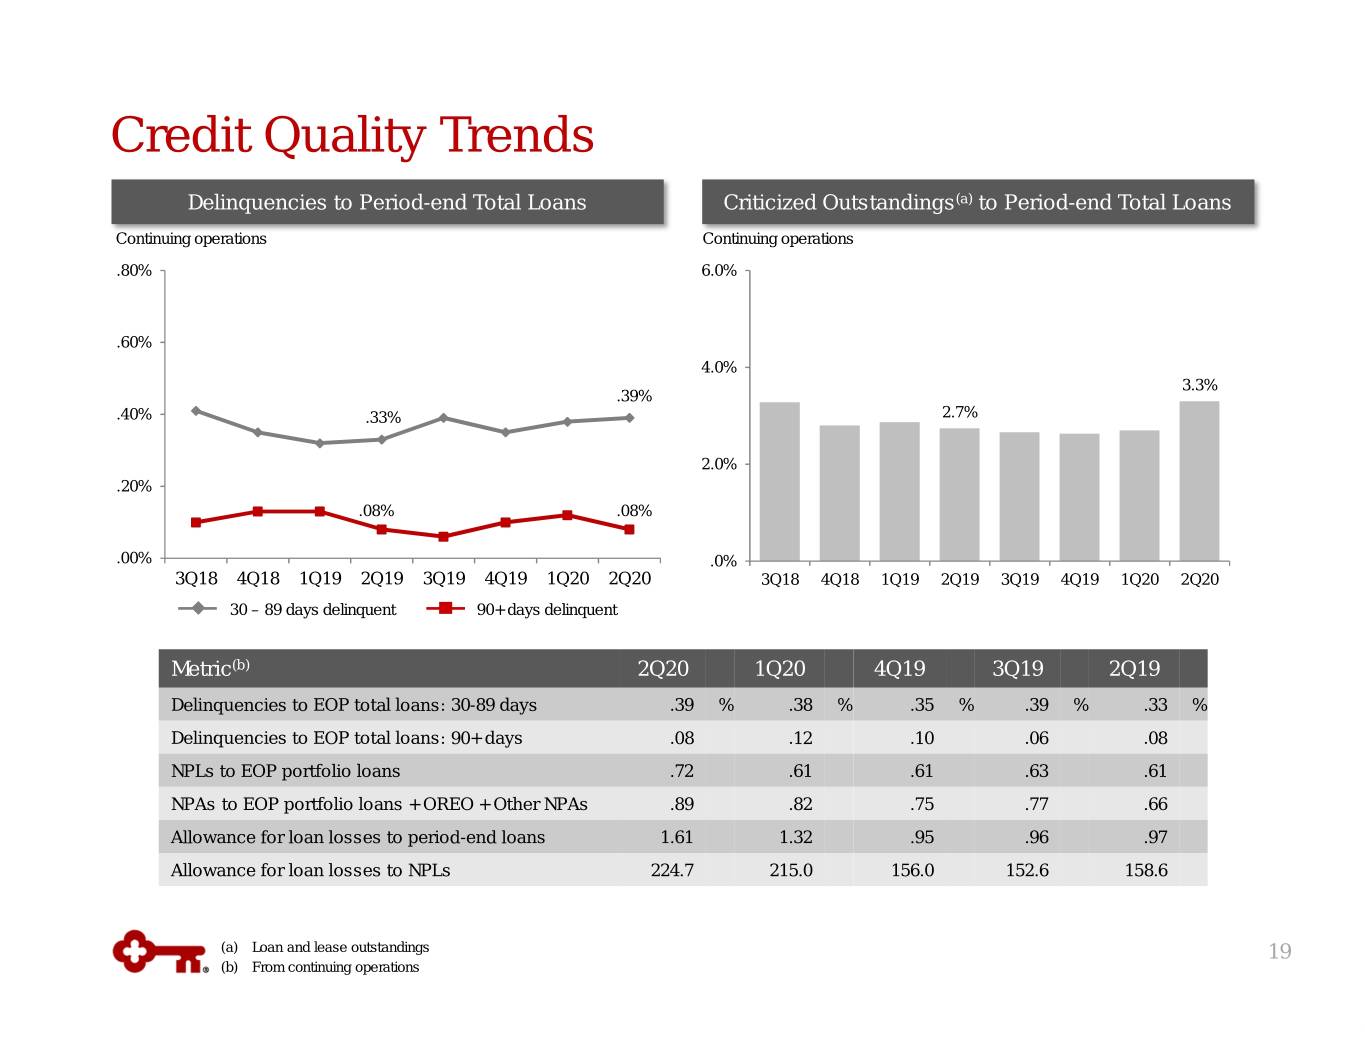
Credit Quality Trends Delinquencies to Period-end Total Loans Criticized Outstandings (a) to Period-end Total Loans Continuing operations Continuing operations .80% 6.0% .60% 4.0% 3.3% .39% .40% .33% 2.7% 2.0% .20% .08% .08% .00% .0% 3Q18 4Q18 1Q19 2Q19 3Q19 4Q19 1Q20 2Q20 3Q18 4Q18 1Q19 2Q19 3Q19 4Q19 1Q20 2Q20 30 – 89 days delinquent 90+ days delinquent Metric (b) 2Q20 1Q20 4Q19 3Q19 2Q19 Delinquencies to EOP total loans: 30-89 days .39 % .38 % .35 % .39 % .33 % Delinquencies to EOP total loans: 90+ days .08 .12 .10 .06 .08 NPLs to EOP portfolio loans .72 .61 .61 .63 .61 NPAs to EOP portfolio loans + OREO + Other NPAs .89 .82 .75 .77 .66 Allowance for loan losses to period-end loans 1.61 1.32 .95 .96 .97 Allowance for loan losses to NPLs 224.7 215.0 156.0 152.6 158.6 (a) Loan and lease outstandings 19 (b) From continuing operations
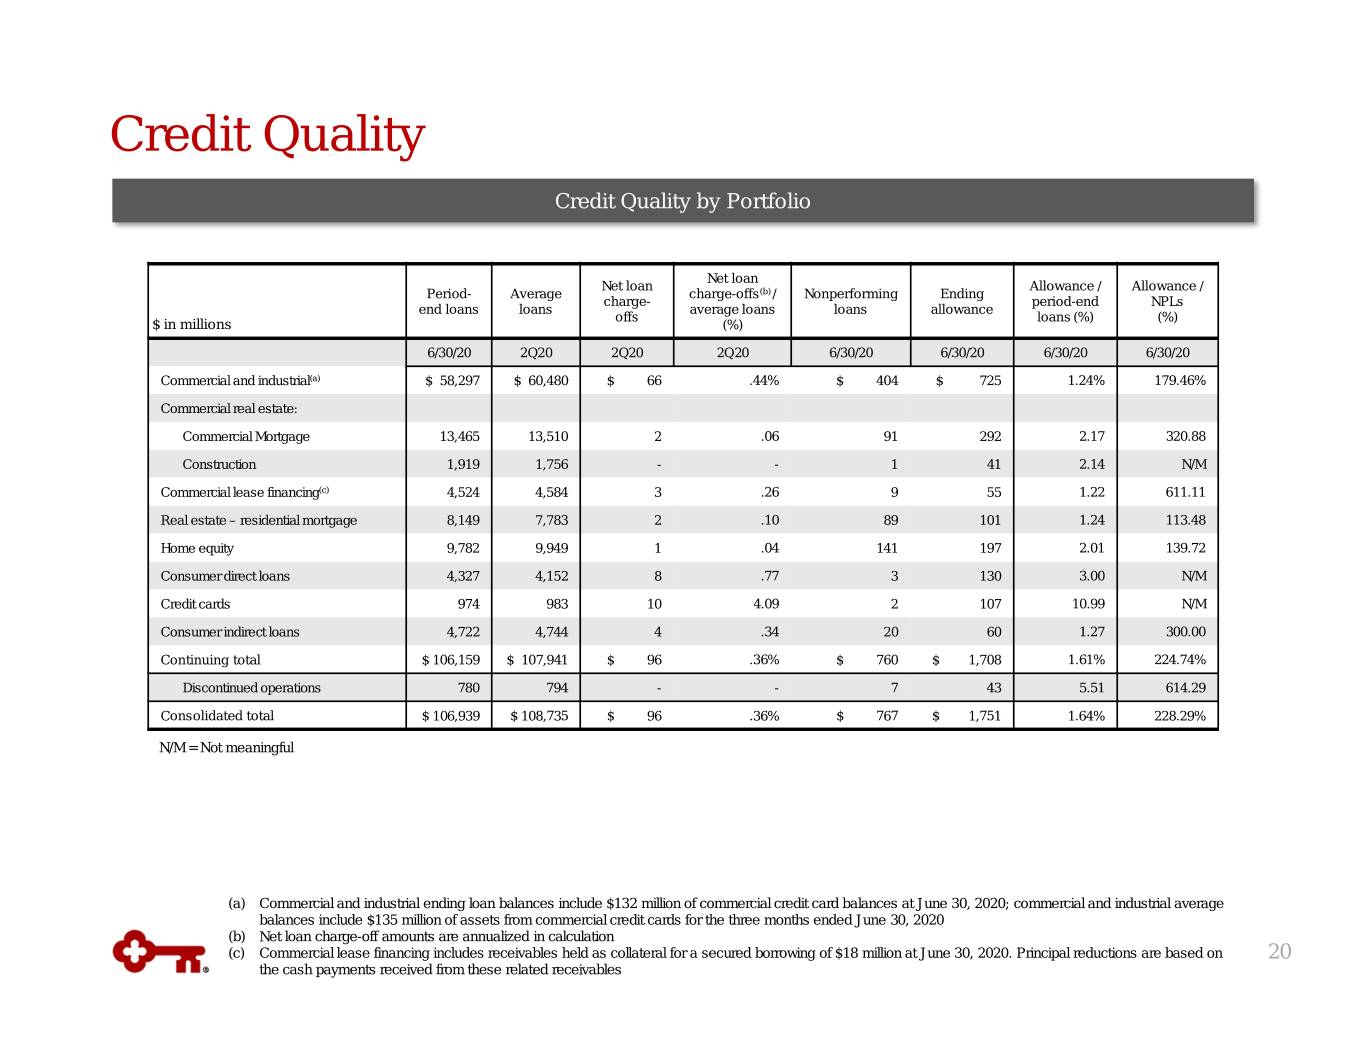
Credit Quality Credit Quality by Portfolio Net loan Net loan Allowance / Allowance / Period- Average charge-offs (b) / Nonperforming Ending charge- period-end NPLs end loans loans average loans loans allowance offs loans (%) (%) $ in millions (%) 6/30/20 2Q20 2Q20 2Q20 6/30/20 6/30/20 6/30/20 6/30/20 Commercial and industrial (a) $ 58,297 $ 60,480 $ 66 .44% $ 404 $ 725 1.24% 179.46% Commercial real estate: Commercial Mortgage 13,465 13,510 2 .06 91 292 2.17 320.88 Construction 1,919 1,756 - - 1 41 2.14 N/M Commercial lease financing (c) 4,524 4,584 3 .26 9 55 1.22 611.11 Real estate – residential mortgage 8,149 7,783 2 .10 89 101 1.24 113.48 Home equity 9,782 9,949 1 .04 141 197 2.01 139.72 Consumer direct loans 4,327 4,152 8 .77 3 130 3.00 N/M Credit cards 974 983 10 4.09 2 107 10.99 N/M Consumer indirect loans 4,722 4,744 4 .34 20 60 1.27 300.00 Continuing total $ 106,159 $ 107,941 $ 96 .36% $ 760 $ 1,708 1.61% 224.74% Discontinued operations 780 794 - - 7 43 5.51 614.29 Consolidated total $ 106,939 $ 108,735 $ 96 .36% $ 767 $ 1,751 1.64% 228.29% N/M = Not meaningful (a) Commercial and industrial ending loan balances include $132 million of commercial credit card balances at June 30, 2020; commercial and industrial average balances include $135 million of assets from commercial credit cards for the three months ended June 30, 2020 (b) Net loan charge-off amounts are annualized in calculation (c) Commercial lease financing includes receivables held as collateral for a secured borrowing of $18 million at June 30, 2020. Principal reductions are based on 20 the cash payments received from these related receivables
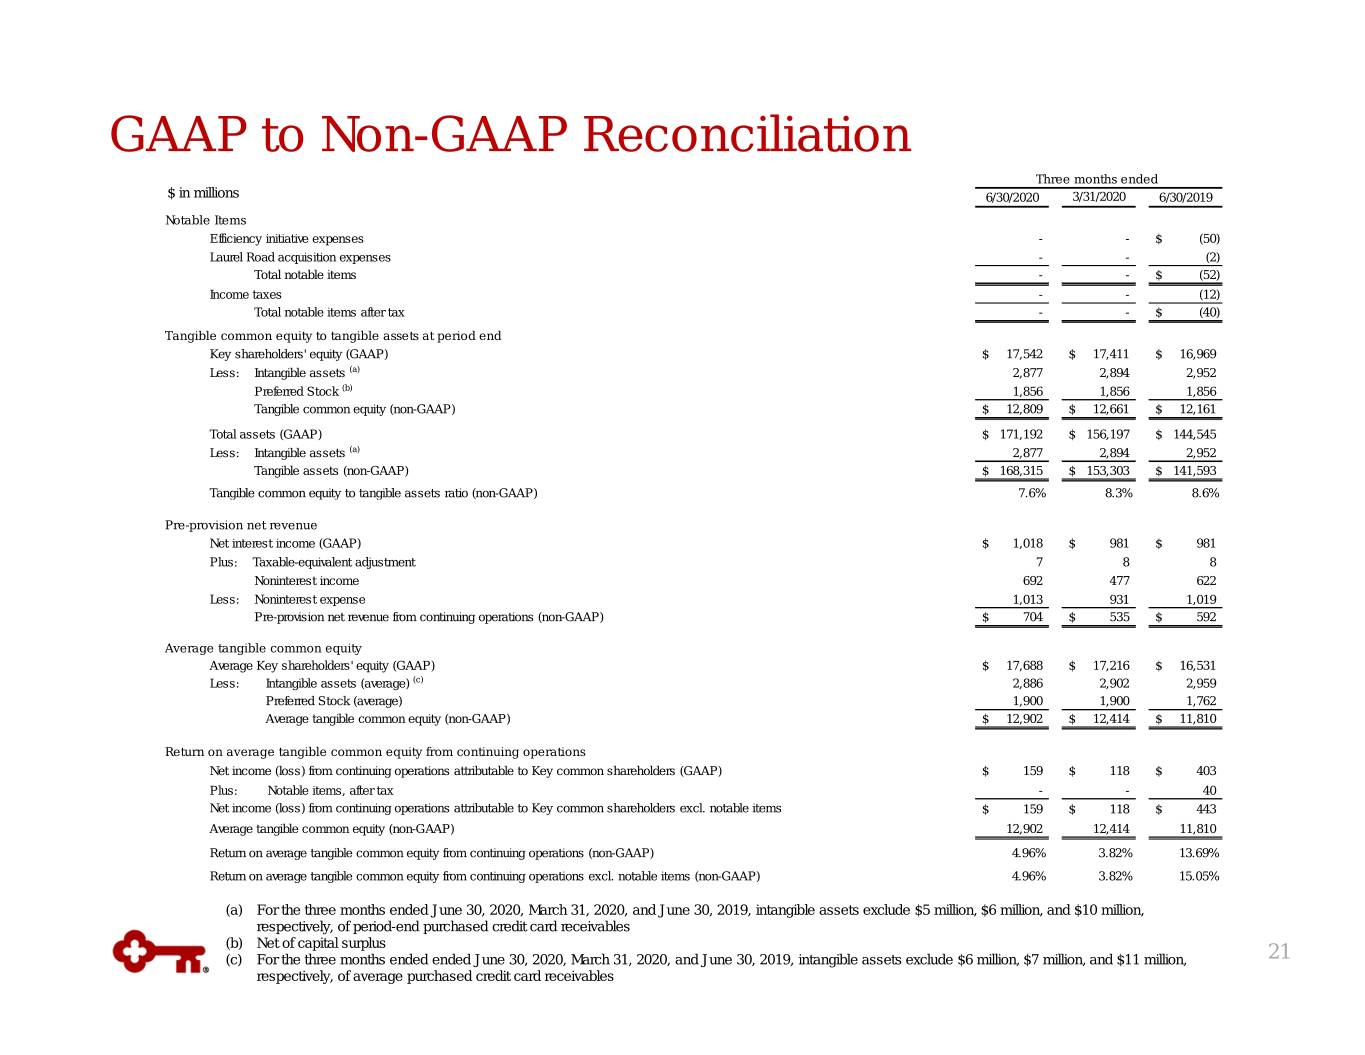
GAAP to Non-GAAP Reconciliation Three months ended $ in millions 6/30/2020 3/31/2020 6/30/2019 Notable Items Efficiency initiative expenses - -$ (50) Laurel Road acquisition expenses - - (2) Total notable items - -$ (52) Income taxes - - (12) Total notable items after tax - -$ (40) Tangible common equity to tangible assets at period end Key shareholders' equity (GAAP) $ 17,542 $ 17,411 $ 16,969 Less: Intangible assets (a) 2,877 2,894 2,952 Preferred Stock (b) 1,856 1,856 1,856 Tangible common equity (non-GAAP) $ 12,809 $ 12,661 $ 12,161 Total assets (GAAP) $ 171,192 $ 156,197 $ 144,545 Less: Intangible assets (a) 2,877 2,894 2,952 Tangible assets (non-GAAP) $ 168,315 $ 153,303 $ 141,593 Tangible common equity to tangible assets ratio (non-GAAP) 7.6% 8.3% 8.6% Pre-provision net revenue Net interest income (GAAP) $ 1,018 $ 981 $ 981 Plus: Taxable-equivalent adjustment 7 8 8 Noninterest income 692 477 622 Less: Noninterest expense 1,013 931 1,019 Pre-provision net revenue from continuing operations (non-GAAP) $ 704 $ 535 $ 592 Average tangible common equity Average Key shareholders' equity (GAAP) $ 17,688 $ 17,216 $ 16,531 Less: Intangible assets (average) (c) 2,886 2,902 2,959 Preferred Stock (average) 1,900 1,900 1,762 Average tangible common equity (non-GAAP) $ 12,902 $ 12,414 $ 11,810 Return on average tangible common equity from continuing operations Net income (loss) from continuing operations attributable to Key common shareholders (GAAP) $ 159 $ 118 $ 403 Plus: Notable items, after tax - - 40 Net income (loss) from continuing operations attributable to Key common shareholders excl. notable items $ 159 $ 118 $ 443 Average tangible common equity (non-GAAP) 12,902 12,414 11,810 Return on average tangible common equity from continuing operations (non-GAAP) 4.96% 3.82% 13.69% Return on average tangible common equity from continuing operations excl. notable items (non-GAAP) 4.96% 3.82% 15.05% (a) For the three months ended June 30, 2020, March 31, 2020, and June 30, 2019, intangible assets exclude $5 million, $6 million, and $10 million, respectively, of period-end purchased credit card receivables (b) Net of capital surplus (c) For the three months ended ended June 30, 2020, March 31, 2020, and June 30, 2019, intangible assets exclude $6 million, $7 million, and $11 million, 21 respectively, of average purchased credit card receivables
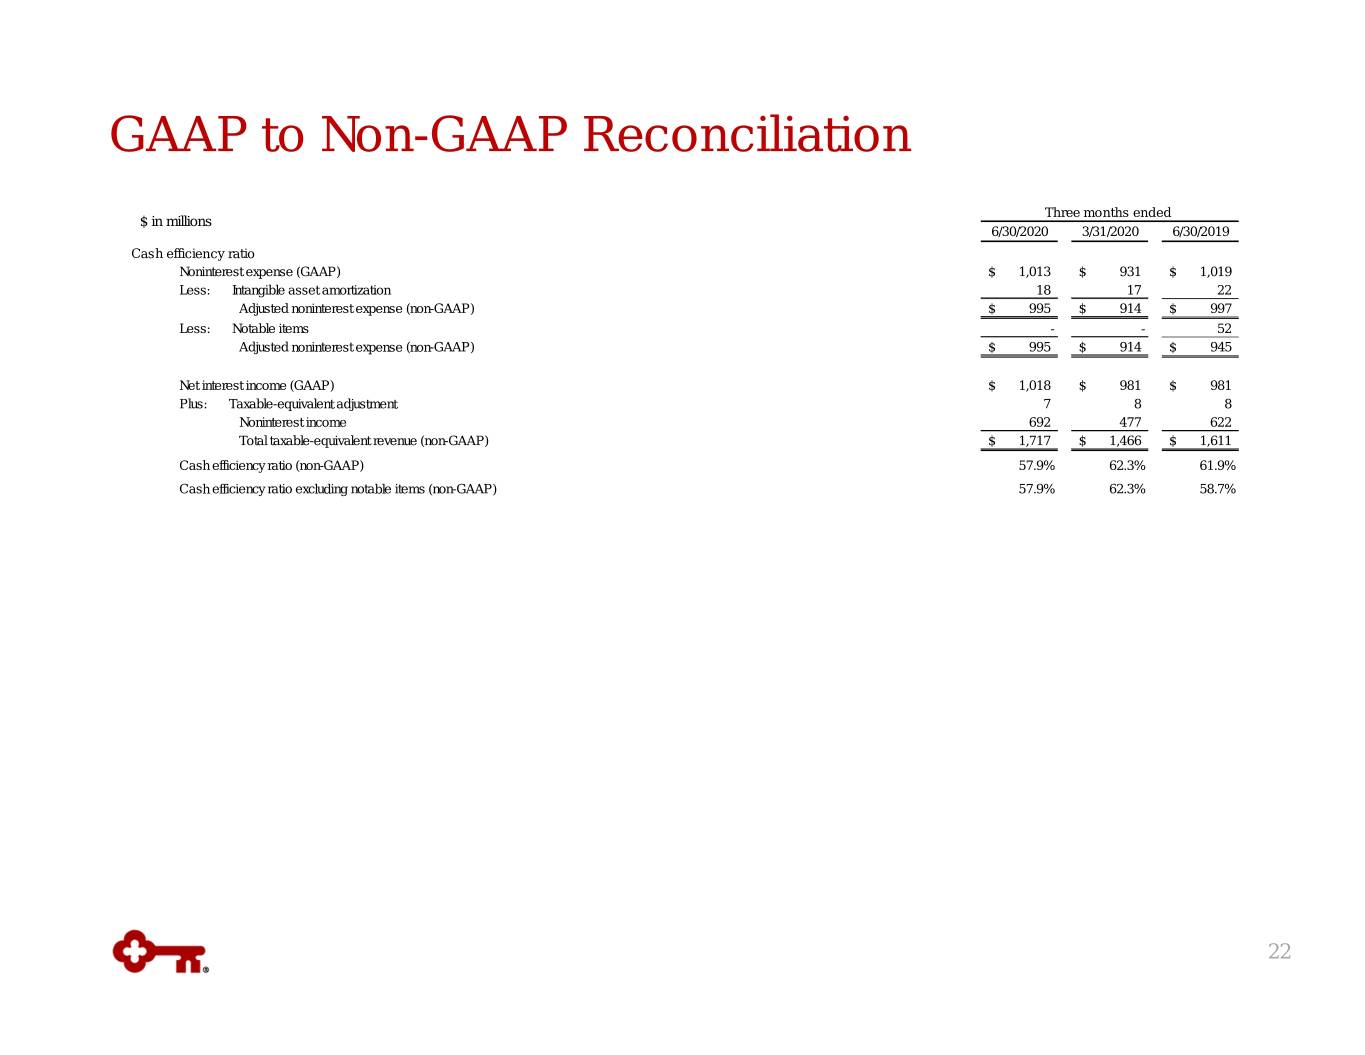
GAAP to Non-GAAP Reconciliation Three months ended $ in millions 6/30/2020 3/31/2020 6/30/2019 Cash efficiency ratio Noninterest expense (GAAP) $ 1,013 $ 931 $ 1,019 Less: Intangible asset amortization 18 17 22 Adjusted noninterest expense (non-GAAP) $ 995 $ 914 $ 997 Less: Notable items - - 52 Adjusted noninterest expense (non-GAAP) $ 995 $ 914 $ 945 Net interest income (GAAP) $ 1,018 $ 981 $ 981 Plus: Taxable-equivalent adjustment 7 8 8 Noninterest income 692 477 622 Total taxable-equivalent revenue (non-GAAP) $ 1,717 $ 1,466 $ 1,611 Cash efficiency ratio (non-GAAP) 57.9% 62.3% 61.9% Cash efficiency ratio excluding notable items (non-GAAP) 57.9% 62.3% 58.7% 22
