Attached files
| file | filename |
|---|---|
| EX-99.1 - EX-99.1 - COMERICA INC /NEW/ | a2020q2pressrelease-ex.htm |
| 8-K - 8-K - COMERICA INC /NEW/ | cma-20200721.htm |
Comerica Incorporated Second Quarter 2020 Financial Review July 21, 2020

Safe Harbor Statement Any statements in this presentation that are not historical facts are forward-looking statements as defined in the Private Securities Litigation Reform Act of 1995. Words such as “anticipates,” “believes,” “contemplates,” “feels,” “expects,” “estimates,” “seeks,” “strives,” “plans,” “intends,” “outlook,” “forecast,” “position,” “target,” “mission,” “assume,” “achievable,” “potential,” “strategy,” “goal,” “aspiration,” “opportunity,” “initiative,” “outcome,” “continue,” “remain,” “maintain,” “on track,” “trend,” “objective,” “looks forward,” “projects,” “models” and variations of such words and similar expressions, or future or conditional verbs such as “will,” “would,” “should,” “could,” “might,” “can,” “may” or similar expressions, as they relate to Comerica or its management, are intended to identify forward-looking statements. These forward-looking statements are predicated on the beliefs and assumptions of Comerica's management based on information known to Comerica's management as of the date of this presentation and do not purport to speak as of any other date. Forward-looking statements may include descriptions of plans and objectives of Comerica's management for future or past operations, products or services, and forecasts of Comerica's revenue, earnings or other measures of economic performance, including statements of profitability, business segments and subsidiaries as well as estimates of credit trends and global stability. Such statements reflect the view of Comerica's management as of this date with respect to future events and are subject to risks and uncertainties. Should one or more of these risks materialize or should underlying beliefs or assumptions prove incorrect, Comerica's actual results could differ materially from those discussed. Factors that could cause or contribute to such differences include credit risks (unfavorable developments concerning credit quality; declines or other changes in the businesses or industries of Comerica's customers, in particular the energy industry; and changes in customer behavior); market risks (changes in monetary and fiscal policies; fluctuations in interest rates and their impact on deposit pricing; and transitions away from LIBOR towards new interest rate benchmarks); liquidity risks (Comerica's ability to maintain adequate sources of funding and liquidity; reductions in Comerica's credit rating; and the interdependence of financial service companies); technology risks (cybersecurity risks and heightened legislative and regulatory focus on cybersecurity and data privacy); operational risks (operational, systems or infrastructure failures; reliance on other companies to provide certain key components of business infrastructure; the impact of legal and regulatory proceedings or determinations; losses due to fraud; and controls and procedures failures); compliance risks (changes in regulation or oversight; the effects of stringent capital requirements; and the impacts of future legislative, administrative or judicial changes to tax regulations); financial reporting risks (changes in accounting standards and the critical nature of Comerica's accounting policies); strategic risks (damage to Comerica's reputation; Comerica's ability to utilize technology to efficiently and effectively develop, market and deliver new products and services; competitive product and pricing pressures among financial institutions within Comerica's markets; the implementation of Comerica's strategies and business initiatives; management's ability to maintain and expand customer relationships; management's ability to retain key officers and employees; and any future strategic acquisitions or divestitures); and other general risks (changes in general economic, political or industry conditions; the effectiveness of methods of reducing risk exposures; the effects of catastrophic events, including the COVID-19 global pandemic; and the volatility of Comerica’s stock price). Comerica cautions that the foregoing list of factors is not all-inclusive. For discussion of factors that may cause actual results to differ from expectations, please refer to our filings with the Securities and Exchange Commission. In particular, please refer to “Item 1A. Risk Factors” beginning on page 12 of Comerica's Annual Report on Form 10-K for the year ended December 31, 2019 and "Item 1A. Risk Factors" beginning on page 60 of the Corporation's Quarterly Report on Form 10-Q for the quarter ended March 31, 2020. Forward-looking statements speak only as of the date they are made. Comerica does not undertake to update forward-looking statements to reflect facts, circumstances, assumptions or events that occur after the date the forward-looking statements are made. For any forward- looking statements made in this presentation or in any documents, Comerica claims the protection of the safe harbor for forward-looking statements contained in the Private Securities Litigation Reform Act of 1995. 2

2Q20 Results Record loan & deposit growth partly offsets lower interest rates & reserve build Change From Key Performance Drivers 2Q20 compared to 1Q20 (millions, except per share data) 2Q20 1Q20 2Q19 1Q20 2Q19 . Loan growth in the majority of Average loans $53,498 $49,604 $50,963 $3,894 $2,535 businesses; average PPP5 $2.6B Average deposits 64,282 56,768 54,995 7,514 9,287 . Deposit growth primarily noninterest-bearing driven by $471 $513 $603 $(42) $(132) Net interest income stimulus programs & customers Provision for credit losses 138 411 44 (273) 94 conserving cash Noninterest income1 247 237 250 10 (3) . Net interest income reflected lower interest rates Noninterest expenses1 440 425 424 15 16 . Net charge-offs, ex-Energy, 4 bps; Provision for income tax 27 (21) 87 48 (60) Provision includes further reserve build; ACL, ex-PPP, 2.15% Net income 113 (65) 298 178 (185) . Noninterest income included Earnings per share2 $0.80 $(0.46) $1.94 $1.26 $(1.14) higher card fees Average diluted shares 139.5 140.6 153.2 (1.1) (13.7) . Expenses reflect COVID-19 & PPP-related costs Book Value per Share3 53.28 53.24 48.89 0.04 4.39 . Strong capital level increased Tier 14 10.56 9.52 10.18 CET14 9.97 9.52 10.18 1Includes gain (loss) related to deferred comp plan of $2MM 2Q20, ($3MM) 1Q20, & -0- 2Q19 ● 2Diluted earnings per common share ● 3Common shareholders’ equity per share of common stock ● 42Q20 capital ratios estimated ● 5Paycheck Protection Program 3
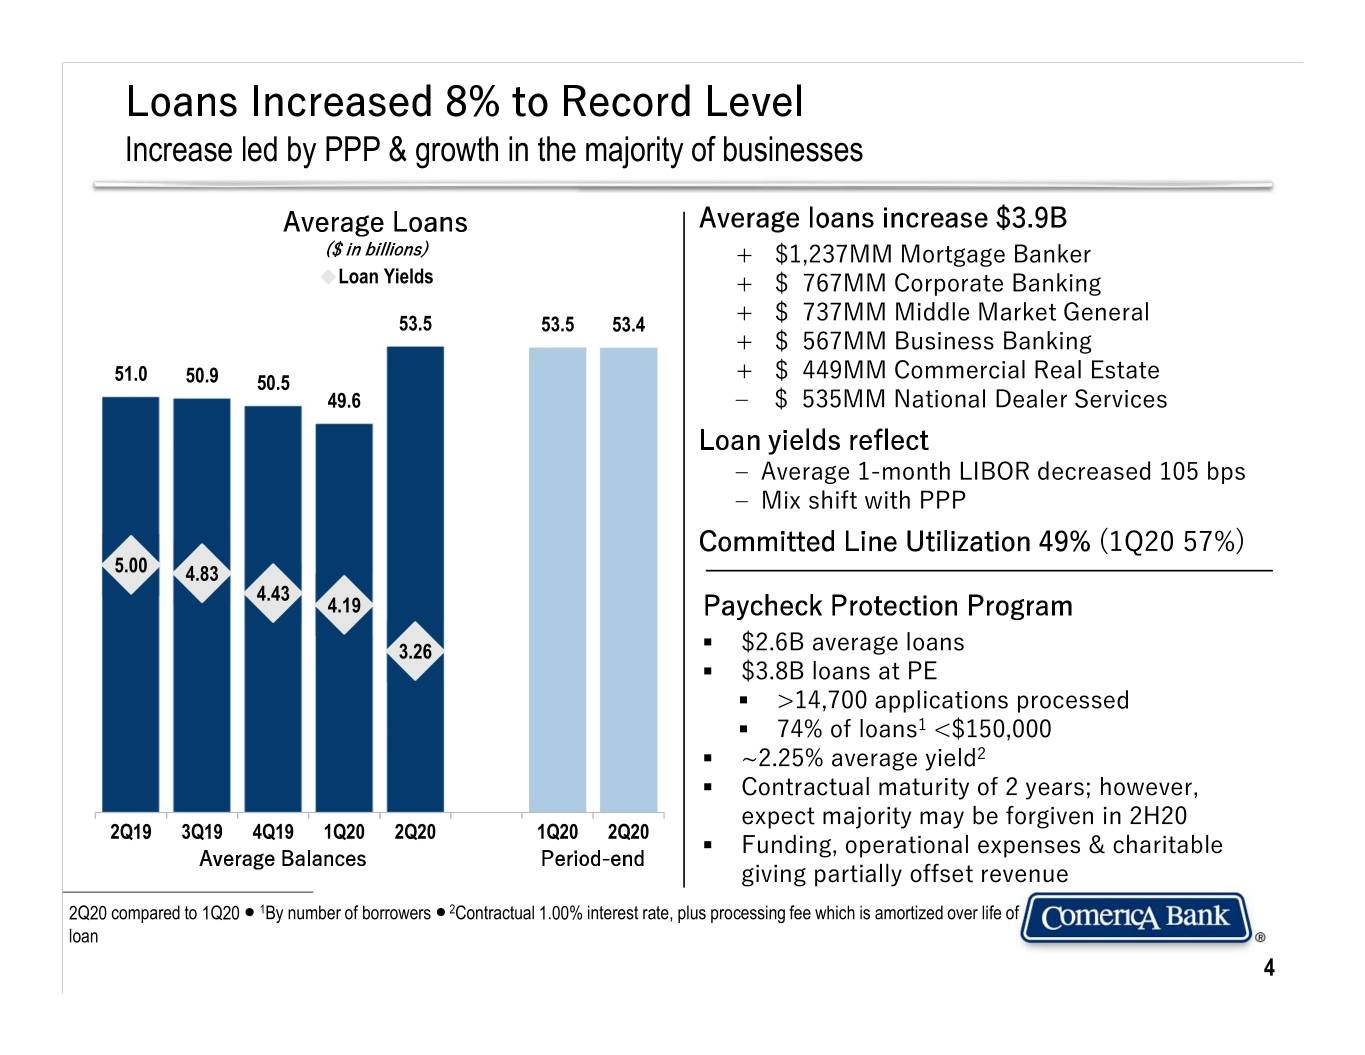
Loans Increased 8% to Record Level Increase led by PPP & growth in the majority of businesses Average Loans Average loans increase $3.9B ($ in billions) + $1,237MM Mortgage Banker Loan Yields + $ 767MM Corporate Banking 53.5 53.5 53.4 + $ 737MM Middle Market General + $ 567MM Business Banking 51.0 50.9 50.5 + $ 449MM Commercial Real Estate 49.6 ‒ $ 535MM National Dealer Services Loan yields reflect ‒ Average 1-month LIBOR decreased 105 bps ‒ Mix shift with PPP Committed Line Utilization 49% (1Q20 57%) 5.00 4.83 4.43 4.19 Paycheck Protection Program 3.26 . $2.6B average loans . $3.8B loans at PE . >14,700 applications processed . 74% of loans1 <$150,000 . ~2.25% average yield2 . Contractual maturity of 2 years; however, expect majority may be forgiven in 2H20 2Q19 3Q19 4Q19 1Q20 2Q20 1Q20 2Q20 . Funding, operational expenses & charitable Average Balances Period-end giving partially offset revenue 2Q20 compared to 1Q20 ● 1By number of borrowers ● 2Contractual 1.00% interest rate, plus processing fee which is amortized over life of loan 4

Deposits Grew 13% to Record Level Deposit rates decreased 50 basis points as prudently adjust pricing Average Deposits Average deposits increase $7.5B ($ in billions) + $5.9B noninterest-bearing 1 Deposit Rates + $1.6B interest-bearing 67.7 64.3 Loan to deposit ratio2 79% 57.2 56.8 57.4 55.0 55.7 Total funding costs 22 bps3, down 38 bps Beneficial Deposit Mix ($ in billions; 2Q20 Average) . Commercial 79% of noninterest-bearing . Retail 54% of interest-bearing Commercial Retail 0.94 0.99 Noninterest- 0.92 Noninterest- 0.76 bearing bearing 40% 11% Total 0.26 $64.3 Commercial Retail Interest- Interest- bearing 2Q19 3Q19 4Q19 1Q20 2Q20 1Q20 2Q20 bearing 22% Average Balances Period-end 27% 2Q20 compared to 1Q20 ● 1Interest costs on interest-bearing deposits ● 2At 6/30/2020 ● 3Interest incurred on liabilities as a percent of average noninterest–bearing deposits and interest-bearing liabilities 5

Securities Portfolio Yields relatively stable Securities Portfolio ($ in billions; Average) Treasury Securities Mortgage-backed Securities (MBS) Securities Yields 1 13.0 Duration of 2.2 years 12.6 12.8 12.1 12.2 12.2 12.3 . Extends to 3.4 years under a 200 bps instantaneous rate increase1 Net unrealized pre-tax gain of $371MM 10.2 9.8 9.9 2 9.3 9.4 9.4 9.5 Net unamortized premium of $12MM Portfolio Size3 . Opportunistically invest portion of excess liquidity, as market conditions 2.45 2.45 2.45 2.43 2.41 allow . Continue to reinvest estimated quarterly payments of $900MM-950MM (2Q20 ~$700MM) 2Q19 3Q19 4Q19 1Q20 2Q20 1Q20 2Q20 Average Balances Period-end 6/30/20 ● 1Estimated as of 6/30/20 ● 2Net unamortized premium on the MBS portfolio ● 3Outlook as of 7/21/20 6
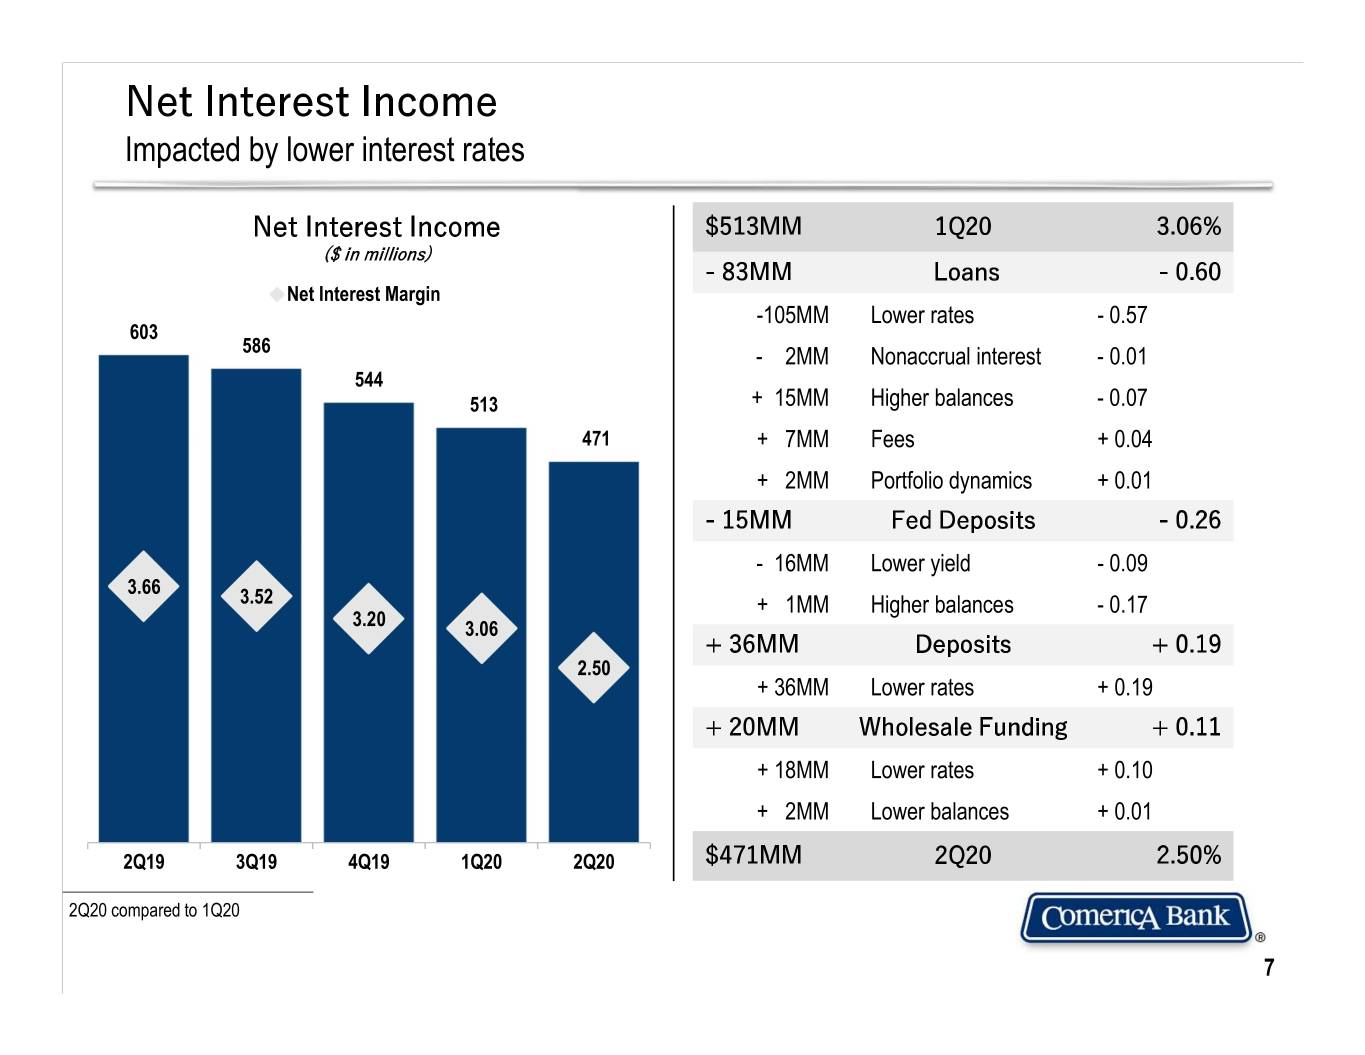
Net Interest Income Impacted by lower interest rates Net Interest Income $513MM 1Q20 3.06% ($ in millions) - 83MM Loans - 0.60 Net Interest Margin -105MM Lower rates - 0.57 603 586 - 2MM Nonaccrual interest - 0.01 544 513 + 15MM Higher balances - 0.07 471 + 7MM Fees + 0.04 + 2MM Portfolio dynamics + 0.01 - 15MM Fed Deposits - 0.26 - 16MM Lower yield - 0.09 3.66 3.52 + 1MM Higher balances - 0.17 3.20 3.06 + 36MM Deposits + 0.19 2.50 + 36MM Lower rates + 0.19 + 20MM Wholesale Funding + 0.11 + 18MM Lower rates + 0.10 + 2MM Lower balances + 0.01 2Q19 3Q19 4Q19 1Q20 2Q20 $471MM 2Q20 2.50% 2Q20 compared to 1Q20 7
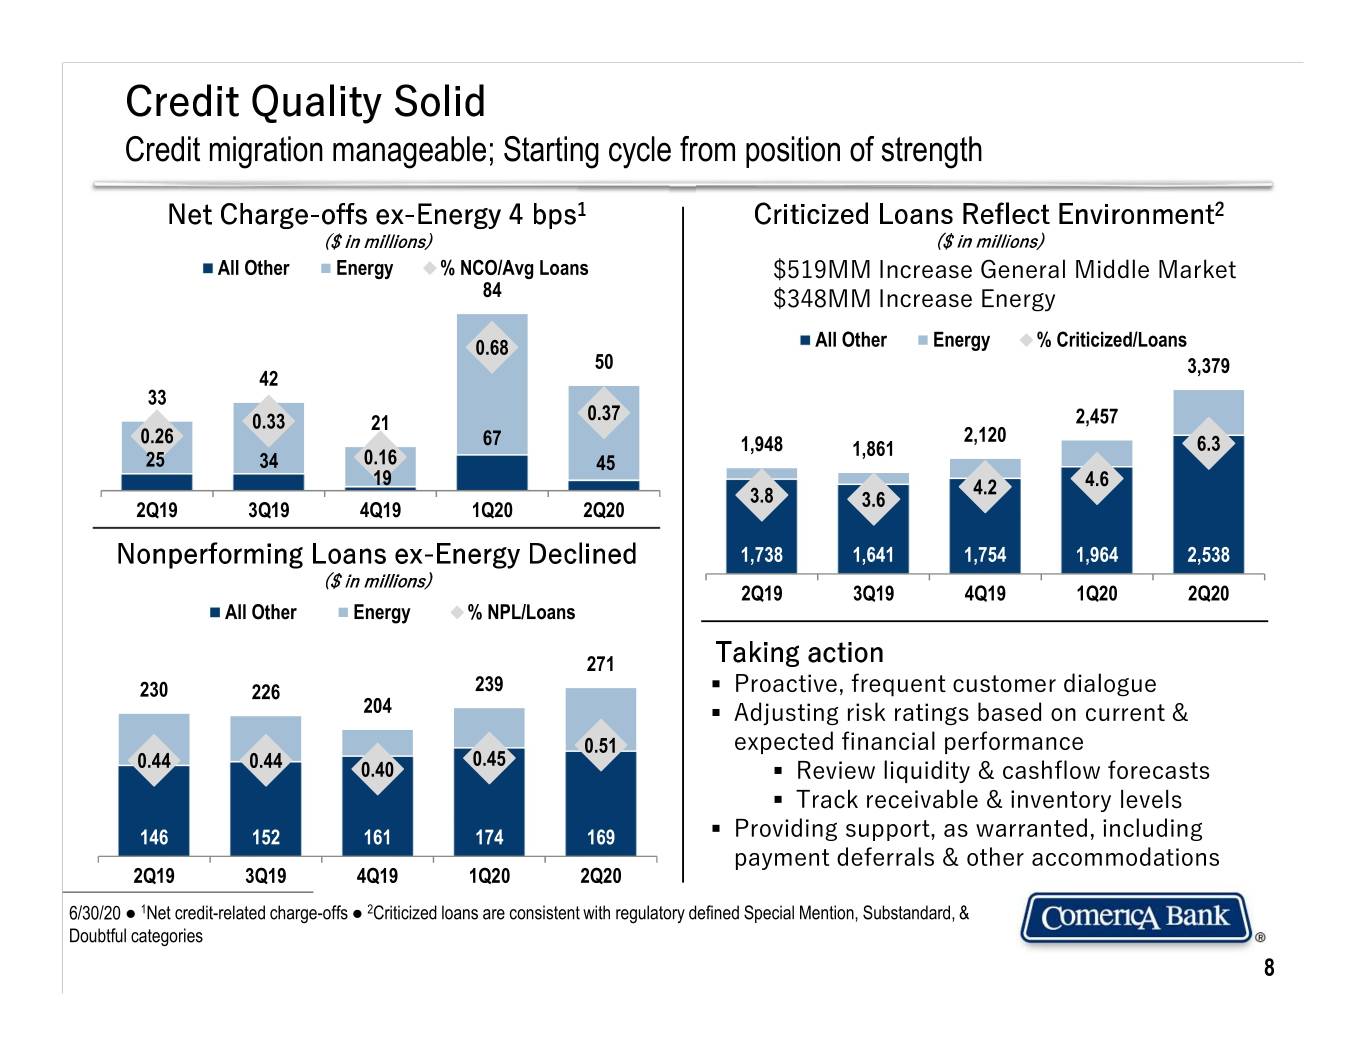
Credit Quality Solid Credit migration manageable; Starting cycle from position of strength Net Charge-offs ex-Energy 4 bps1 Criticized Loans Reflect Environment2 ($ in millions) ($ in millions) All Other Energy % NCO/Avg Loans 1.00 $519MM Increase General Middle Market 84 0.90 $348MM Increase Energy 0.80 0.68 0.70 All Other Energy % Criticized/Loans 0.60 50 3,379 10.00 0.50 42 9.00 0.40 33 8.00 0.37 2,457 0.30 0.33 21 7.00 0.26 2,120 67 0.20 1,948 6.3 6.00 0.16 1,861 25 0.10 34 45 5.00 19 4.6 - 4.2 4.00 3.8 3.6 2Q19 3Q19 4Q19 1Q20 2Q20 3.00 2.00 Nonperforming Loans ex-Energy Declined 1,738 1,641 1,754 1,964 2,538 1.00 - ($ in millions) 2Q19 3Q19 4Q19 1Q20 2Q20 All Other Energy % NPL/Loans 1.00 271 0.90 Taking action 0.80 230 226 239 . Proactive, frequent customer dialogue 204 0.70 0.60 . Adjusting risk ratings based on current & 0.51 0.50 expected financial performance 0.44 0.44 0.45 0.40 0.40 . Review liquidity & cashflow forecasts 0.30 . 0.20 Track receivable & inventory levels 146 152 161 174 169 0.10 . Providing support, as warranted, including - payment deferrals & other accommodations 2Q19 3Q19 4Q19 1Q20 2Q20 6/30/20 ● 1Net credit-related charge-offs ● 2Criticized loans are consistent with regulatory defined Special Mention, Substandard, & Doubtful categories 8
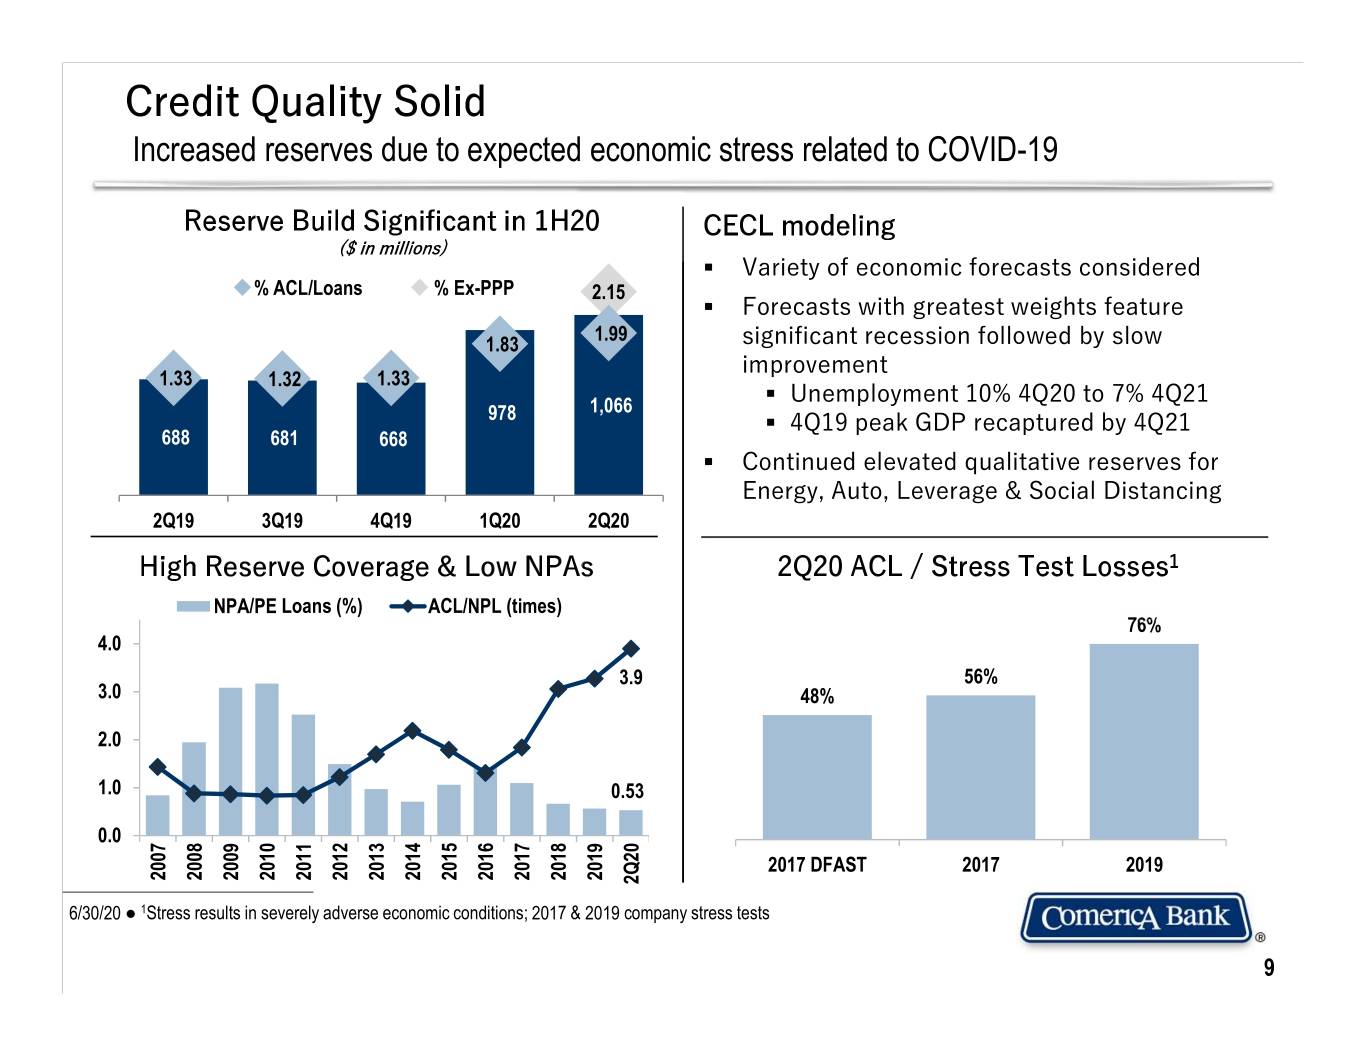
Credit Quality Solid Increased reserves due to expected economic stress related to COVID-19 Reserve Build Significant in 1H20 CECL modeling ($ in millions) . Variety of economic forecasts considered 1,200 % ACL/Loans % Ex-PPP 2.15 2.6 . Forecasts with greatest weights feature 1,000 1.99 2.1 1.83 significant recession followed by slow 800 1.6 1.33 1.32 1.33 improvement 600 1.1 . Unemployment 10% 4Q20 to 7% 4Q21 978 1,066 400 0.6 . 4Q19 peak GDP recaptured by 4Q21 688 681 668 200 0.1 . Continued elevated qualitative reserves for - -0.4 Energy, Auto, Leverage & Social Distancing 2Q19 3Q19 4Q19 1Q20 2Q20 High Reserve Coverage & Low NPAs 2Q20 ACL / Stress Test Losses1 NPA/PE Loans (%) ACL/NPL (times) 76% 4.0 3.9 56% 3.0 48% 2.0 1.0 0.53 0.0 2017 DFAST 2017 2019 2007 2008 2009 2010 2011 2012 2013 2014 2015 2016 2017 2018 2019 2Q20 6/30/20 ● 1Stress results in severely adverse economic conditions; 2017 & 2019 company stress tests 9

Energy Line of Business Allocation of reserves for Energy loans >10% Period-end Loans . Exposure $3.4B / 60% utilization ($ in millions) . Spring redeterminations 90% complete Services 3,559 Midstream . 20% average decrease in borrowing base Exploration & Production . 85% of customers’ borrowing bases 566 3,070 lower . Hedged 50% or more of production 480 454 . At least one year:Mixed 73% of customers . At least two years:18% 37% of customers 2,250 2,221 2,163 2,114 479 48 2,086 . Focus on larger, sophisticated E&P 289 94 55 1,836 50 298 companies 432 364 374 195 374 Exploration & Production 295 ($ in millions; 2Q20 Period-end) 2,539 2,111 1,771 1,741 Oil 1,587 1,695 1,662 1,346 60% Oil/Gas Total 22% 1,662 2014 2015 2016 2017 2018 2019 1Q20 2Q20 Gas 18% 6/30/20 10

Credit Exposure to “at risk” industries well reserved Period- % of total % Category Category Comments end loans loans criticized1 Retail CRE $784 1.5% 0.0% Well capitalized developers (low LTV) Hotels/Casinos $748 1.4% 5.4% Strong liquidity; Well capitalized Arts / Recreation $357 0.7% 14.0% Larger, well-established entities Sports franchises $321 0.6% 0.2% Primarily professional league teams Retail goods & services $283 0.5% 8.2% Granular portfolio Total all Other2 $1,038 1.9% 8.2% 11 distinct categories Social Distancing Total $3,531 6.6% 5.6% Auto Production $1,472 2.8% 21.1% Primarily Tier 1 & Tier 2 suppliers; $1MM NALs Leveraged Loans3 $2,092 3.9% 17.8% 86% are middle market companies Payment Deferrals . $4.5B payment deferrals granted (primarily commercial) . Requests for second deferral have been minimal . 2,100 customers . Substantially all performing at time of deferral . Nominal new requests since early June 6/30/20; in millions categories ● 1Period-end category criticized loans / category loans ● 2Includes airlines, restaurants/bars, childcare, coffee shops, cruise lines, education, gasoline/C stores, religious organizations, senior living, freight, travel arrangement 3Higher-risk commercial & industry total $2.4B, eliminated overlap with other categories ● 11

Noninterest Income Strong card fees as transaction volumes increased with stimulus payments Noninterest Income1,2 ($ in millions) + $9MM Card fees + $8MM Securities trading (other) 266 256 250 247 + $5MM Deferred comp (other) 237 (offset in noninterest expense) + $2MM Securities gains + $2MM Customer derivative income (other) ‒ $7MM Deposit Service Charges ‒ $3MM Bank-owned Life Insurance (BOLI) ‒ $2MM Brokerage ‒ $2MM Fiduciary ‒ $2MM Foreign Exchange 2Q19 3Q19 4Q19 1Q20 2Q20 2Q20 compared to 1Q20 ● 1Losses related to repositioning of securities portfolio of $(8)MM in 2Q19 ● 2Includes gain(loss) related to deferred comp plan of -0- 2Q19, $3MM 3Q19, $3MM 4Q19, ($3MM) 1Q20 & $2MM 2Q20 (offset in noninterest expense) 12

Noninterest Expense Includes COVID-19 & PPP related costs Noninterest Expense ($ in millions) + $7MM Salaries & benefits + $8MM Salaries (merit & Promise Pay) 451 440 + $5MM Deferred Comp (offset in 424 435 425 noninterest income) ‒ $6MM Payroll taxes (seasonal) + $5MM Outside Processing + $2MM Software 2Q19 3Q19 4Q19 1Q20 2Q20 2Q20 compared to 1Q20 13

Capital Management Maintain solid capital base through recessionary environment Capital Ratios1 (2Q20) Capital management objectives Regulatory Minimum + Capital Conservation Buffer 12.9% . Supporting customers: loans to middle 10.6% market, small businesses & consumers 10.0% 10.5% . Maintain attractive dividend yield 8.5% . $98MM 2Q20 payout 7.0% . Ample Holdco cash to support dividend . Share buyback program suspended2 • Average shares fell 1.1MM, reflecting 3.2MM shares repurchased in 1Q20 CET1 Tier 1 Capital Total Capital . Strong debt ratings3 (Holdco) . Moody’s: A3 Opportunistically moved to optimize . S&P: BBB+ . capital stack: Fitch: A- . Issued $400MM non-cumulative perpetual . Target of CET1 ~10% preferred stock at 5.625% on 5/26/20 . Added 59 bps to Tier 1 Capital 6/30/20 ● Outlook as of 7/21/20 ● 1Estimates; Deferred portion of transitional impact for CECL added 13 bps ● 2Shares repurchased under the share repurchase program ● 3Holding company debt ratings as of 7/21/20; Debt Ratings are not a recommendation to buy, sell, or hold securities 14

Management Outlook 3Q20 expectation based on recessionary conditions Average + Lending to small businesses (full quarter benefit of PPP) Loans ‒ More than offset by Mortgage Banker, Large Corporate & National Dealer Average . Relatively stable as customers utilize economic stimulus proceeds Deposits Net Interest ‒ Net impact of lower rates alone ~$10-15MM (1-Month LIBOR 17 bps & deposit rates 20 bps) Income ‒ Lower loan balances offset by lower wholesale debt & 1 additional day Credit . Reflective of environment: duration/severity of COVID-19 & resulting economic effects Quality Noninterest + Higher service charges on deposits as activity increases 1 ‒ More than offset by reduced activity (card) & lower market based fees (investment banking & Income derivatives); security trading ($8MM 2Q20) & deferred comp not to repeat Noninterest + Technology & occupancy projects, marketing & staff insurance (seasonal) as well as charitable contributions Expenses1 ‒ Mostly offset by continued expense discipline and reduction in Covid-19 related costs . Declare first preferred dividend Capital . Focus on supporting customers & maintaining attractive common dividend Outlook as of 7/21/20 ● 3Q20 outlook compared to 2Q20 ● 1Assumes no deferred comp asset returns (2Q20 $2MM) 15

Well positioned to navigate these challenging times CUSTOMER FOCUSED DIVERSIFIED CREDIT DISCIPLINE . Long-tenured, experienced . Diverse geographic . Conservative underwriting team with deep expertise footprint standards . Supporting customers’ . Balanced exposure to a . Superior credit performance financial needs for 170+ yrs wide variety of industries through last recession WELL CAPITALIZED ROBUST LIQUIDITY STRONG DEBT RATINGS A3 . 9.97% CET1 Ratio1 . $45B available liquidity Maintain strong ratings2 . 10.56 Tier 1 Ratio1 sources . Moody’s: A3 . . $8.7B Total Capital1 . 79% Loan/ Deposit Ratio S&P: BBB+ . Fitch: A- 6/30/20 ● 1Estimates ● 2Holding company debt ratings as of 7/21/20; Debt Ratings are not a recommendation to buy, sell, or hold securities 16

Appendix

Average Loans by Business and Market By Line of Business 2Q20 1Q20 2Q19 By Market 2Q20 1Q20 2Q19 Middle Market Michigan $13.0 $12.2 $12.7 General 12.7 12.0 12.4 Energy 2.2 2.2 2.5 California 18.7 18.0 18.8 National Dealer Services 6.2 6.8 7.9 Texas 11.2 10.6 10.7 Entertainment 0.7 0.7 0.8 Tech. & Life Sciences 1.5 1.2 1.3 Other Markets1 10.6 8.8 8.8 Equity Fund Services 2.3 2.6 2.6 TOTAL $53.5 $49.6 $51.0 Environmental Services 1.4 1.3 1.1 Total Middle Market $27.0 $26.7 $28.6 Corporate Banking Loan Portfolio US Banking 3.5 3.0 3.0 ($ in billions; 2Q20 Period-end) 2 International 1.5 1.2 1.3 Fixed Rate 26% Commercial Real Estate 6.7 6.2 5.5 Mortgage Banker Finance 3.3 2.0 2.0 Business Banking 4.0 3.4 3.5 Prime- based COMMERCIAL BANK $45.9 $42.6 $43.9 Total 1 Month 13% Retail Banking 2.5 2.1 2.1 $53.4 LIBOR 53% RETAIL BANK $2.5 $2.1 $2.1 >1 Month Private Banking 5.1 4.9 4.9 LIBOR WEALTH MANAGEMENT $5.1 $4.9 $4.9 8% TOTAL $53.5 $49.6 $51.0 $ in billions ● Totals shown above may not foot due to rounding ● 1Other Markets includes PPP Loans, Florida, Arizona, the International Finance Division and businesses that have a significant presence outside of the three primary geographic markets ● 2Fixed rate loans include $5.55B receive fixed / pay floating (30-day LIBOR) interest rate swaps 18

Average Deposits by Business and Market By Line of Business 2Q20 1Q20 2Q19 By Market 2Q20 1Q20 2Q19 Middle Market Michigan $23.5 $20.7 $19.8 General $18.1 $14.3 $13.4 Energy 0.5 0.5 0.4 California 18.5 17.5 16.3 National Dealer Services 0.4 0.3 0.3 Texas 10.2 9.2 8.7 Entertainment 0.2 0.1 0.1 Other Markets1 11.0 8.0 7.8 Tech. & Life Sciences 5.5 5.1 4.7 Finance/Other2 1.1 1.3 2.4 Equity Fund Services 0.8 0.9 0.8 TOTAL $64.3 $56.8 $55.0 Environmental Services 0.2 0.1 0.2 Total Middle Market $25.7 $21.4 $19.9 Corporate Banking US Banking 2.4 2.0 1.7 International 1.8 1.5 1.6 . Middle Market: Serving companies with Commercial Real Estate 1.8 1.7 1.5 revenues generally between $30-$500MM Mortgage Banker Finance 0.8 0.6 0.7 . Corporate Banking: Serving companies Business Banking 3.8 3.0 2.9 (and their U.S. based subsidiaries) with COMMERCIAL BANK $36.3 $30.2 $28.3 revenues generally over $500MM Retail Banking 22.6 21.2 20.6 . RETAIL BANK $22.6 $21.2 $20.6 Business Banking: Serving companies with revenues generally under $30MM Private Banking 3.8 3.7 3.5 WEALTH MANAGEMENT $4.2 $4.0 $3.7 Finance/Other2 1.1 1.3 2.4 TOTAL $64.3 $56.8 $55.0 $ in billions ● Totals shown above may not foot due to rounding ● 1Other Markets includes Florida, Arizona, the International Finance Division and businesses that have a significant presence outside of the three primary geographic markets ● 2Finance/Other includes items not directly associated with the geographic markets or the three major business segments 19

Mortgage Banker Finance 55+ years experience with reputation for consistent, reliable approach Average Loans ($ in millions) Actual MBA Mortgage Origination Volumes1 . Provide warehouse financing: bridge from 1000 residential mortgage origination to sale to 900 800 end market 700 600 500 . Extensive backroom provides collateral 400 3,278 300 2,681 2,544 monitoring and customer service 2,521 2,352 200 2,145 2,044 2,042 1,974 1,961 1,861 1,780 1,784 1,677 100 1,450 1,435 1,335 . Focus on full banking relationships 0 . Granular portfolio with ~100 relationships 2Q16 3Q16 4Q16 1Q17 2Q17 3Q17 4Q17 1Q18 2Q18 3Q18 4Q18 1Q19 2Q19 3Q19 4Q19 1Q20 2Q20 As of 2Q20: MBA Mortgage Originations Forecast1 . Comerica: 46% purchase ($ in billions) Purchase Refinance 1 . Industry: 40% purchase 928 . Strong credit quality 740 585 579 . No charge-offs since 2010 502 . Period-end loans: $4.2B 2Q20 3Q20 4Q20 1Q21 2Q21 6/30/20 ● 1Source: Mortgage Bankers Association (MBA) Mortgage Finance Forecast as of 7/15/20; estimated 20

Commercial Real Estate Line of Business Long history of working with well established, proven developers CRE by Property Type1 CRE by Market1 ($ in millions; Period-end) ($ in millions; Period-end, based on location of property) Office Retail Single Family 8% 10% 4% Texas Other Other 32% 3% 19% Industrial / Land Carry Storage 5% 20% Total Multi use Total $5,840 3% $5,840 Michigan 5% Multifamily California 47% 44% Credit Quality . >90% of new commitments from existing ($ in millions; Period-end) 2Q19 1Q20 2Q20 customers Criticized2 $106 $87 $72 . Substantial upfront equity required Ratio 1.9% 1.3% 1.1% . 53% of portfolio3 is construction & includes Nonaccrual $2 $3 $4 robust monitoring Ratio 0.04% 0.04% 0.06% . ~4% of CRE loans are deferred Net charge-offs -0- -0- -0- . No significant net charge-offs since 2014 6/30/20 ● 1Excludes CRE line of business loans not secured by real estate ● 2Criticized loans are consistent with regulatory defined Special Mention, Substandard & Doubtful categories ● 3Period-end loans 21

recreational recreational vehicles, and non-floor plan loans) 6/30/20 Toyota/Lexus 70+ years70+ of floor planlending National Dealer Services ● 1 Other Other includes obligations where primary a franchise is indeterminable (rental car and leasing companies, heavy truck, 13% 15% Other Other Asian 1 Michigan 26% Other 10% Other Texas 7% 26% Michigan California 57% 14% (Based on period-end loan outstandings) Geographic Dispersion Franchise Distribution Other Other European $5.4B Total Honda/Acura 12% 15% Nissan/ Nissan/ Infiniti 4% Mercedes Ford 9% Fiat/Chrysler 3% GM 7% 8% 2Q16 4.0 6.5 . . . . 3Q16 3.8 6.3 and performance Robust ofmonitoring company inventory Strong credit quality dealerships in group) “Mega Focus on Dealer” (five or more tier Top strategy 4Q16 4.0 6.6 1Q17 4.1 6.8 2Q17 4.3 7.1 3Q17 3.9 6.9 Average Loans 4Q17 4.1 7.1 ($ ($ in billions) 1Q18 4.1 7.3 Plan Floor 2Q18 4.2 7.4 3Q18 3.8 7.0 4Q18 4.0 7.4 1Q19 4.4 7.8 2Q19 4.5 7.9 3Q19 4.1 7.5 4Q19 4.0 7.3 1Q20 3.6 6.8 22 2Q20 2.8 6.2

Technology & Life Sciences Deep expertise & strong relationships with top-tier investors Average Loans Average Deposits ($ in millions) ($ in millions) 5,471 5,149 5,126 4,652 4,637 1,517 1,305 1,251 1,181 1,193 2Q19 3Q19 4Q19 1Q20 2Q20 2Q19 3Q19 4Q19 1Q20 2Q20 Customer Segment Overview1 . ~410 customers (Approximate; 2Q20 Period-end loans) . Manage concentration to numerous Growth verticals to ensure widely diversified 55% portfolio Late Stage Total . Closely monitor cash balances & 10% $1.5B maintain robust backroom operation . 11 offices throughout US & Canada Early Stage Leveraged 18% Finance 17% 6/30/20 ● 1Includes estimated distribution of PPP loans 23

Equity Fund Services Deep expertise & strong relationships with top-tier investors Average Loans ($ in millions) . Customized credit, treasury management & investment solutions for venture capital 2,602 2,606 & private equity firms 2,549 2,498 . National scope with customers in 17 2,277 states & Canada . ~260 customers . Drive connectivity with other teams . Energy . Middle Market . TLS . Environmental Services . Private Banking . Strong credit profile . No charge-offs . No criticized loans 2Q19 3Q19 4Q19 1Q20 2Q20 6/30/20 24

Holding Company Debt Rating Senior Unsecured/Long-Term Issuer Rating Moody’s S&P Fitch Cullen Frost A3 A- - M&T Bank A3 A- A BOK Financial A3 BBB+ A Comerica A3 BBB+ A- Fifth Third Baa1 BBB+ A- Huntington Baa1 BBB+ A- KeyCorp Baa1 BBB+ A- Regions Financial Baa2 BBB+ BBB+ Zions Bancorporation Baa2 BBB+ BBB+ First Horizon National Corp Baa3 BBB- BBB Citizens Financial Group - BBB+ BBB+ Synovus Financial - BBB- BBB As of 7/13/20 ● Source: S&P Global Market Intelligence ● Debt Ratings are not a recommendation to buy, sell, or hold securities ● Zions Bancorporation ratings are for the bank 25

