Attached files
| file | filename |
|---|---|
| EX-99.2 - EX-99.2 - INTERNATIONAL BUSINESS MACHINES CORP | ibm-20200720xex99d2.htm |
| EX-99.1 - EX-99.1 - INTERNATIONAL BUSINESS MACHINES CORP | ibm-20200720xex99d1.htm |
| 8-K - 8-K - INTERNATIONAL BUSINESS MACHINES CORP | ibm-20200720x8k.htm |
Exhibit 99.3
| IBM 2Q 2020 Earnings July 20, 2020 ibm.com/investor |
| Forward Looking Statements and Non-GAAP Information Certain comments made in this presentation may be characterized as forward looking under the Private Securities Litigation Reform Act of 1995. Forward-looking statements are based on the company’s current assumptions regarding future business and financial performance. Those statements by their nature address matters that are uncertain to different degrees. Those statements involve a number of factors that could cause actual results to differ materially. Additional information concerning these factors is contained in the Company’s filings with the SEC. Copies are available from the SEC, from the IBM website, or from IBM Investor Relations. Any forward-looking statement made during this presentation speaks only as of the date on which it is made. The company assumes no obligation to update or revise any forward-looking statements except as required by law; these charts and the associated remarks and comments are integrally related, and are intended to be presented and understood together. In an effort to provide additional and useful information regarding the company’s financial results and other financial information as determined by generally accepted accounting principles (GAAP), the company also discusses, in its earnings press release and earnings presentation materials, certain non-GAAP information including revenue for Red Hat normalized for historical comparability, revenue adjusting for divested businesses and currency, operating earnings, other “operating” financial measures, including free cash flow, net cash from operating activities excluding Global Financing receivables, and adjustments for currency. The rationale for management’s use of this non-GAAP information is included as Exhibit 99.2 to the company’s Form 8-K filed with the SEC on July 20, 2020. The reconciliation of non-GAAP information to GAAP is included on the slides entitled “Non-GAAP Supplemental Materials” in this presentation, as well as in Exhibit 99.1 to the company’s Form 8-K filed with the SEC on July 20, 2020. For other related information please visit the Company’s investor relations website at: https://www.ibm.com/investor/events/ibm-2q-2020-earnings-announcement 2 |
| Arvind Krishna Chief Executive Officer James Kavanaugh SVP, Finance & Operations, Chief Financial Officer 3 |

| CEO Perspective “Our clients see the value of IBM’s hybrid cloud platform, based on open technologies, at a time of unprecedented business disruption.” Current Environment Hybrid Cloud Platform “We are committed to building, with a growing ecosystem of partners, an enduring hybrid cloud platform that will serve as a powerful catalyst for innovation for our clients and the world.” Progress on Strategic Priorities - Arvind Krishna, IBM CEO 4 |
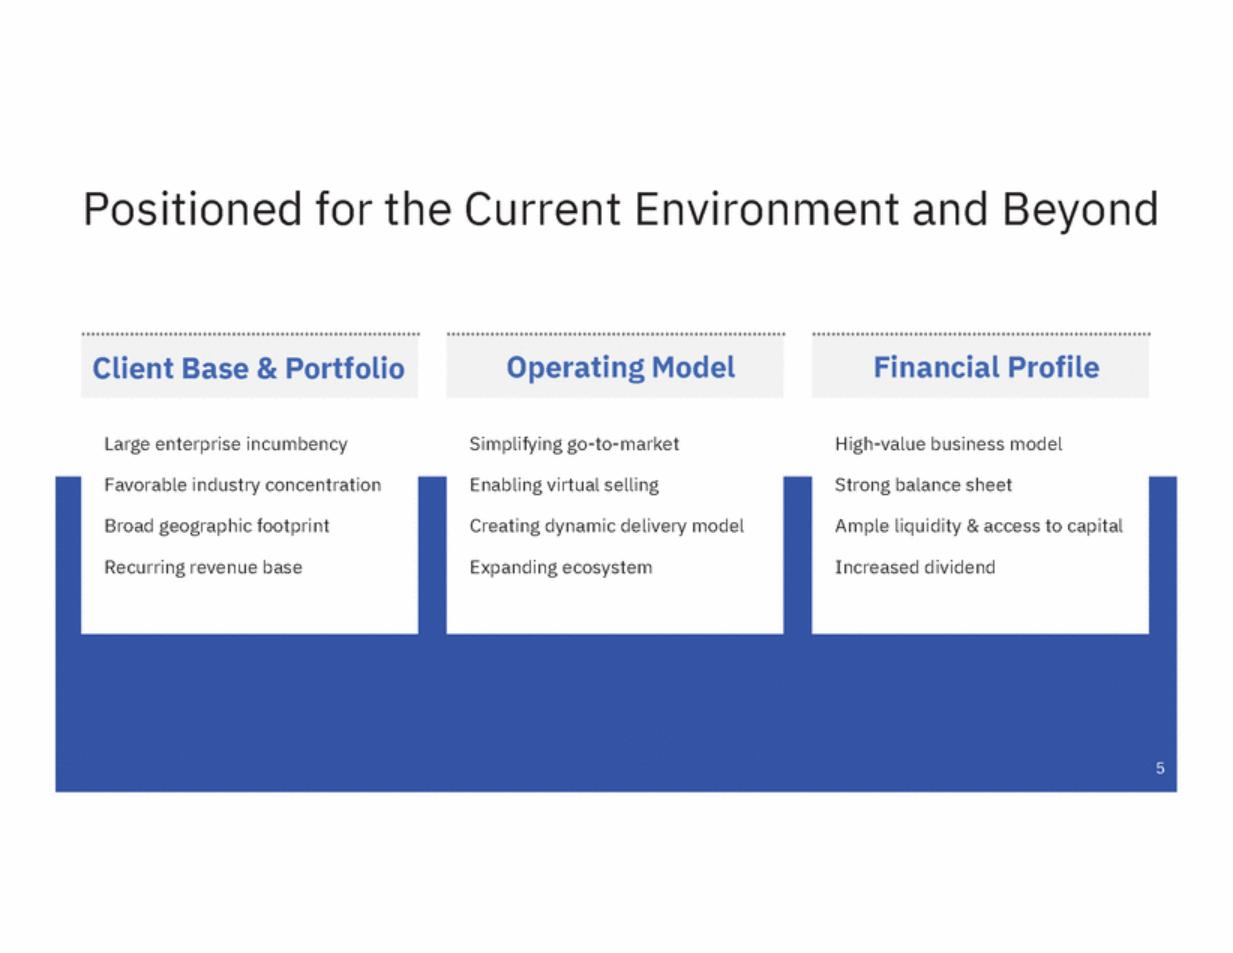
| Positioned for the Current Environment and Beyond Large enterprise incumbency Simplifying go-to-market High-value business model Favorable industry concentration Enabling virtual selling Strong balance sheet Broad geographic footprint Creating dynamic delivery model Ample liquidity & access to capital Recurring revenue base Expanding ecosystem Increased dividend 5 Operating Model Client Base & Portfolio Financial Profile |
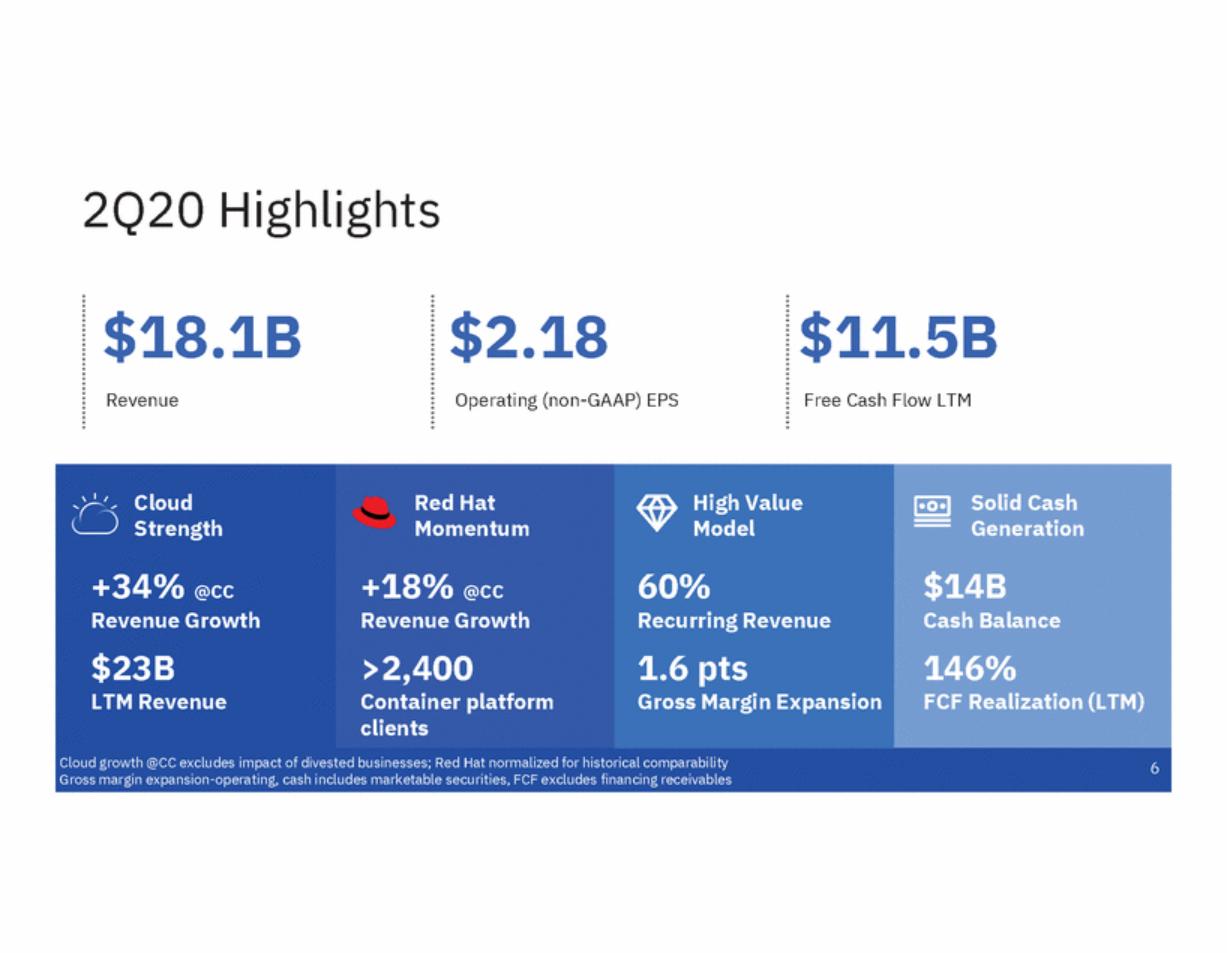
| 2Q20 Highlights $18.1B Revenue $2.18 Operating (non-GAAP) EPS $11.5B Free Cash Flow LTM Cloud Strength Solid Cash Generation +34% @CC Revenue Growth $23B LTM Revenue $14B Cash Balance 146% FCF Realization (LTM) Cloud growth @CC excludes impact of divested businesses; Red Hat normalized for historical comparability Gross margin expansion-operating, cash includes marketable securities, FCF excludes financing receivables 6 R d Hat M mentum +18% @CC Revenue Growth >2,400 Container platform clients High Value Model 60% Recurring Revenue 1.6 pts Gross Margin Expansion |
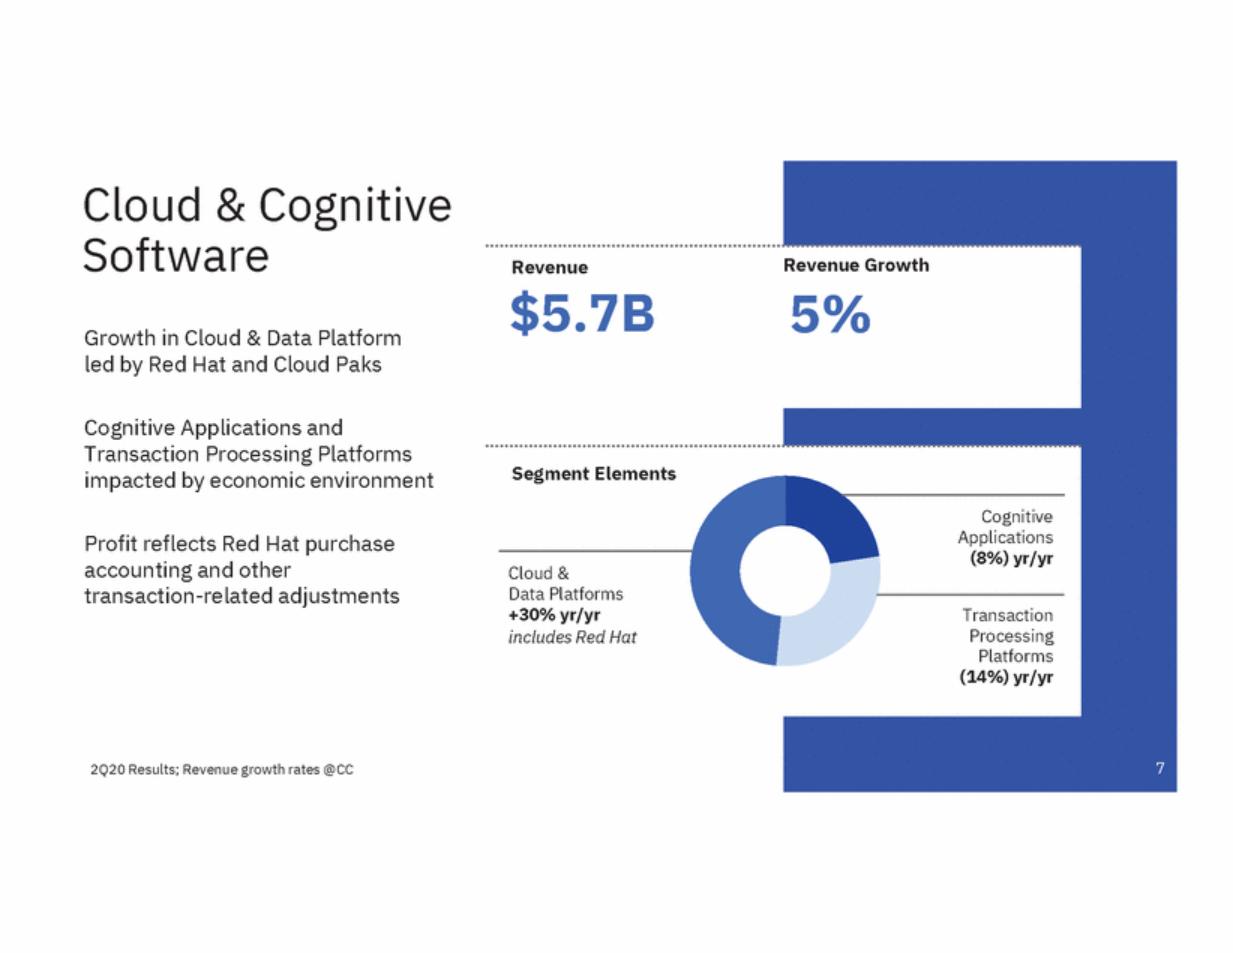
| Cloud & Cognitive Software Revenue Growth Revenue $5.7B 5% Growth in Cloud & Data Platform led by Red Hat and Cloud Paks Cognitive Applications and Transaction Processing Platforms impacted by economic environment Segment Elements Cognitive Applications (8%) yr/yr Profit reflects Red Hat purchase accounting and other transaction-related adjustments Cloud & Data Platforms +30% yr/yr includes Red Hat Transaction Processing Platforms (14%) yr/yr 7 2Q20 Results; Revenue growth rates @CC |
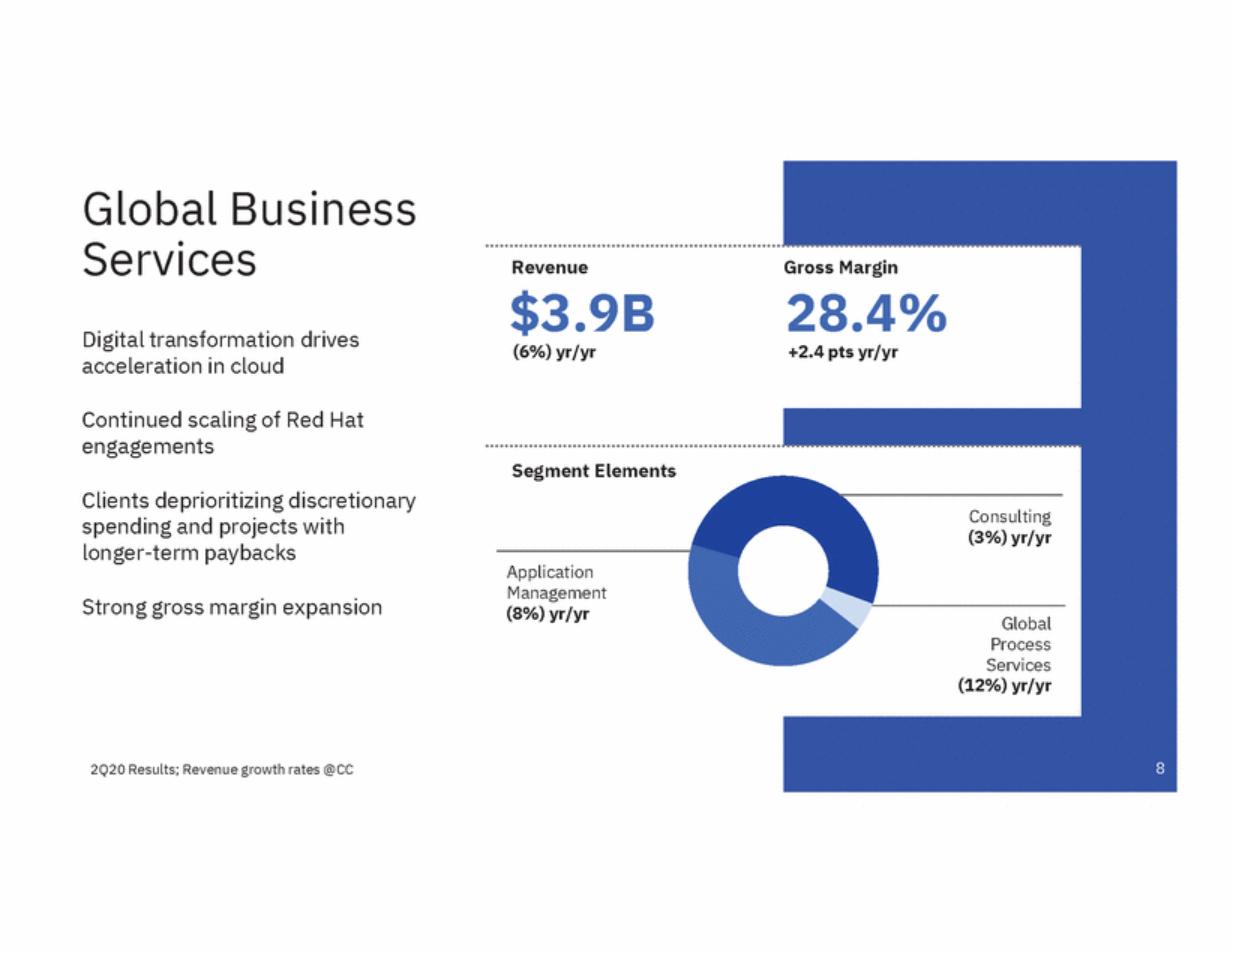
| Global Business Services Digital transformation drives acceleration in cloud Revenue $3.9B (6%) yr/yr Gross Margin 28.4% +2.4 pts yr/yr Continued scaling of Red Hat engagements Segment Elements Clients deprioritizing discretionary spending and projects with longer-term paybacks Consulting (3%) yr/yr Application Management (8%) yr/yr Strong gross margin expansion Global Process Services (12%) yr/yr 8 2Q20 Results; Revenue growth rates @CC |
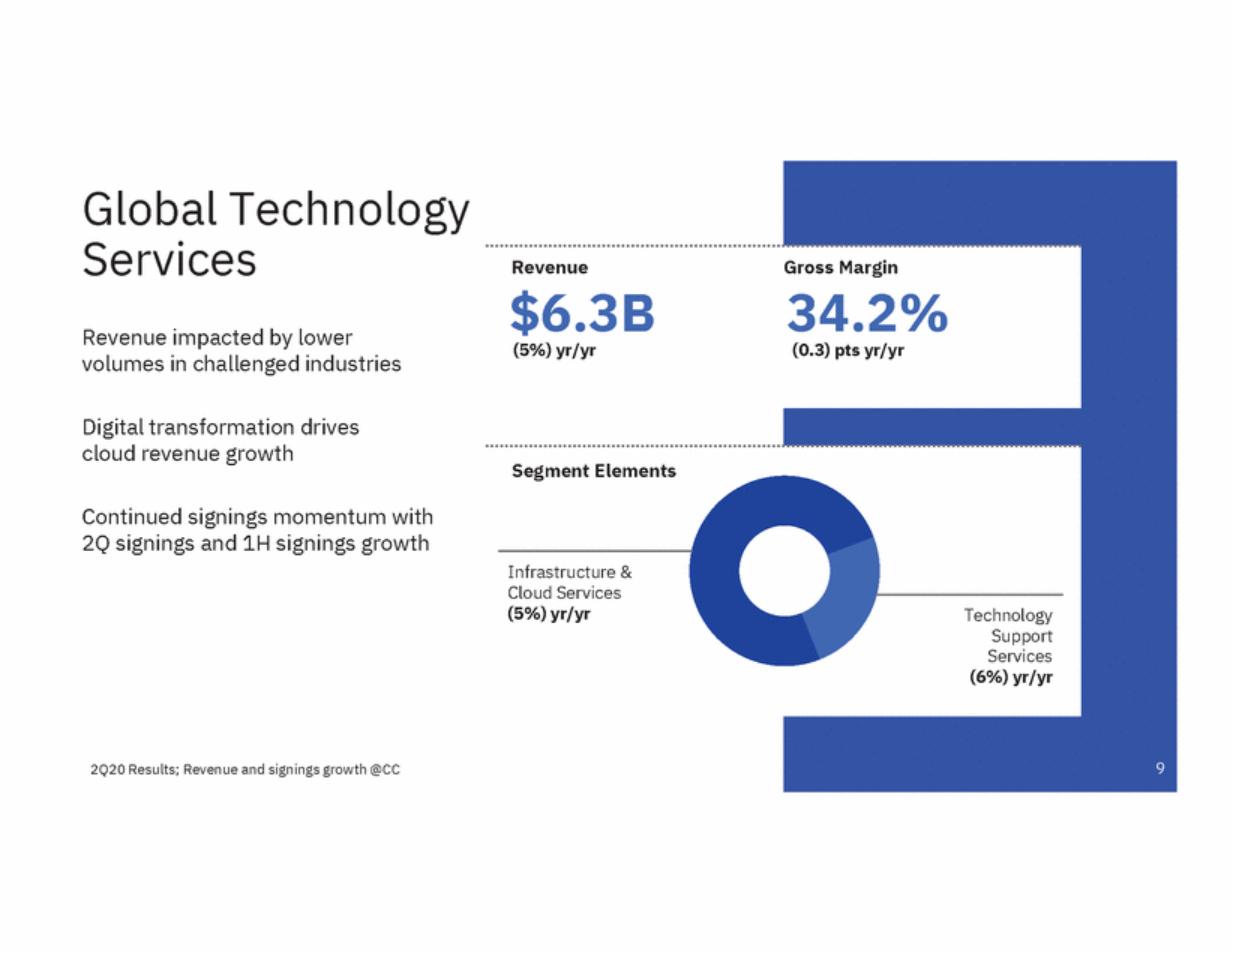
| Global Technology Services Revenue impacted by lower volumes in challenged industries Revenue $6.3B (5%) yr/yr Gross Margin 34.2% (0.3) pts yr/yr Digital transformation drives cloud revenue growth Segment Elements Continued signings momentum with 2Q signings and 1H signings growth Infrastructure & Cloud Services (5%) yr/yr Technology Support Services (6%) yr/yr 9 2Q20 Results; Revenue and signings growth @CC |
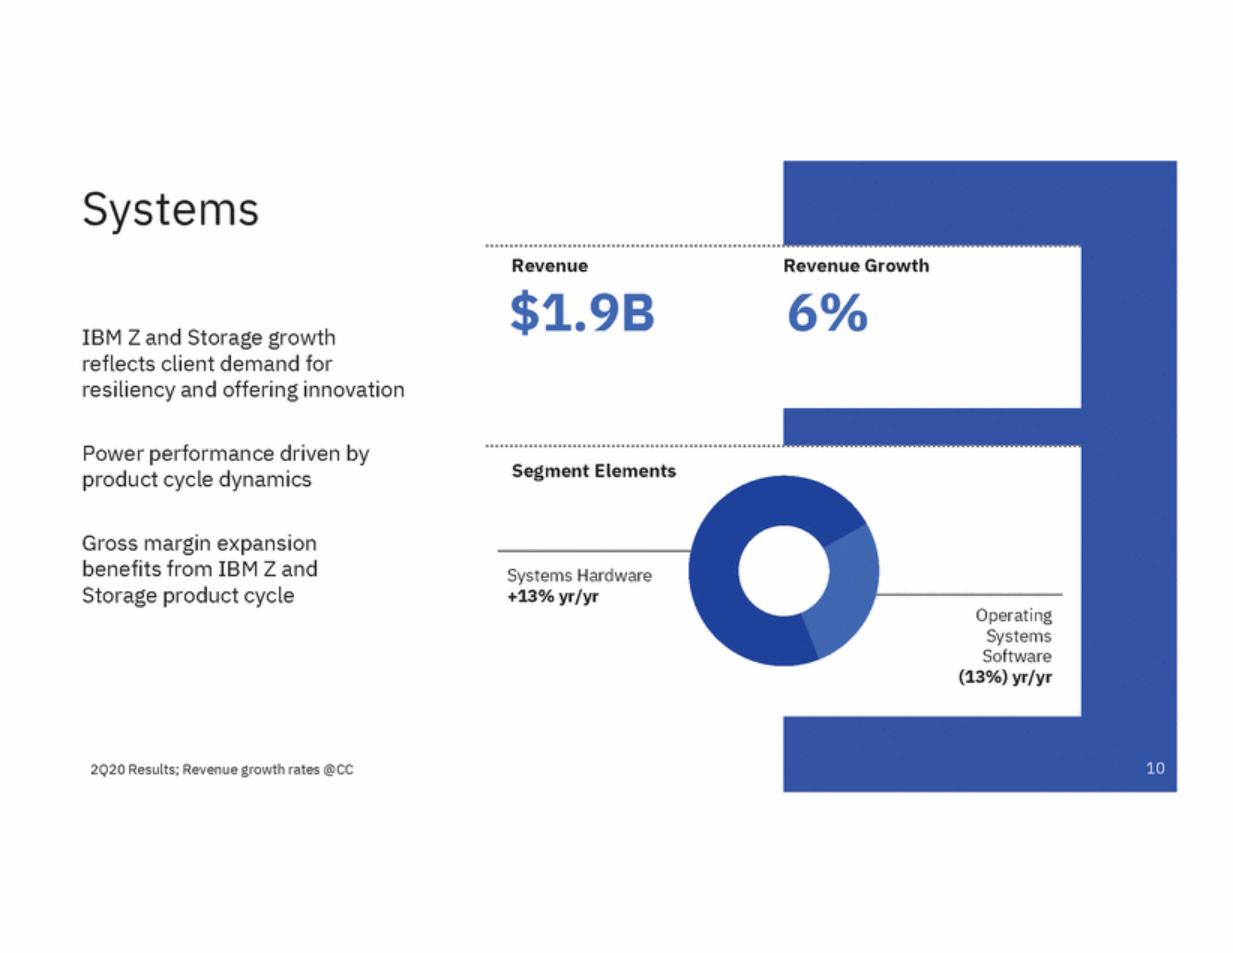
| Systems Revenue $1.9B Revenue Growth 6% IBM Z and Storage growth reflects client demand for resiliency and offering innovation Power performance driven by product cycle dynamics Segment Elements Gross margin expansion benefits from IBM Z and Storage product cycle Systems Hardware +13% yr/yr Operating Systems Software (13%) yr/yr 10 2Q20 Results; Revenue growth rates @CC |
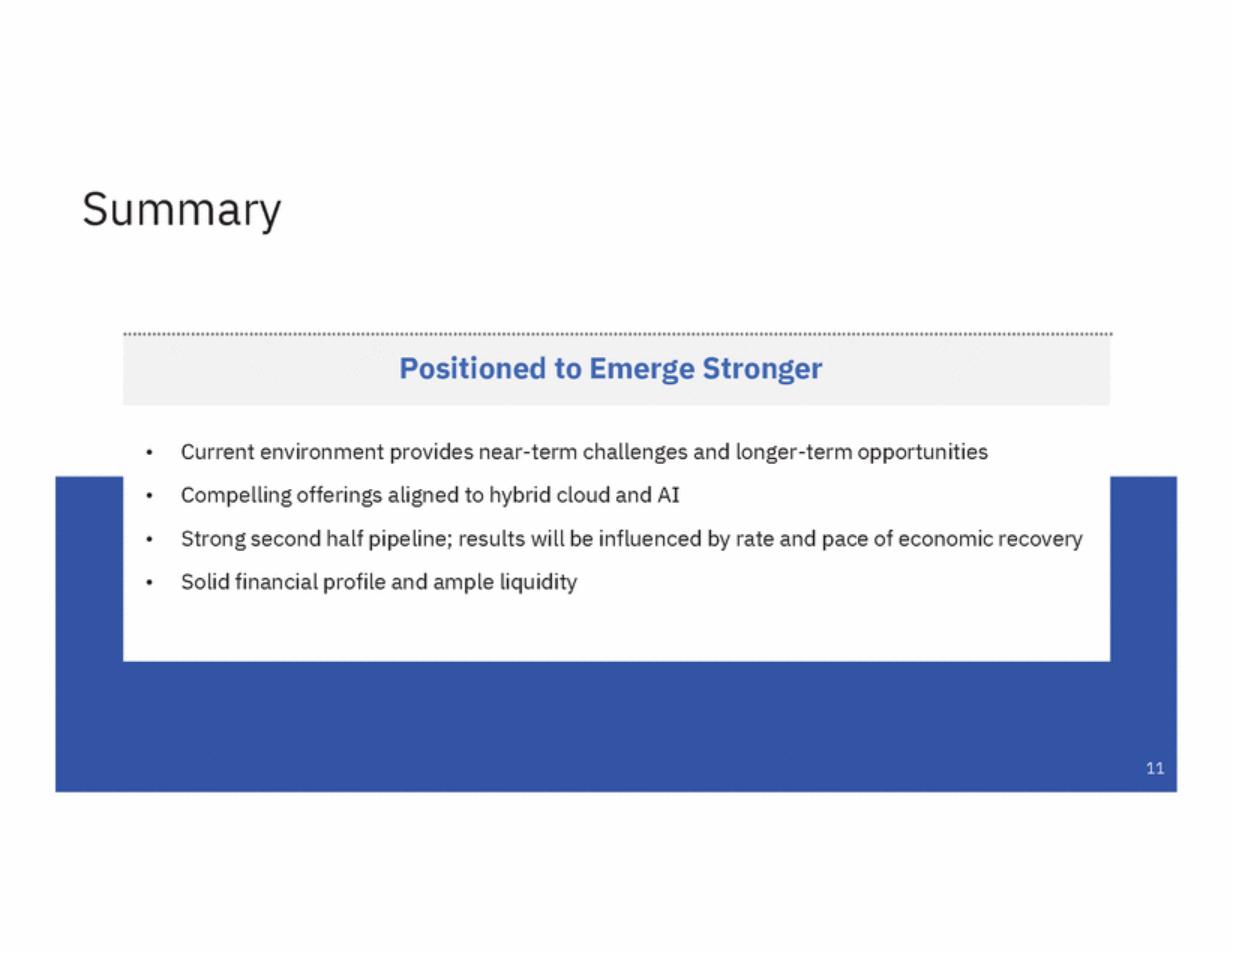
| Summary Current environment provides near-term challenges and longer-term opportunities • • Compelling offerings aligned to hybrid cloud and AI Strong second half pipeline; results will be influenced by rate and pace of economic recovery Solid financial profile and ample liquidity • • 11 Positioned to Emerge Stronger |
| ibm.com/investor |

| Supplemental Materials Currency – Impact on Revenue Growth Revenue and P&L Highlights Services Segments Details Software & Systems Segment Details Expense Summary Balance Sheet Summary Cash Flow Summary Cash Flow (ASC 230) Non-GAAP Supplemental Materials ● ● ● ● ● ● ● ● ● Some columns and rows in these materials, including the supplemental exhibits, may not add due to rounding Supplemental Materials 13 |
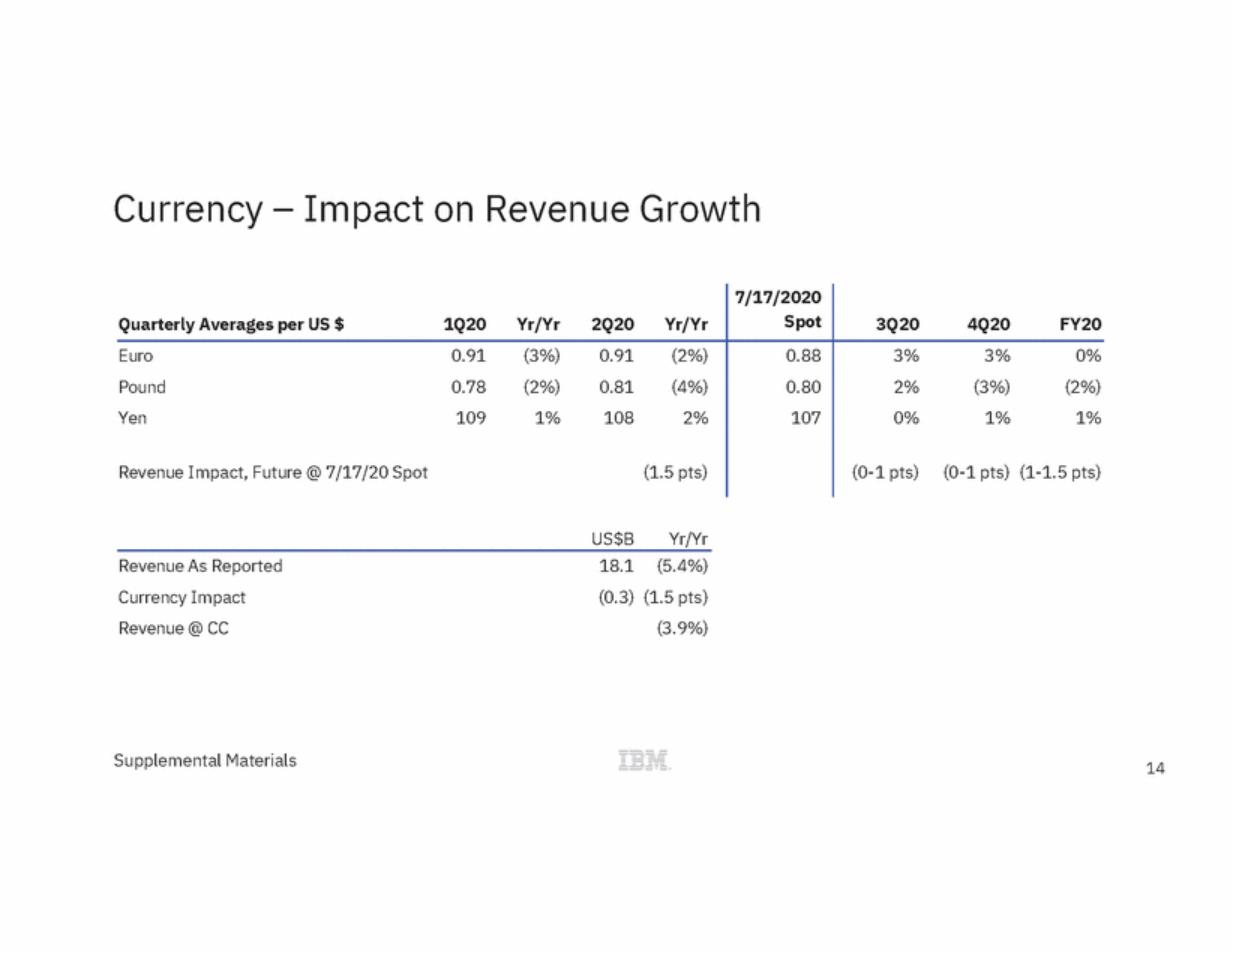
| Currency – Impact on Revenue Growth US$B Yr/Yr Revenue As Reported Currency Impact Revenue @ CC 18.1 (0.3) (5.4%) (1.5 pts) (3.9%) Supplemental Materials 14 Quarterly Averages per US $ 1Q20 Yr/Yr2Q20 Yr/Yr 7/17/2020 Spot 3Q20 4Q20 FY20 Euro 0.91 (3%) 0.91 (2%) Pound 0.78 (2%) 0.81 (4%) Yen 109 1% 108 2% Revenue Impact, Future @ 7/17/20 Spot (1.5 pts) 0.88 0.80 107 3% 3% 0% 2% (3%) (2%) 0% 1% 1% (0-1 pts) (0-1 pts) (1-1.5 pts) |
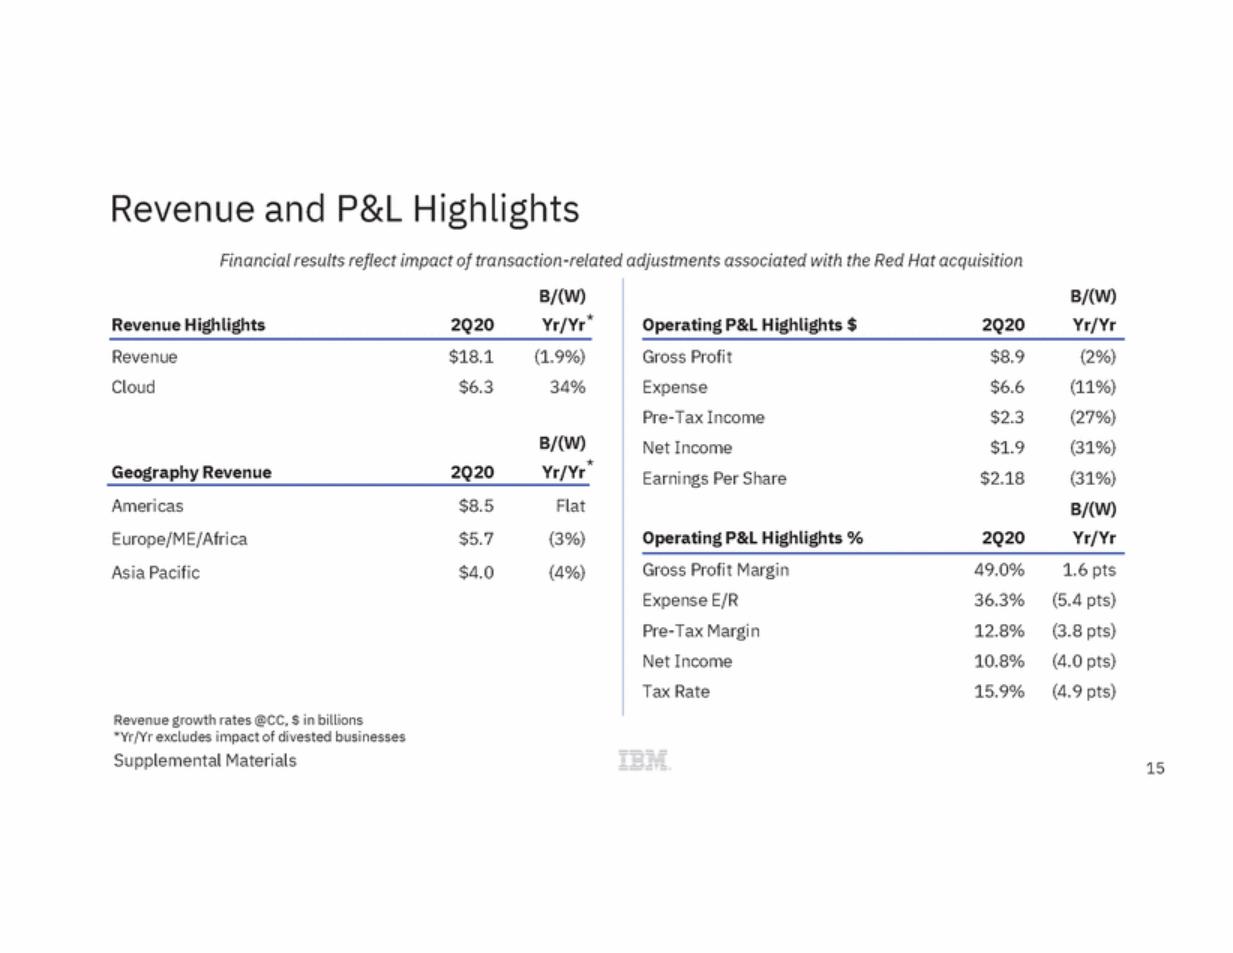
| Revenue and P&L Highlights Financial results reflect impact of transaction-related adjustments associated with the Red Hat acquisition B/(W) Yr/Yr* B/(W) Yr/Yr Revenue Highlights 2Q20 Operating P&L Highlights $ 2Q20 Revenue Cloud $18.1 $6.3 (1.9%) 34% Gross Profit Expense Pre-Tax Income Net Income Earnings Per Share $8.9 $6.6 $2.3 $1.9 $2.18 (2%) (11%) (27%) (31%) (31%) B/(W) Yr/Yr B/(W) Yr/Yr* Geography Revenue 2Q20 Americas Europe/ME/Africa Asia Pacific $8.5 $5.7 $4.0 Flat (3%) (4%) Operating P&L Highlights % 2Q20 Gross Profit Margin Expense E/R Pre-Tax Margin Net Income Tax Rate 49.0% 36.3% 12.8% 10.8% 15.9% 1.6 pts (5.4 pts) (3.8 pts) (4.0 pts) (4.9 pts) Revenue growth rates @CC, $ in billions *Yr/Yr excludes impact of divested businesses Supplemental Materials 15 |
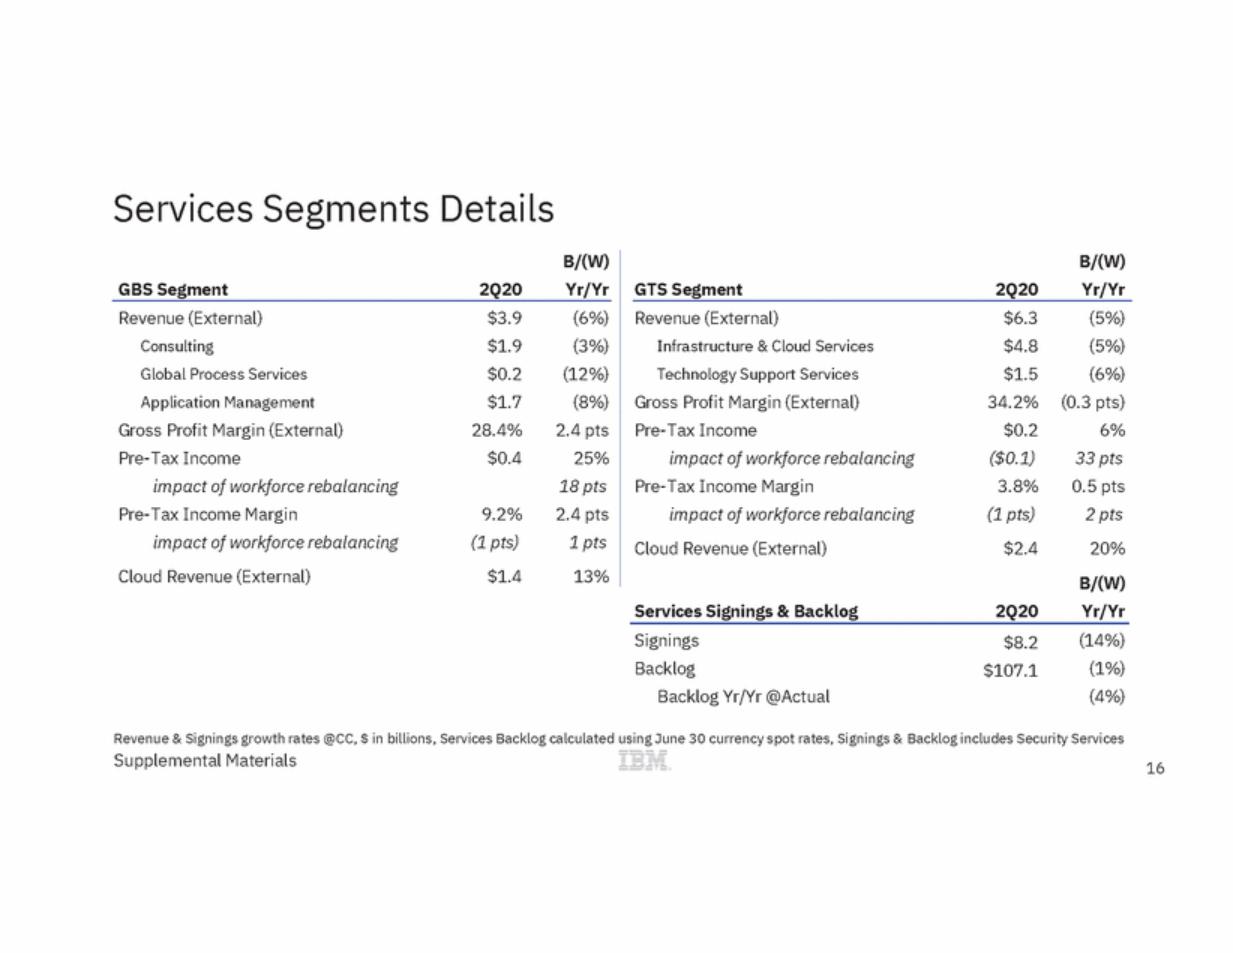
| Services Segments Details B/(W) Yr/Yr B/(W) Yr/Yr GBS Segment 2Q20 GTS Segment 2Q20 Revenue (External) Consulting Global Process Services Application Management Gross Profit Margin (External) Pre-Tax Income impact of workforce rebalancing Pre-Tax Income Margin impact of workforce rebalancing Cloud Revenue (External) $3.9 $1.9 $0.2 $1.7 28.4% $0.4 (6%) (3%) (12%) (8%) 2.4 pts 25% 18 pts 2.4 pts 1 pts 13% Revenue (External) Infrastructure & Cloud Services Technology Support Services Gross Profit Margin (External) Pre-Tax Income impact of workforce rebalancing Pre-Tax Income Margin impact of workforce rebalancing Cloud Revenue (External) $6.3 $4.8 $1.5 34.2% $0.2 ($0.1) 3.8% (1 pts) $2.4 (5%) (5%) (6%) (0.3 pts) 6% 33 pts 0.5 pts 2 pts 20% 9.2% (1 pts) $1.4 B/(W) Yr/Yr Services Signings & Backlog 2Q20 Signings Backlog Backlog Yr/Yr @Actual (14%) (1%) (4%) $8.2 $107.1 Revenue & Signings growth rates @CC, $ in billions, Services Backlog calculated using June 30 currency spot rates, Signings & Backlog includes Security Services Supplemental Materials 16 |
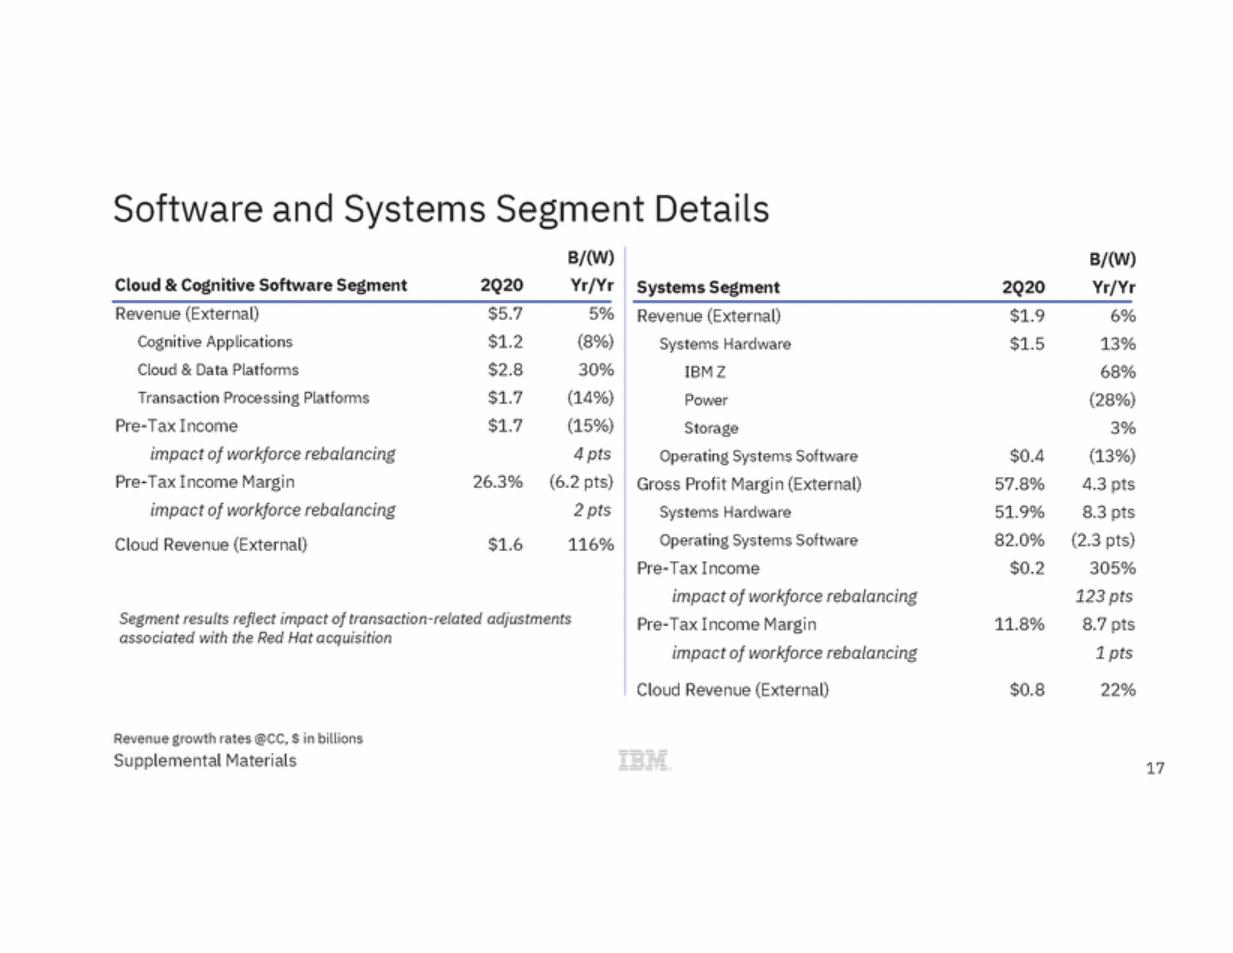
| Software and Systems Segment Details B/(W) Yr/Yr B/(W) Yr/Yr Cloud & Cognitive Software Segment 2Q20 Systems Segment 2Q20 Revenue (External) Cognitive Applications Cloud & Data Platforms Transaction Processing Platforms Pre-Tax Income impact of workforce rebalancing Pre-Tax Income Margin impact of workforce rebalancing Cloud Revenue (External) $5.7 $1.2 $2.8 $1.7 $1.7 5% (8%) 30% (14%) (15%) 4 pts (6.2 pts) 2 pts 116% Revenue (External) Systems Hardware IBM Z Power Storage Operating Systems Software Gross Profit Margin (External) Systems Hardware Operating Systems Software Pre-Tax Income impact of workforce rebalancing Pre-Tax Income Margin impact of workforce rebalancing $1.9 $1.5 6% 13% 68% (28%) 3% (13%) 4.3 pts 8.3 pts (2.3 pts) 305% 123 pts 8.7 pts 1 pts $0.4 57.8% 51.9% 82.0% $0.2 26.3% $1.6 Segment results reflect impact of transaction-related adjustments associated with the Red Hat acquisition 11.8% Cloud Revenue (External) $0.8 22% Revenue growth rates @CC, $ in billions Supplemental Materials 17 |
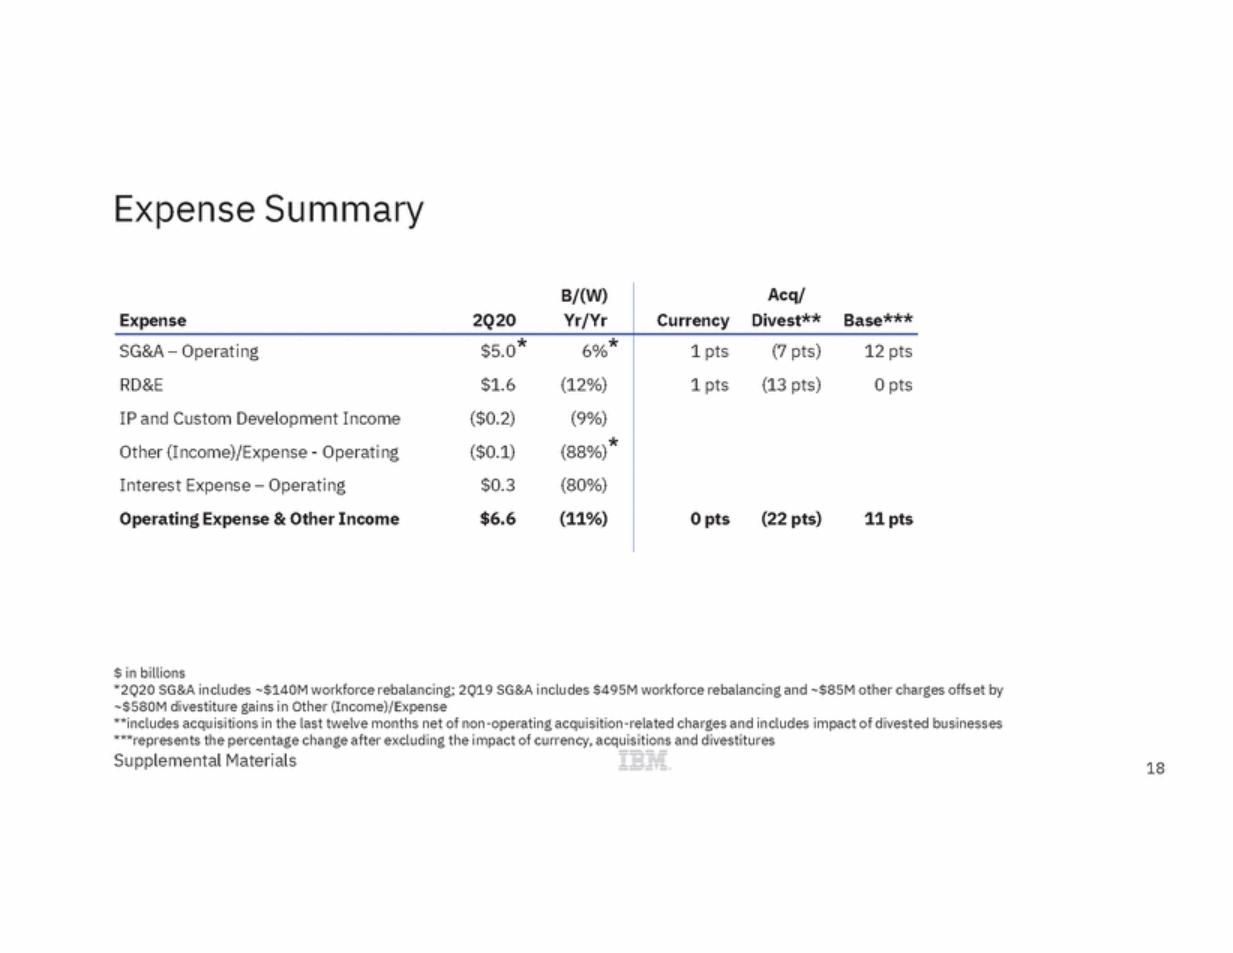
| Expense Summary $ in billions *2Q20 SG&A includes ~$140M workforce rebalancing; 2Q19 SG&A includes $495M workforce rebalancing and ~$85M other charges offset by ~$580M divestiture gains in Other (Income)/Expense **includes acquisitions in the last twelve months net of non-operating acquisition-related charges and includes impact of divested businesses ***represents the percentage change after excluding the impact of currency, acquisitions and divestitures Supplemental Materials 18 B/(W) Expense2Q20 Yr/Yr Acq/ CurrencyDivest**Base*** SG&A – Operating$5.0* 6%* RD&E$1.6 (12%) IP and Custom Development Income ($0.2) (9%) Other (Income)/Expense - Operating($0.1) (88%)* Interest Expense – Operating $0.3 (80%) Operating Expense & Other Income$6.6 (11%) 1 pts (7 pts) 12 pts 1 pts (13 pts) 0 pts 0 pts(22 pts)11 pts |
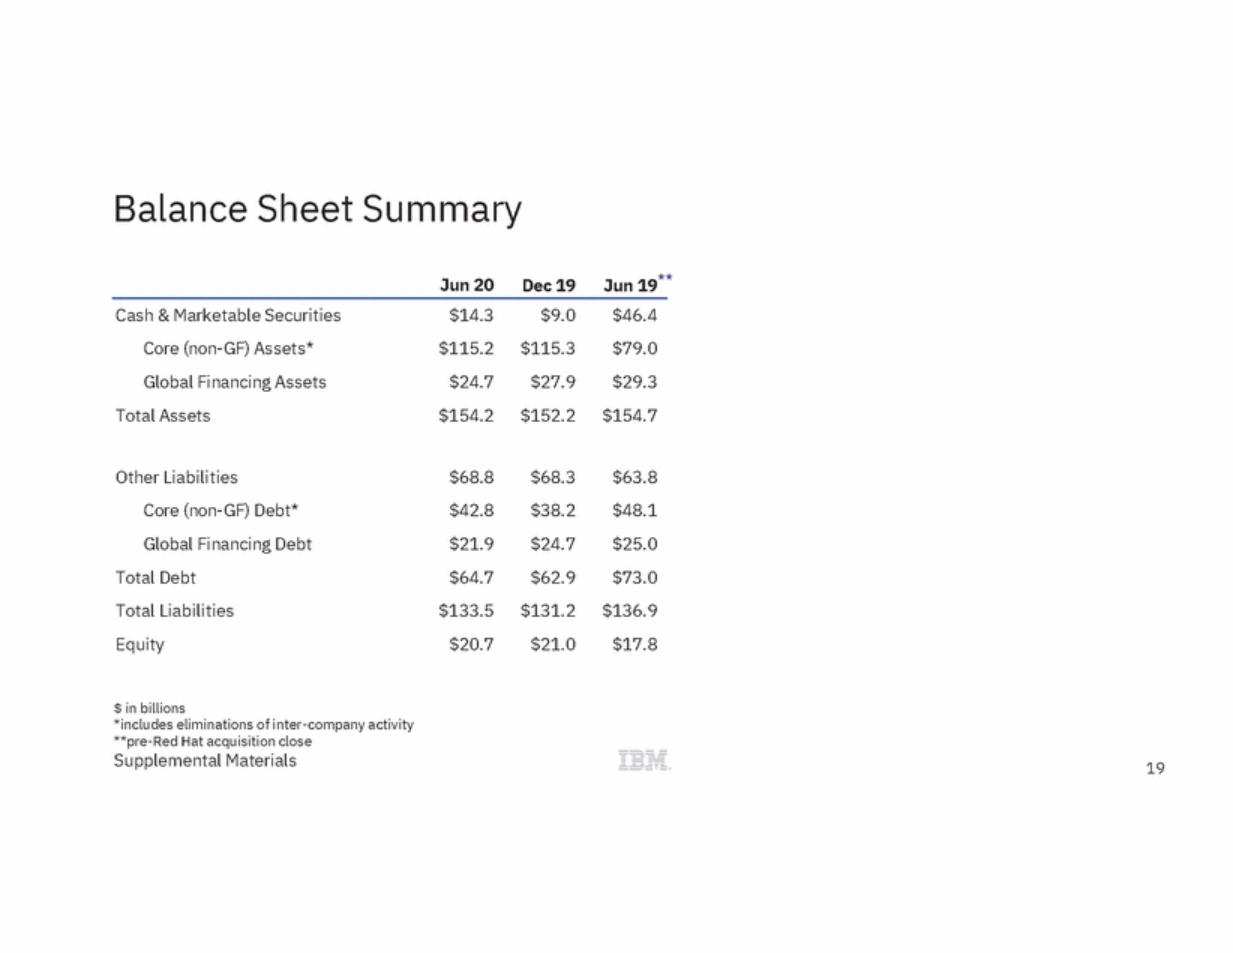
| Balance Sheet Summary Jun 19** Jun 20 Dec 19 Cash & Marketable Securities Core (non-GF) Assets* Global Financing Assets Total Assets $14.3 $115.2 $24.7 $154.2 $9.0 $115.3 $27.9 $152.2 $46.4 $79.0 $29.3 $154.7 Other Liabilities Core (non-GF) Debt* Global Financing Debt Total Debt Total Liabilities Equity $68.8 $42.8 $21.9 $64.7 $133.5 $20.7 $68.3 $38.2 $24.7 $62.9 $131.2 $21.0 $63.8 $48.1 $25.0 $73.0 $136.9 $17.8 $ in billions *includes eliminations of inter-company activity **pre-Red Hat acquisition close Supplemental Materials 19 |
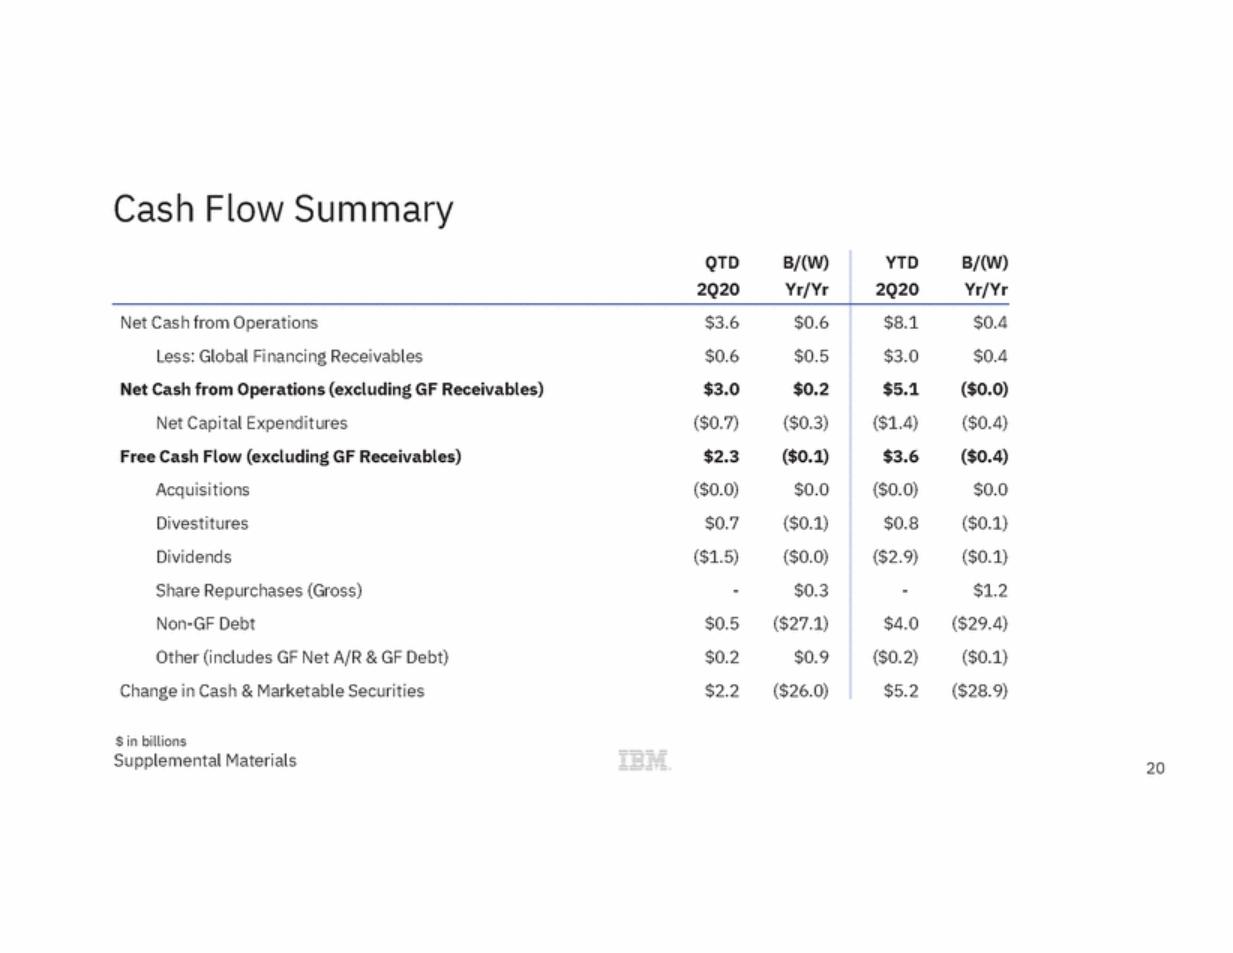
| Cash Flow Summary $ in billions Supplemental Materials 20 QTDB/(W) 2Q20Yr/Yr YTDB/(W) 2Q20 Yr/Yr Net Cash from Operations $3.6 $0.6 Less: Global Financing Receivables $0.6 $0.5 Net Cash from Operations (excluding GF Receivables)$3.0 $0.2 Net Capital Expenditures ($0.7) ($0.3) Free Cash Flow (excluding GF Receivables) $2.3 ($0.1) Acquisitions ($0.0) $0.0 Divestitures $0.7 ($0.1) Dividends ($1.5) ($0.0) Share Repurchases (Gross) - $0.3 Non-GF Debt $0.5 ($27.1) Other (includes GF Net A/R & GF Debt) $0.2 $0.9 Change in Cash & Marketable Securities $2.2 ($26.0) $8.1 $0.4 $3.0 $0.4 $5.1 ($0.0) ($1.4) ($0.4) $3.6 ($0.4) ($0.0) $0.0 $0.8 ($0.1) ($2.9) ($0.1) - $1.2 $4.0 ($29.4) ($0.2) ($0.1) $5.2 ($28.9) |
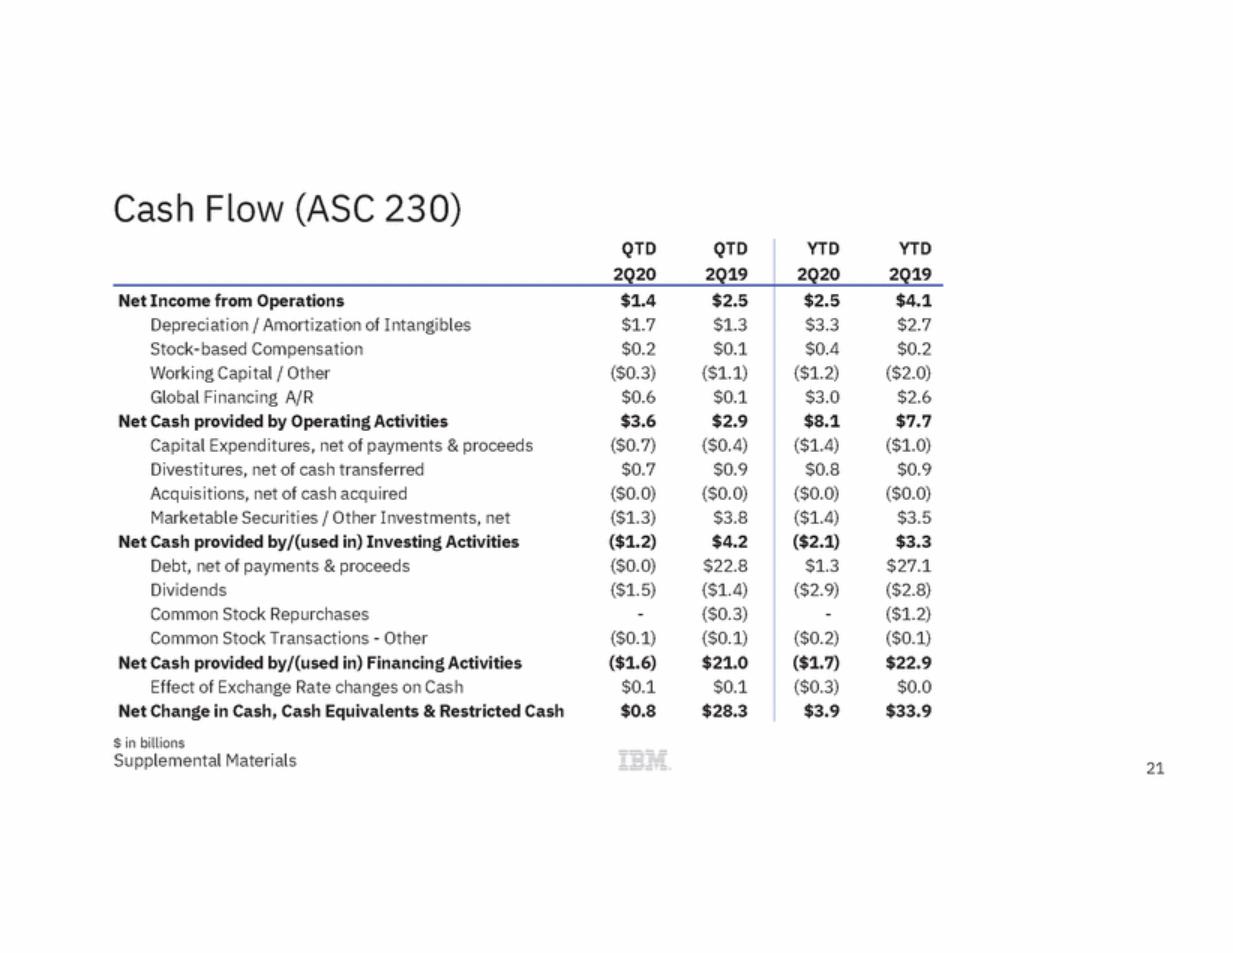
| Cash Flow (ASC 230) $ in billions Supplemental Materials 21 QTDQTD 2Q202Q19 YTDYTD 2Q20 2Q19 Net Income from Operations$1.4 $2.5 Depreciation / Amortization of Intangibles $1.7 $1.3 Stock-based Compensation $0.2 $0.1 Working Capital / Other ($0.3) ($1.1) Global Financing A/R $0.6 $0.1 Net Cash provided by Operating Activities$3.6 $2.9 Capital Expenditures, net of payments & proceeds ($0.7) ($0.4) Divestitures, net of cash transferred $0.7 $0.9 Acquisitions, net of cash acquired ($0.0) ($0.0) Marketable Securities / Other Investments, net ($1.3) $3.8 Net Cash provided by/(used in) Investing Activities($1.2) $4.2 Debt, net of payments & proceeds ($0.0) $22.8 Dividends ($1.5) ($1.4) Common Stock Repurchases - ($0.3) Common Stock Transactions - Other ($0.1) ($0.1) Net Cash provided by/(used in) Financing Activities($1.6) $21.0 Effect of Exchange Rate changes on Cash $0.1 $0.1 Net Change in Cash, Cash Equivalents & Restricted Cash$0.8 $28.3 $2.5 $4.1 $3.3 $2.7 $0.4 $0.2 ($1.2) ($2.0) $3.0 $2.6 $8.1 $7.7 ($1.4) ($1.0) $0.8 $0.9 ($0.0) ($0.0) ($1.4) $3.5 ($2.1) $3.3 $1.3 $27.1 ($2.9) ($2.8) - ($1.2) ($0.2) ($0.1) ($1.7) $22.9 ($0.3) $0.0 $3.9 $33.9 |
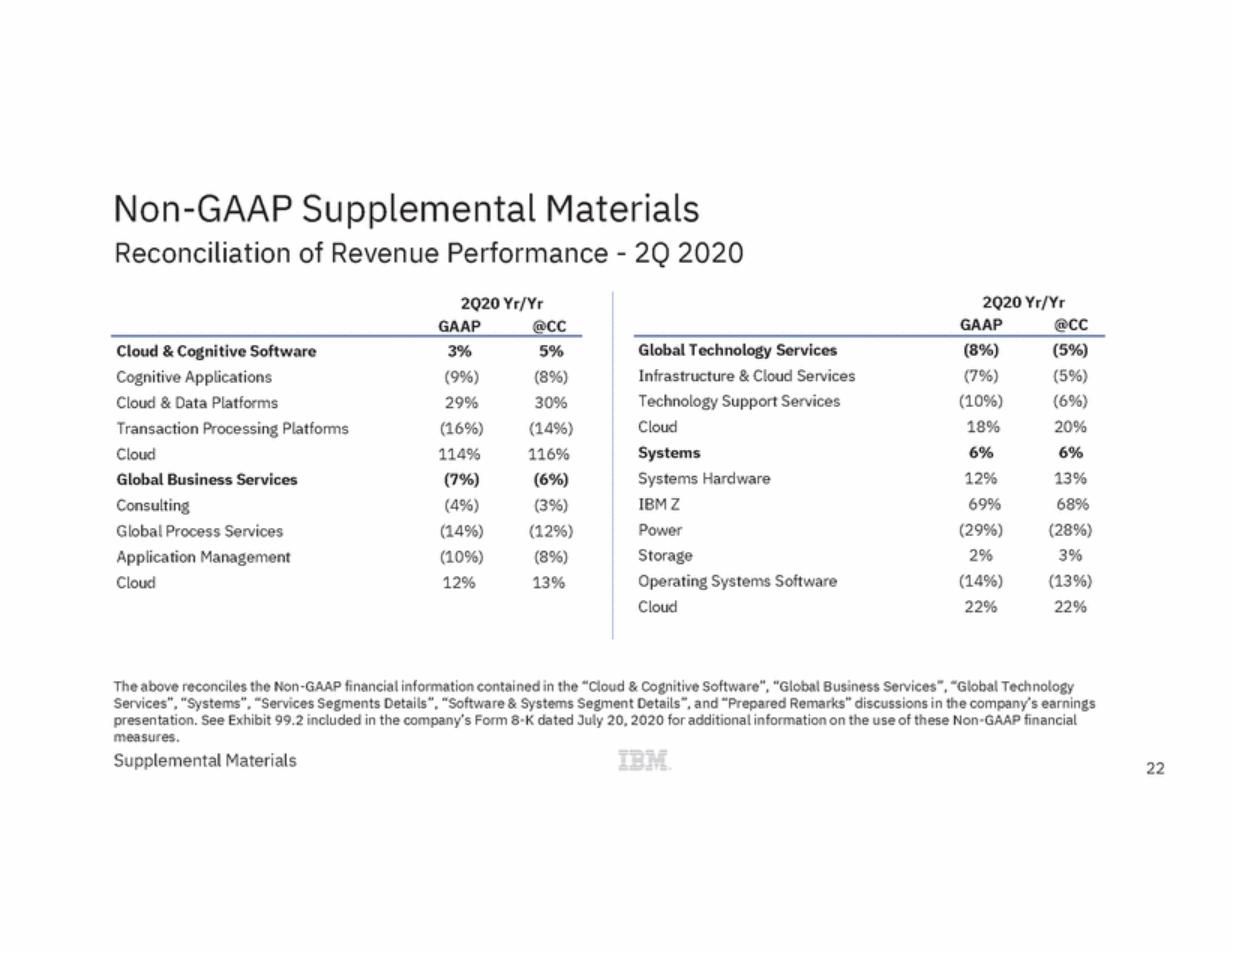
| Non-GAAP Supplemental Materials Reconciliation of Revenue Performance - 2Q 2020 2Q20 Yr/Yr 2Q20 Yr/Yr GAAP @CC GAAP @CC Global Technology Services Infrastructure & Cloud Services Technology Support Services Cloud Systems Systems Hardware IBM Z Power Storage Operating Systems Software Cloud (8%) (7%) (10%) 18% 6% 12% 69% (29%) 2% (14%) 22% (5%) (5%) (6%) 20% 6% 13% 68% (28%) 3% (13%) 22% Cloud & Cognitive Software Cognitive Applications Cloud & Data Platforms Transaction Processing Platforms Cloud Global Business Services Consulting Global Process Services Application Management Cloud 3% (9%) 29% (16%) 114% (7%) (4%) (14%) (10%) 12% 5% (8%) 30% (14%) 116% (6%) (3%) (12%) (8%) 13% The above reconciles the Non-GAAP financial information contained in the “Cloud & Cognitive Software”, “Global Business Services”, “Global Technology Services”, “Systems”, “Services Segments Details”, “Software & Systems Segment Details”, and “Prepared Remarks” discussions in the company’s earnings presentation. See Exhibit 99.2 included in the company’s Form 8-K dated July 20, 2020 for additional information on the use of these Non-GAAP financial measures. Supplemental Materials 22 |
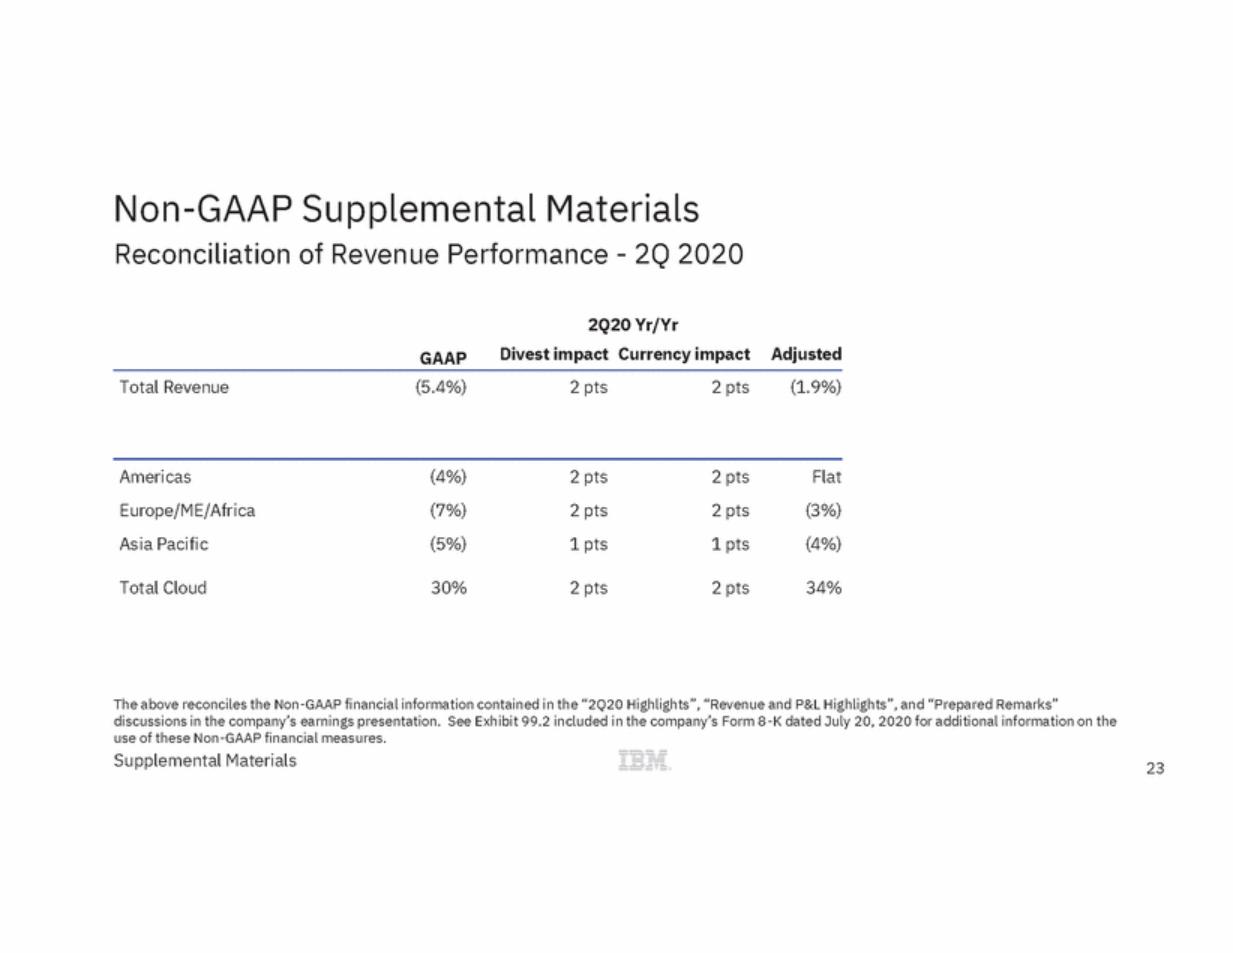
| Non-GAAP Supplemental Materials Reconciliation of Revenue Performance - 2Q 2020 2Q20 Yr/Yr Divest impact Currency impact Adjusted GAAP Total Revenue (5.4%) 2 pts 2 pts (1.9%) Americas Europe/ME/Africa Asia Pacific (4%) (7%) (5%) 2 pts 2 pts 1 pts 2 pts 2 pts 1 pts Flat (3%) (4%) Total Cloud 30% 2 pts 2 pts 34% The above reconciles the Non-GAAP financial information contained in the “2Q20 Highlights”, “Revenue and P&L Highlights”, and “Prepared Remarks” discussions in the company’s earnings presentation. See Exhibit 99.2 included in the company’s Form 8-K dated July 20, 2020 for additional information on the use of these Non-GAAP financial measures. Supplemental Materials 23 |
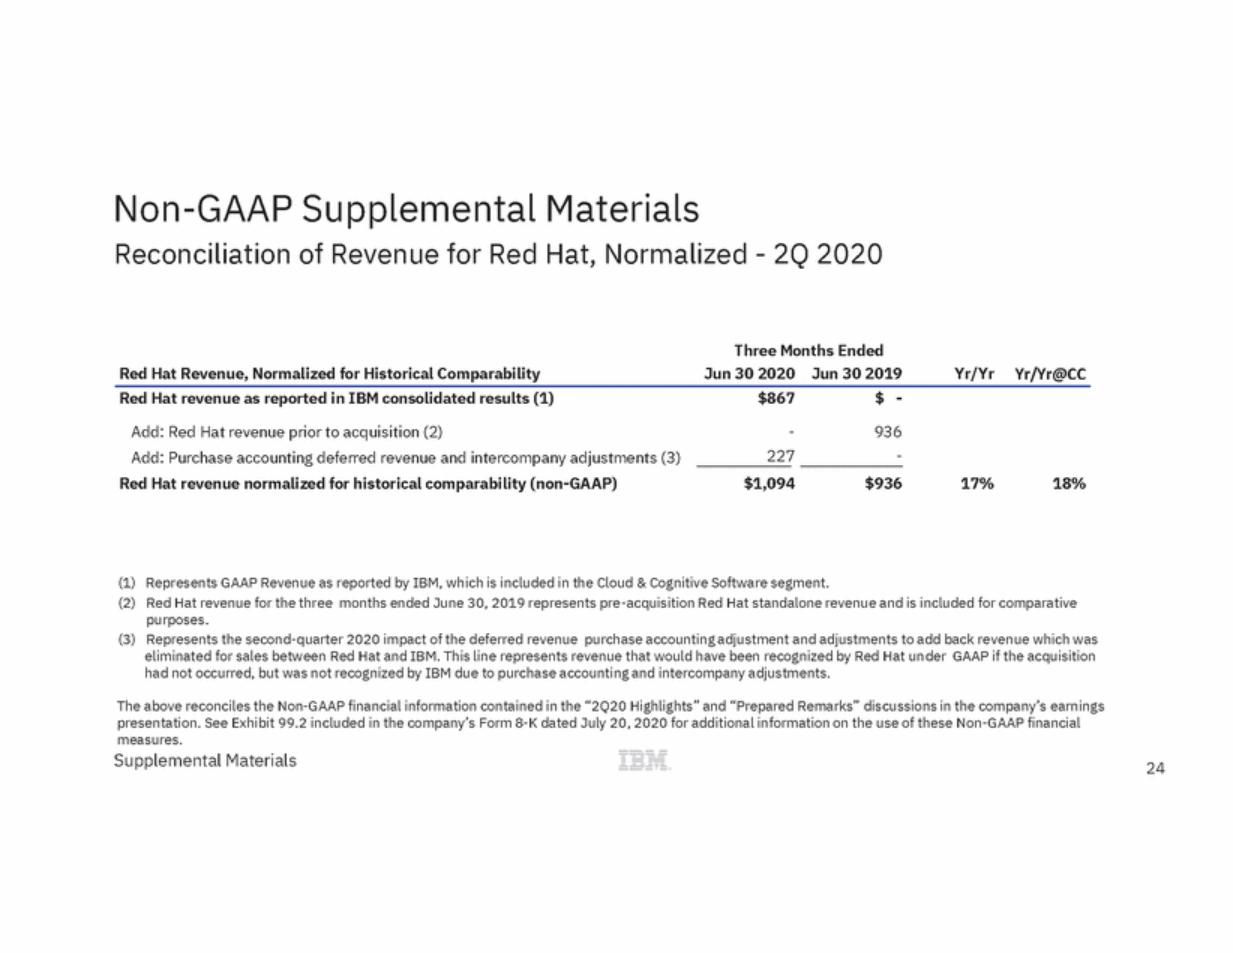
| Non-GAAP Supplemental Materials Reconciliation of Revenue for Red Hat, Normalized - 2Q 2020 Three Months Ended Red Hat Revenue, Normalized for Historical Comparability Jun 30 2020 Jun 30 2019 Yr/Yr Yr/Yr@CC Red Hat revenue as reported in IBM consolidated results (1) $867 $ - Add: Red Hat revenue prior to acquisition (2) Add: Purchase accounting deferred revenue and intercompany adjustments (3) Red Hat revenue normalized for historical comparability (non-GAAP) - 227 936 - $1,094 $936 17% 18% (1) (2) Represents GAAP Revenue as reported by IBM, which is included in the Cloud & Cognitive Software segment. Red Hat revenue for the three months ended June 30, 2019 represents pre-acquisition Red Hat standalone revenue and is included for comparative purposes. Represents the second-quarter 2020 impact of the deferred revenue purchase accounting adjustment and adjustments to add back revenue which was eliminated for sales between Red Hat and IBM. This line represents revenue that would have been recognized by Red Hat under GAAP if the acquisition had not occurred, but was not recognized by IBM due to purchase accounting and intercompany adjustments. (3) The above reconciles the Non-GAAP financial information contained in the “2Q20 Highlights” and “Prepared Remarks” discussions in the company’s earnings presentation. See Exhibit 99.2 included in the company’s Form 8-K dated July 20, 2020 for additional information on the use of these Non-GAAP financial measures. Supplemental Materials 24 |
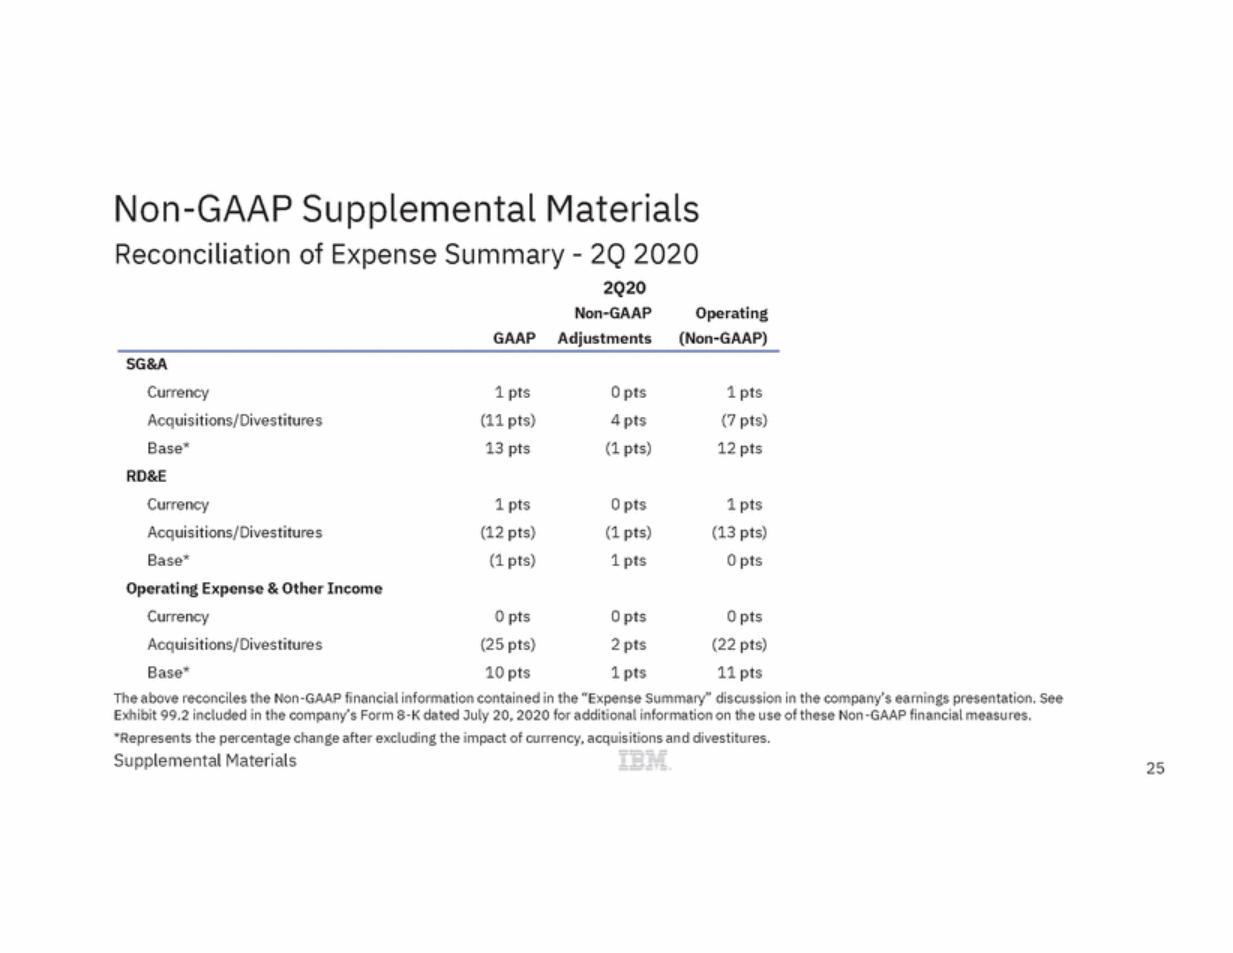
| Non-GAAP Supplemental Materials Reconciliation of Expense Summary - 2Q 2020 2Q20 Non-GAAP Adjustments Operating (Non-GAAP) GAAP SG&A Currency Acquisitions/Divestitures Base* RD&E Currency Acquisitions/Divestitures Base* Operating Expense & Other Income Currency Acquisitions/Divestitures Base* 1 pts (11 pts) 13 pts 0 pts 4 pts (1 pts) 1 pts (7 pts) 12 pts 1 pts (12 pts) (1 pts) 0 pts (1 pts) 1 pts 1 pts (13 pts) 0 pts 0 pts (25 pts) 10 pts 0 pts 2 pts 1 pts 0 pts (22 pts) 11 pts The above reconciles the Non-GAAP financial information contained in the “Expense Summary” discussion in the company’s earnings presentation. See Exhibit 99.2 included in the company’s Form 8-K dated July 20, 2020 for additional information on the use of these Non-GAAP financial measures. *Represents the percentage change after excluding the impact of currency, acquisitions and divestitures. Supplemental Materials 25 |
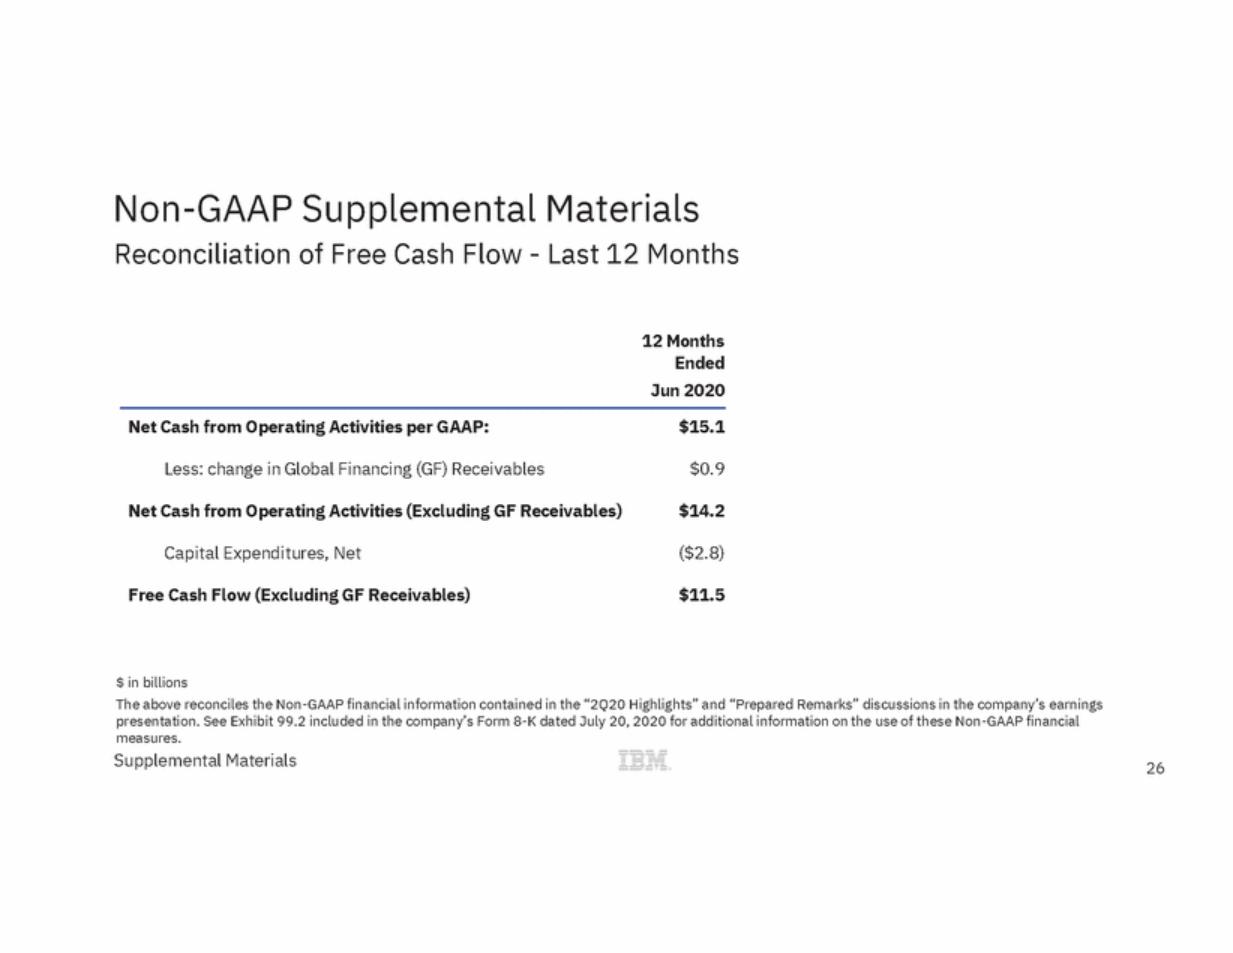
| Non-GAAP Supplemental Materials Reconciliation of Free Cash Flow - Last 12 Months 12 Months Ended Jun 2020 Net Cash from Operating Activities per GAAP: $15.1 Less: change in Global Financing (GF) Receivables $0.9 Net Cash from Operating Activities (Excluding GF Receivables) $14.2 Capital Expenditures, Net ($2.8) Free Cash Flow (Excluding GF Receivables) $11.5 $ in billions The above reconciles the Non-GAAP financial information contained in the “2Q20 Highlights” and “Prepared Remarks” discussions in the company’s earnings presentation. See Exhibit 99.2 included in the company’s Form 8-K dated July 20, 2020 for additional information on the use of these Non-GAAP financial measures. Supplemental Materials 26 |
| ibm.com/investor |