Attached files
| file | filename |
|---|---|
| 8-K - CURRENT REPORT - SHIFT TECHNOLOGIES, INC. | ea124278-8k_insurance.htm |
Exhibit 99.1

July 2020 PRIVILEGED & CONFIDENTIAL

Safe Harbor This investor presentation (“Investor Presentation”) is for informational purposes only and does not constitute an offer to sell, a solicitation of an offer to buy, or a recommendation to purchase any equity, debt or other financial instruments of Shift Technologies, Inc. or Insurance Acquisition Corp. or any of Shift Technologies, Inc.’s or Insurance Acquisition Corp.’s affiliates’ securities (as such term is defined under the U.S. Federal Securities Law). This Investor Presentation has been prepared to assist interested parties in making their own evaluation with respect to the proposed business combination, as contemplated in the Agreement and Plan of Merger (collectively, the “Business Combination”), of Shift Technologies, Inc. and Insurance Acquisition Corp. and for no other purpose. The information contained herein does not purport to be all - inclusive. The data contained herein is derived from various internal and external sources. No representation is made as to the reasonableness of the assumptions made within or the accuracy or completeness of any projections, modeling or back - testing or any other information contained herein. All levels, prices and spreads are historical and do not represent current market levels, prices or spreads, some or all of which may have been changed since the issuance of this document. Any data on past performance, modeling or back - testing contained herein is not an indication as to future performance. Shift Technologies, Inc. and Insurance Acquisition Corp. assume no obligation to update the information in this Investor Presentation. Use of Projections This Presentation contains financial forecasts with respect to Shift Technologies, Inc. Neither Insurance Acquisition Corp.’s independent auditors, nor the independent registered public accounting firm of Shift Technologies, Inc., audited, reviewed, compiled, or performed any procedures with respect to the projections for the purpose of their inclusion in this Presentation, and accordingly, neither of them expressed an opinion or provided any other form of assurance with respect thereto for the purpose of this Presentation. These projections should not be relied upon as being necessarily indicative of future results. Forward Looking Statements This Investor Presentation includes “forward looking statements” within the meaning of the “safe harbor” provisions of the United States Private Securities Litigation Reform Act of 1995. Forward - looking statements may be identified by the use of words such as “forecast,” “intend,” “seek,” “target,” “anticipate,” “believe,” “expect,” “estimate,” “plan,” “outlook,” and “project” and other similar expressions that predict or indicate future events or trends or that are not statements of historical matters. Such forward looking statements include estimated financial information. Such forward looking statements with respect to revenues, earnings, performance, strategies, prospects and other aspects of the businesses of Insurance Acquisition Corp., Shift Technologies, Inc. or the combined company after completion of the Business Combination are based on current expectations that are subject to risks and uncertainties. A number of factors could cause actual results or outcomes to differ materially from those indicated by such forward looking statements. These factors include, but are not limited to: (1) the occurrence of any event, change or other circumstances that could give rise to the termination of the Agreement and Plan of Merger and the proposed business combination contemplated thereby; (2) the inability to complete the transactions contemplated by the Agreement and Plan of Merger due to the failure to obtain approval of the stockholders of Insurance Acquisition Corp. or other conditions to closing in the Agreement and Plan of Merger; (3) the ability to meet Nasdaq’s listing standards following the consummation of the transactions contemplated by the Agreement and Plan of Merger; (4) the risk that the proposed transaction disrupts current plans and operations of Shift Technologies, Inc. as a result of the announcement and consummation of the transactions described herein; (5) the ability to recognize the anticipated benefits of the proposed Business Combination, which may be affected by, among other things, competition, the ability of the combined company to grow and manage growth profitably, maintain relationships with customers and suppliers and retain its management and key employees; (6) costs related to the proposed Business Combination; (7) changes in applicable laws or regulations; (8) the possibility that Shift Technologies, Inc. may be adversely affected by other economic, business, and/or competitive factors; and (9) other risks and uncertainties indicated from time to time in other documents filed or to be filed with the Securities and Exchange Commission (“SEC”) by Insurance Acquisition Corp. You are cautioned not to place undue reliance upon any forward - looking statements, which speak only as of the date made. Insurance Acquisition Corp. and Shift Technologies, Inc. undertake no commitment to update or revise the forward - looking statements, whether as a result of new information, future events or otherwise, except as may be required by law. Industry and Market Data In this Presentation, Shift Technologies, Inc . relies on and refers to information and statistics regarding market share in the sector in which it competes and other industry data . Shift Technologies, Inc . obtained this information and statistics from third - party sources . Shift Technologies, Inc . has supplemented this information where necessary with information from discussions with Shift Technologies, Inc . customers and its own internal estimates, taking into account publicly available information about other industry participants and Shift Technologies, Inc . ’s management’s best view as to information that is not publicly available . Use of Non - GAAP Financial Measures This presentation includes certain non - GAAP financial measures that are not prepared in accordance with accounting principles generally accepted in the United States (“GAAP”) and that may be different from non - GAAP financial measures used by other companies. Insurance Acquisition Corp. and Shift Technologies, Inc. believe that the use of these non - GAAP financial measures provides an additional tool for investors to use in evaluating ongoing operating results and trends of Shift Technologies, Inc. These non - GAAP measures should not be considered in isolation from, or as an alternative to, financial measures determined in accordance with GAAP. See the footnotes on the slides where these measures are discussed and page 43 of this Presentation for a description of these non - GAAP financial measures and reconciliations of such non - GAAP financial measures to the most comparable GAAP numbers. Additionally, to the extent that forward - looking non - GAAP financial measures are provided, they are presented on a non - GAAP basis without reconciliations of such forward - looking non - GAAP measures due to the inherent difficulty in forecasting and quantifying certain amounts that are necessary for such reconciliation. Additional Information About the Transaction and Where to Find It The Company has filed with the SEC a Registration Statement on Form S - 4, which includes a preliminary proxy statement/prospectus in connection with the Merger and will mail a definitive proxy statement/prospectus and other relevant documents to its stockholders. The Company’s stockholders and other interested persons are advised to read the preliminary proxy statement/prospectus, and amendments thereto, and to read, when available, the definitive proxy statement/prospectus in connection with the Company’s solicitation of proxies for its stockholders’ meeting to be held to approve the Merger because the proxy statement/prospectus contains important information about the Company, Shift and the Merger. The definitive proxy statement/prospectus will be mailed to stockholders of the Company as of a record date to be established for voting on the Merger. Stockholders will also be able to obtain copies of the Registration Statement on Form S - 4 and the definitive proxy statement/prospectus, without charge, once available, at the SEC’s website at www.sec.gov or by directing a request to: Insurance Acquisition Corp., 2929 Arch Street, Suite 1703, Philadelphia, PA 19104, Attn: Joseph Pooler. Participants in Solicitation The Company, Shift and certain of their respective directors and officers may be deemed participants in the solicitation of proxies of the Company’s stockholders with respect to the approval of the Merger. Information regarding the Company’s directors and officers and a description of their interests in the Company is contained in the preliminary proxy statement/prospectus for the Merger. Additional information regarding the participants in the proxy solicitation, including Shift’s directors and officers, and a description of their direct and indirect interests, by security holdings or otherwise, is included in the preliminary proxy statement/prospectus for the Merger and will be included in the definitive proxy statement/prospectus for the Merger when available. Each of these documents is, or will be, available at the SEC’s website or by directing a request to the Company as described above under “Additional Information About the Transaction and Where to Find It.” In connection with the Merger, at any time prior to the special meeting to approve the Merger, certain existing Company stockholders, which may include certain of the Company’s officers, directors and other affiliates, may enter into transactions with stockholders and other persons with respect to the Company’s securities to provide such investors or other persons with incentives in connection with the approval and consummation of the Merger. While the exact nature of such incentives has not yet been determined, they might include, without limitation, arrangements to purchase shares from or sell shares to such investors and persons at nominal prices or prices other than fair market value. These stockholders will only effect such transactions when they are not then aware of any material nonpublic information regarding the Company, Shift or their respective securities. 2
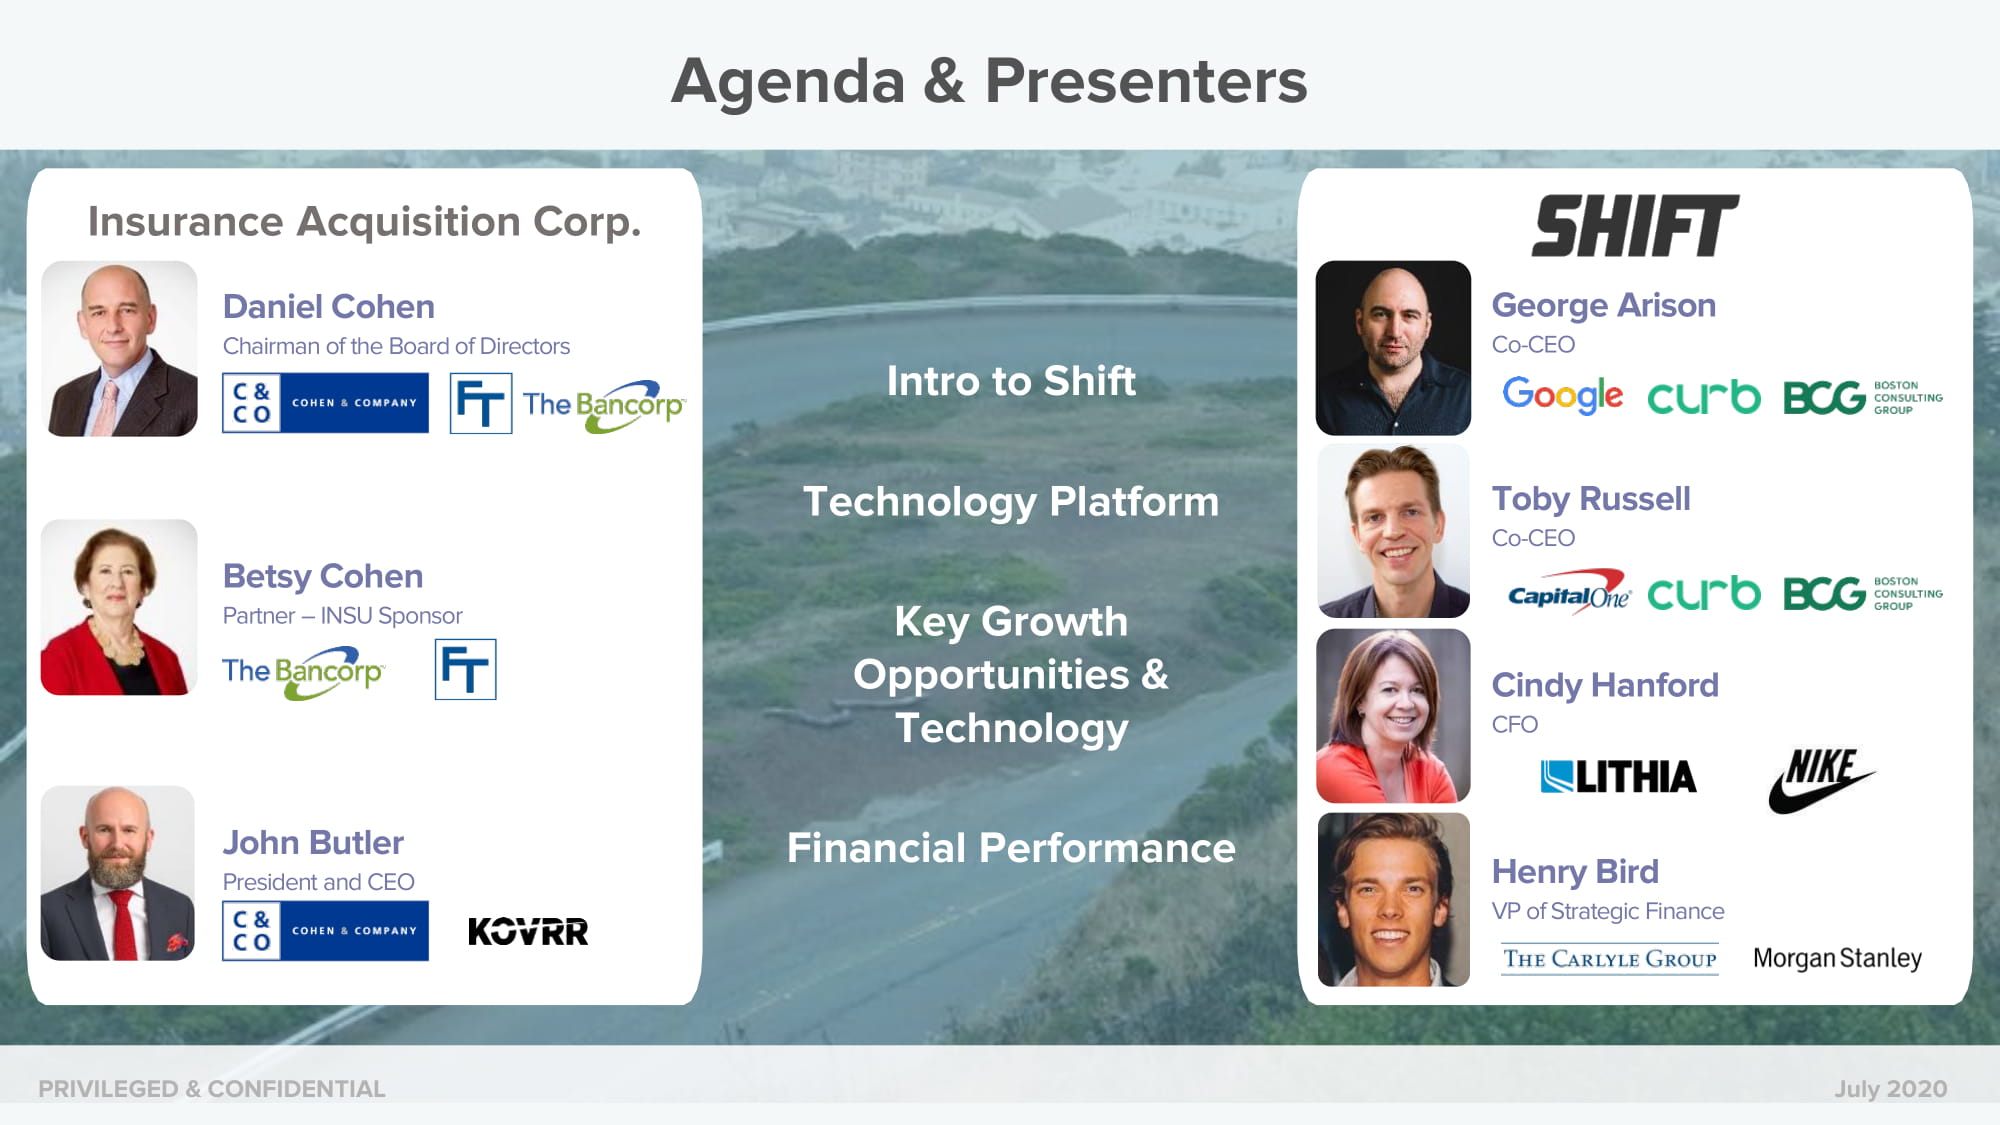
July 2020 Agenda & Presenters PRIVILEGED & CONFIDENTIAL Intro to Shift Technology Platform Key Growth Opportunities & Technology Financial Performance Cindy Hanford CFO Toby Russell Co - CEO George Arison Co - CEO Betsy Cohen Partner – INSU Sponsor Insurance Acquisition Corp. Daniel Cohen Chairman of the Board of Directors John Butler President and CEO Henry Bird VP of Strategic Finance
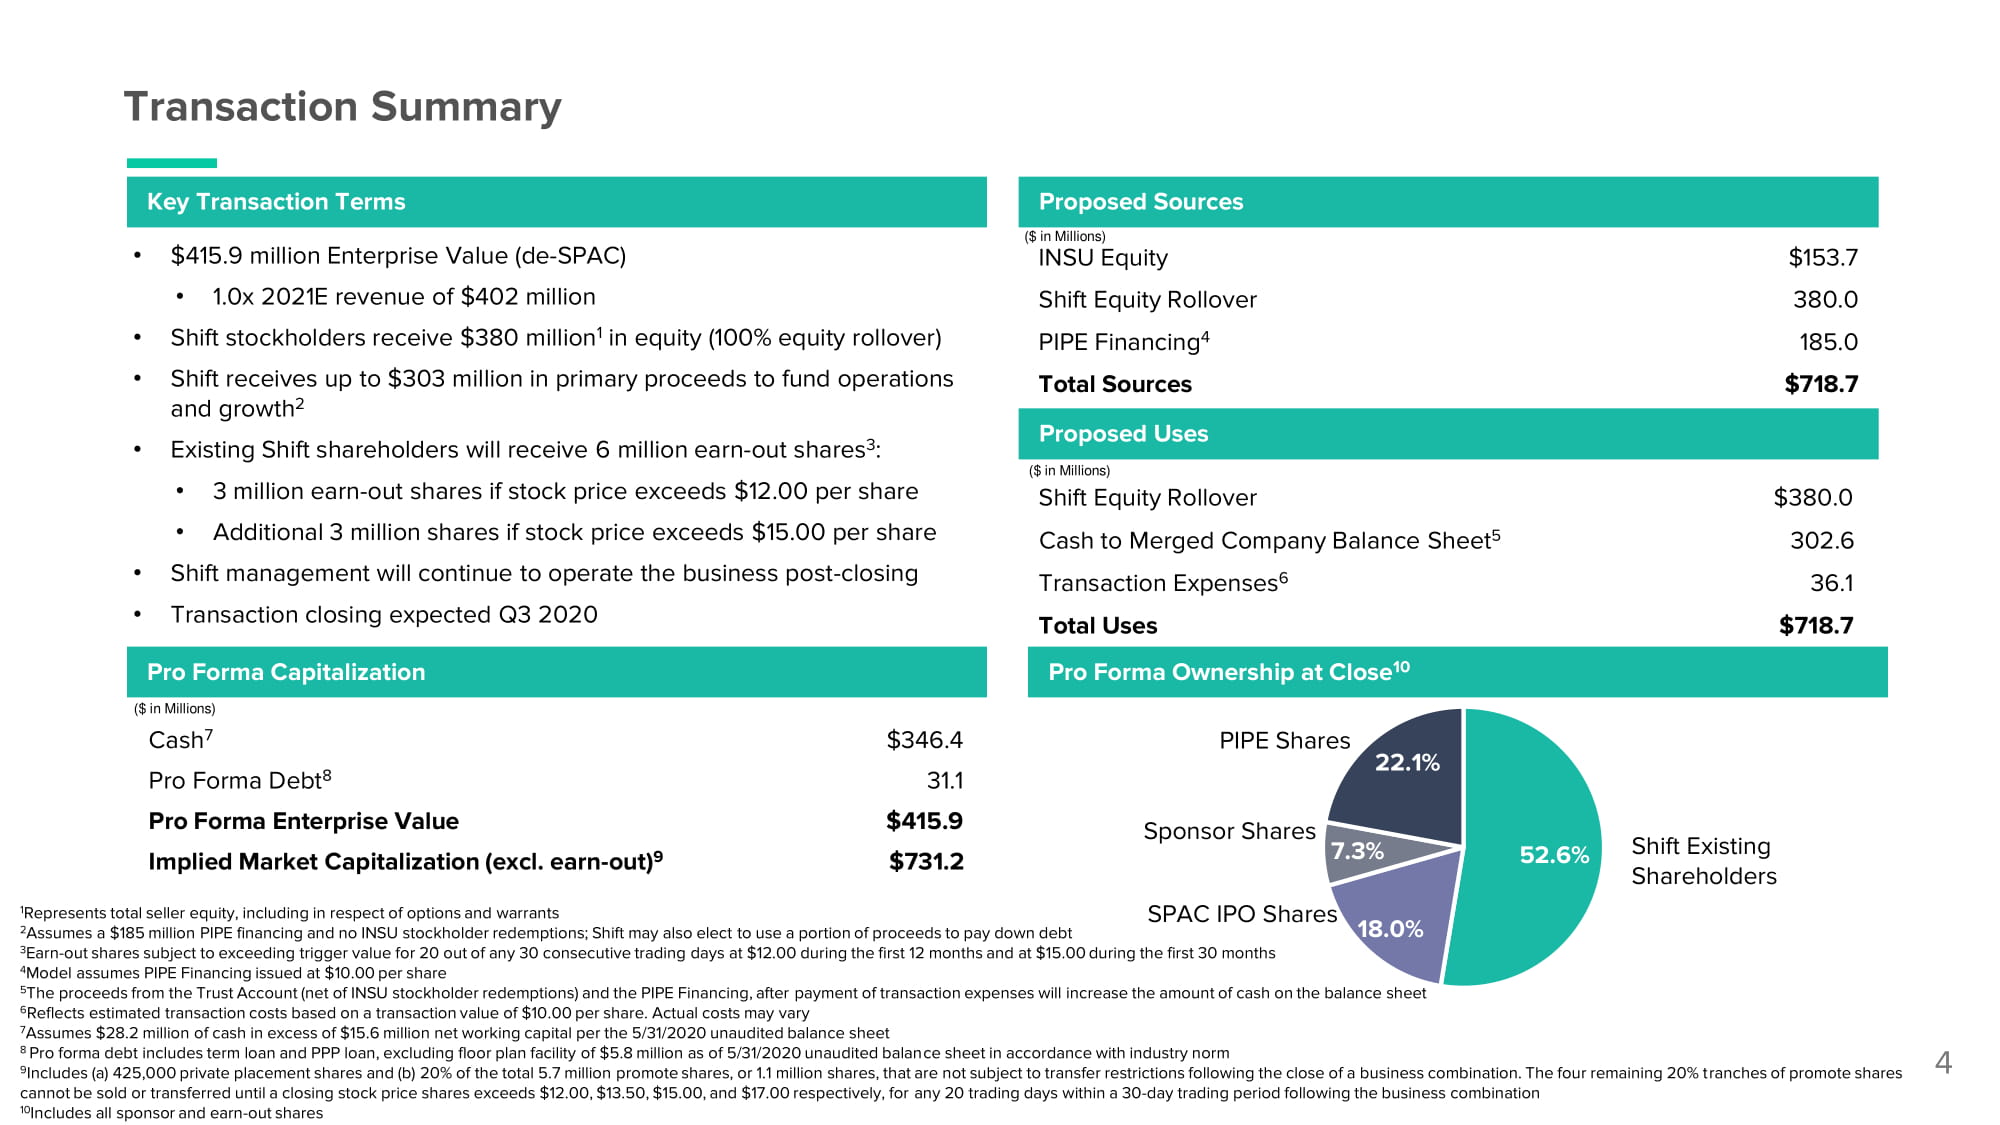
Transaction Summary 4 and growth 2 • Existing Shift shareholders will receive 6 million earn - out shares 3 : • 3 million earn - out shares if stock price exceeds $12.00 per share • Additional 3 million shares if stock price exceeds $15.00 per share • Shift management will continue to operate the business post - closing • Transaction closing expected Q3 2020 • $415.9 million Enterprise Value (de - SPAC) INSU Equity $1 5 3 . 7 • 1.0x 2021E revenue of $402 million Shift Equity Rollover 380.0 • Shift stockholders receive $380 million 1 in equity (100% equity rollover) PIPE Financing 4 1 8 5. 0 • Shift receives up to $303 million in primary proceeds to fund operations Total Sources $71 8 .7 5 2.6 % 22.1% Key Transaction Terms Pro Forma Capitalization Pro Forma Ownership at Close 10 ($ in Millions) Proposed Sources Proposed Uses $ 3 8 0.0 3 02 . 6 3 6 . 1 $71 8 .7 ($ in Millions) Shift Equity Rollover Cash to Merged Company Balance Sheet 5 Transaction Expenses 6 Total Uses Shift Existing S h a r e h olders Sponsor Shares 7.3% PIPE Shares $ 3 46 . 4 3 1 . 1 $415 . 9 $731 .2 ($ in Millions) Cash 7 Pro Forma Debt 8 Pro Forma Enterprise Value Implied Market Capitalization (excl. earn - out) 9 1 Represents total seller equity, including in respect of options and warrants 2 Assumes a $185 million PIPE financing and no INSU stockholder redemptions; Shift may also elect to use a portion of proceeds to pay down debt 3 Earn - out shares subject to exceeding trigger value for 20 out of any 30 consecutive trading days at $12.00 during the first 12 months and at $15.00 during the first 30 months 4 Model assumes PIPE Financing issued at $10.00 per share 5 The proceeds from the Trust Account (net of INSU stockholder redemptions) and the PIPE Financing, after payment of transaction expenses will increase the amount of cash on the balance sheet 6 Reflects estimated transaction costs based on a transaction value of $10.00 per share. Actual costs may vary 7 Assumes $28.2 million of cash in excess of $15.6 million net working capital per the 5/31/2020 unaudited balance sheet 8 Pro forma debt includes term loan and PPP loan, excluding floor plan facility of $5.8 million as of 5/31/2020 unaudited balance sheet in accordance with industry norm 9 Includes (a) 425,000 private placement shares and (b) 20% of the total 5.7 million promote shares, or 1.1 million shares, that are not subject to transfer restrictions following the close of a business combination. The four remaining 20% tranches of promote shares cannot be sold or transferred until a closing stock price shares exceeds $12.00, $13.50, $15.00, and $17.00 respectively, for any 20 trading days within a 30 - day trading period following the business combination 10 Includes all sponsor and earn - out shares SPAC IPO Shares 18.0%
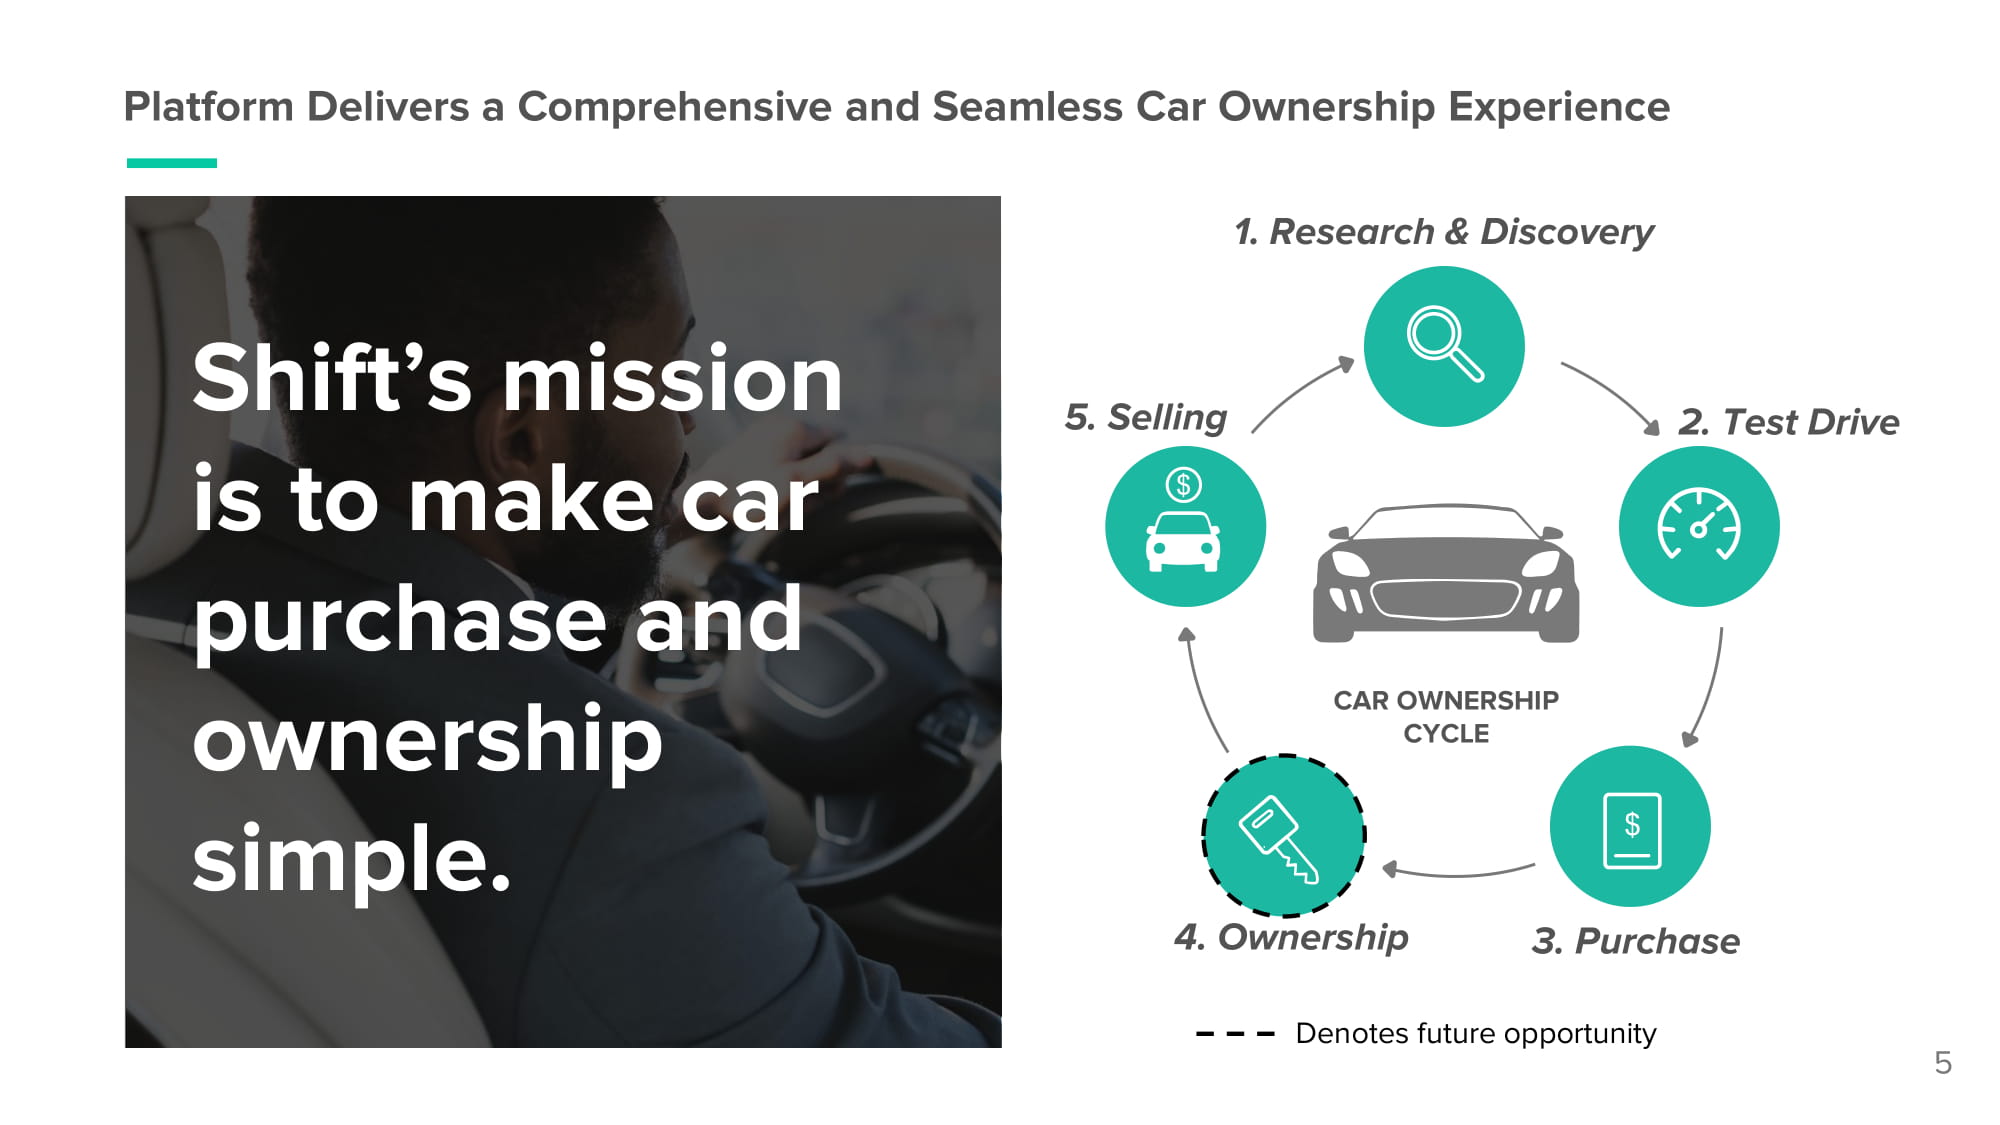
5 Platform Delivers a Comprehensive and Seamless Car Ownership Experience 5. Selling 1. Research & Discovery 2. Test Drive 4. Ownership 3. Purchase CAR OWNERSHIP CYCLE Denotes future opportunity Denotes future opportunity Shift’s mission is to make car purchase and ownership simple.
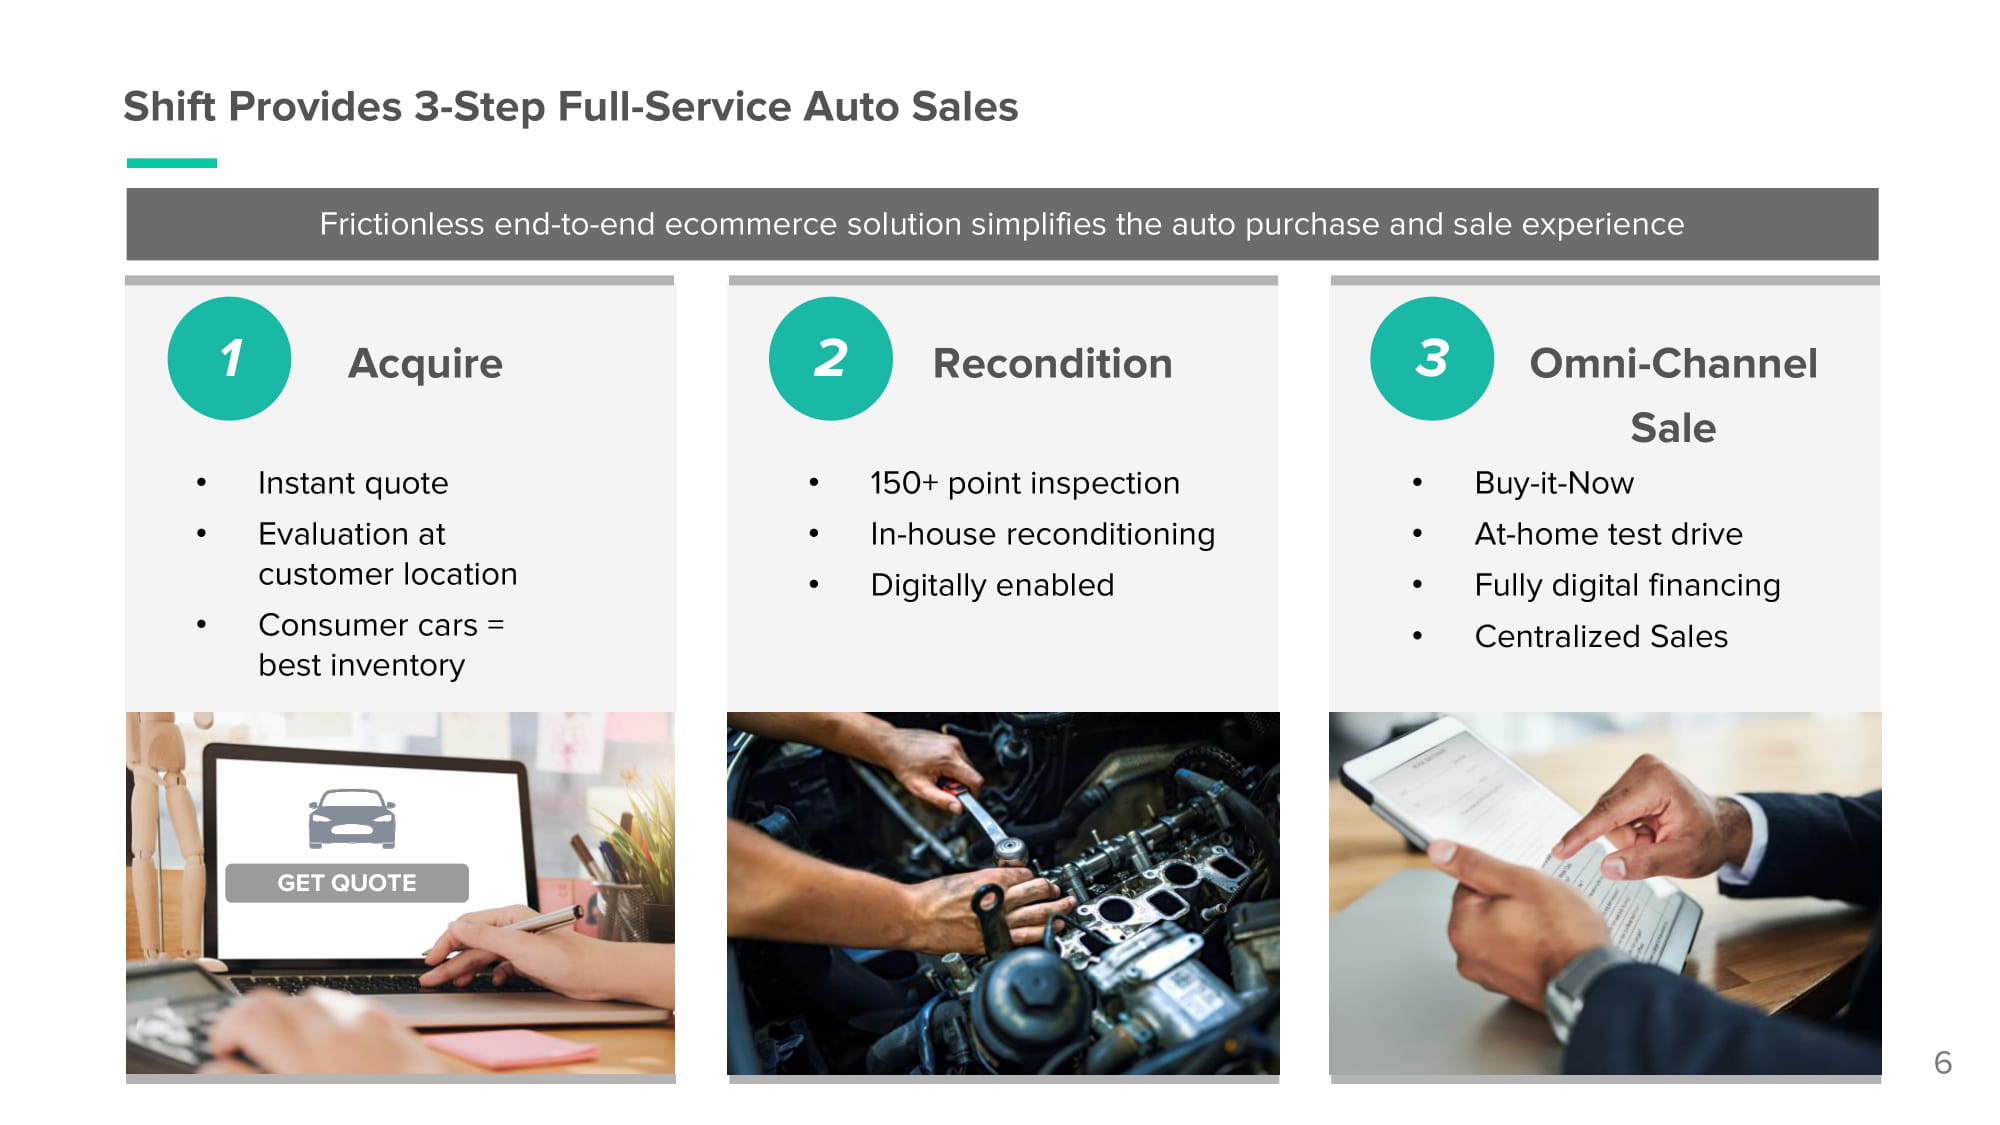
Shift Provides 3 - Step Full - Service Auto Sales 1 Acquire 2 Recondition • Instant quote • Evaluation at customer location • Consumer cars = best inventory • 150+ point inspection • In - house reconditioning • Digitally enabled 3 Omni - Channel Sale • Buy - it - Now • At - home test drive • Fully digital financing • Centralized Sales 6 GET QUOTE Frictionless end - to - end ecommerce solution simplifies the auto purchase and sale experience
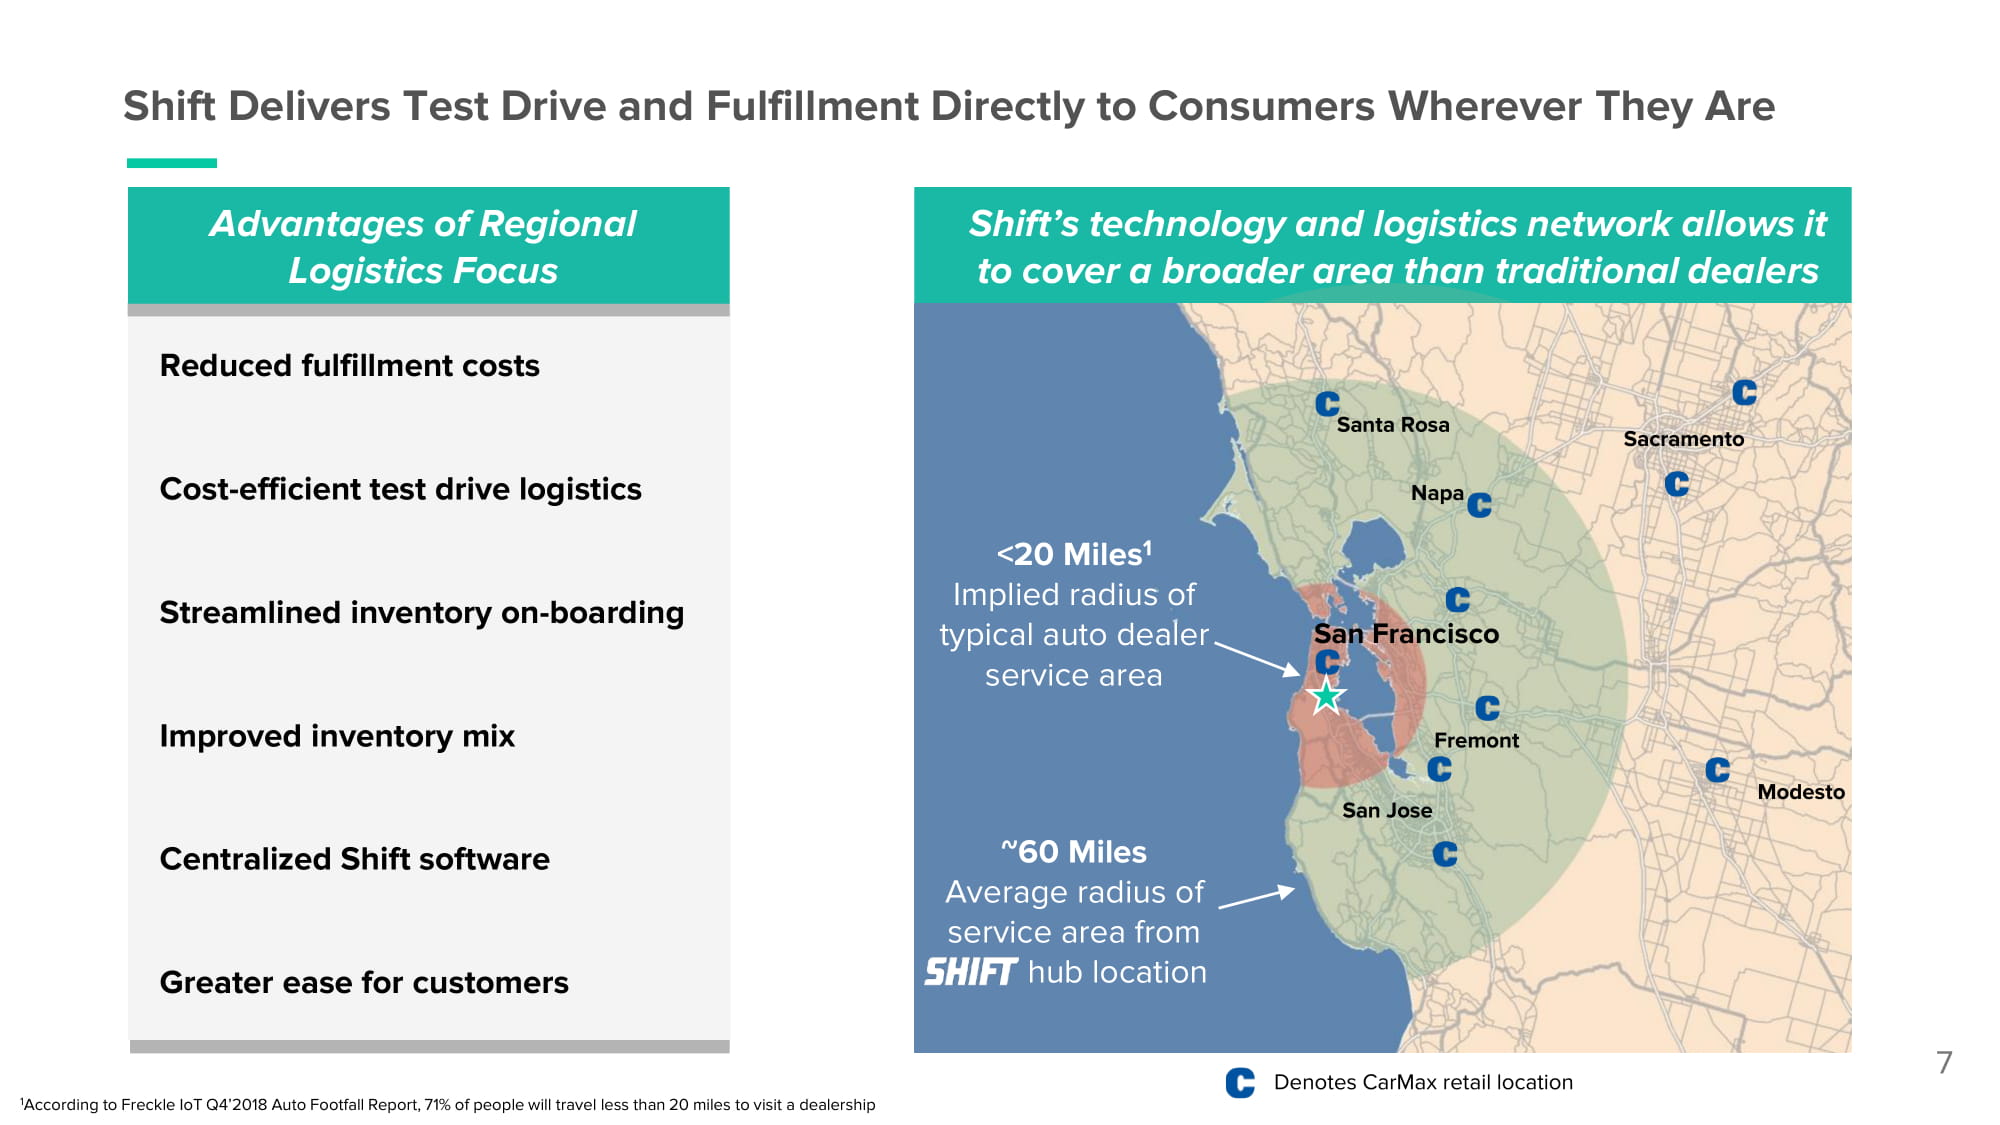
Shift Delivers Test Drive and Fulfillment Directly to Consumers Wherever They Are 7 1 According to Freckle IoT Q4’2018 Auto Footfall Report, 71% of people will travel less than 20 miles to visit a dealership Shift’s technology and logistics network allows it to cover a broader area than traditional dealers Denotes CarMax retail location <20 Miles 1 Implied radius of typical auto dealer service area San Francisco F re m o n t Modesto S ac ra ment o Santa Rosa N a pa San Jose Reduced fulfillment costs Cost - efficient test drive logistics Streamlined inventory on - boarding Improved inventory mix Centralized Shift software Greater ease for customers ~60 Miles Average radius of service area from hub location Advantages of Regional Logistics Focus
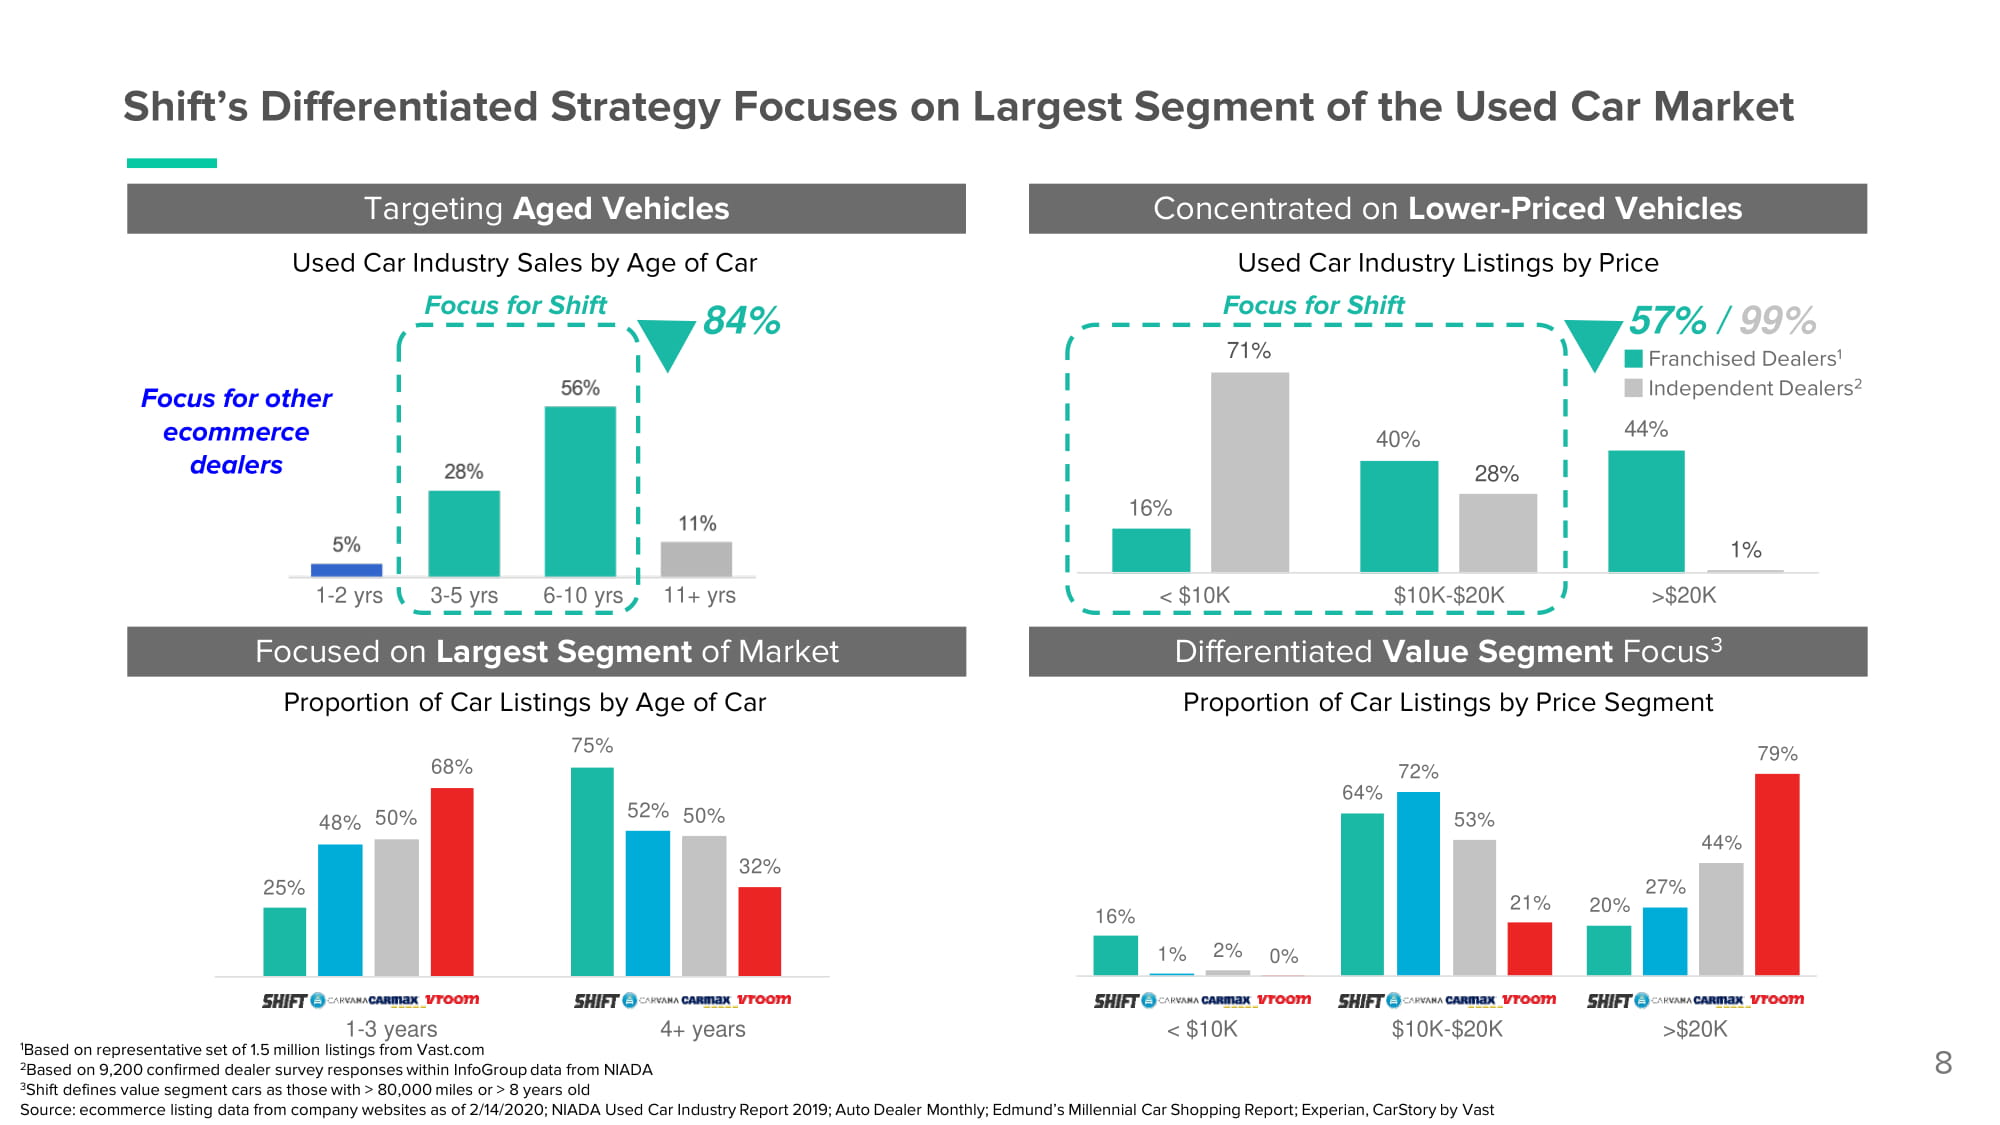
Shift’s Differentiated Strategy Focuses on Largest Segment of the Used Car Market 8 Source: ecommerce listing data from company websites as of 2/14/2020; NIADA Used Car Industry Report 2019; Auto Dealer Monthly; Edmund’s Millennial Car Shopping Report; Experian, CarStory by Vast < $10K $10K - $20K > $20 K 16 % 40 % 44 % 28 % 1 % Used Car Industry Listings by Price Independent Dealers 2 Proportion of Car Listings by Price Segment Focus for Shift 71% 57% / 99% Franchised Dealers 1 Concentrated on Lower - Priced Vehicles < $10 K $10 K - $20 K > $20 K Differentiated Value Segment Focus 3 16 % 64 % 20 % 1 % 72 % 27 % 2 % 53 % 44 % 0 % 21 % 79 % Targeting Aged Vehicles Focused on Largest Segment of Market 1 - 3 years 1 Based on representative set of 1.5 million listings from Vast.com 2 Based on 9,200 confirmed dealer survey responses within InfoGroup data from NIADA 3 Shift defines value segment cars as those with > 80,000 miles or > 8 years old 4+ years 25 % 48% 50% 52% 50% 68 % 32 % 84% Focus for other ecommerce dealers Focus for Shift 1 - 2 yrs 3 - 5 yrs 6 - 10 yrs 11+ yrs Proportion of Car Listings by Age of Car 75% Used Car Industry Sales by Age of Car
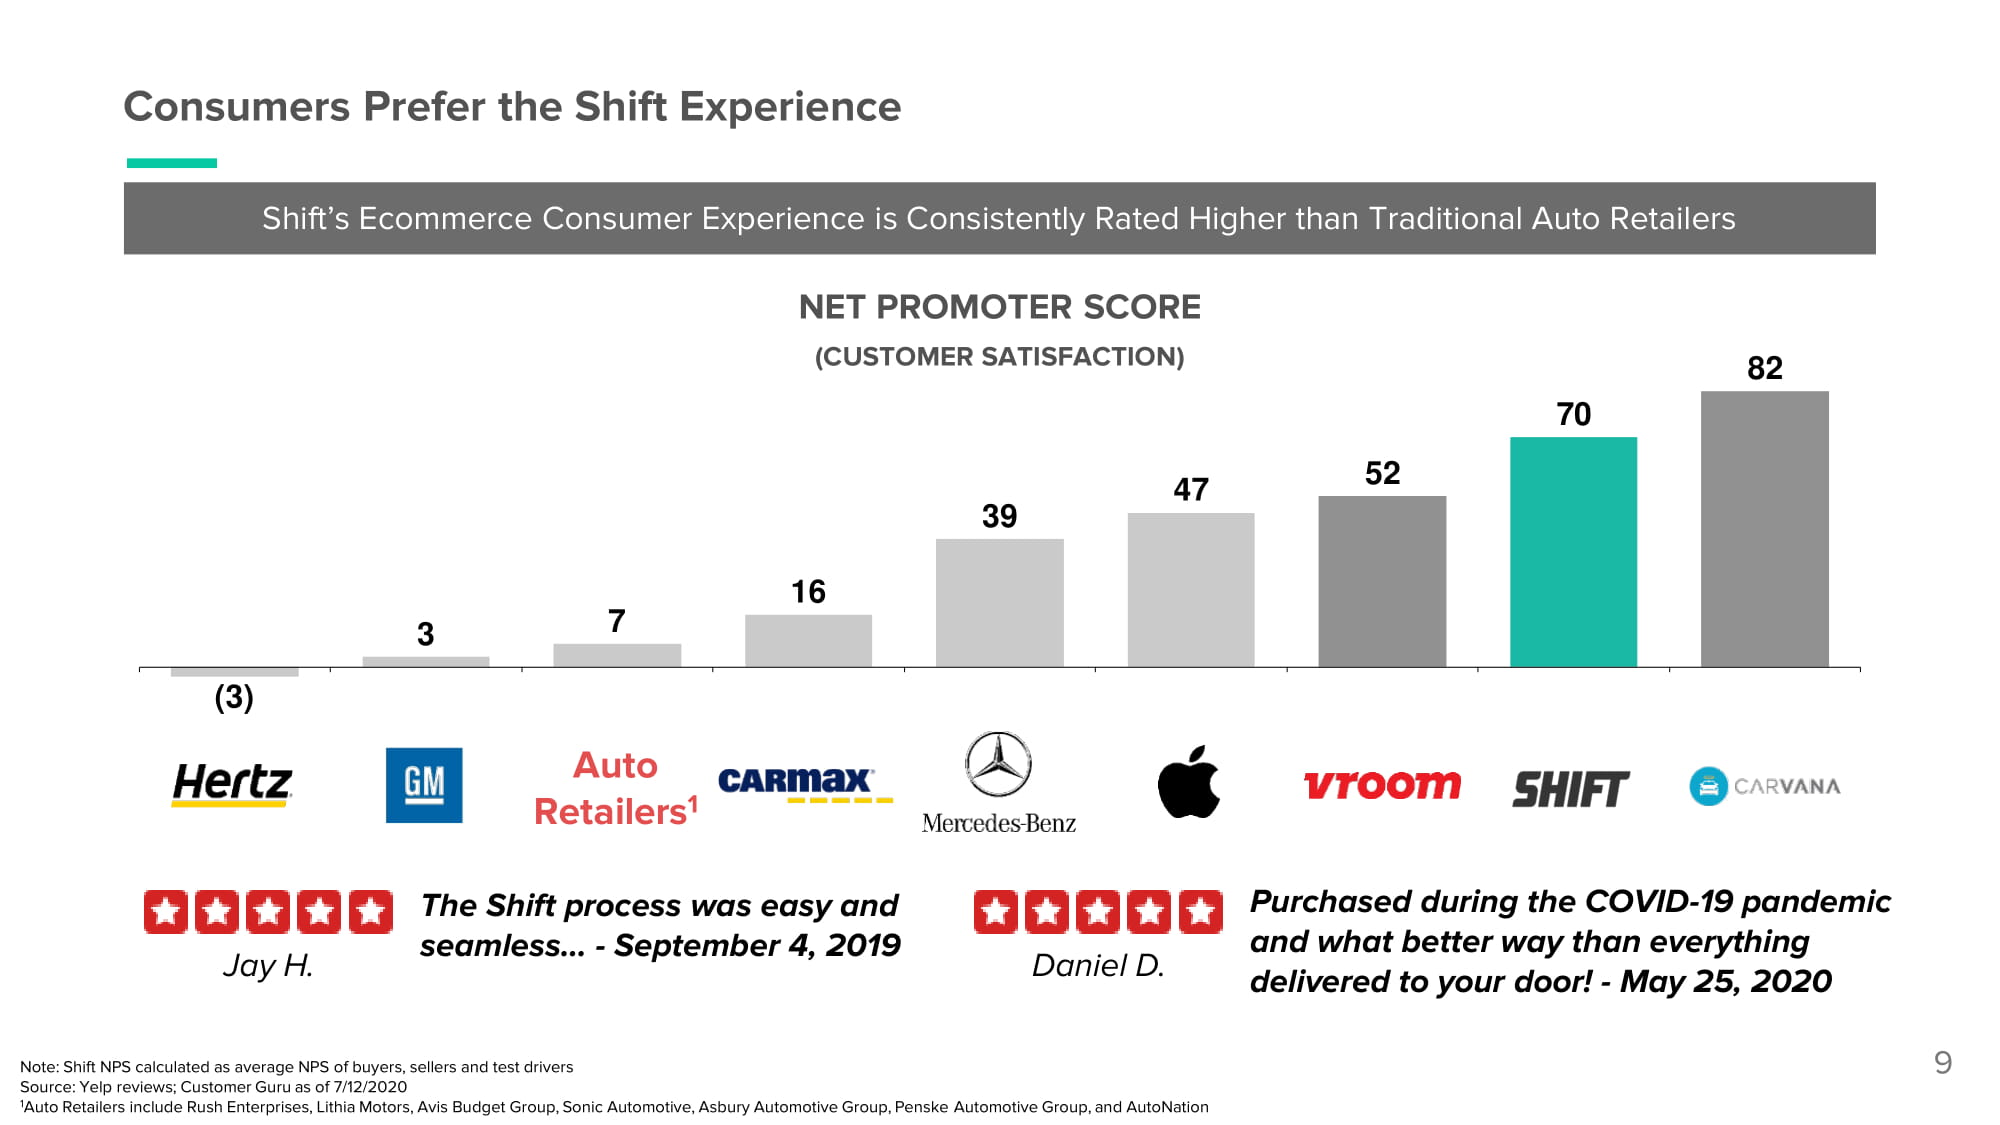
( 3) 3 7 16 39 47 52 70 82 Auto Ret a il e r s 1 9 Consumers Prefer the Shift Experience NET PROMOTER SCORE (CUSTOMER SATISFACTION) Shift’s Ecommerce Consumer Experience is Consistently Rated Higher than Traditional Auto Retailers Note: Shift NPS calculated as average NPS of buyers, sellers and test drivers Source: Yelp reviews; Customer Guru as of 7/12/2020 1 Auto Retailers include Rush Enterprises, Lithia Motors, Avis Budget Group, Sonic Automotive, Asbury Automotive Group, Penske Automotive Group, and AutoNation The Shift process was easy and seamless… - September 4, 2019 Jay H. Purchased during the COVID - 19 pandemic and what better way than everything delivered to your door! - May 25, 2020 Daniel D.
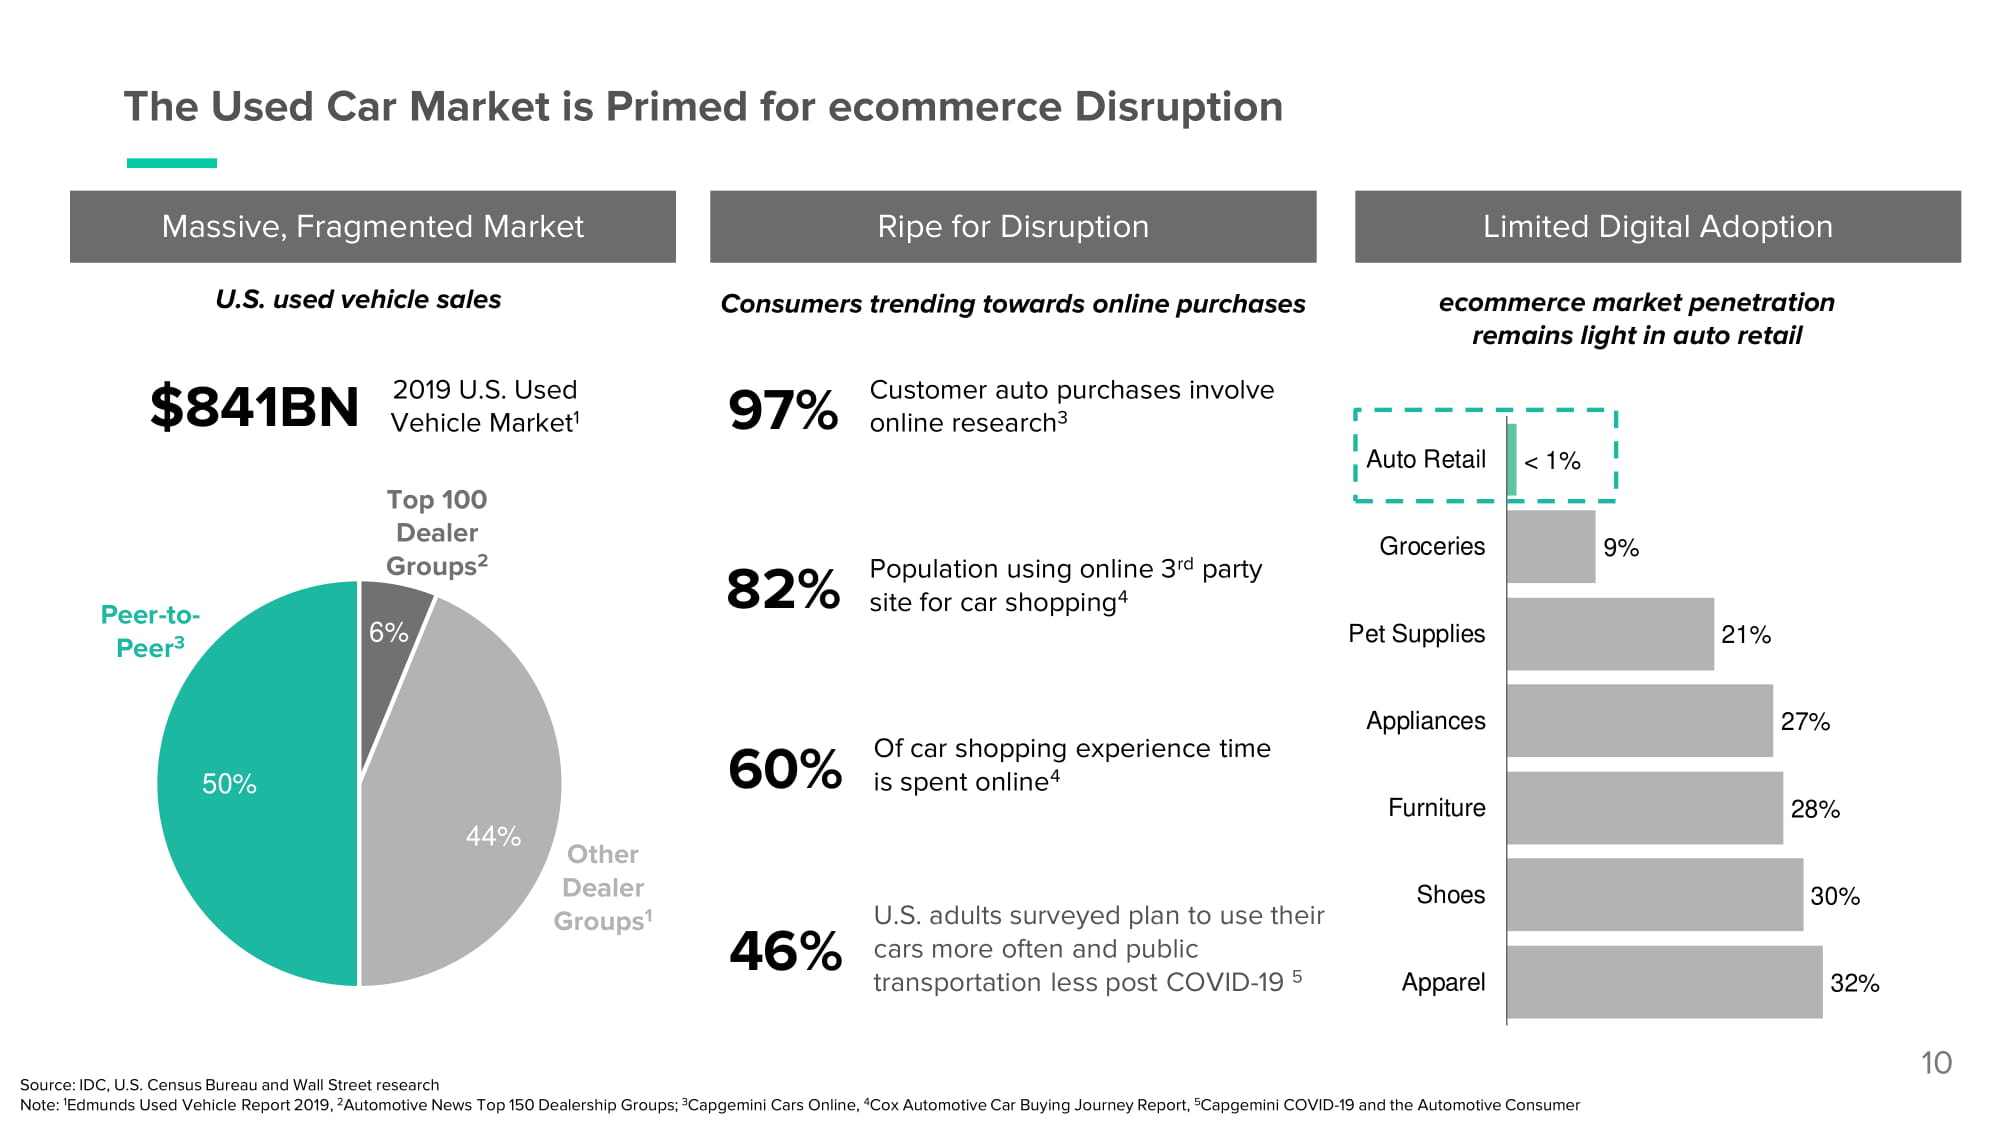
32% 30% 28% 27% 21% 9% Ap p arel Sh o es Furniture Ap p lian c es Pet Supplies Gr o c er i es Auto Retail < 1% The Used Car Market is Primed for ecommerce Disruption Source: IDC, U.S. Census Bureau and Wall Street research Note: 1 Edmunds Used Vehicle Report 2019, 2 Automotive News Top 150 Dealership Groups; 3 Capgemini Cars Online, 4 Cox Automotive Car Buying Journey Report, 5 Capgemini COVID - 19 and the Automotive Consumer Massive, Fragmented Market Limited Digital Adoption ecommerce market penetration remains light in auto retail U.S. used vehicle sales Ripe for Disruption Population using online 3 rd party site for car shopping 4 82% Customer auto purchases involve online research 3 97% Consumers trending towards online purchases Of car shopping experience time is spent online 4 60% U.S. adults surveyed plan to use their cars more often and public transportation less post COVID - 19 5 46% 10 Peer - to - Peer 3 Other Dealer Gr o u p s 1 Top 100 Dealer Gr o u p s 2 6% 4 4 % 5 0 % 2019 U.S. Used Vehicle Market 1 $8 4 1BN
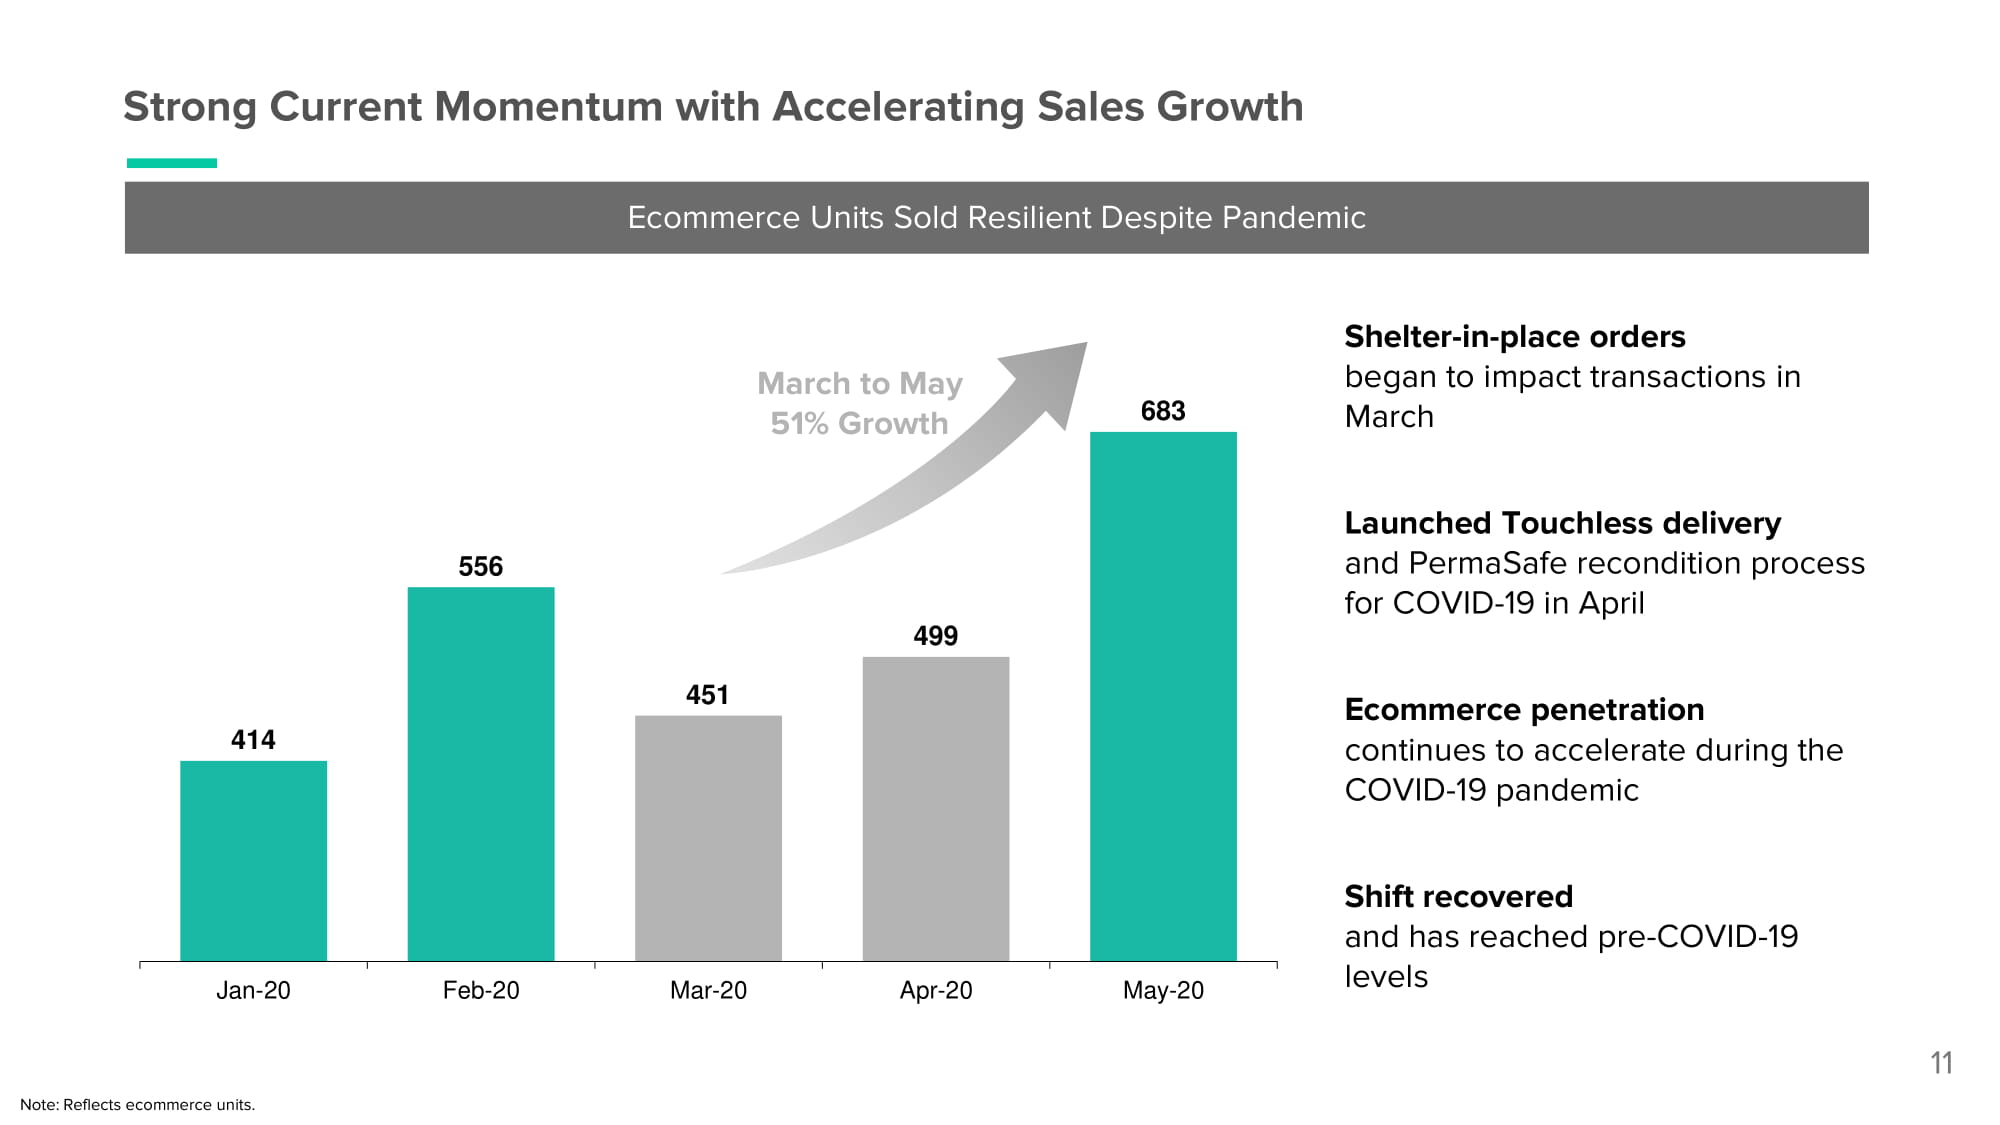
Strong Current Momentum with Accelerating Sales Growth 11 414 556 451 499 683 J an - 2 0 Fe b - 20 M ar - 2 0 A pr - 2 0 M ay - 20 Ecommerce Units Sold Resilient Despite Pandemic March to May 51% Growth Shelter - in - place orders began to impact transactions in March Launched Touchless delivery and PermaSafe recondition process for COVID - 19 in April Ecommerce penetration continues to accelerate during the COVID - 19 pandemic Shift recovered and has reached pre - COVID - 19 levels Note: Reflects ecommerce units.

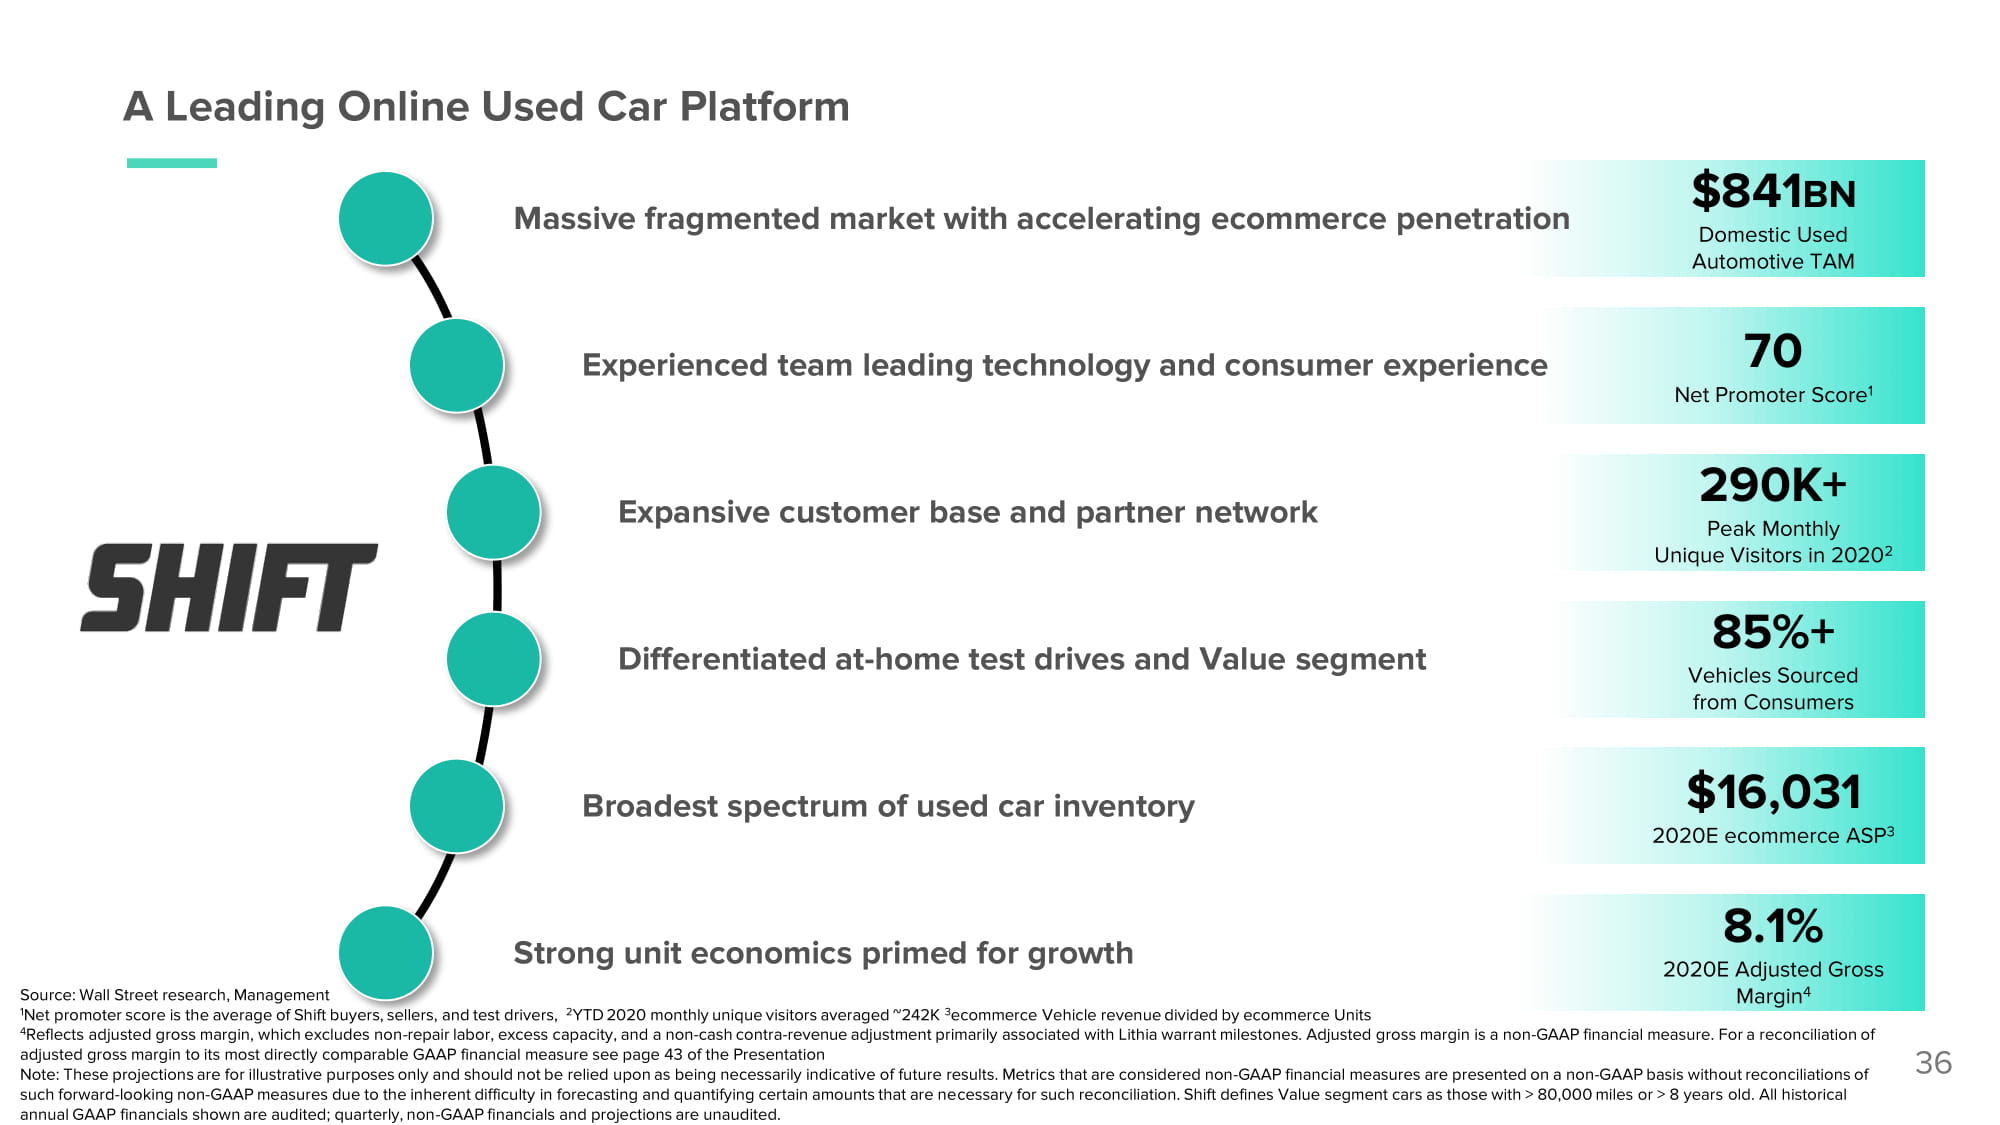
A Leading Online Used Car Platform 12 Massive fragmented market with accelerating ecommerce penetration $ 84 1 BN Domestic Used Automotive TAM Experienced team leading technology and consumer experience 70 Net Promoter Score 1 Expansive customer base and partner network 290K+ Peak Monthly Unique Visitors in 2020 2 Differentiated at - home test drives and Value segment 85%+ Vehicles Sourced from Consumers Broadest spectrum of used car inventory $16,031 2020E ecommerce ASP 3 Strong unit economics primed for growth 8.1% 2020E Adjusted Gross Margin 4 Source: Wall Street research, Management 1 Net promoter score is the average of Shift buyers, sellers, and test drivers, 2 YTD 2020 monthly unique visitors averaged ~242K 3 ecommerce Vehicle revenue divided by ecommerce Units 4 Reflects adjusted gross margin, which excludes non - repair labor, excess capacity, and a non - cash contra - revenue adjustment primarily associated with Lithia warrant milestones. Adjusted gross margin is a non - GAAP financial measure. For a reconciliation of adjusted gross margin to its most directly comparable GAAP financial measure see page 43 of the Presentation. Note: These projections are for illustrative purposes only and should not be relied upon as being necessarily indicative of future results. Metrics that are considered non - GAAP financial measures are presented on a non - GAAP basis without reconciliations of such forward - looking non - GAAP measures due to the inherent difficulty in forecasting and quantifying certain amounts that are necessary for such reconciliation. Shift defines Value segment cars as those with > 80,000 miles or > 8 years old. All historical annual GAAP financials shown are audited; quarterly, non - GAAP financials and projections are unaudited.

Technology Platform Drives Growth
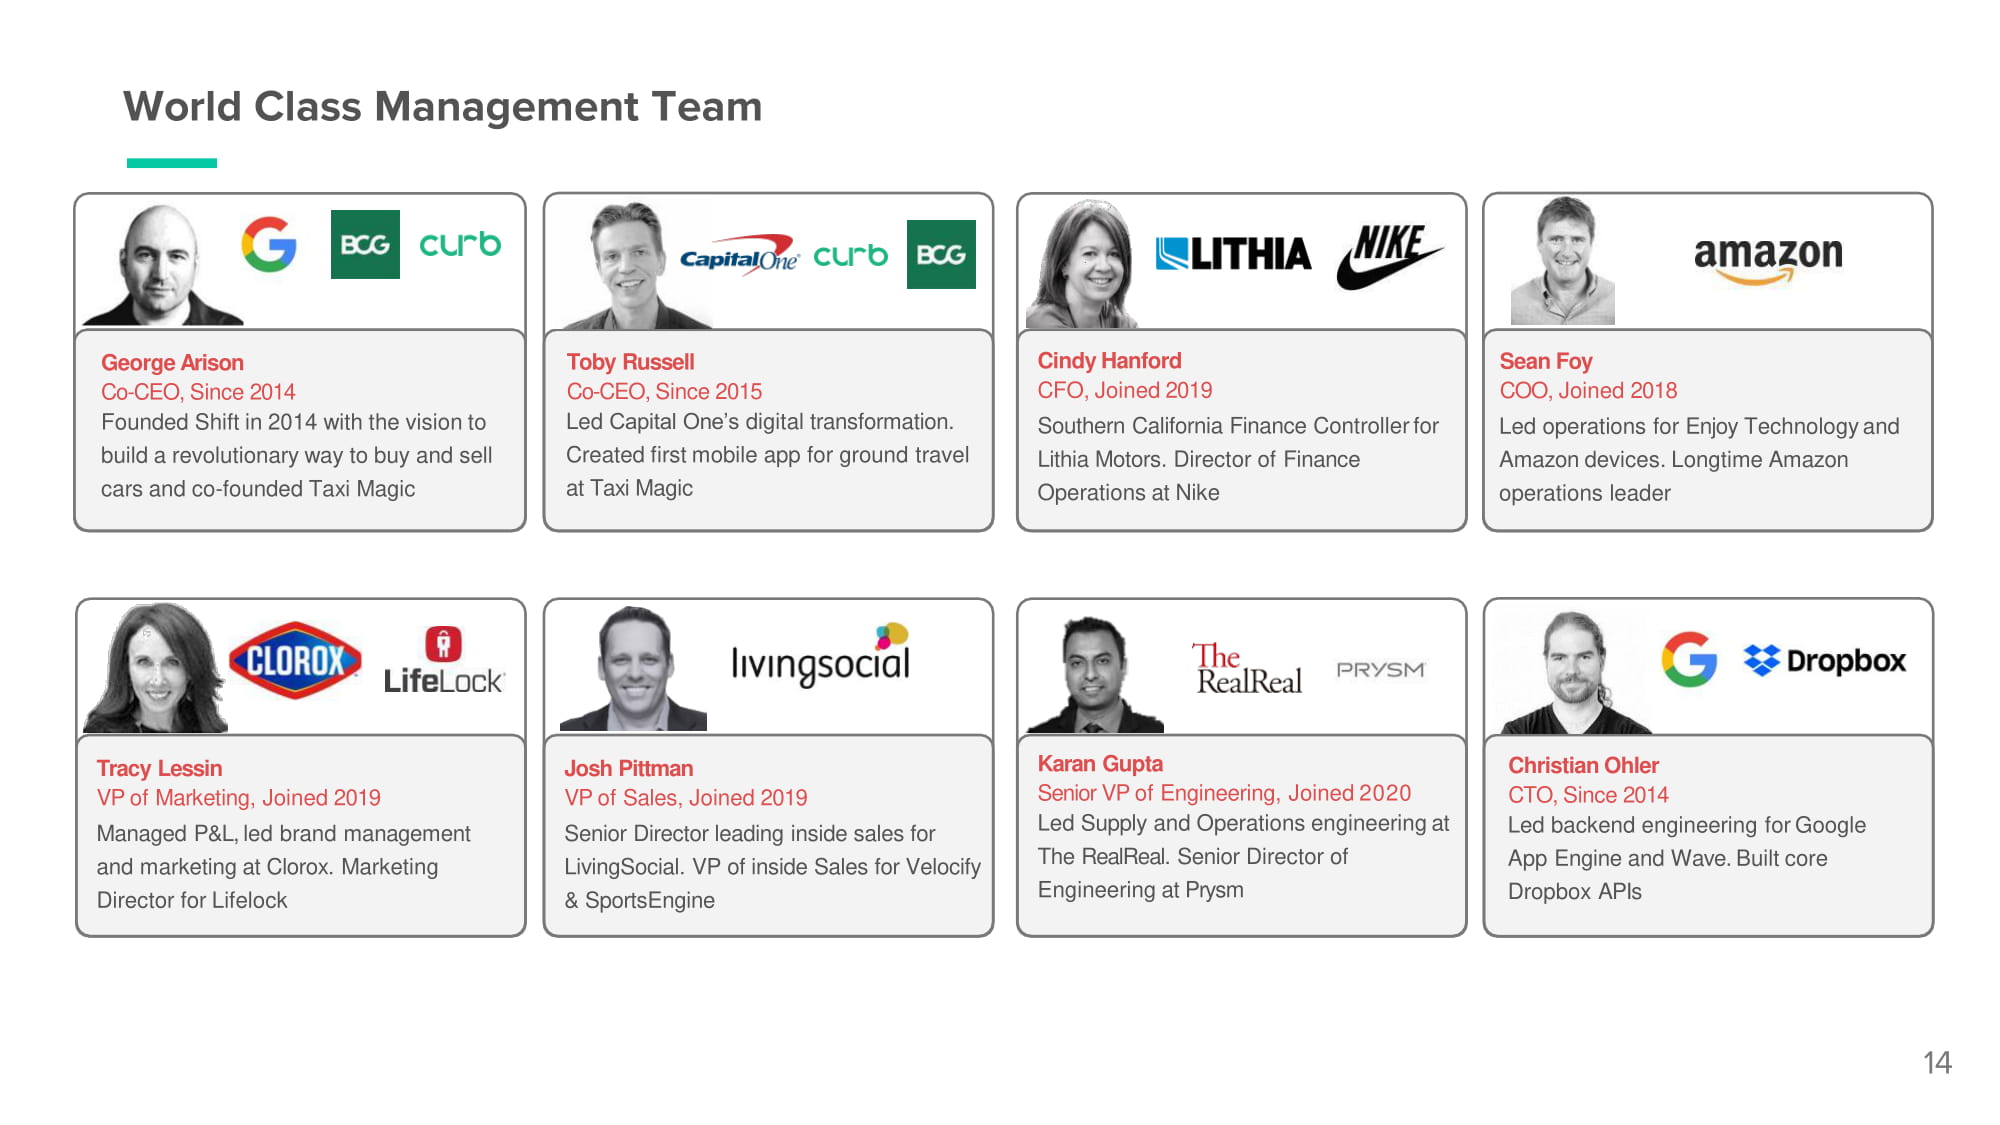
World Class Management Team George Arison Co - CEO, Since 2014 Founded Shift in 2014 with the vision to build a revolutionary way to buy and sell cars and co - founded Taxi Magic Sean Foy COO, Joined 2018 Led operations for Enjoy Technology and Amazon devices. Longtime Amazon operations leader Toby Russell Co - CEO, Since 2015 Led Capital One’s digital transformation. Created first mobile app for ground travel at Taxi Magic Cindy Hanford CFO, Joined 2019 Southern California Finance Controller for Lithia Motors. Director of Finance Operations at Nike Christian Ohler CTO, Since 2014 Led backend engineering for Google App Engine and Wave. Built core Dropbox APIs Tracy Lessin VP of Marketing, Joined 2019 Managed P&L, led brand management and marketing at Clorox. Marketing Director for Lifelock Karan Gupta Senior VP of Engineering, Joined 2020 Led Supply and Operations engineering at The RealReal. Senior Director of Engineering at Prysm Josh Pittman VP of Sales, Joined 2019 Senior Director leading inside sales for LivingSocial. VP of inside Sales for Velocify & SportsEngine 14
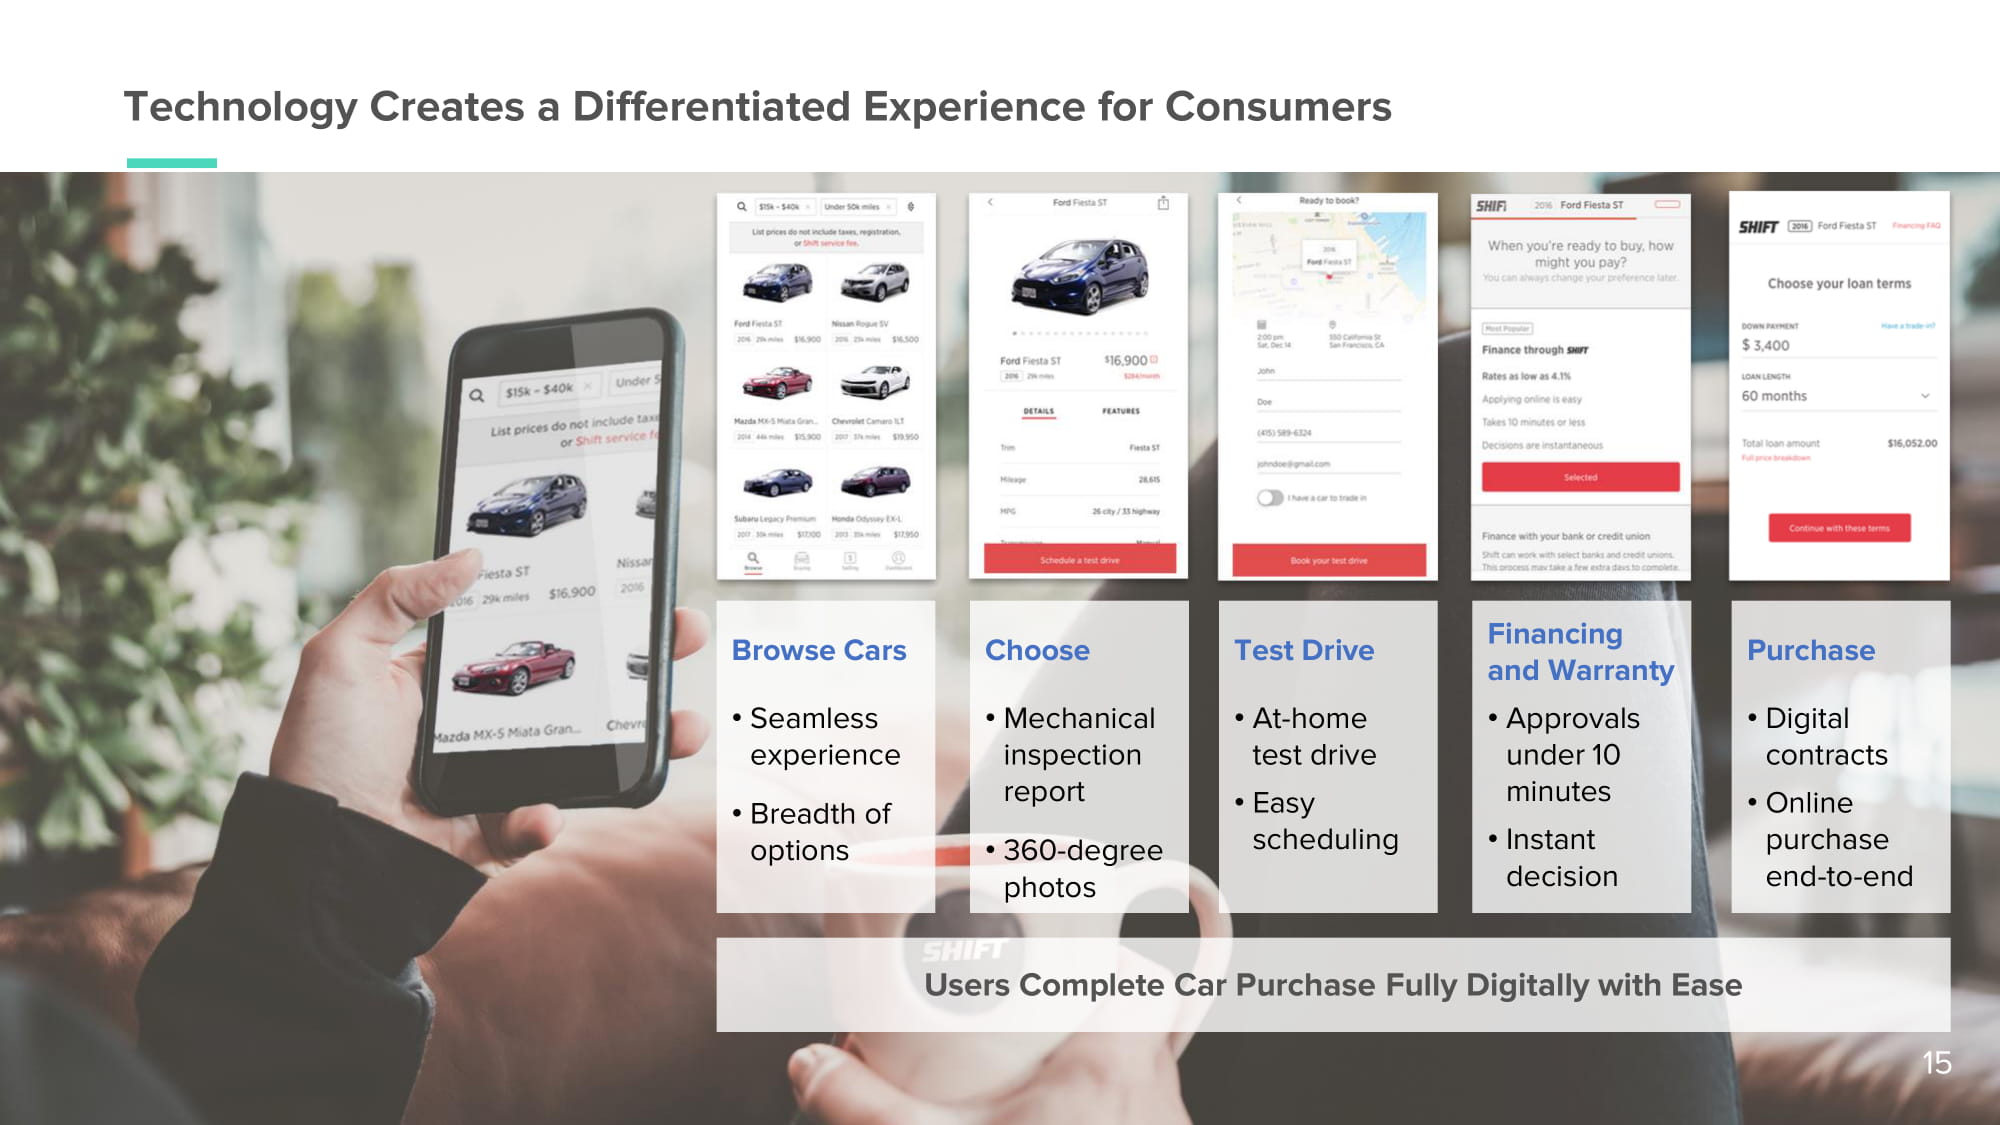
Browse Cars • Seamless experience • Breadth of options Choose • M e c hani c a l inspection report • 3 6 0 - de gree photos Test Drive • At - home test drive • Easy s c he du li n g Financing and Warranty • A pp r o v a l s under 10 minutes • Instant de c i s i o n Purchase • Digital contracts • Online purchase e nd - t o - e n d Technology Creates a Differentiated Experience for Consumers 15 Users Complete Car Purchase Fully Digitally with Ease
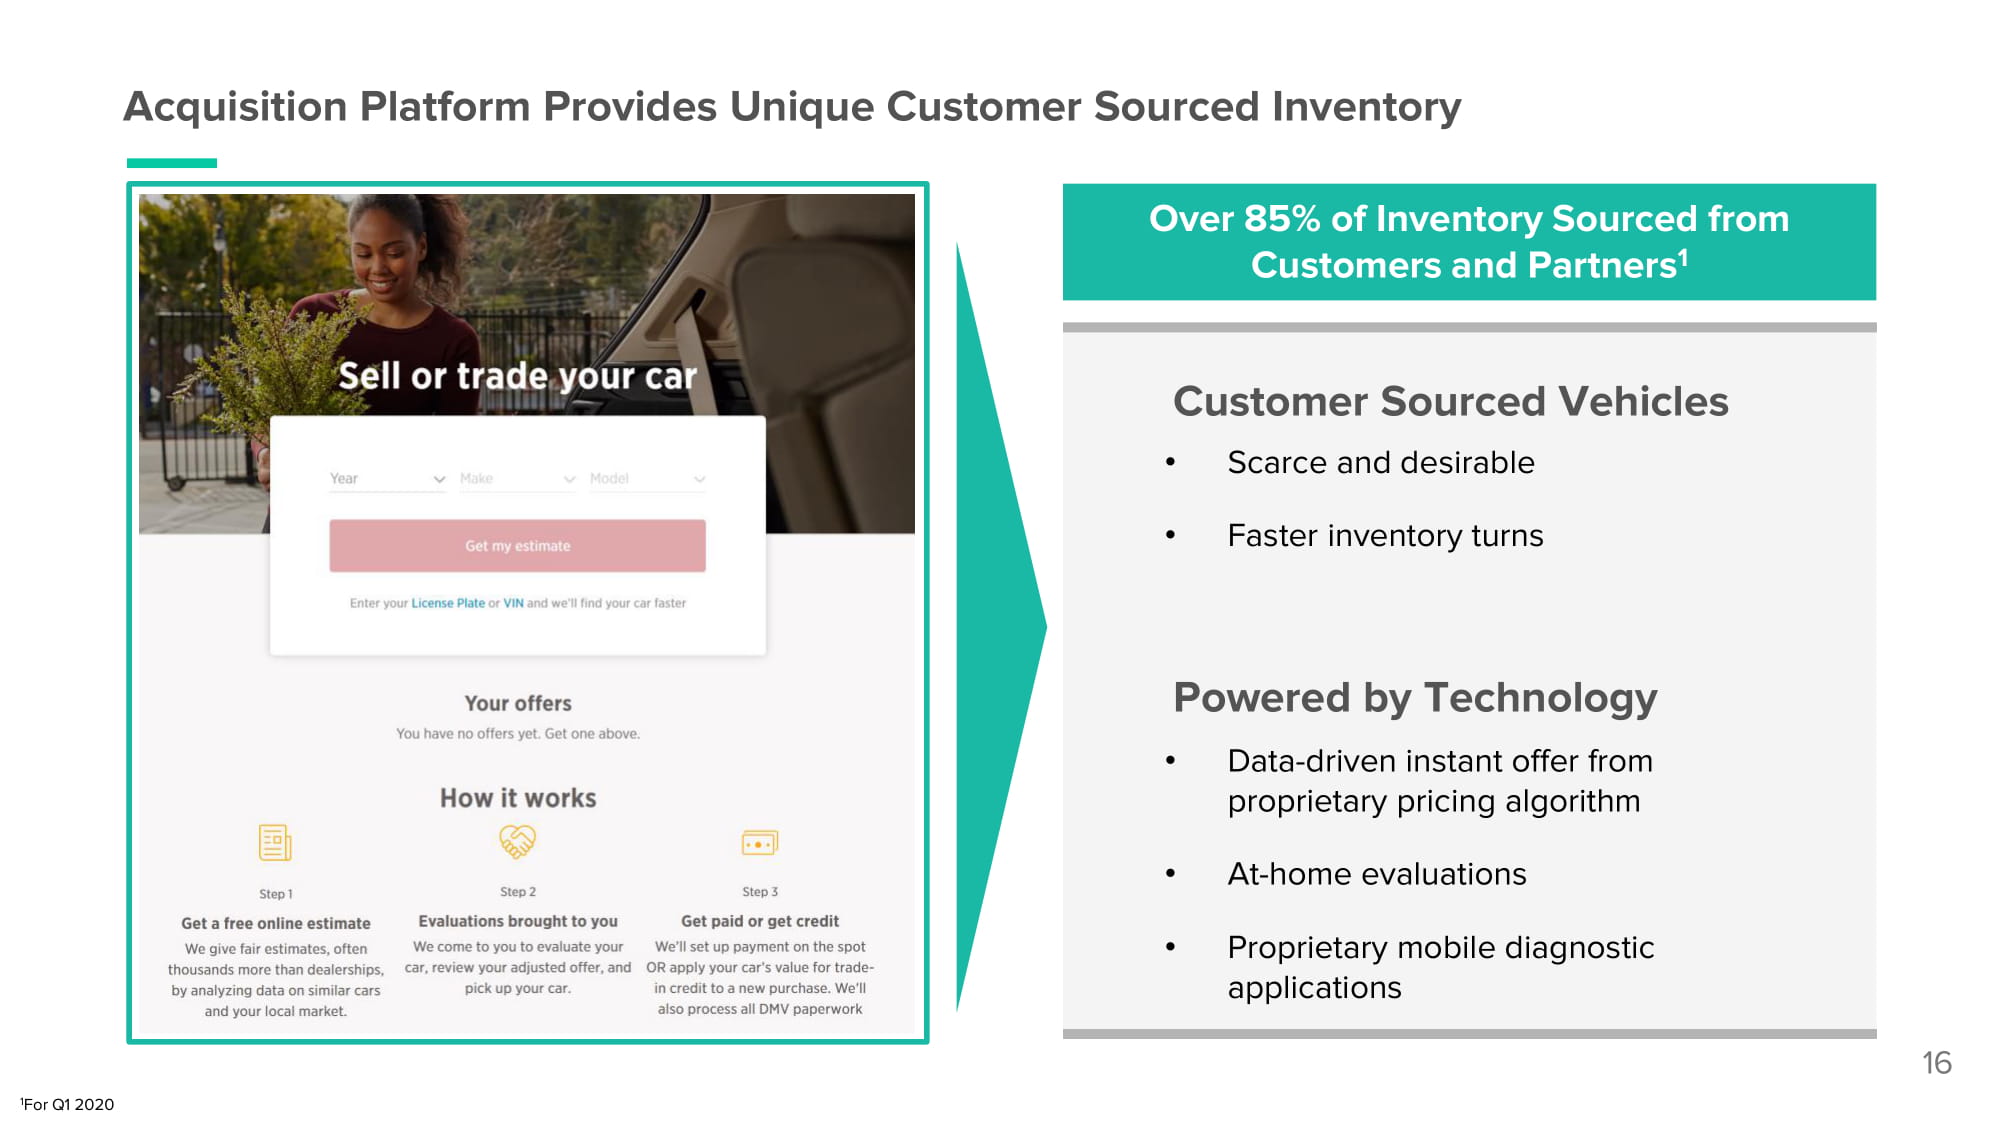
Acquisition Platform Provides Unique Customer Sourced Inventory Customer Sourced Vehicles • Scarce and desirable • Faster inventory turns Powered by Technology • Data - driven instant offer from proprietary pricing algorithm • At - home evaluations • Proprietary mobile diagnostic applications Over 85% of Inventory Sourced from Customers and Partners 1 16 1 For Q1 2020
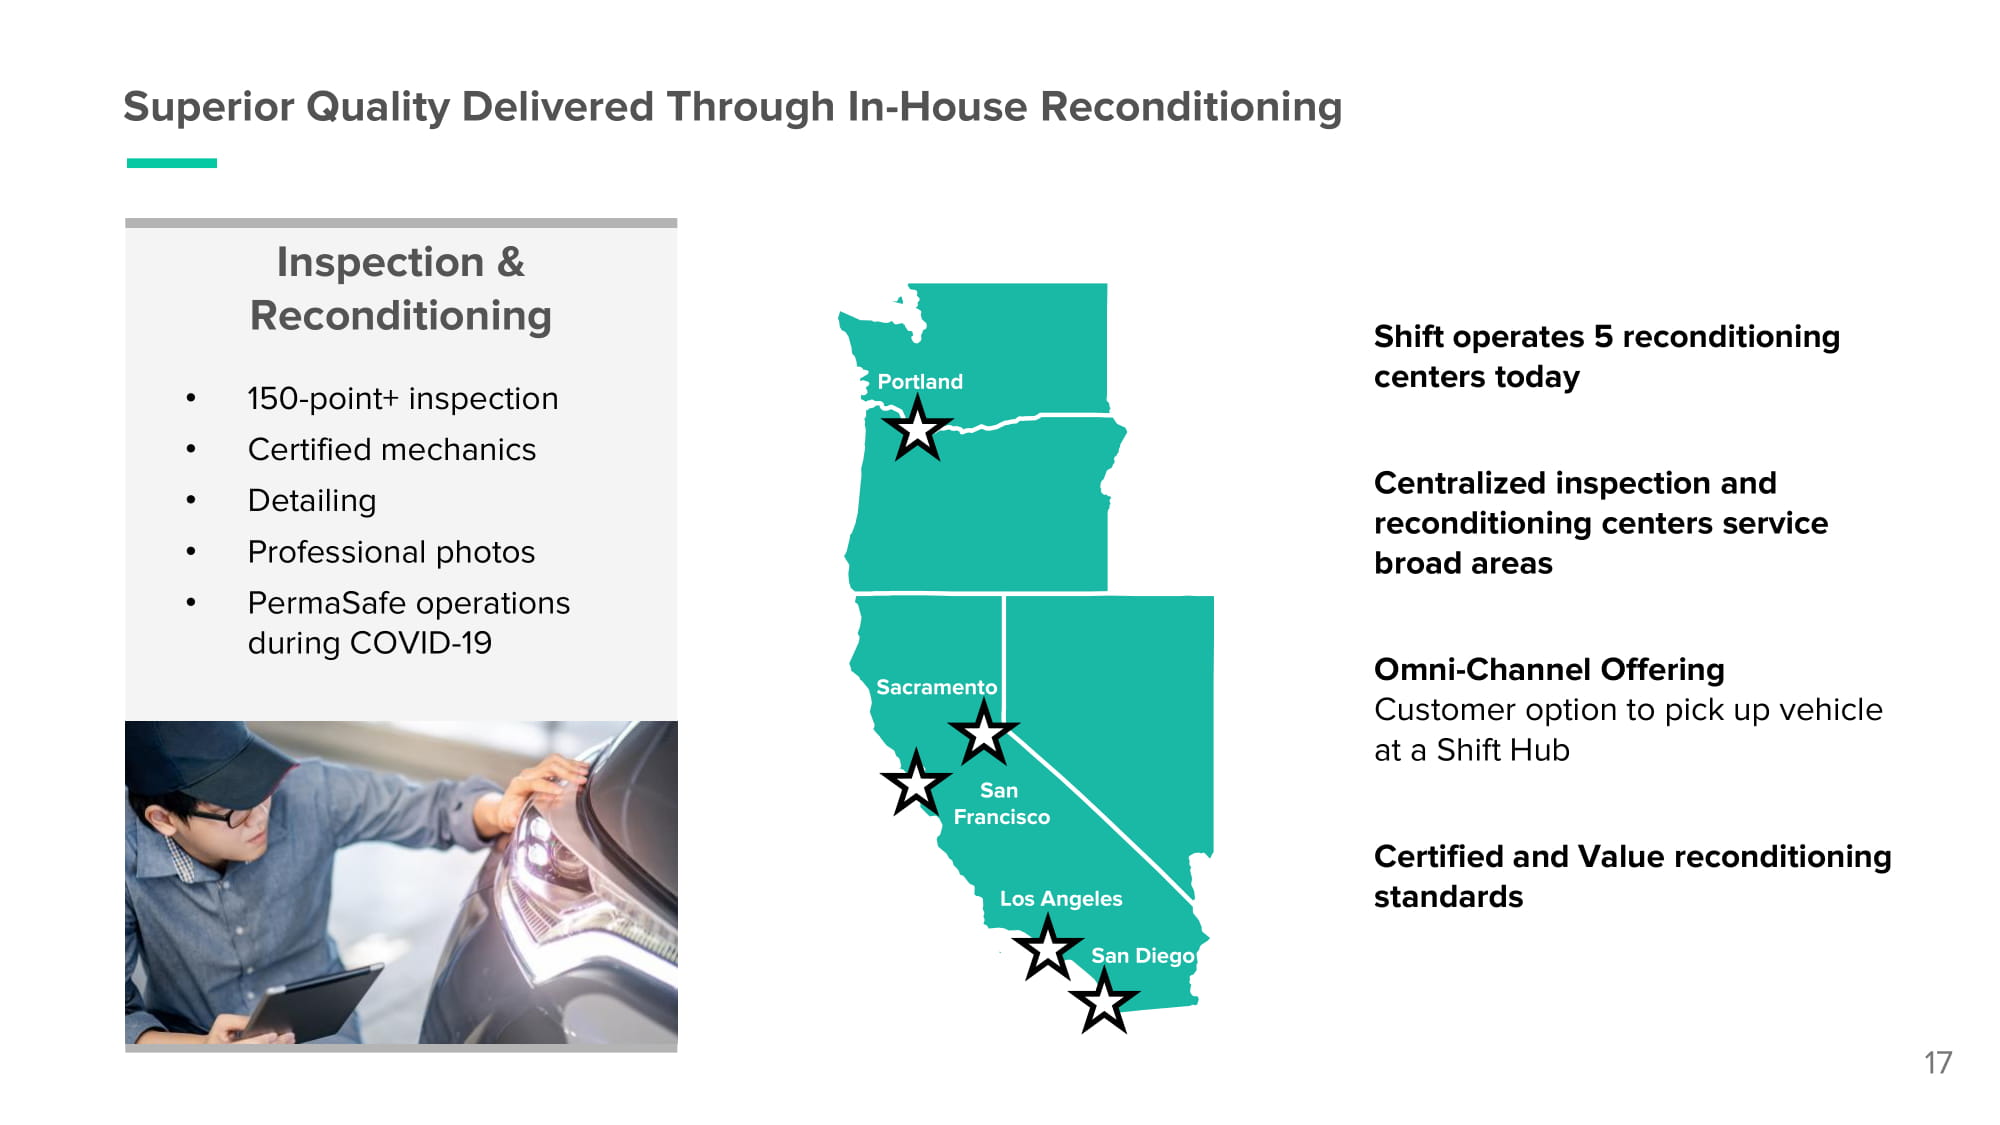
Superior Quality Delivered Through In - House Reconditioning Inspection & R e c o ndi tioni ng • 150 - point+ inspection • Certified mechanics • Detailing • Professional photos • PermaSafe operations during COVID - 19 17 Shift operates 5 reconditioning centers today Centralized inspection and reconditioning centers service broad areas Omni - Channel Offering Customer option to pick up vehicle at a Shift Hub Certified and Value reconditioning standards P o rt l a n d San F ra n c is c o S ac ra ment o Los Angeles San Diego
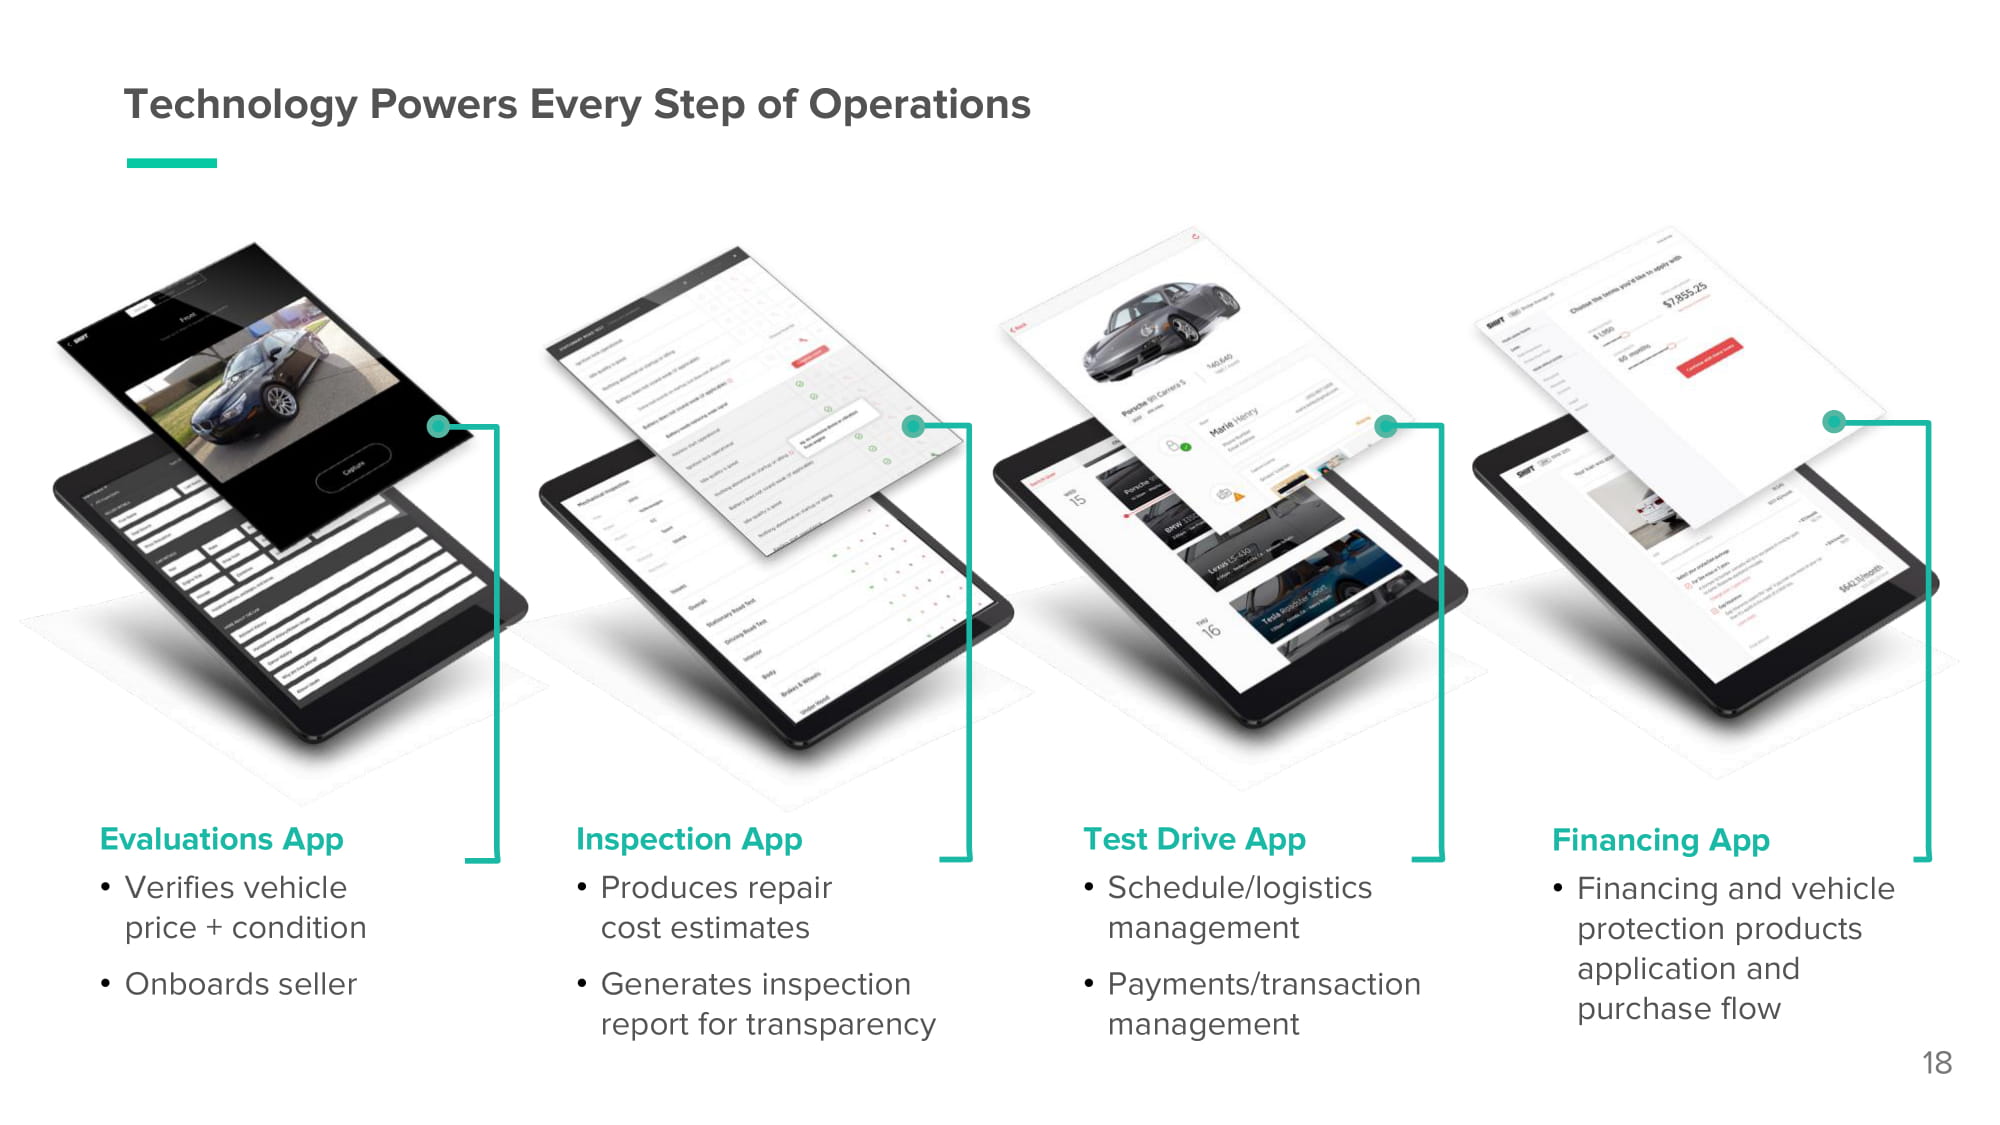
Test Drive App • S c h e d ul e / l o g i s t i c s management • P ay men t s / t ra ns a c t i on management Inspection App • Produces repair cost estimates • Generates inspection report for transparency Evaluations App • Verifies vehicle price + condition • Onboards seller Financing App • Financing and vehicle protection products application and purchase flow Technology Powers Every Step of Operations 18
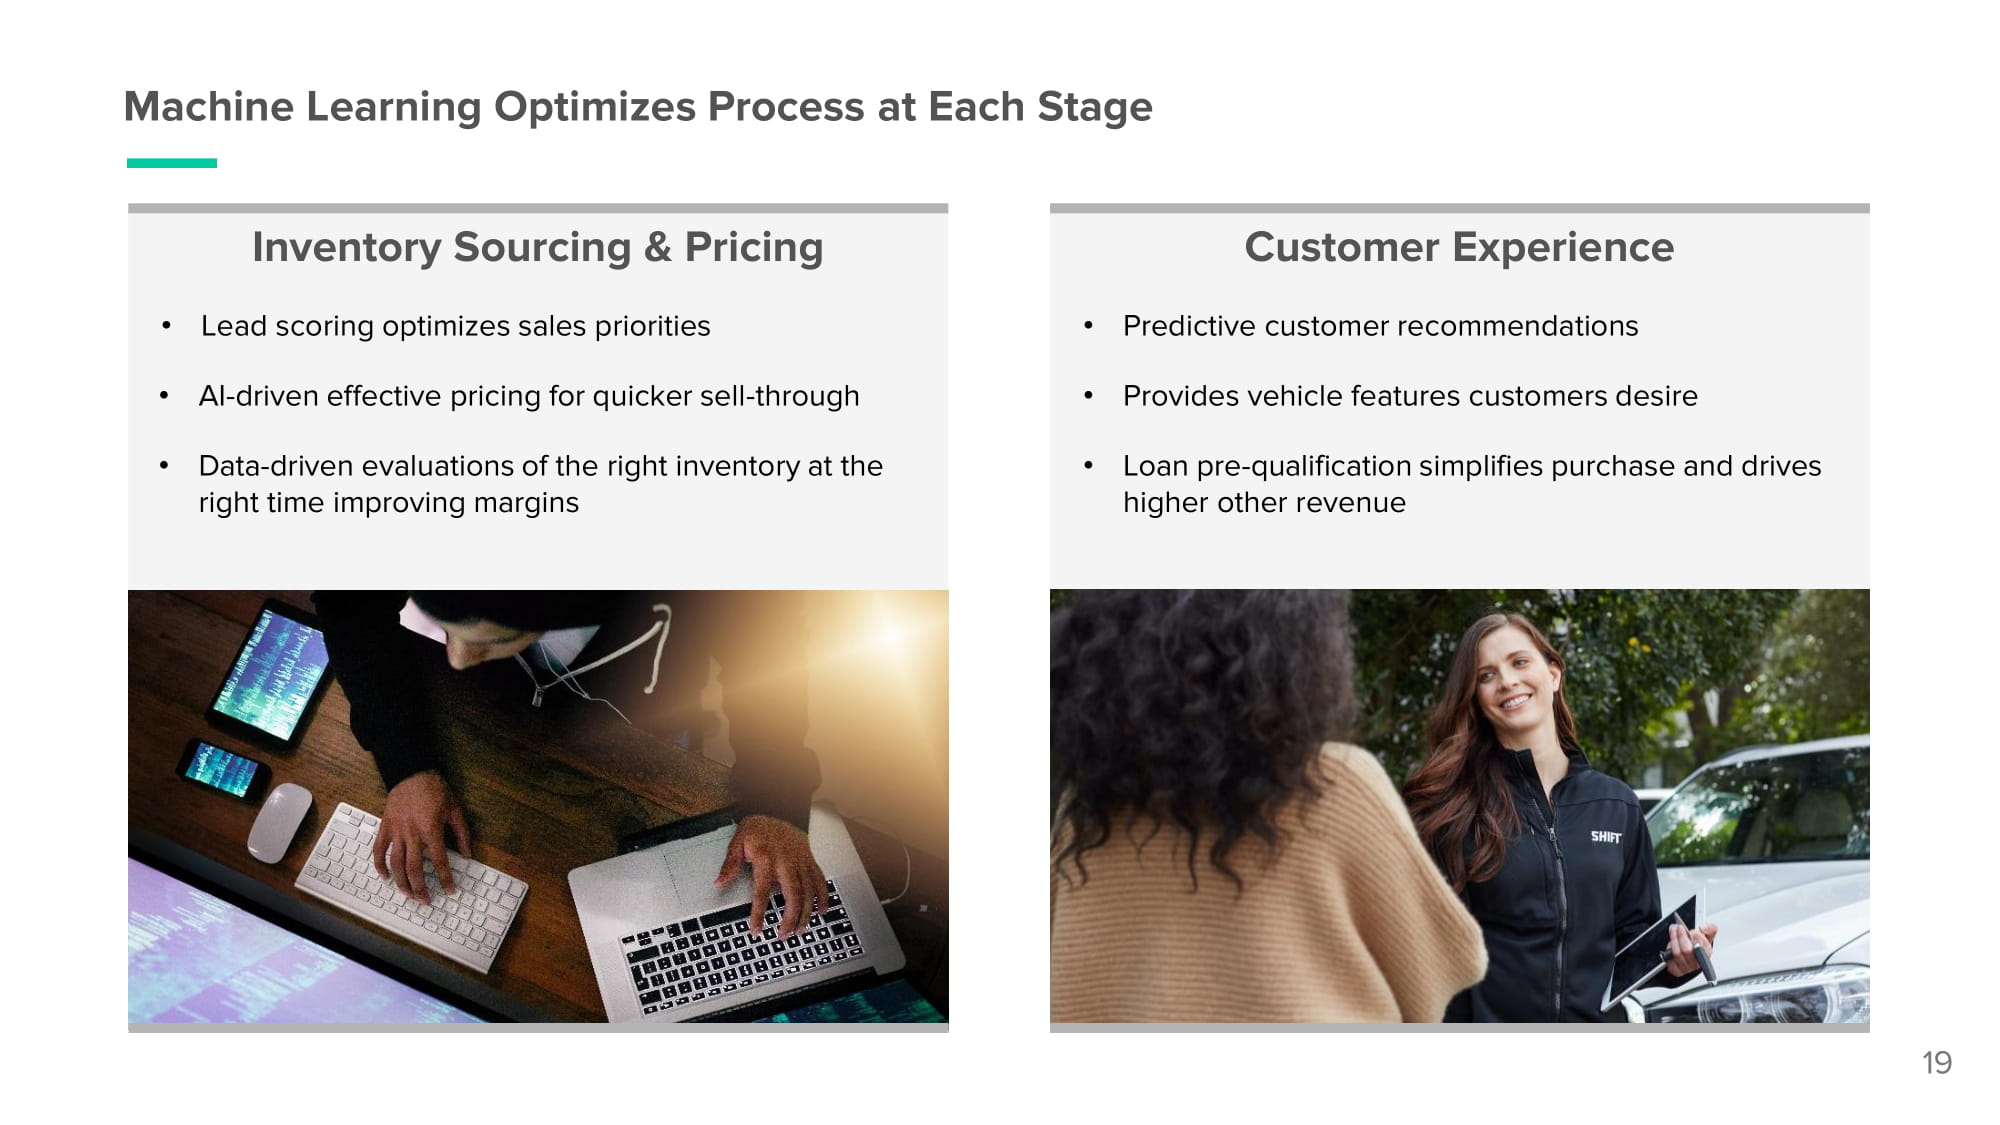
Inventory Sourcing & Pricing • Lead scoring optimizes sales priorities • AI - driven effective pricing for quicker sell - through • Data - driven evaluations of the right inventory at the right time improving margins Customer Experience • Predictive customer recommendations • Provides vehicle features customers desire • Loan pre - qualification simplifies purchase and drives higher other revenue Machine Learning Optimizes Process at Each Stage 19
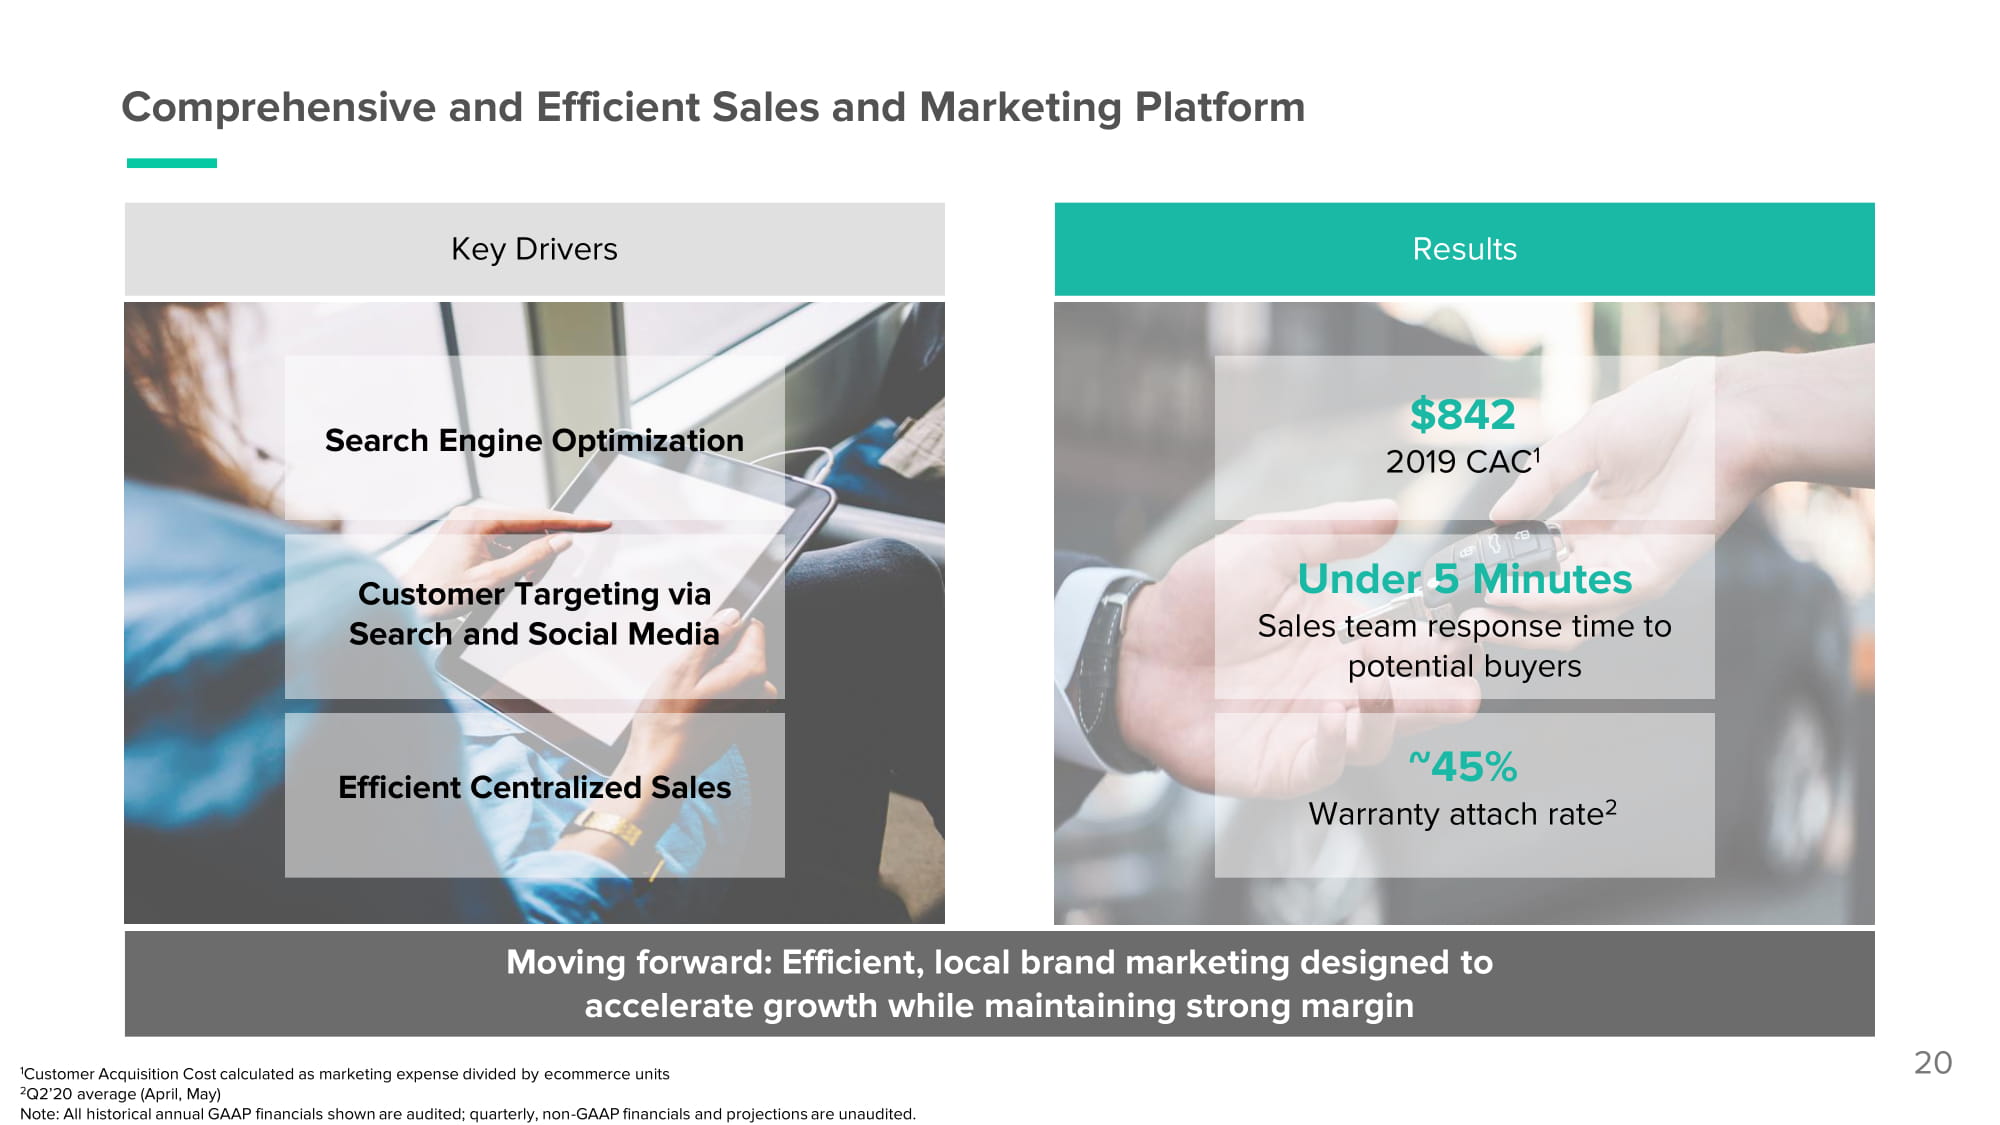
Comprehensive and Efficient Sales and Marketing Platform Moving forward: Efficient, local brand marketing designed to accelerate growth while maintaining strong margin 1 Customer Acquisition Cost calculated as marketing expense divided by ecommerce units 2 Q2’20 average (April, May) Note: All historical annual GAAP financials shown are audited; quarterly, non - GAAP financials and projections are unaudited. Results Key Drivers Efficient Centralized Sales Search Engine Optimization Customer Targeting via Search and Social Media Under 5 Minutes Sales team response time to potential buyers $842 2019 CAC 1 ~45% Warranty attach rate 2 20
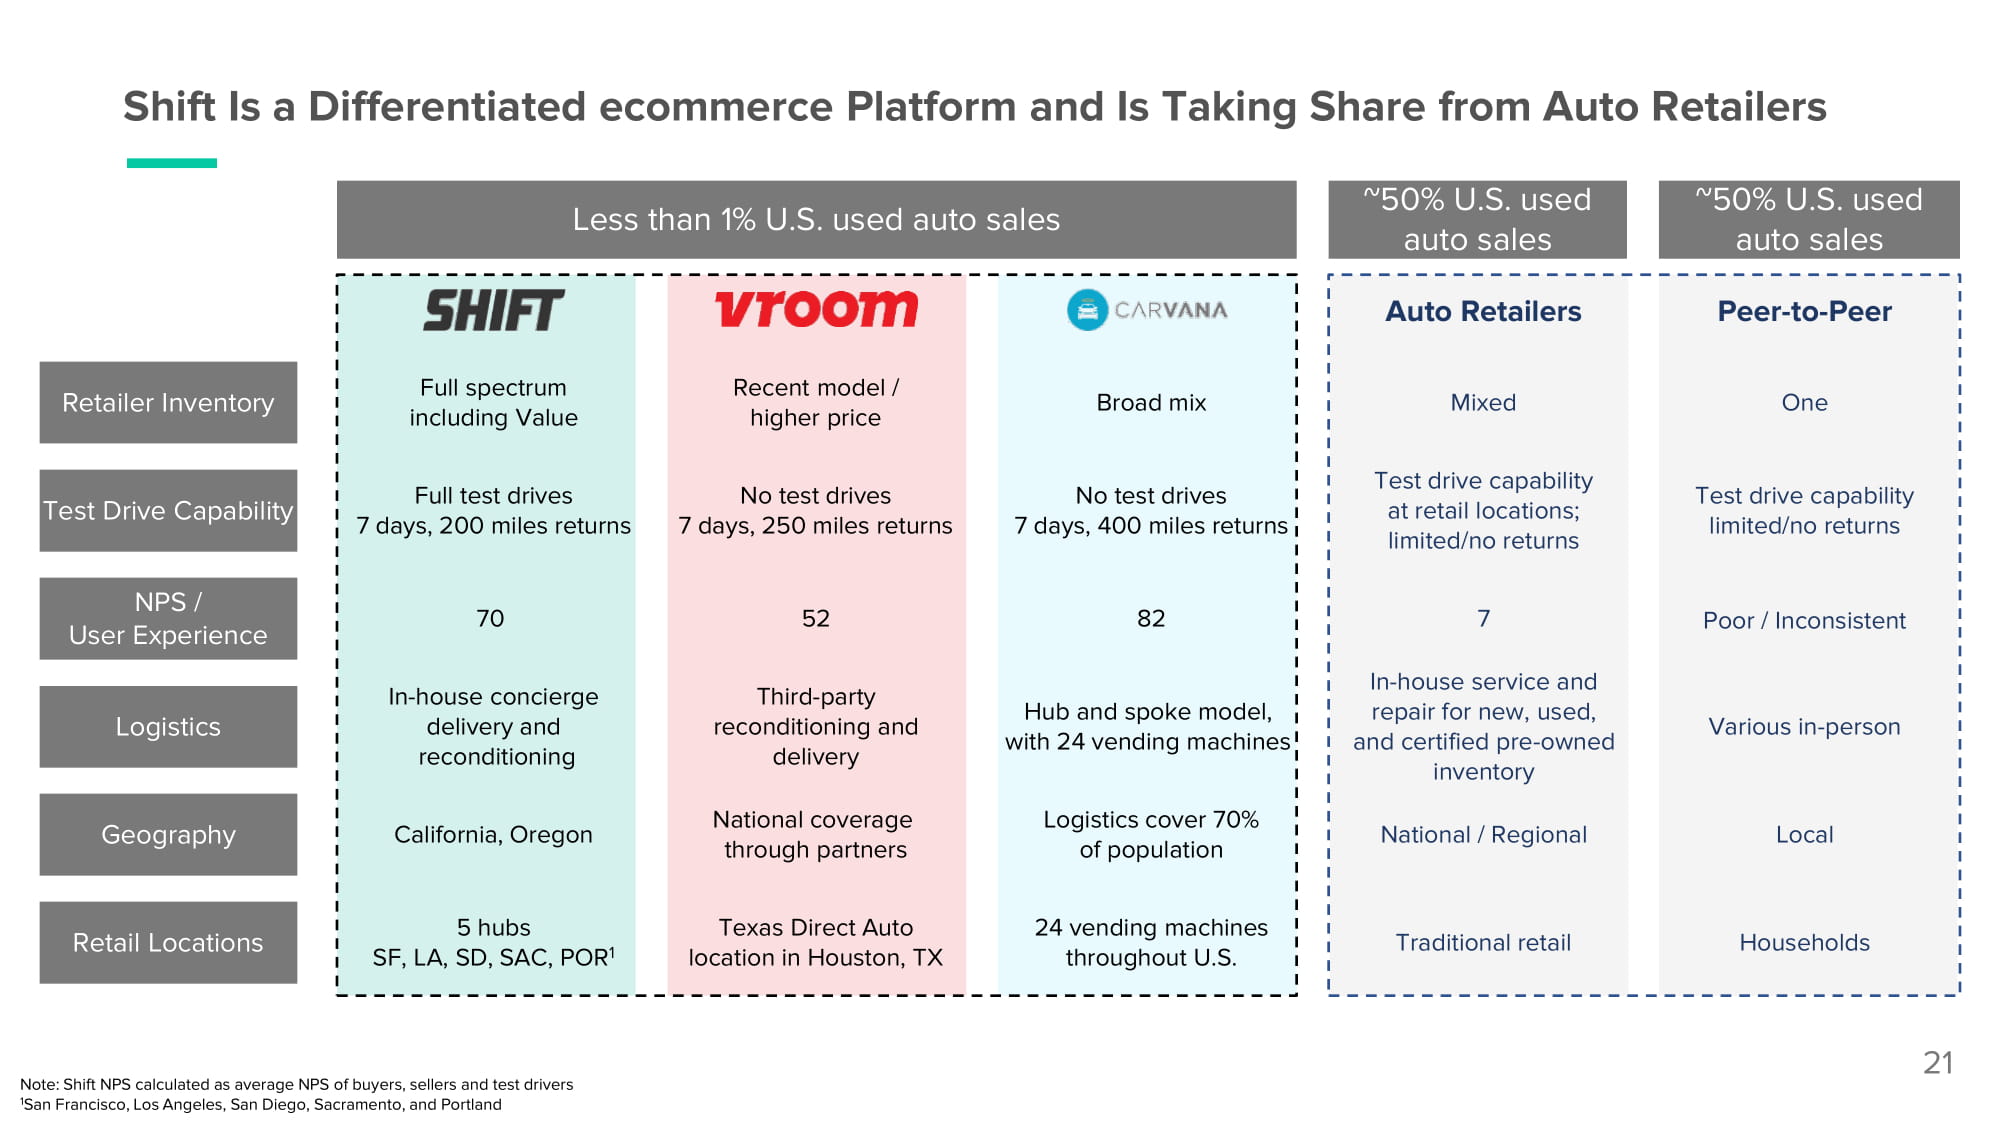
21 Shift Is a Differentiated ecommerce Platform and Is Taking Share from Auto Retailers Full spectrum including Value Recent model / higher price Broad mix Full test drives 7 days, 200 miles returns No test drives 7 days, 250 miles returns No test drives 7 days, 400 miles returns 70 52 82 In - house concierge delivery and reconditioning Third - party reconditioning and delivery Hub and spoke model, with 24 vending machines California, Oregon National coverage through partners Logistics cover 70% of population 5 hubs SF, LA, SD, SAC, POR 1 Texas Direct Auto location in Houston, TX 24 vending machines throughout U.S. Auto Retailers Peer - to - Peer Mixed One Test drive capability at retail locations; limited/no returns Test drive capability limited/no returns 7 Poor / Inconsistent In - house service and repair for new, used, and certified pre - owned inventory Various in - person National / Regional Local Traditional retail Households Logistics Retailer Inventory Test Drive Capability NPS / User Experience Retail Locations Geography Note: Shift NPS calculated as average NPS of buyers, sellers and test drivers 1 San Francisco, Los Angeles, San Diego, Sacramento, and Portland Less than 1% U.S. used auto sales ~50% U.S. used auto sales ~50% U.S. used auto sales
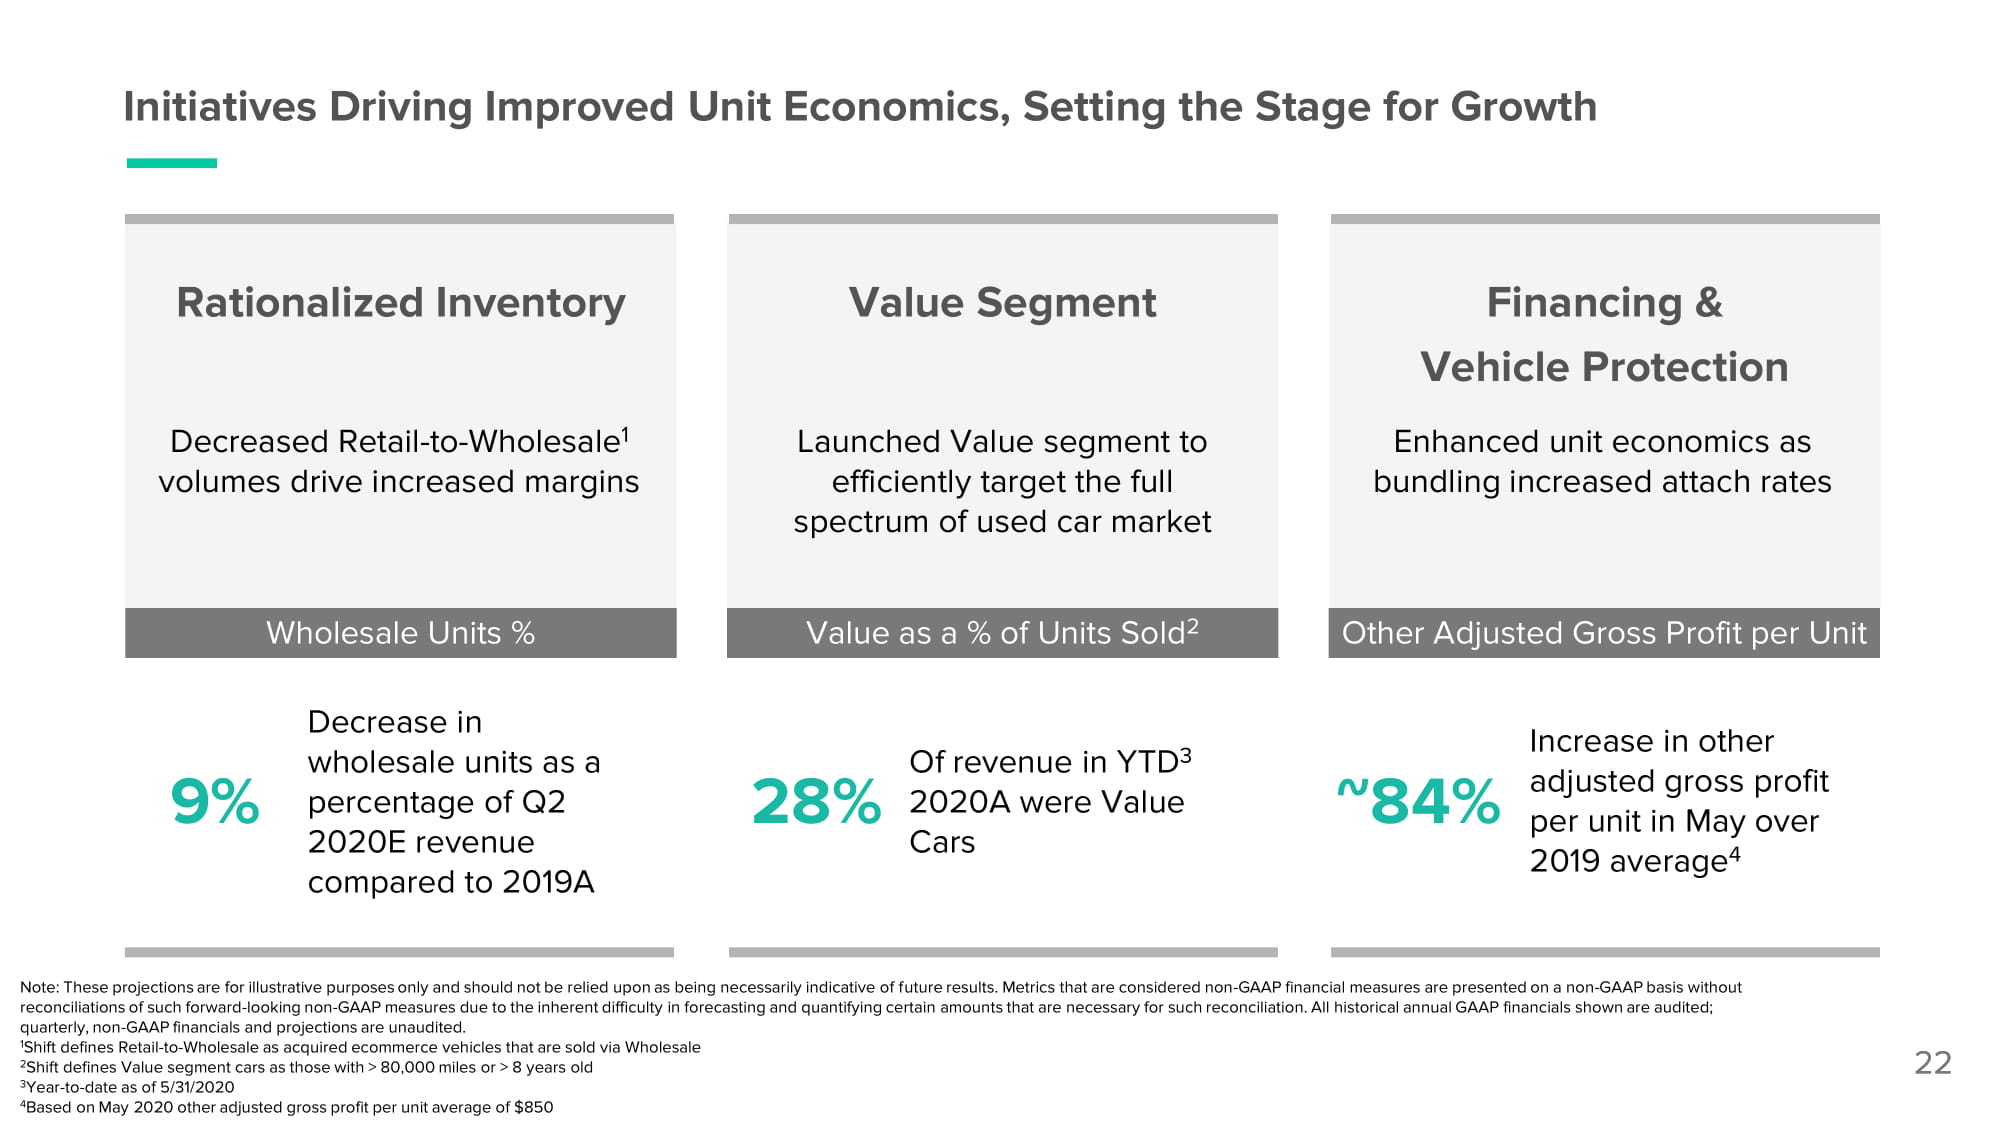
Initiatives Driving Improved Unit Economics, Setting the Stage for Growth Value Segment Rationalized Inventory 22 Launched Value segment to efficiently target the full spectrum of used car market Decreased Retail - to - Wholesale 1 volumes drive increased margins Financing & Vehicle Protection Enhanced unit economics as bundling increased attach rates Wholesale Units % Other Adjusted Gross Profit per Unit Value as a % of Units Sold 2 Decrease in wholesale units as a percentage of Q2 2020E revenue compared to 2019A 9 % Of revenue in YTD 3 2020 A were Value Cars 28% Increase in other adjusted gross profit per unit in May over 2019 average 4 ~84% Note: These projections are for illustrative purposes only and should not be relied upon as being necessarily indicative of future results. Metrics that are considered non - GAAP financial measures are presented on a non - GAAP basis without reconciliations of such forward - looking non - GAAP measures due to the inherent difficulty in forecasting and quantifying certain amounts that are necessary for such reconciliation. All historical annual GAAP financials shown are audited; quarterly, non - GAAP financials and projections are unaudited. 1 Shift defines Retail - to - Wholesale as acquired ecommerce vehicles that are sold via Wholesale 2 Shift defines Value segment cars as those with > 80,000 miles or > 8 years old 3 Year - to - date as of 5/31/2020 4 Based on May 2020 other adjusted gross profit per unit average of $850

Compelling Growth Trajectory
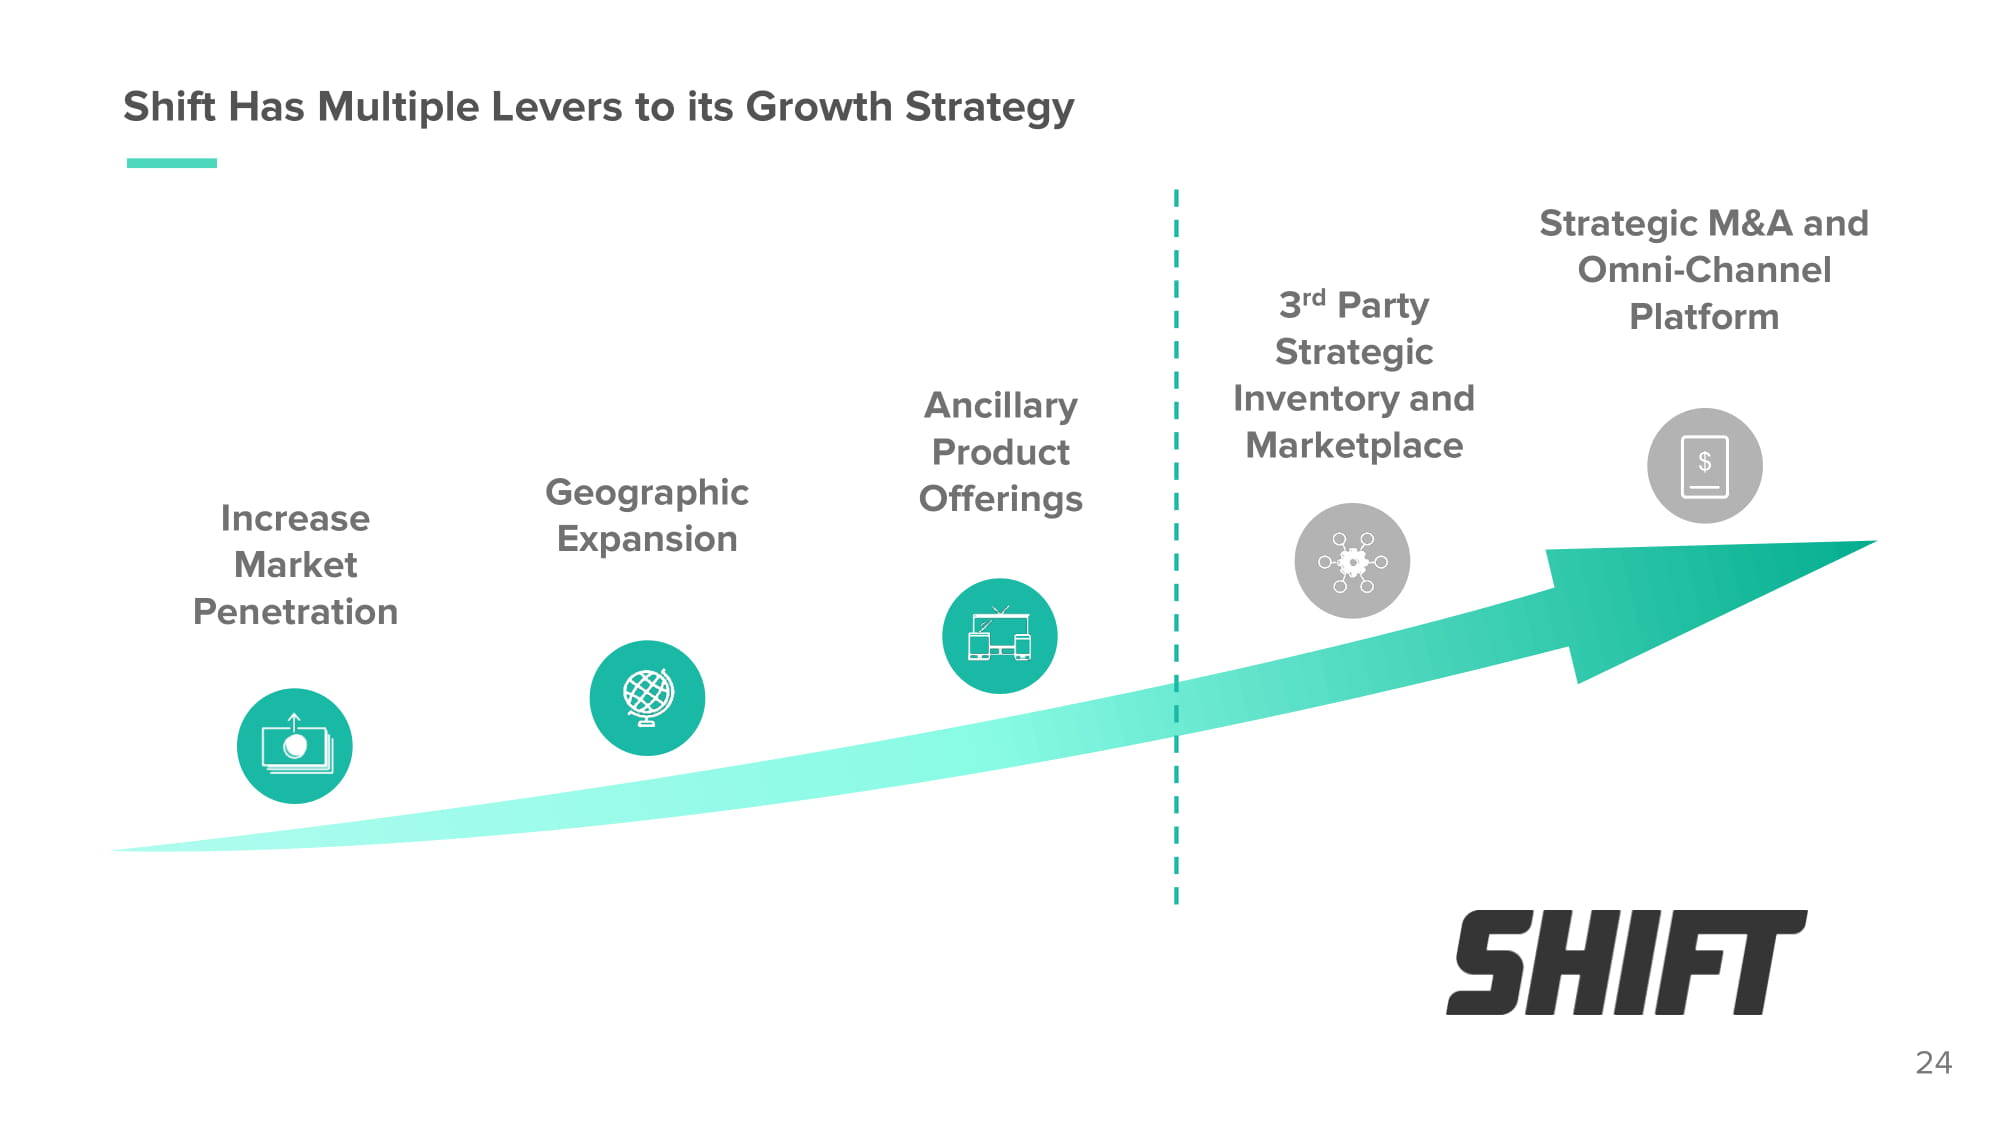
Shift Has Multiple Levers to its Growth Strategy 3 rd Party Strategic Inventory and Marketplace Ancillary Product O f f er i ngs Geographic Expansion Increase Market Pe n e t rat i on Strategic M&A and Omni - Channel Platform 24
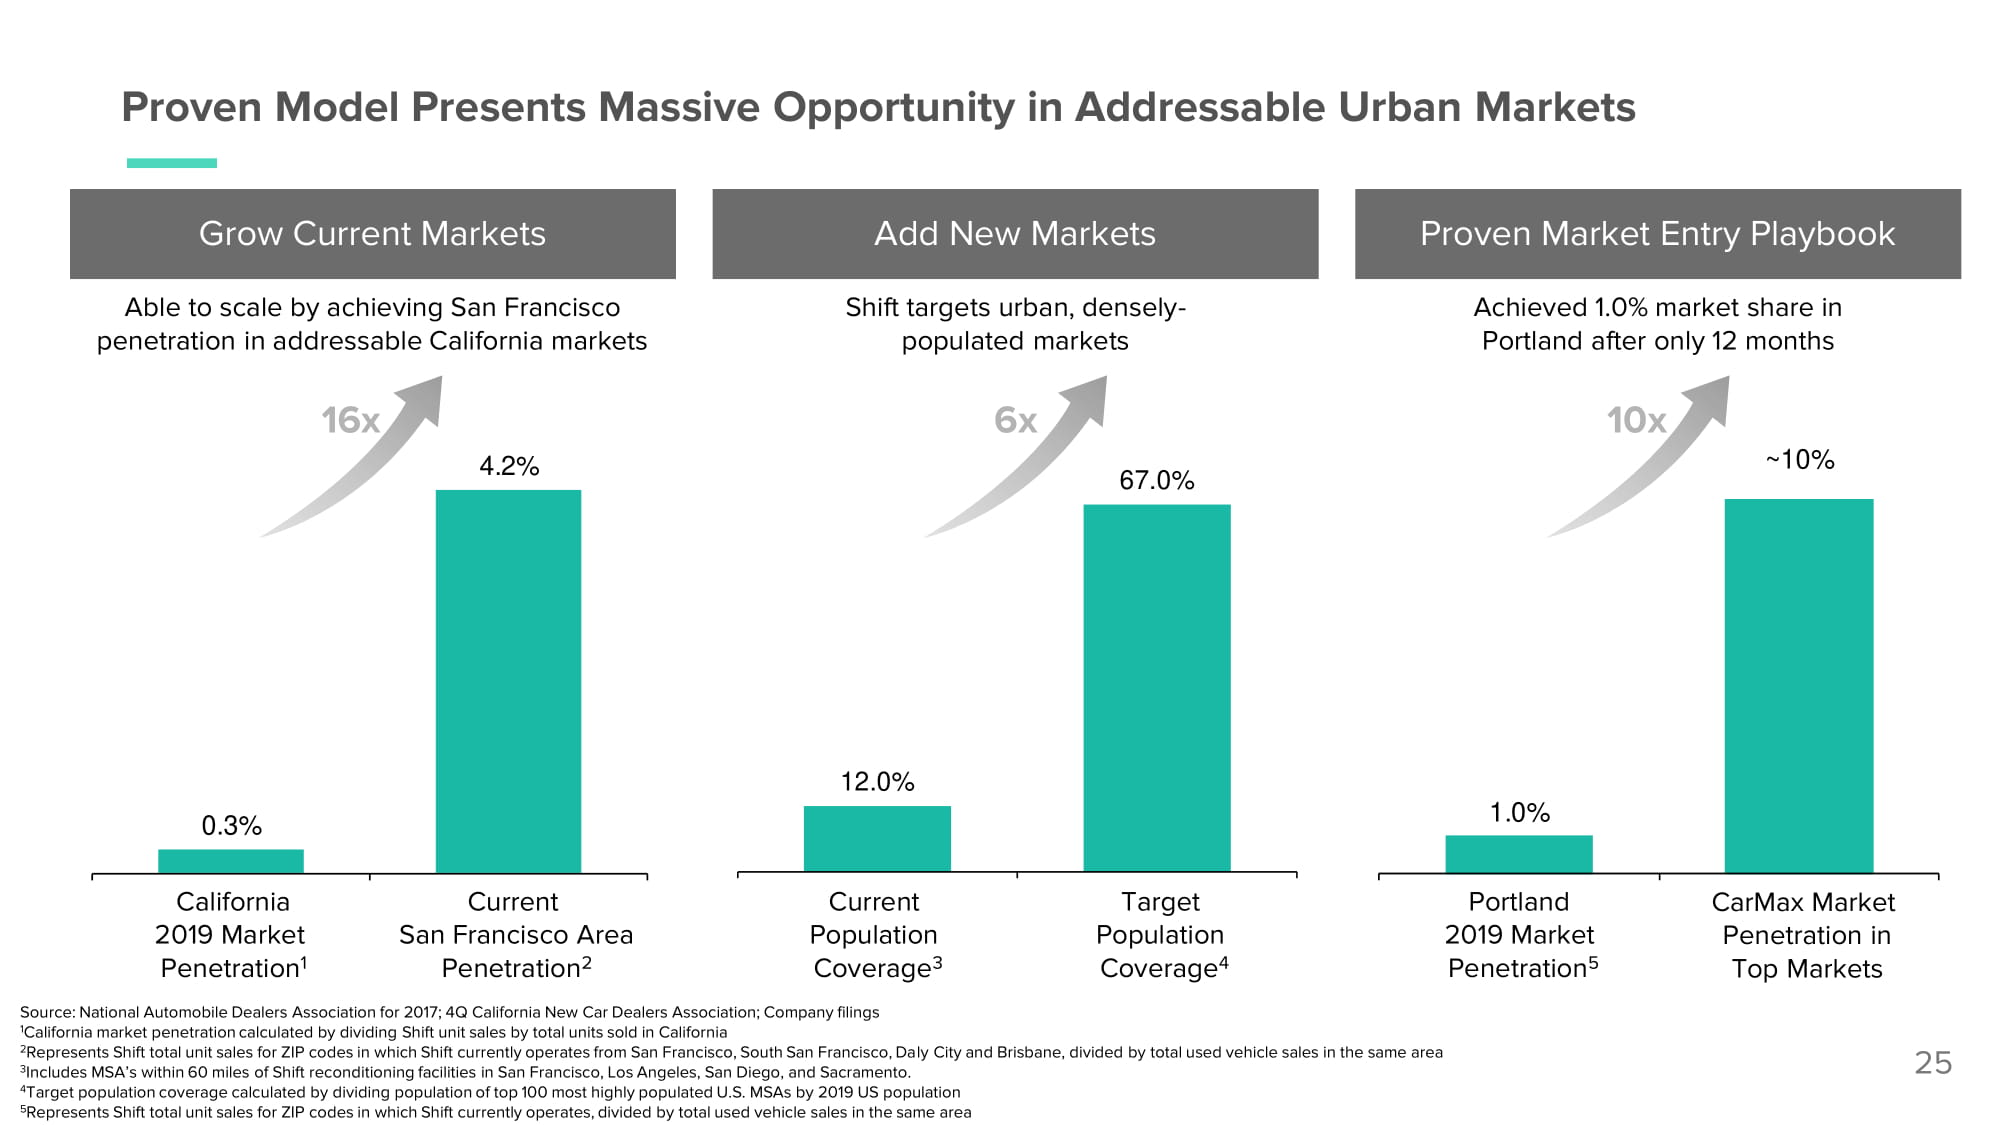
1 . 0 % ~ 10% Proven Model Presents Massive Opportunity in Addressable Urban Markets 25 Grow Current Markets California 2019 Market Penetration 1 Current San Francisco Area Penetration 2 Current Population Coverage 3 Target Population Coverage 4 Source: National Automobile Dealers Association for 2017; 4Q California New Car Dealers Association; Company filings 1 California market penetration calculated by dividing Shift unit sales by total units sold in California 2 Represents Shift total unit sales for ZIP codes in which Shift currently operates from San Francisco, South San Francisco, Daly City and Brisbane, divided by total used vehicle sales in the same area 3 Includes MSA’s within 60 miles of Shift reconditioning facilities in San Francisco, Los Angeles, San Diego, and Sacramento. 4 Target population coverage calculated by dividing population of top 100 most highly populated U.S. MSAs by 2019 US population 5 Represents Shift total unit sales for ZIP codes in which Shift currently operates, divided by total used vehicle sales in the same area 16x Shift targets urban, densely - populated markets Achieved 1.0% market share in Portland after only 12 months Portland 2019 Market Penetration 5 CarMax Market Penetration in Top Markets Proven Market Entry Playbook Add New Markets Able to scale by achieving San Francisco penetration in addressable California markets 10 x 12.0% 67.0% 0 . 3% 4 . 2% 6 x
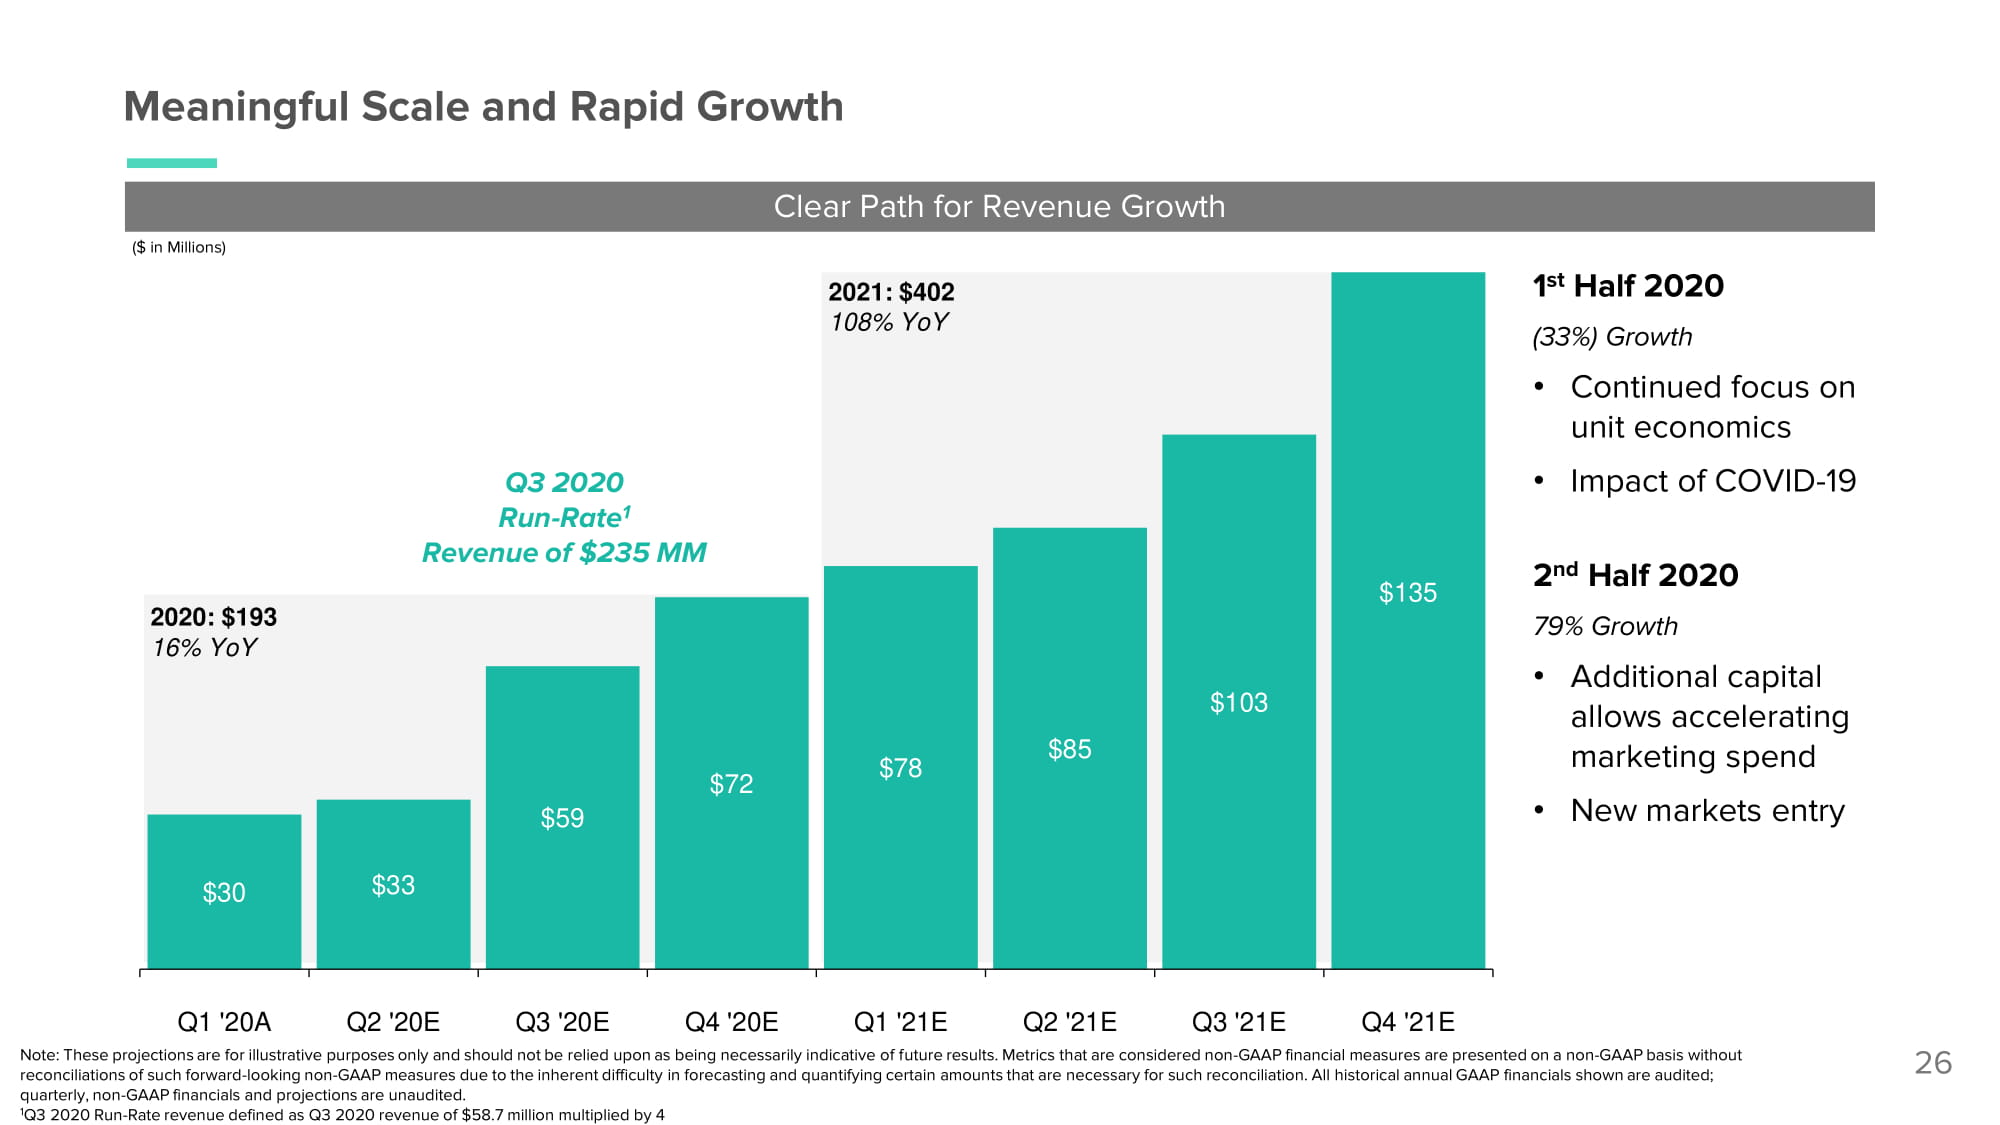
26 Meaningful Scale and Rapid Growth $30 $33 $59 $72 $78 $85 $103 $135 2020: $193 16% YoY 2021: $402 108% YoY ($ in Millions) Q3 2020 Run - Rate 1 Revenue of $235 MM 1 st Half 2020 (33%) Growth • Continued focus on unit economics • Impact of COVID - 19 2 nd Half 2020 79% Growth • Additional capital allows accelerating marketing spend • New markets entry Clear Path for Revenue Growth Q1 '20A Q2 '20E Q3 '20E Q4 '20E Q1 '21E Q2 '21E Q3 '21E Q4 '21E Note: These projections are for illustrative purposes only and should not be relied upon as being necessarily indicative of future results. Metrics that are considered non - GAAP financial measures are presented on a non - GAAP basis without reconciliations of such forward - looking non - GAAP measures due to the inherent difficulty in forecasting and quantifying certain amounts that are necessary for such reconciliation. All historical annual GAAP financials shown are audited; quarterly, non - GAAP financials and projections are unaudited. 1 Q3 2020 Run - Rate revenue defined as Q3 2020 revenue of $58.7 million multiplied by 4

Financial Update and Projections
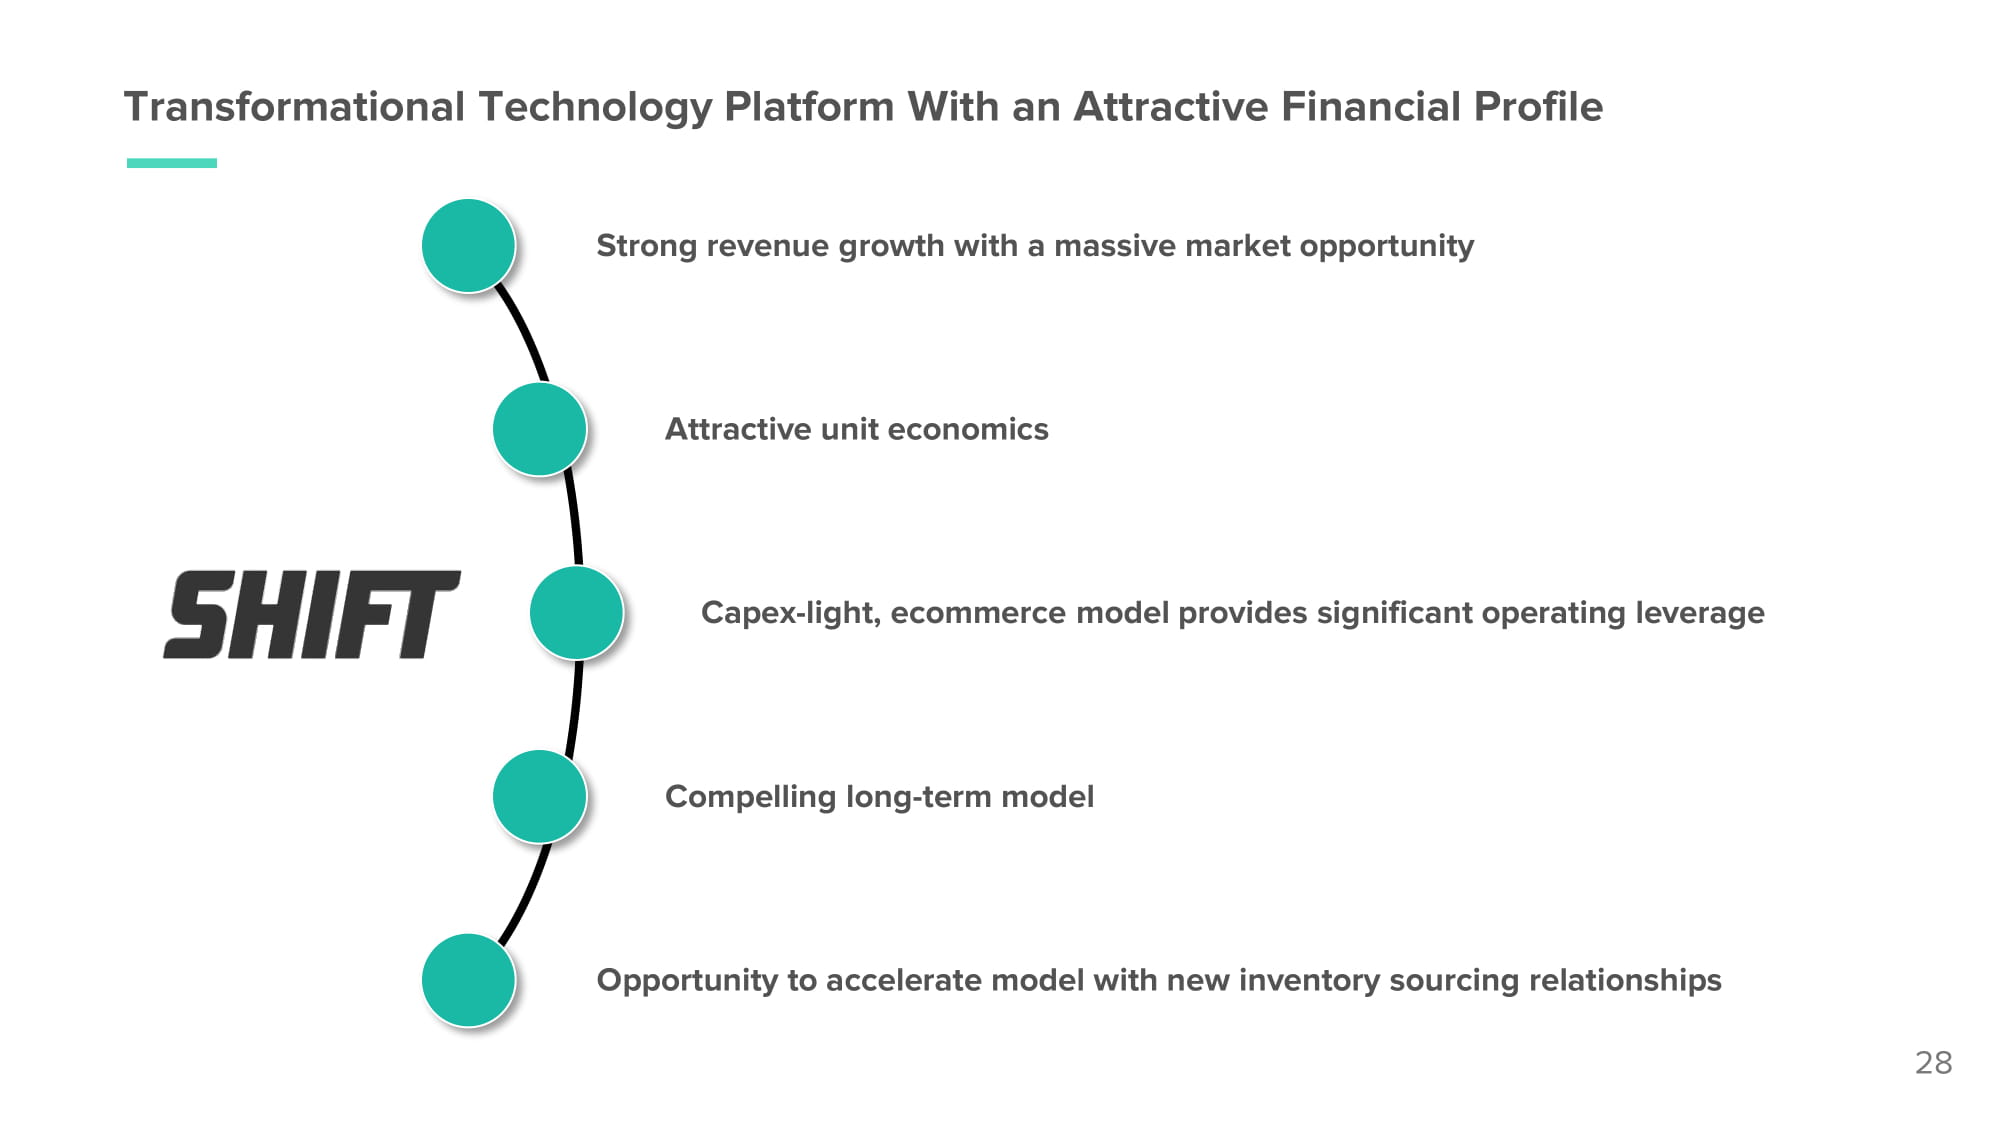
Transformational Technology Platform With an Attractive Financial Profile Strong revenue growth with a massive market opportunity Attractive unit economics Capex - light, ecommerce model provides significant operating leverage Opportunity to accelerate model with new inventory sourcing relationships 28 Compelling long - term model
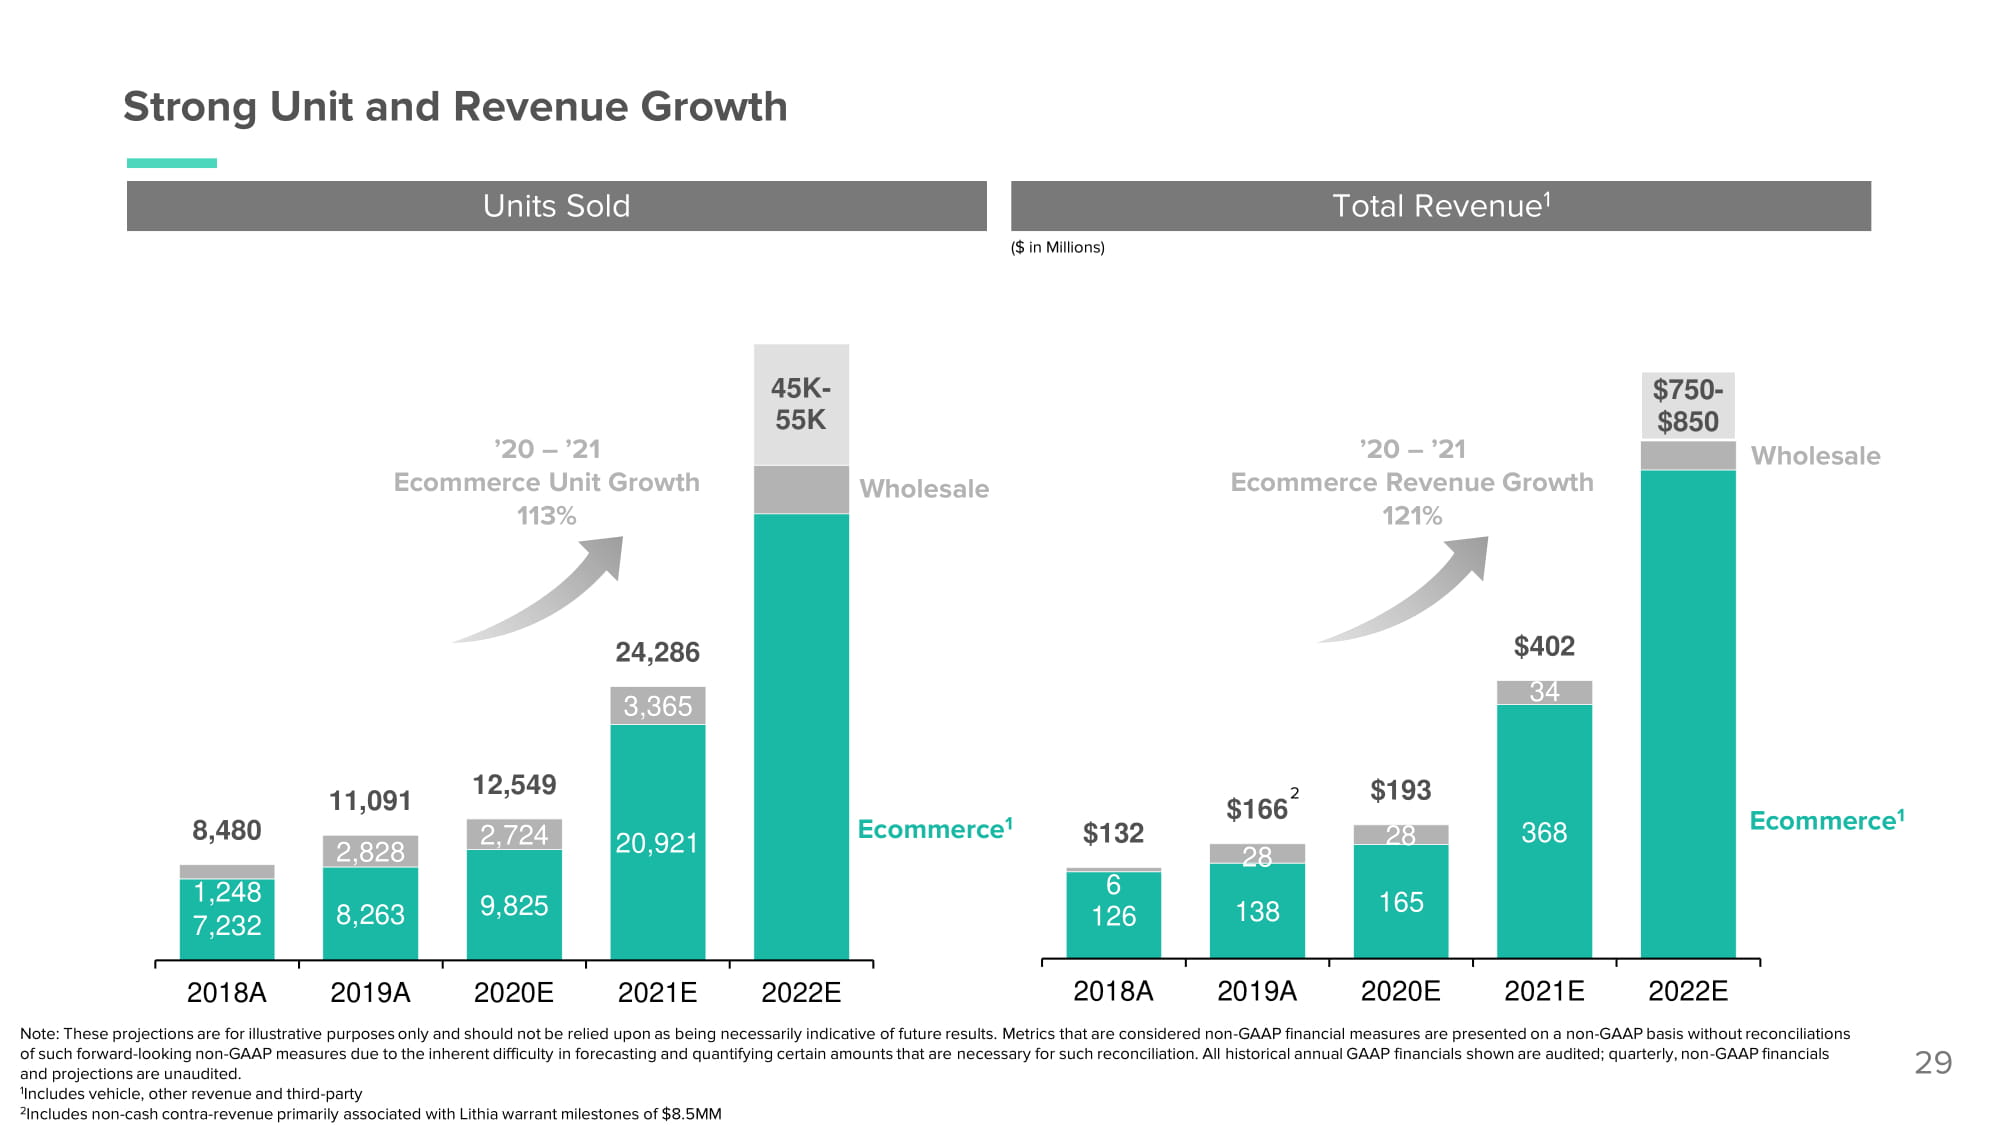
138 165 368 6 126 28 28 34 $132 $193 $402 $750 - $850 8,263 9,825 20,921 1,248 7,232 2,828 2,724 3,365 8,480 11 , 09 1 12,549 24,286 45K - 55K ’20 – ’21 Ecommerce Unit Growth 113% Ecommerce 1 Strong Unit and Revenue Growth 2018A 2019A 2020E 2021E 2022E 2018A 2019A 2020E 2021E 2022E Note: These projections are for illustrative purposes only and should not be relied upon as being necessarily indicative of future results. Metrics that are considered non - GAAP financial measures are presented on a non - GAAP basis without reconciliations of such forward - looking non - GAAP measures due to the inherent difficulty in forecasting and quantifying certain amounts that are necessary for such reconciliation. All historical annual GAAP financials shown are audited; quarterly, non - GAAP financials and projections are unaudited. 1 Includes vehicle, other revenue and third - party 2 Includes non - cash contra - revenue primarily associated with Lithia warrant milestones of $8.5MM Units Sold Total Revenue 1 ($ in Millions) 29 Wholesale ’20 – ’21 Ecommerce Revenue Growth 121% Wholesale Ecommerce 1 2 $166
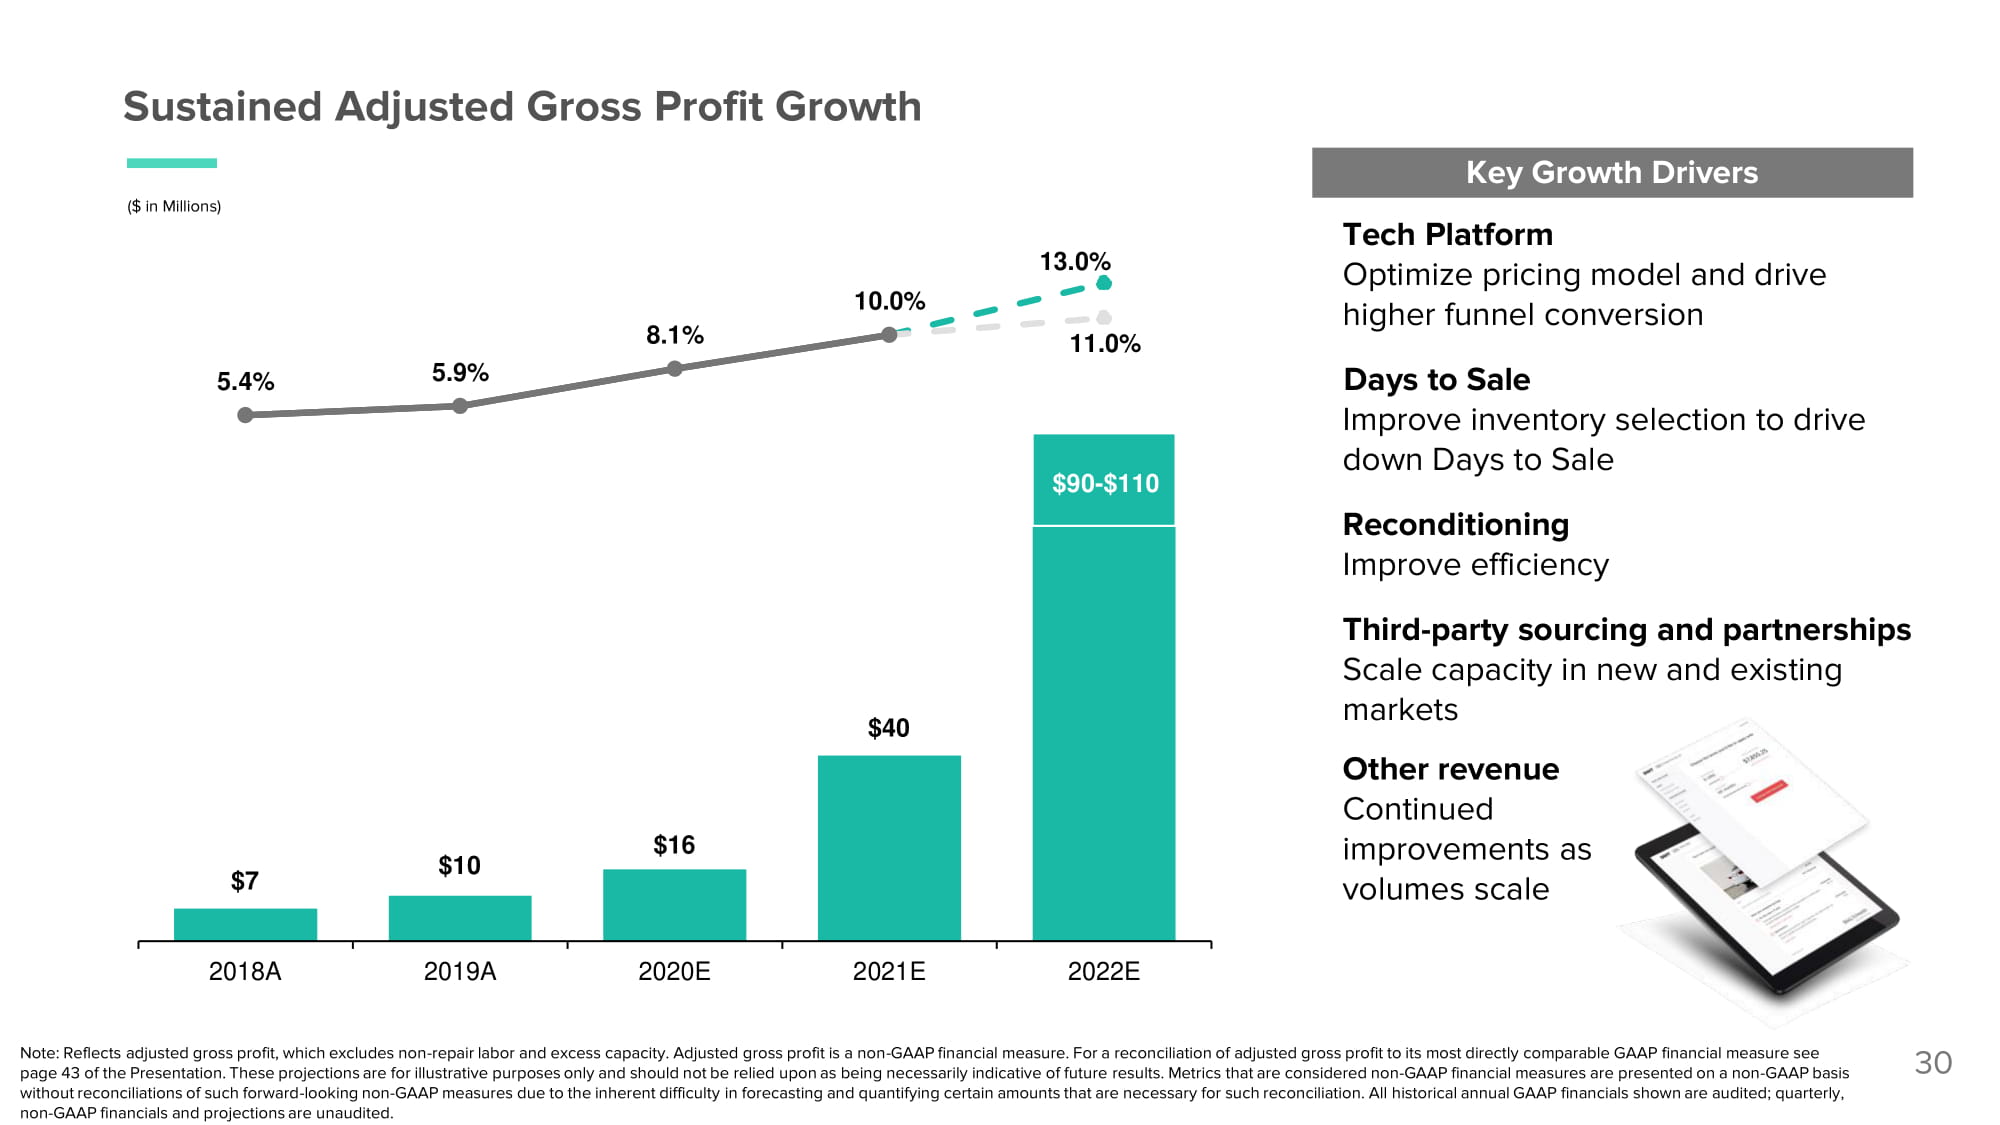
$7 $10 $16 $40 $90 - $110 5.4 % 5.9 % 8.1 % 10.0 % 13.0 % 11.0 % 2 0 18 A 2 0 19 A 2 0 20 E 2 0 21 E 2 0 22 E Sustained Adjusted Gross Profit Growth ($ in Millions) 30 Key Growth Drivers Tech Platform Optimize pricing model and drive higher funnel conversion Days to Sale Improve inventory selection to drive down Days to Sale Reconditioning Improve efficiency Third - party sourcing and partnerships Scale capacity in new and existing markets Other revenue Continued improvements as volumes scale Note: Reflects adjusted gross profit, which excludes non - repair labor and excess capacity. Adjusted gross profit is a non - GAAP financial measure. For a reconciliation of adjusted gross profit to its most directly comparable GAAP financial measure see page 43 of the Presentation. These projections are for illustrative purposes only and should not be relied upon as being necessarily indicative of future results. Metrics that are considered non - GAAP financial measures are presented on a non - GAAP basis without reconciliations of such forward - looking non - GAAP measures due to the inherent difficulty in forecasting and quantifying certain amounts that are necessary for such reconciliation. All historical annual GAAP financials shown are audited; quarterly, non - GAAP financials and projections are unaudited.
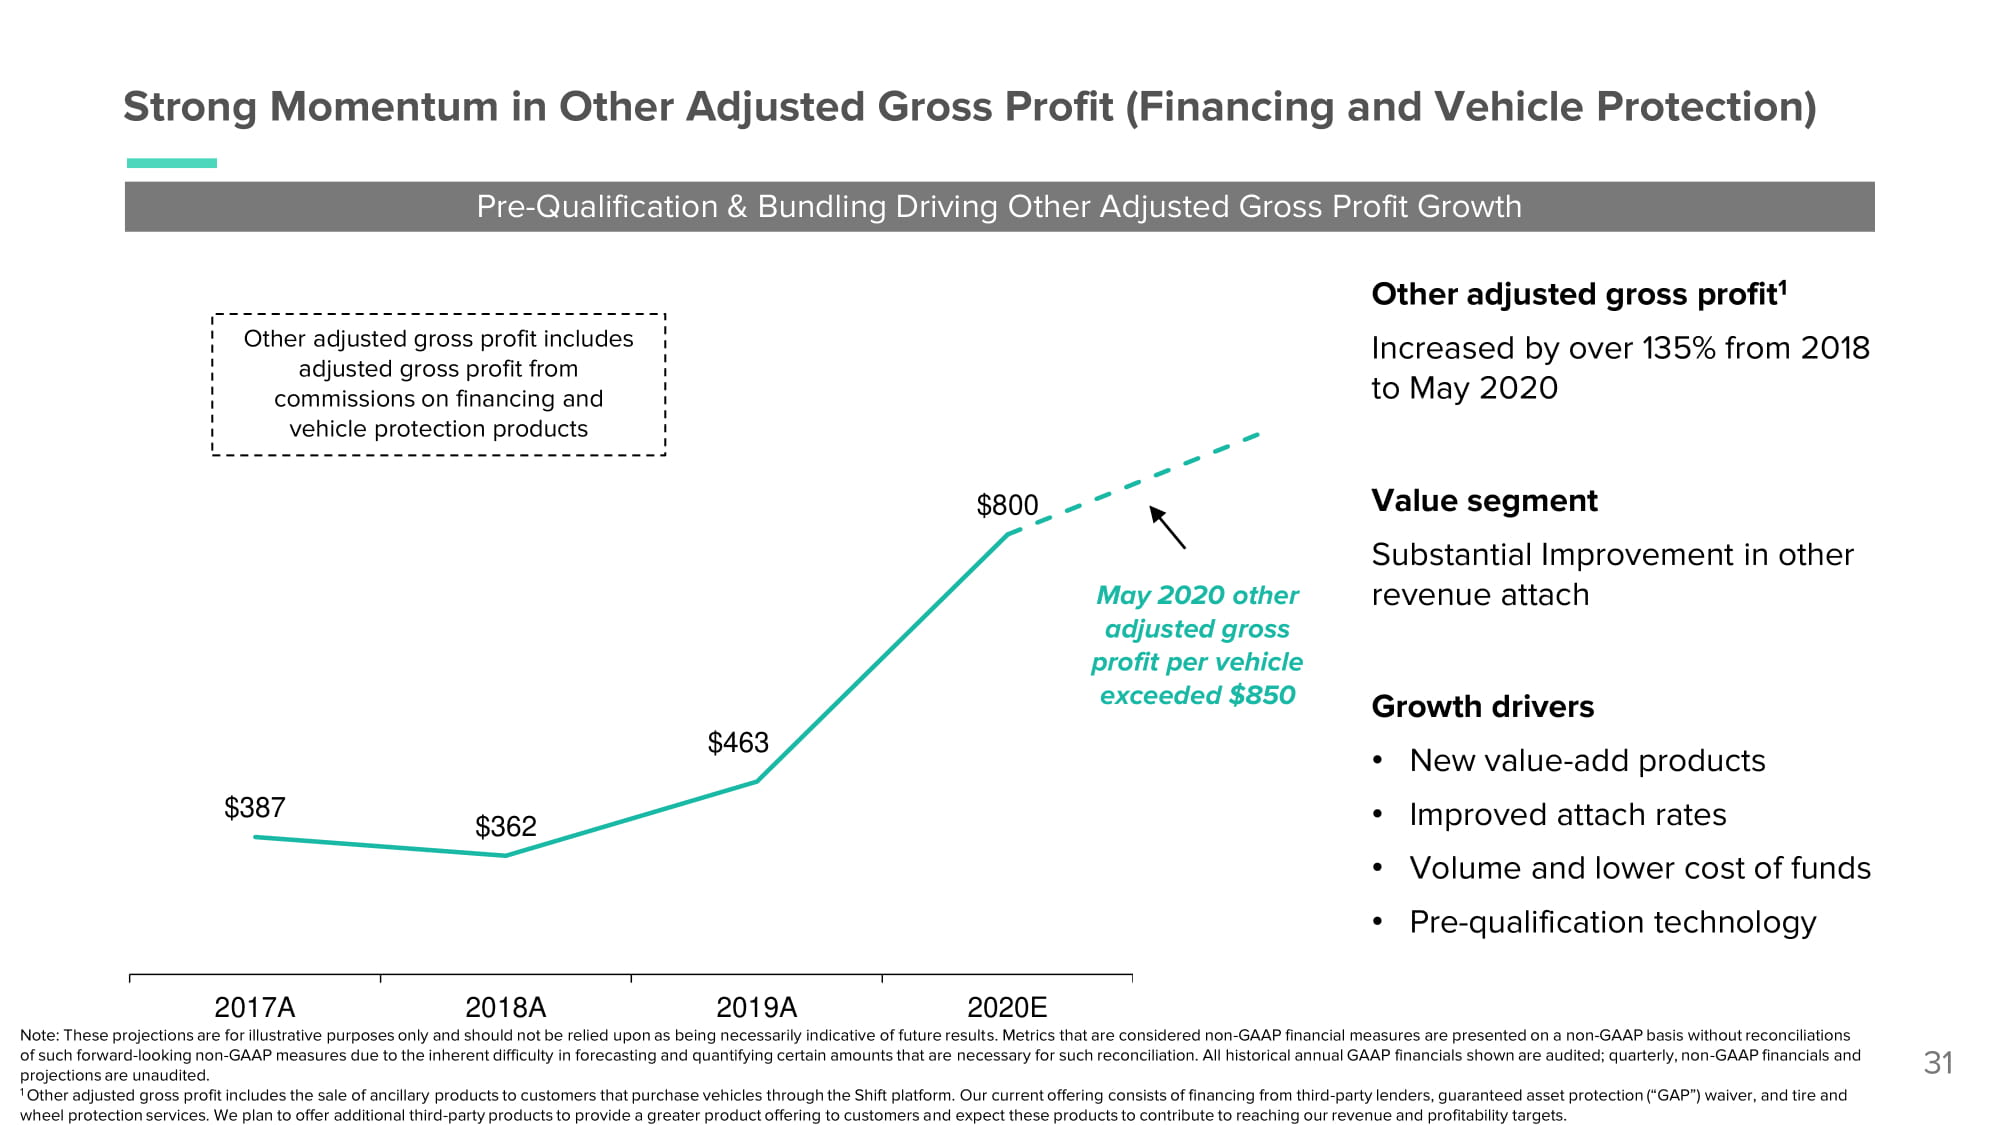
$387 $362 $463 $800 31 Pre - Qualification & Bundling Driving Other Adjusted Gross Profit Growth Other adjusted gross profit 1 Increased by over 135% from 2018 to May 2020 Value segment Substantial Improvement in other revenue attach Growth drivers • New value - add products • Improved attach rates • Volume and lower cost of funds • Pre - qualification technology Strong Momentum in Other Adjusted Gross Profit (Financing and Vehicle Protection) May 2020 other adjusted gross profit per vehicle exceeded $850 2017A 2018A 2019A 2020E Note: These projections are for illustrative purposes only and should not be relied upon as being necessarily indicative of future results. Metrics that are considered non - GAAP financial measures are presented on a non - GAAP basis without reconciliations of such forward - looking non - GAAP measures due to the inherent difficulty in forecasting and quantifying certain amounts that are necessary for such reconciliation. All historical annual GAAP financials shown are audited; quarterly, non - GAAP financials and projections are unaudited. 1 Other adjusted gross profit includes the sale of ancillary products to customers that purchase vehicles through the Shift platform. Our current offering consists of financing from third - party lenders, guaranteed asset protection (“GAP”) waiver, and tire and wheel protection services. We plan to offer additional third - party products to provide a greater product offering to customers and expect these products to contribute to reaching our revenue and profitability targets. Other adjusted gross profit includes adjusted gross profit from commissions on financing and vehicle protection products
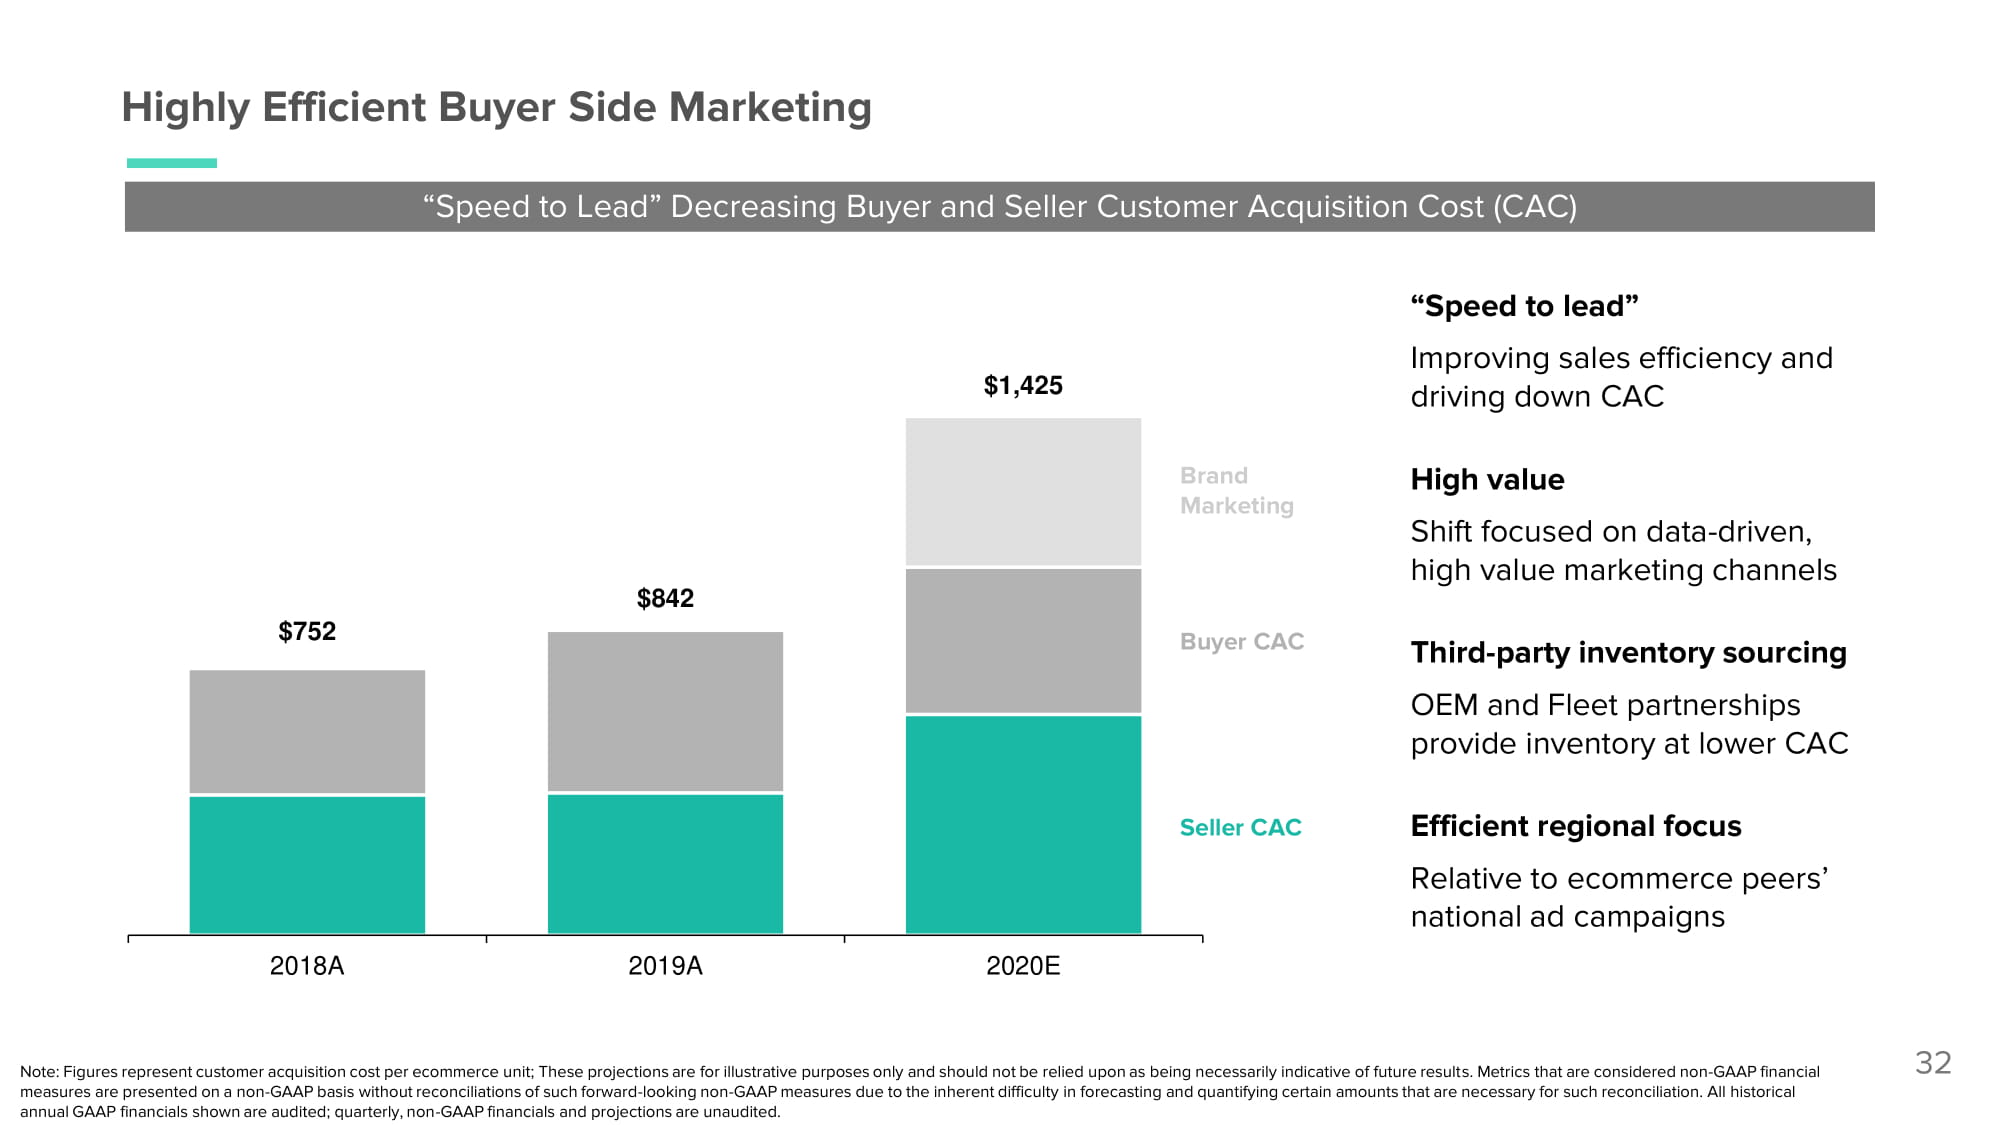
Highly Efficient Buyer Side Marketing “Speed to Lead” Decreasing Buyer and Seller Customer Acquisition Cost (CAC) 32 “Speed to lead” Improving sales efficiency and driving down CAC High value Shift focused on data - driven, high value marketing channels Third - party inventory sourcing OEM and Fleet partnerships provide inventory at lower CAC Efficient regional focus Relative to ecommerce peers’ national ad campaigns $752 $842 $1,425 2 0 18A 2 0 19A 2 0 20E Buyer CAC Seller CAC Brand Mark e t i n g Note: Figures represent customer acquisition cost per ecommerce unit; These projections are for illustrative purposes only and should not be relied upon as being necessarily indicative of future results. Metrics that are considered non - GAAP financial measures are presented on a non - GAAP basis without reconciliations of such forward - looking non - GAAP measures due to the inherent difficulty in forecasting and quantifying certain amounts that are necessary for such reconciliation. All historical annual GAAP financials shown are audited; quarterly, non - GAAP financials and projections are unaudited.
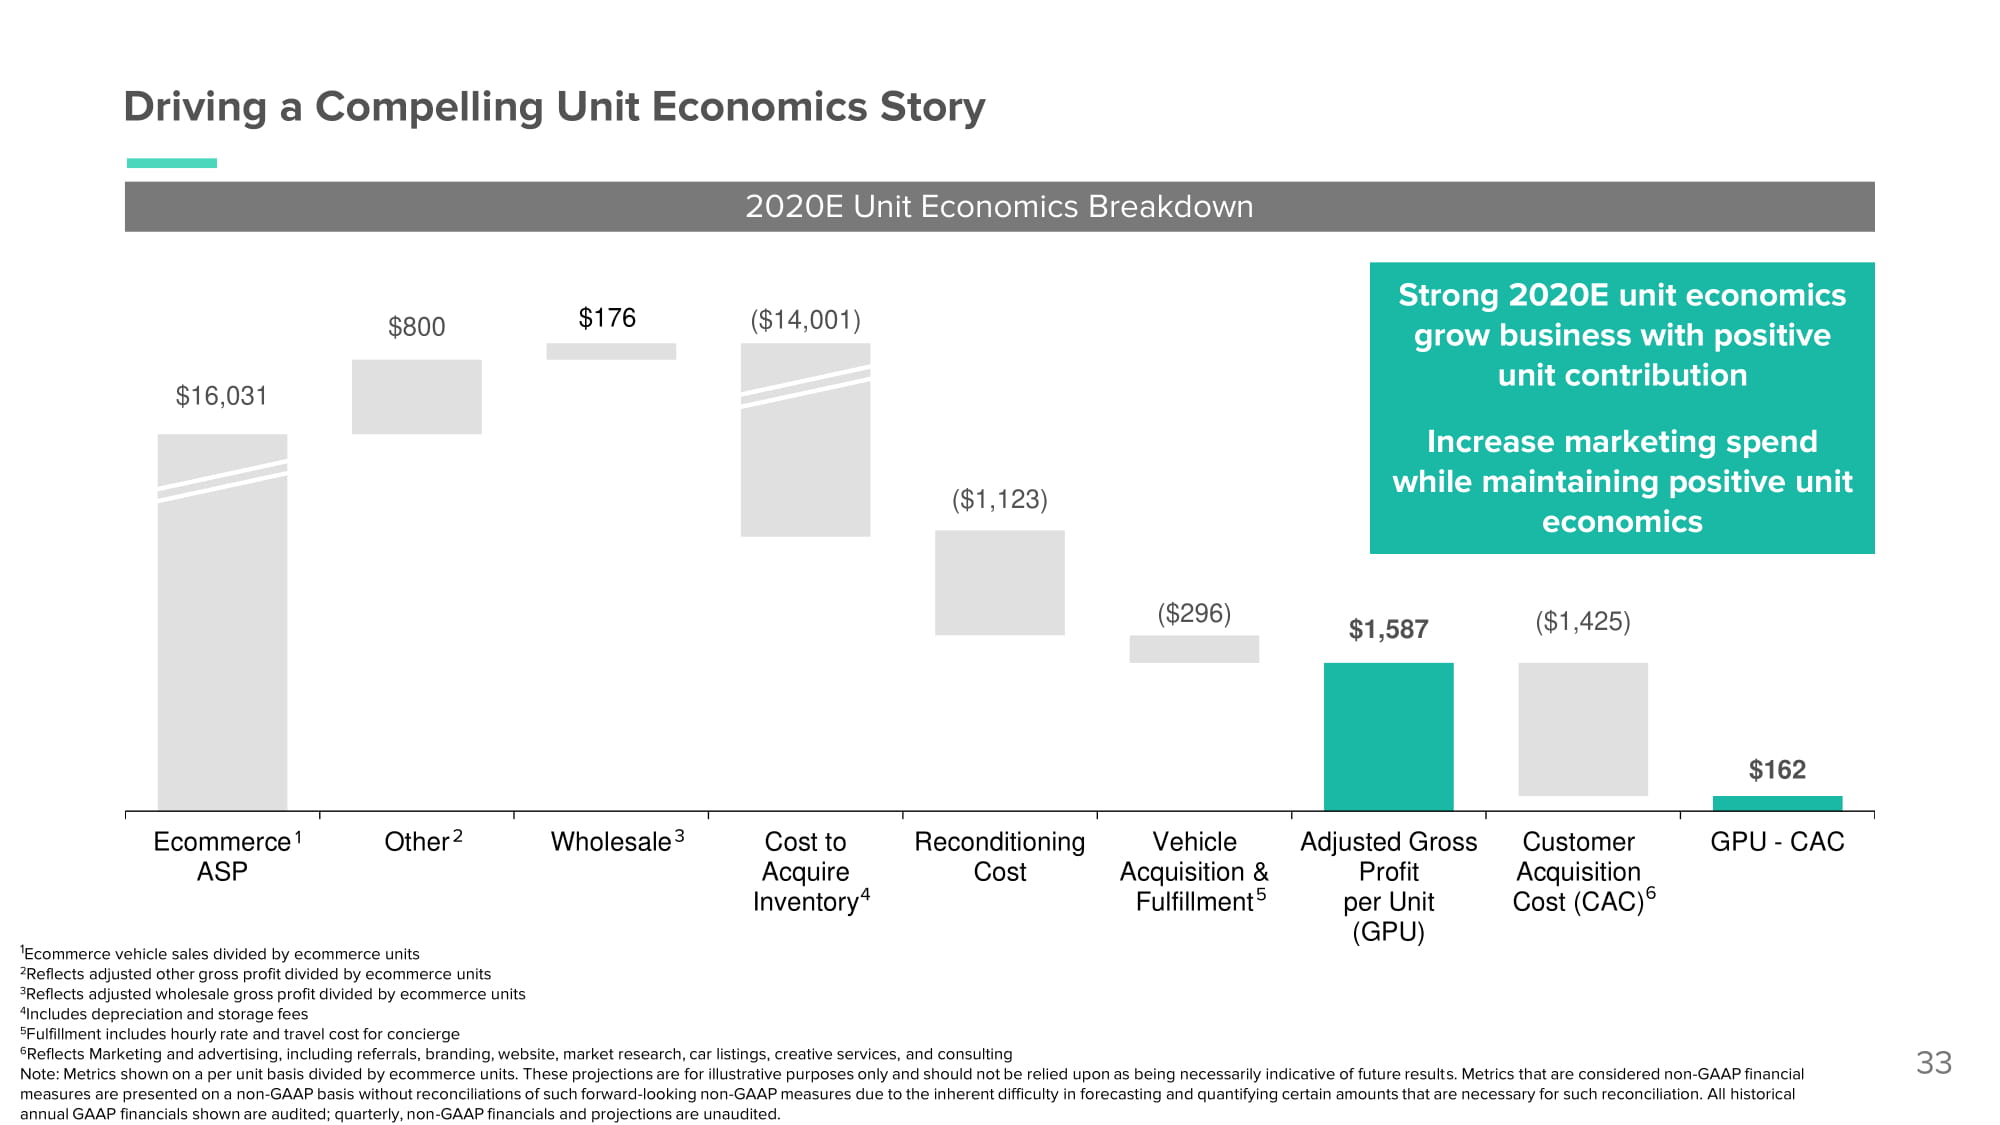
$16,031 $176 $1, 587 $162 $800 ($14,001) ($1,123) ($296) ($1,425) Re c ondi t ioning Cost Adjusted Gross Profit per Unit (GPU) GPU - CAC Driving a Compelling Unit Economics Story 33 2020E Unit Economics Breakdown 1 Ecommerce vehicle sales divided by ecommerce units 2 Reflects adjusted other gross profit divided by ecommerce units 3 Reflects adjusted wholesale gross profit divided by ecommerce units 4 Includes depreciation and storage fees 5 Fulfillment includes hourly rate and travel cost for concierge 6 Reflects Marketing and advertising, including referrals, branding, website, market research, car listings, creative services, and consulting Note: Metrics shown on a per unit basis divided by ecommerce units. These projections are for illustrative purposes only and should not be relied upon as being necessarily indicative of future results. Metrics that are considered non - GAAP financial measures are presented on a non - GAAP basis without reconciliations of such forward - looking non - GAAP measures due to the inherent difficulty in forecasting and quantifying certain amounts that are necessary for such reconciliation. All historical annual GAAP financials shown are audited; quarterly, non - GAAP financials and projections are unaudited. Wholesale 3 Cost to Acquire I nve nt or y 4 Customer Acquisition Cost (CAC) 6 Strong 2020E unit economics grow business with positive unit contribution Increase marketing spend while maintaining positive unit economics Vehicle Acquisition & Fulfillment 5 Ecommerce 1 ASP Other 2
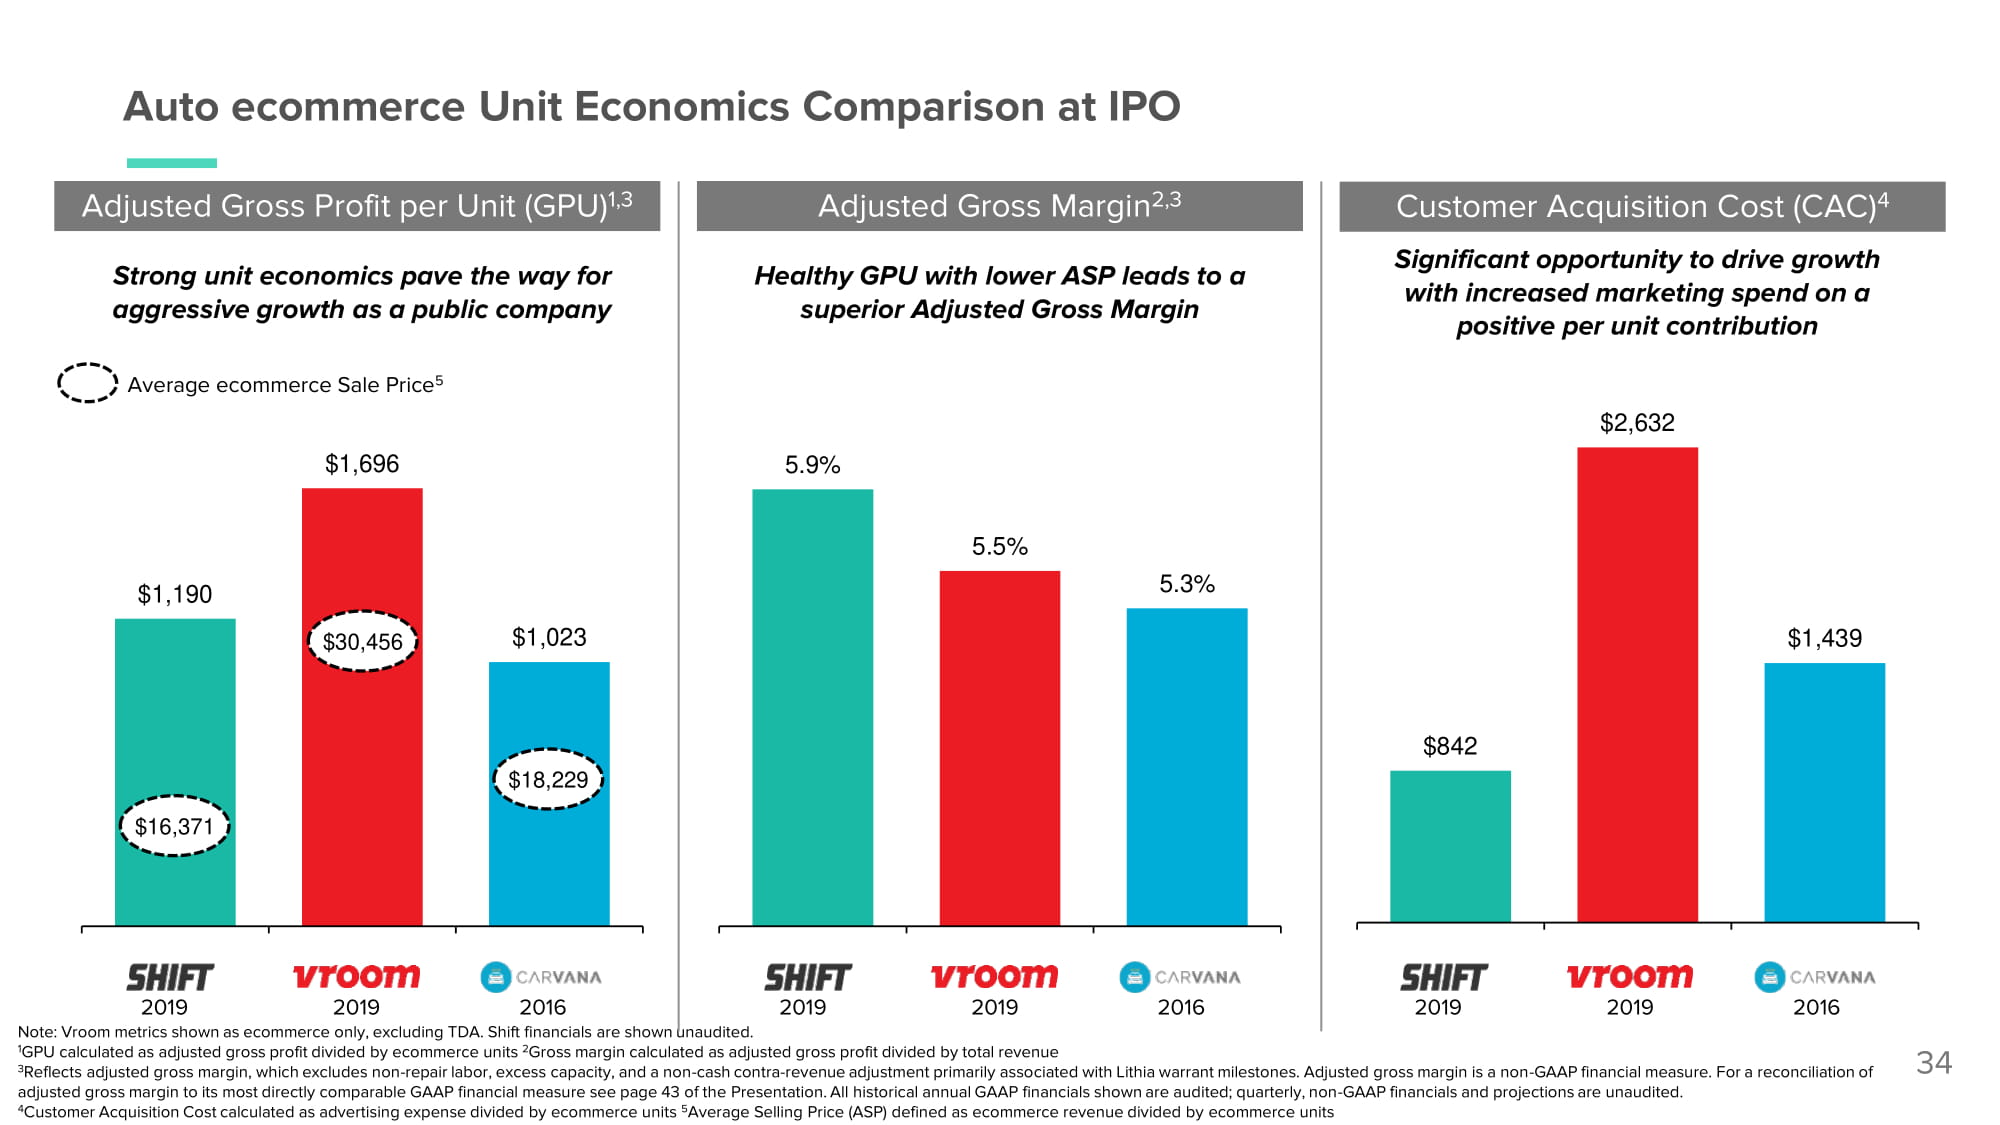
Customer Acquisition Cost (CAC) 4 Adjusted Gross Profit per Unit (GPU) 1,3 Auto ecommerce Unit Economics Comparison at IPO Adjusted Gross Margin 2,3 34 1 GPU calculated as adjusted gross profit divided by ecommerce units 2 Gross margin calculated as adjusted gross profit divided by total revenue 3 Reflects adjusted gross margin, which excludes non - repair labor, excess capacity, and a non - cash contra - revenue adjustment primarily associated with Lithia warrant milestones. Adjusted gross margin is a non - GAAP financial measure. For a reconciliation of adjusted gross margin to its most directly comparable GAAP financial measure see page 43 of the Presentation. All historical annual GAAP financials shown are audited; quarterly, non - GAAP financials and projections are unaudited. 4 Customer Acquisition Cost calculated as advertising expense divided by ecommerce units 5 Average Selling Price (ASP) defined as ecommerce revenue divided by ecommerce units 2 01 9 2 01 9 2 01 6 2 01 9 2 01 9 2 01 6 2 01 9 2 01 9 2 01 6 Note: Vroom metrics shown as ecommerce only, excluding TDA. Shift financials are shown unaudited. $1,190 $1,696 $1,023 $842 $2,632 $1 , 43 9 5.9 % 5.5 % 5 . 3 % Healthy GPU with lower ASP leads to a superior Adjusted Gross Margin Significant opportunity to drive growth with increased marketing spend on a positive per unit contribution Strong unit economics pave the way for aggressive growth as a public company Average ecommerce Sale Price 5 $16,371 $18,229 $30,456
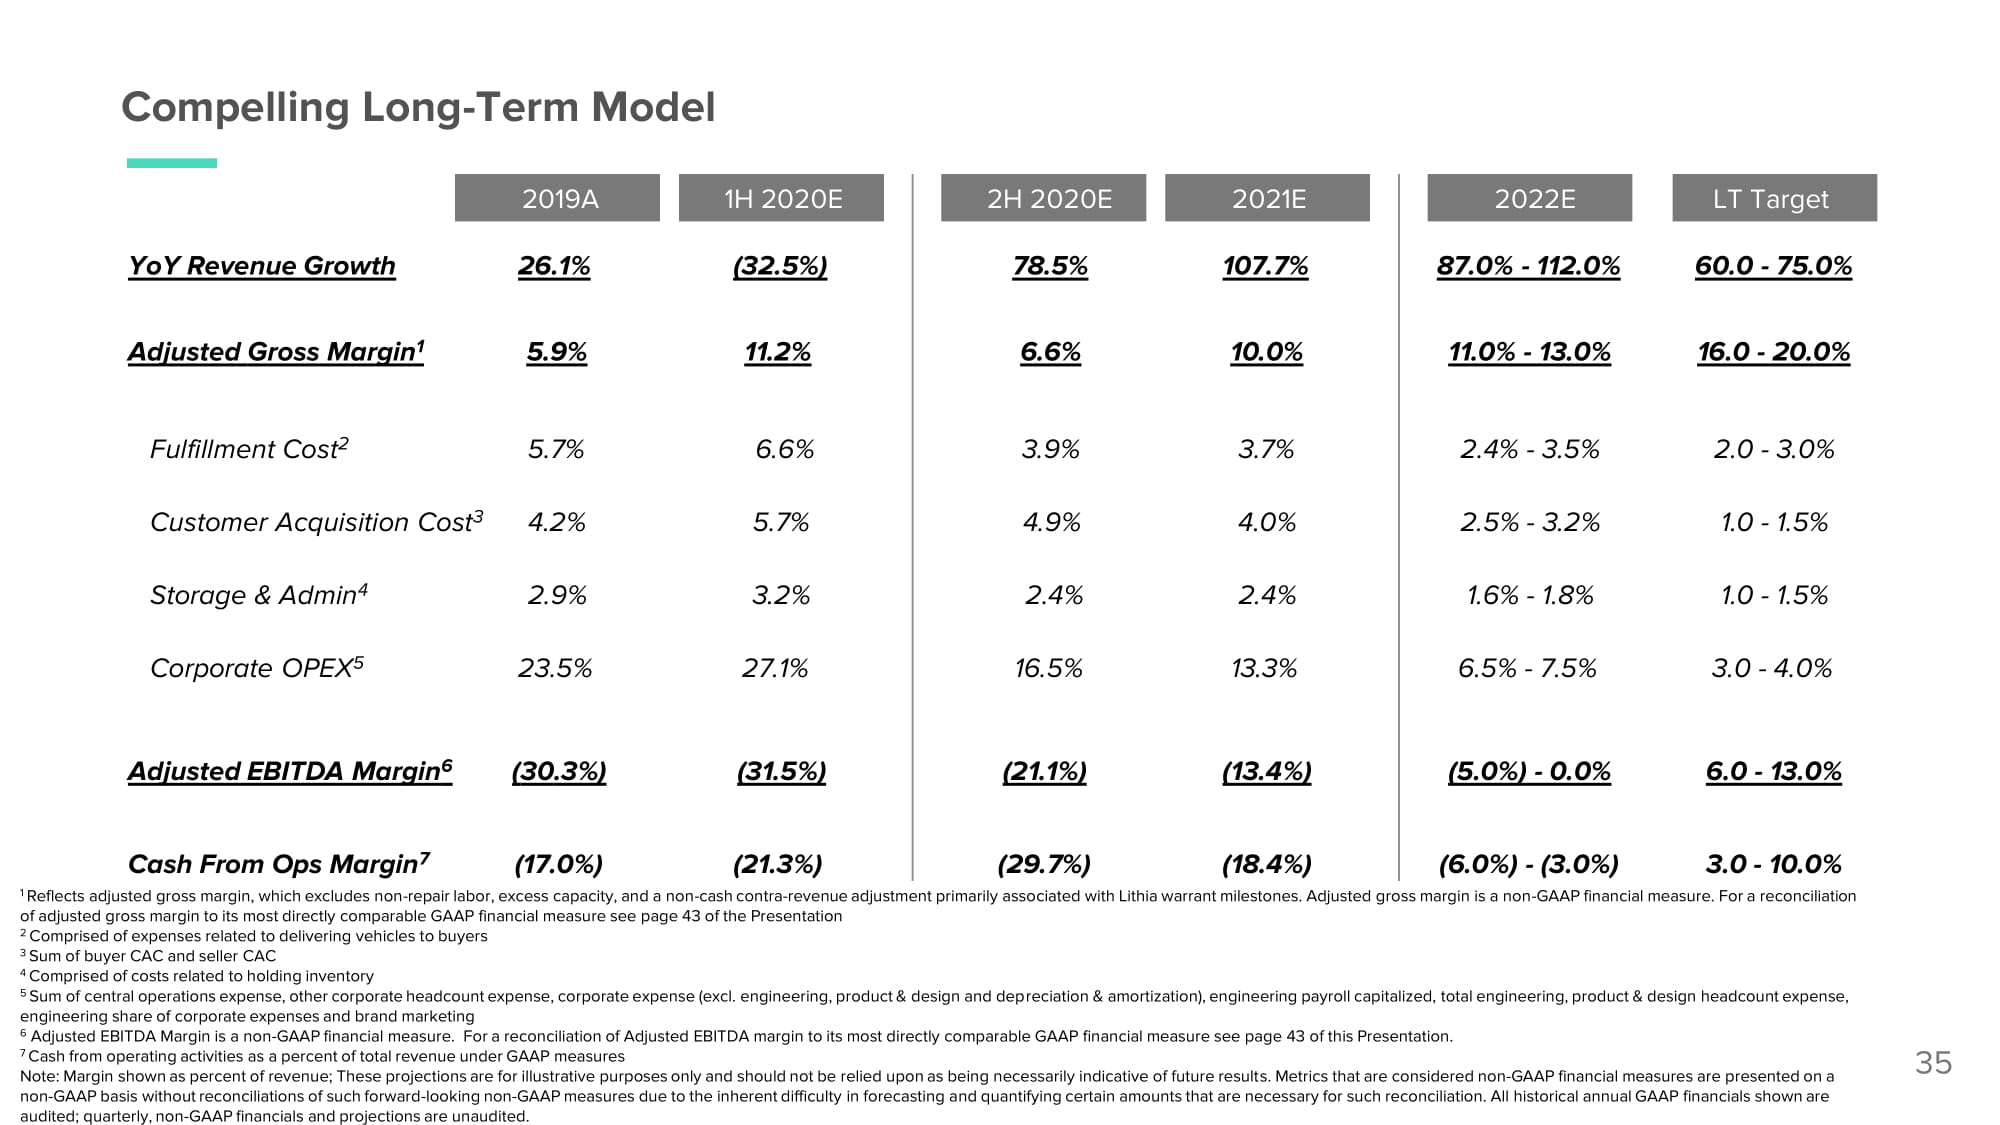
Compelling Long - Term Model 35 1 Reflects adjusted gross margin, which excludes non - repair labor, excess capacity, and a non - cash contra - revenue adjustment primarily associated with Lithia warrant milestones. Adjusted gross margin is a non - GAAP financial measure. For a reconciliation of adjusted gross margin to its most directly comparable GAAP financial measure see page 43 of the Presentation 2 Comprised of expenses related to delivering vehicles to buyers 3 Sum of buyer CAC and seller CAC 4 Comprised of costs related to holding inventory 5 Sum of central operations expense, other corporate headcount expense, corporate expense (excl. engineering, product & design and depreciation & amortization), engineering payroll capitalized, total engineering, product & design headcount expense, engineering share of corporate expenses and brand marketing 6 Adjusted EBITDA Margin is a non - GAAP financial measure. For a reconciliation of Adjusted EBITDA margin to its most directly comparable GAAP financial measure see page 43 of this Presentation. 7 Cash from operating activities as a percent of total revenue under GAAP measures Note: Margin shown as percent of revenue; These projections are for illustrative purposes only and should not be relied upon as being necessarily indicative of future results. Metrics that are considered non - GAAP financial measures are presented on a non - GAAP basis without reconciliations of such forward - looking non - GAAP measures due to the inherent difficulty in forecasting and quantifying certain amounts that are necessary for such reconciliation. All historical annual GAAP financials shown are audited; quarterly, non - GAAP financials and projections are unaudited. 2019A 1H 2020E 2H 2020E 2021E 2022E LT Target YoY Revenue Growth 26.1% (32.5%) 78.5% 107.7% 87.0% - 112.0% 60.0 - 75.0% Adjusted Gross Margin 1 5.9% 11.2% 6.6% 10.0% 11.0% - 13.0% 16.0 - 20.0% Fulfillment Cost 2 5.7% 6.6% 3.9% 3.7% 2.4% - 3.5% 2.0 - 3.0% Customer Acquisition Cost 3 4.2% 5.7% 4.9% 4.0% 2.5% - 3.2% 1.0 - 1.5% Storage & Admin 4 2.9% 3.2% 2.4% 2.4% 1.6% - 1.8% 1.0 - 1.5% Corporate OPEX 5 23.5% 27.1% 16.5% 13.3% 6.5% - 7.5% 3.0 - 4.0% Adjusted EBITDA Margin 6 (30.3%) (31.5%) (21.1%) (13.4%) (5.0%) - 0.0% 6.0 - 13.0% Cash From Ops Margin 7 (17.0%) (21.3%) (29.7%) (18.4%) (6.0%) - (3.0%) 3.0 - 10.0%
A Leading Online Used Car Platform 36 Massive fragmented market with accelerating ecommerce penetration $ 84 1 BN Domestic Used Automotive TAM Experienced team leading technology and consumer experience 70 Net Promoter Score 1 Expansive customer base and partner network 290K+ Peak Monthly Unique Visitors in 2020 2 Differentiated at - home test drives and Value segment 85%+ Vehicles Sourced from Consumers Broadest spectrum of used car inventory $16,031 2020E ecommerce ASP 3 Strong unit economics primed for growth 8.1% 2020E Adjusted Gross Margin 4 Source: Wall Street research, Management 1 Net promoter score is the average of Shift buyers, sellers, and test drivers, 2 YTD 2020 monthly unique visitors averaged ~242K 3 ecommerce Vehicle revenue divided by ecommerce Units 4 Reflects adjusted gross margin, which excludes non - repair labor, excess capacity, and a non - cash contra - revenue adjustment primarily associated with Lithia warrant milestones. Adjusted gross margin is a non - GAAP financial measure. For a reconciliation of adjusted gross margin to its most directly comparable GAAP financial measure see page 43 of the Presentation Note: These projections are for illustrative purposes only and should not be relied upon as being necessarily indicative of future results. Metrics that are considered non - GAAP financial measures are presented on a non - GAAP basis without reconciliations of such forward - looking non - GAAP measures due to the inherent difficulty in forecasting and quantifying certain amounts that are necessary for such reconciliation. Shift defines Value segment cars as those with > 80,000 miles or > 8 years old. All historical annual GAAP financials shown are audited; quarterly, non - GAAP financials and projections are unaudited.

App en d ix
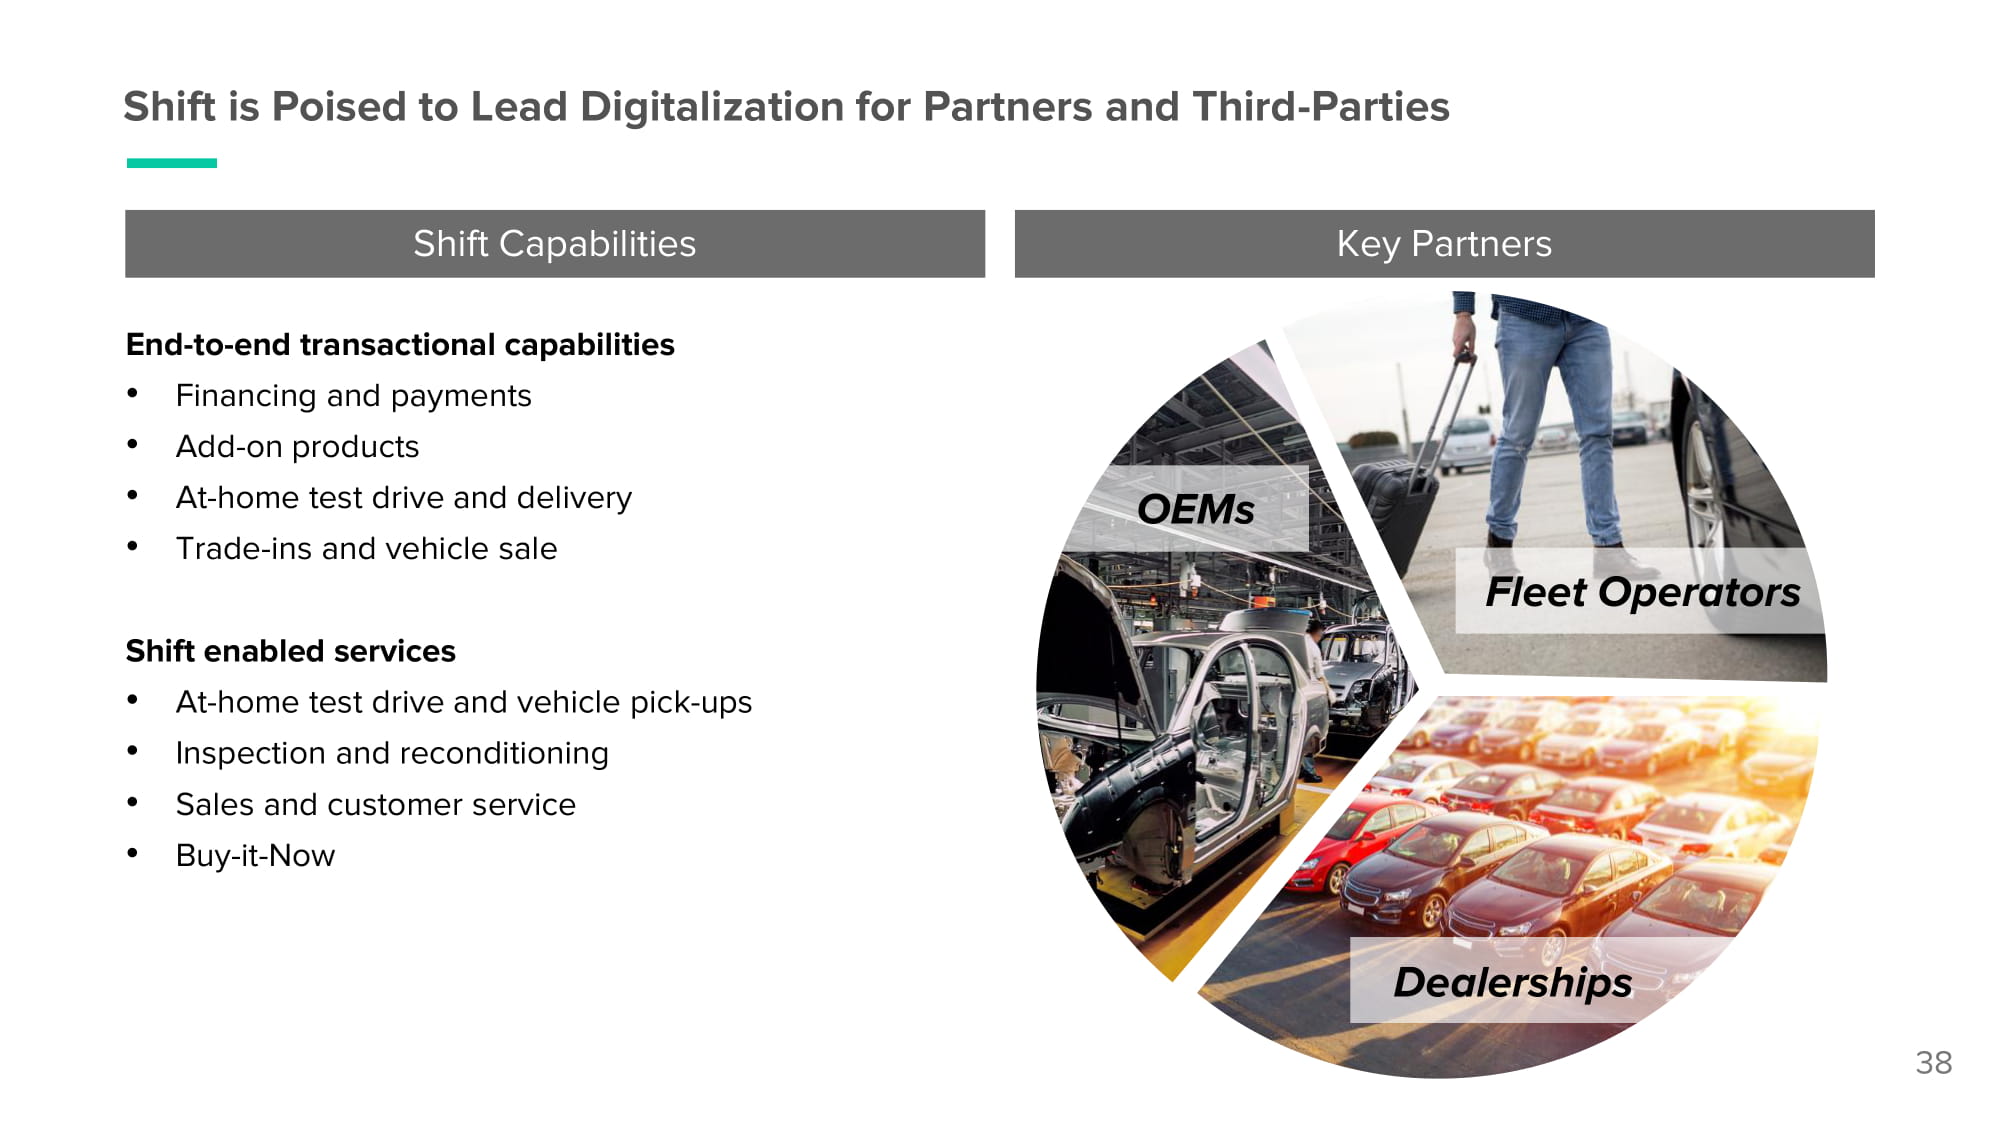
Shift is Poised to Lead Digitalization for Partners and Third - Parties Shift Capabilities End - to - end transactional capabilities • Financing and payments • Add - on products • At - home test drive and delivery • Trade - ins and vehicle sale Shift enabled services • At - home test drive and vehicle pick - ups • Inspection and reconditioning • Sales and customer service • Buy - it - Now Key Partners O E Ms Fleet Operators Dealerships 38
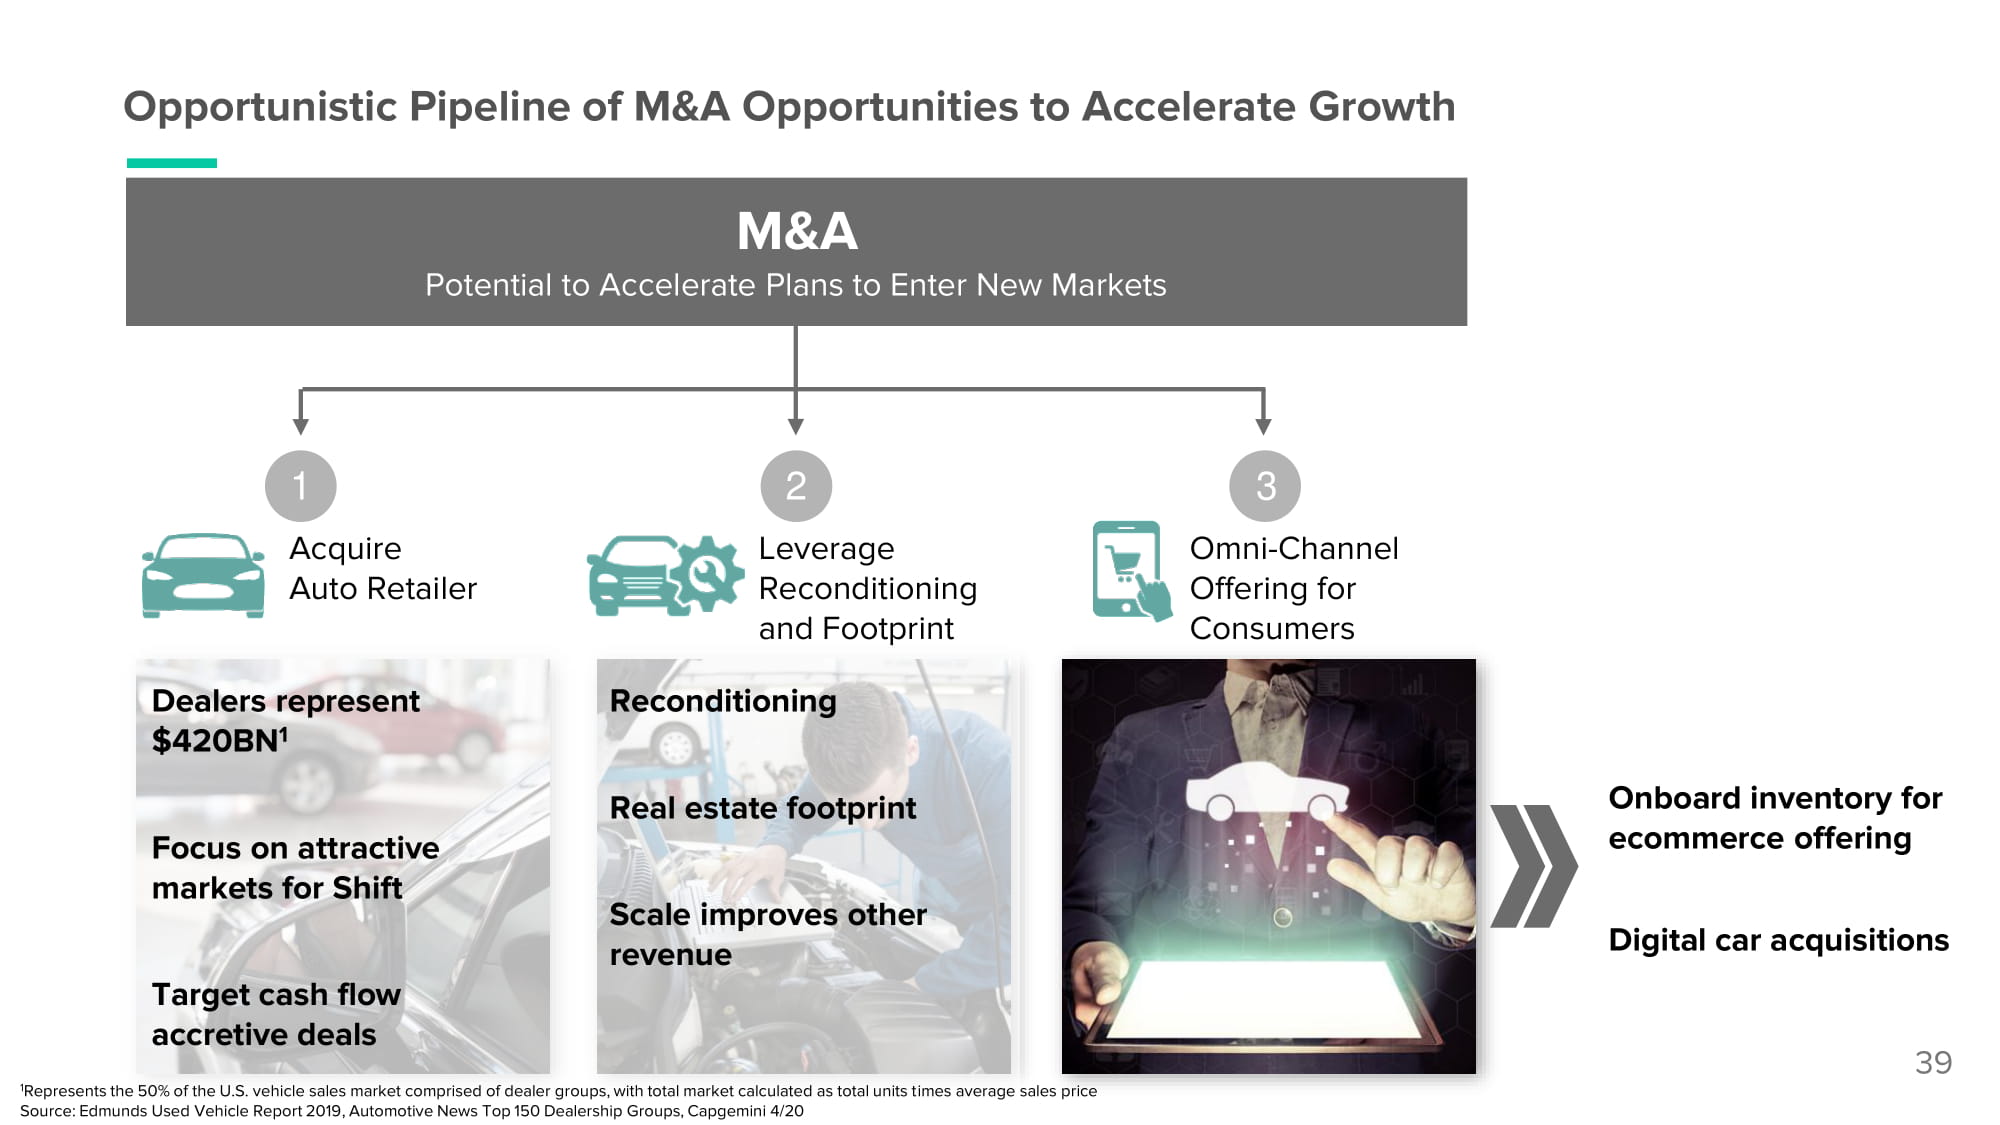
39 Opportunistic Pipeline of M&A Opportunities to Accelerate Growth M&A Potential to Accelerate Plans to Enter New Markets 1 Acquire Auto Retailer 2 Leverage Rec o n d i t i o n i ng and Footprint 3 O mn i - C hann e l Offering for Consumers Dealers represent $420BN 1 Focus on attractive markets for Shift Target cash flow accretive deals Reconditioning Real estate footprint Scale improves other revenue Onboard inventory for ecommerce offering Digital car acquisitions 1 Represents the 50% of the U.S. vehicle sales market comprised of dealer groups, with total market calculated as total units times average sales price Source: Edmunds Used Vehicle Report 2019, Automotive News Top 150 Dealership Groups, Capgemini 4/20
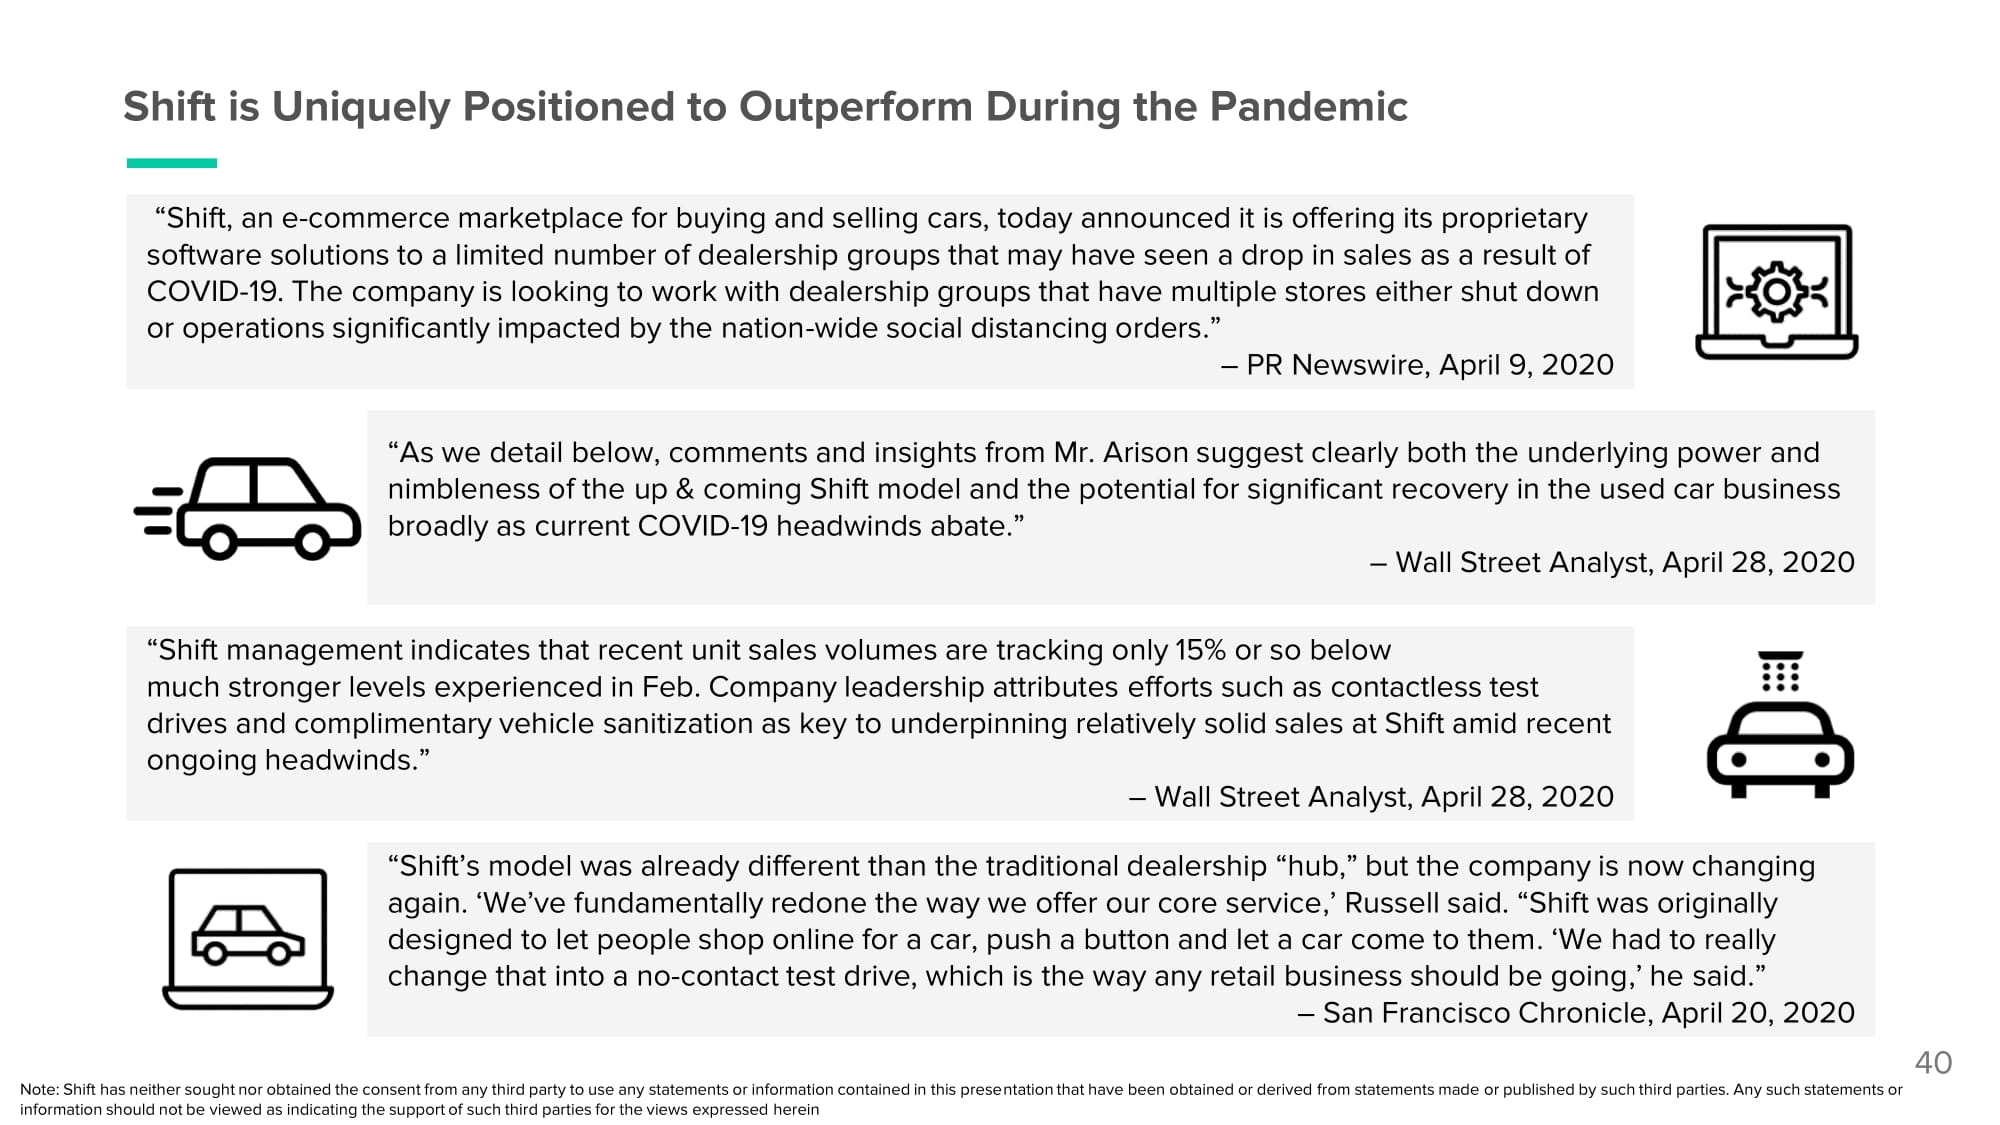
Shift is Uniquely Positioned to Outperform During the Pandemic “Shift, an e - commerce marketplace for buying and selling cars, today announced it is offering its proprietary software solutions to a limited number of dealership groups that may have seen a drop in sales as a result of COVID - 19. The company is looking to work with dealership groups that have multiple stores either shut down or operations significantly impacted by the nation - wide social distancing orders.” – PR Newswire, April 9, 2020 “As we detail below, comments and insights from Mr. Arison suggest clearly both the underlying power and nimbleness of the up & coming Shift model and the potential for significant recovery in the used car business broadly as current COVID - 19 headwinds abate.” – Wall Street Analyst, April 28, 2020 “Shift management indicates that recent unit sales volumes are tracking only 15% or so below much stronger levels experienced in Feb. Company leadership attributes efforts such as contactless test drives and complimentary vehicle sanitization as key to underpinning relatively solid sales at Shift amid recent ongoing headwinds.” – Wall Street Analyst, April 28, 2020 “Shift’s model was already different than the traditional dealership “hub,” but the company is now changing again. ‘We’ve fundamentally redone the way we offer our core service,’ Russell said. “Shift was originally designed to let people shop online for a car, push a button and let a car come to them. ‘We had to really change that into a no - contact test drive, which is the way any retail business should be going,’ he said.” – San Francisco Chronicle, April 20, 2020 40 Note: Shift has neither sought nor obtained the consent from any third party to use any statements or information contained in this presentation that have been obtained or derived from statements made or published by such third parties. Any such statements or information should not be viewed as indicating the support of such third parties for the views expressed herein

Shift Select Investors 41
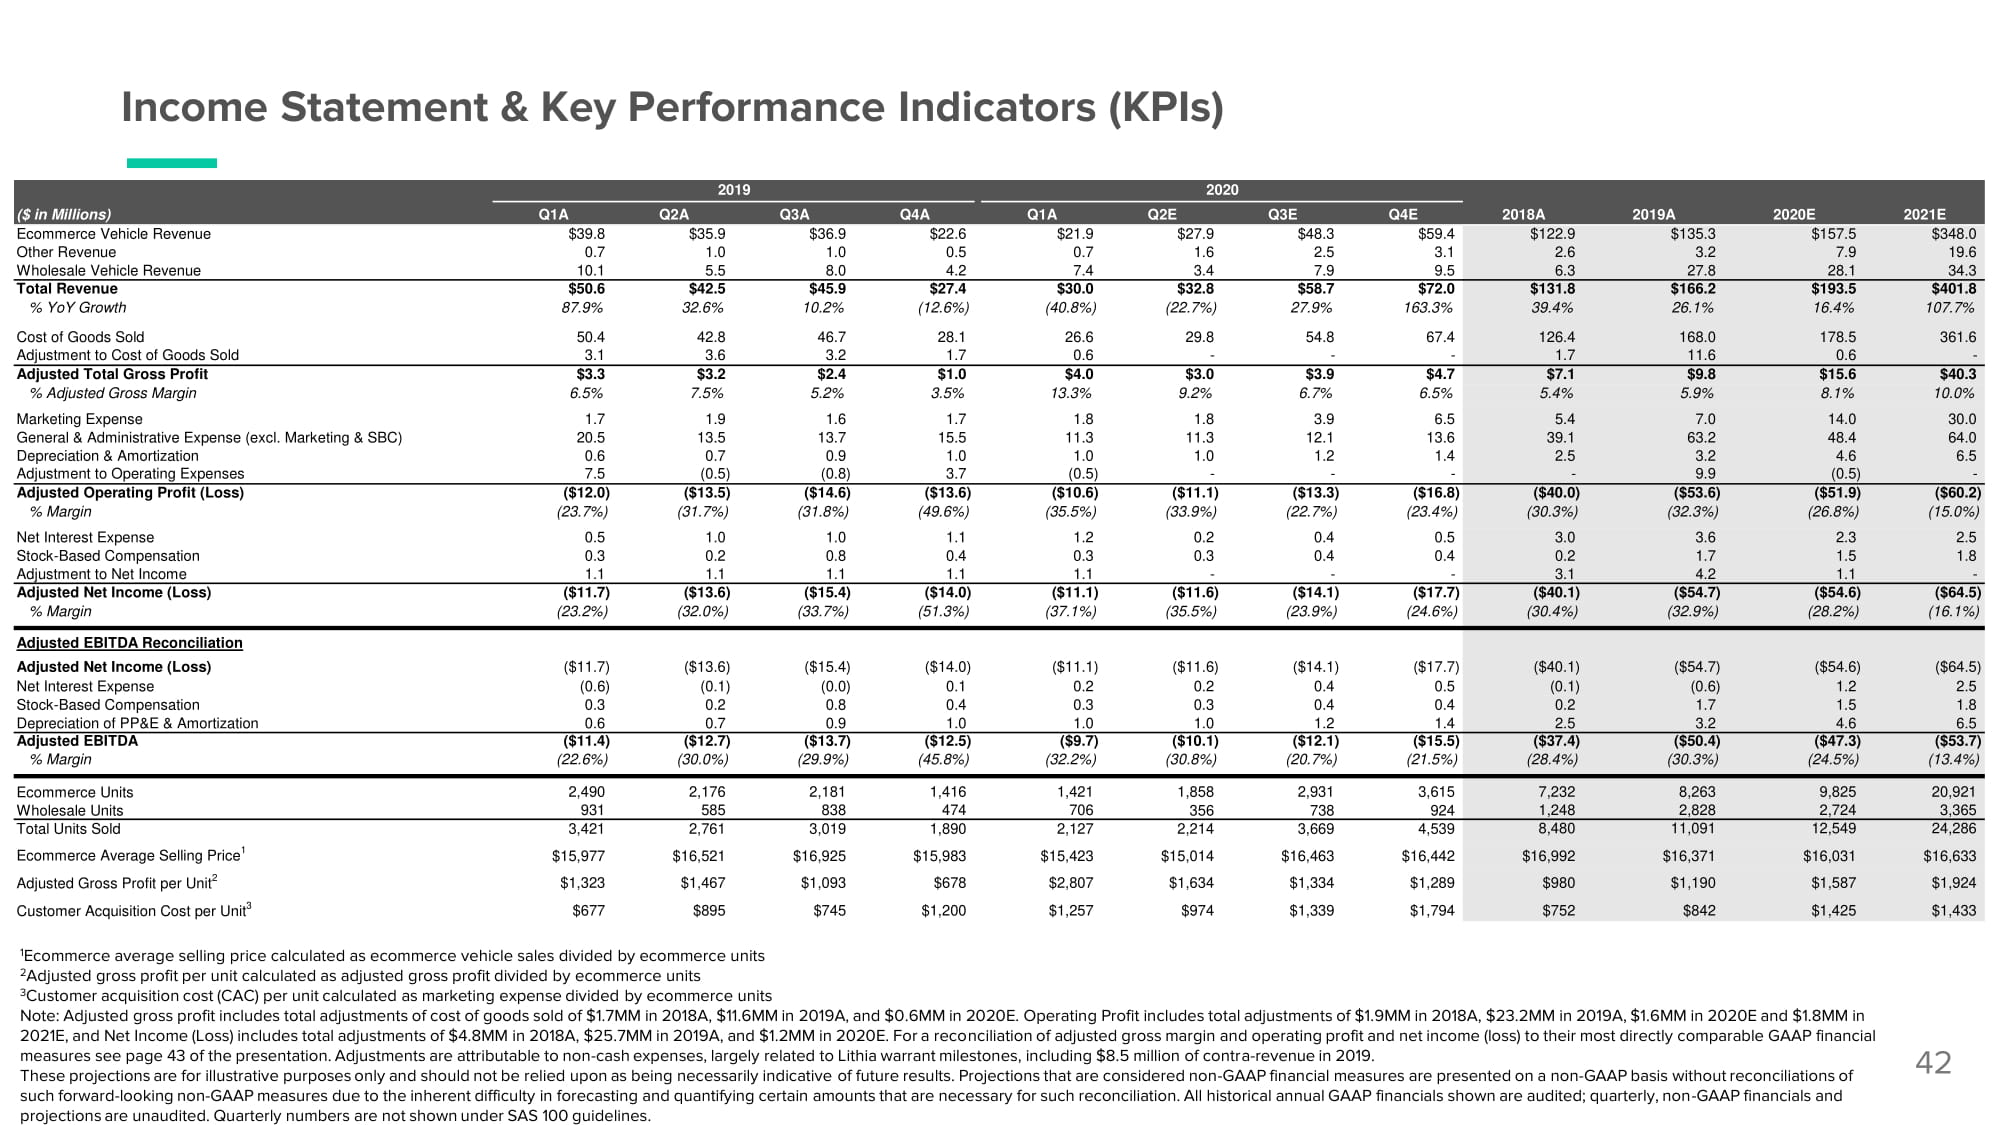
Income Statement & Key Performance Indicators (KPIs) 42 ($ in Millions) Q1A 2019 Q2A Q3A Q4A Q1A 2020 Q2E Q3E Q4E 2018A 2019A 2020E 2021E Ecommerce Vehicle Revenue $39.8 $35.9 $36.9 $22.6 $21.9 $27.9 $48.3 $59.4 $122.9 $135.3 $157.5 $348.0 Other Revenue 0.7 1.0 1.0 0.5 0.7 1.6 2.5 3.1 2.6 3.2 7.9 19.6 Wholesale Vehicle Revenue 10.1 5.5 8.0 4.2 7.4 3.4 7.9 9.5 6.3 27.8 28.1 34.3 Total Revenue $50.6 $42.5 $45.9 $27.4 $30.0 $32.8 $58.7 $72.0 $131.8 $166.2 $193.5 $401.8 % YoY Growth 87.9% 32.6% 10.2% (1 2 .6%) (4 0 .8%) (2 2 .7%) 27.9% 163.3% 39.4% 26.1% 16.4% 107.7% Cost of Goods Sold 50.4 42.8 46.7 28.1 26.6 29.8 54.8 67.4 126.4 168.0 178.5 361.6 Adjustment to Cost of Goods Sold 3.1 3.6 3.2 1.7 0.6 - - - 1.7 11.6 0.6 - Adjusted Total Gross Profit $3.3 $3.2 $2.4 $1.0 $4.0 $3.0 $3.9 $4.7 $7.1 $9.8 $15.6 $40.3 % Adjusted Gross Margin 6.5% 7.5% 5.2% 3.5% 13.3% 9.2% 6.7% 6.5% 5.4% 5.9% 8.1% 10.0% Marketing Expense 1.7 1.9 1.6 1.7 1.8 1.8 3.9 6.5 5.4 7.0 14.0 30.0 General & Administrative Expense (excl. Marketing & SBC) 20.5 13.5 13.7 15.5 11.3 11.3 12.1 13.6 39.1 63.2 48.4 64.0 Depreciation & Amortization 0.6 0.7 0.9 1.0 1.0 1.0 1.2 1.4 2.5 3.2 4.6 6.5 Adjustment to Operating Expenses 7.5 (0. 5 ) (0. 8 ) 3.7 (0. 5 ) - - - - 9.9 (0. 5 ) - Adjusted Operating Profit (Loss) ($ 1 2. 0 ) ($ 1 3. 5 ) ($ 1 4. 6 ) ($ 1 3. 6 ) ($ 1 0. 6 ) ($ 1 1. 1 ) ($ 1 3. 3 ) ($ 1 6. 8 ) ($ 4 0. 0 ) ($ 5 3. 6 ) ($ 5 1. 9 ) ($ 6 0. 2 ) % Margin (2 3 .7%) (3 1 .7%) (3 1 .8%) (4 9 .6%) (3 5 .5%) (3 3 .9%) (2 2 .7%) (2 3 .4%) (3 0 .3%) (3 2 .3%) (2 6 .8%) (1 5 .0%) Net Interest Expense 0.5 1.0 1.0 1.1 1.2 0.2 0.4 0.5 3.0 3.6 2.3 2.5 Stock - Based Compensation 0.3 0.2 0.8 0.4 0.3 0.3 0.4 0.4 0.2 1.7 1.5 1.8 Adjustment to Net Income 1.1 1.1 1.1 1.1 1.1 - - - 3.1 4.2 1.1 - Adjusted Net Income (Loss) ($ 1 1. 7 ) ($ 1 3. 6 ) ($ 1 5. 4 ) ($ 1 4. 0 ) ($ 1 1. 1 ) ($ 1 1. 6 ) ($ 1 4. 1 ) ($ 1 7. 7 ) ($ 4 0. 1 ) ($ 5 4. 7 ) ($ 5 4. 6 ) ($ 6 4. 5 ) % Margin (2 3 .2%) (3 2 .0%) (3 3 .7%) (5 1 .3%) (3 7 .1%) (3 5 .5%) (2 3 .9%) (2 4 .6%) (3 0 .4%) (3 2 .9%) (2 8 .2%) (1 6 .1%) Adjusted EBITDA Reconciliation Adjusted Net Income (Loss) ($ 1 1. 7 ) ($ 1 3. 6 ) ($ 1 5. 4 ) ($ 1 4. 0 ) ($ 1 1. 1 ) ($ 1 1. 6 ) ($ 1 4. 1 ) ($ 1 7. 7 ) ($ 4 0. 1 ) ($ 5 4. 7 ) ($ 5 4. 6 ) ($ 6 4. 5 ) Net Interest Expense (0. 6 ) (0. 1 ) (0. 0 ) 0.1 0.2 0.2 0.4 0.5 (0. 1 ) (0. 6 ) 1.2 2.5 Stock - Based Compensation 0.3 0.2 0.8 0.4 0.3 0.3 0.4 0.4 0.2 1.7 1.5 1.8 Depreciation of PP&E & Amortization 0.6 0.7 0.9 1.0 1.0 1.0 1.2 1.4 2.5 3.2 4.6 6.5 Adjusted EBITDA ($ 1 1. 4 ) ($ 1 2. 7 ) ($ 1 3. 7 ) ($ 1 2. 5 ) ($ 9 .7) ($ 1 0. 1 ) ($ 1 2. 1 ) ($ 1 5. 5 ) ($ 3 7. 4 ) ($ 5 0. 4 ) ($ 4 7. 3 ) ($ 5 3. 7 ) % Margin (2 2 .6%) (3 0 .0%) (2 9 .9%) (4 5 .8%) (3 2 .2%) (3 0 .8%) (2 0 .7%) (2 1 .5%) (2 8 .4%) (3 0 .3%) (2 4 .5%) (1 3 .4%) Ecommerce Units 2,490 2,176 2,181 1,416 1,421 1,858 2,931 3,615 7,232 8,263 9,825 20,921 Wholesale Units 931 585 838 474 706 356 738 924 1,248 2,828 2,724 3,365 Total Units Sold 3,421 2,761 3,019 1,890 2,127 2,214 3,669 4,539 8,480 11,091 12,549 24,286 Ecommerce Average Selling Price 1 $15,977 $16,521 $16,925 $15,983 $15,423 $15,014 $16,463 $16,442 $16,992 $16,371 $16,031 $16,633 Adjusted Gross Profit per Unit 2 $1,323 $1,467 $1,093 $678 $2,807 $1,634 $1,334 $1,289 $980 $1,190 $1,587 $1,924 Customer Acquisition Cost per Unit 3 $677 $895 $745 $1,200 $1,257 $974 $1,339 $1,794 $752 $842 $1,425 $1,433 1 Ecommerce average selling price calculated as ecommerce vehicle sales divided by ecommerce units 2 Adjusted gross profit per unit calculated as adjusted gross profit divided by ecommerce units 3 Customer acquisition cost (CAC) per unit calculated as marketing expense divided by ecommerce units Note: Adjusted gross profit includes total adjustments of cost of goods sold of $1.7MM in 2018A, $11.6MM in 2019A, and $0.6MM in 2020E. Operating Profit includes total adjustments of $1.9MM in 2018A, $23.2MM in 2019A, $1.6MM in 2020E and $1.8MM in 2021E, and Net Income (Loss) includes total adjustments of $4.8MM in 2018A, $25.7MM in 2019A, and $1.2MM in 2020E. For a reconciliation of adjusted gross margin and operating profit and net income (loss) to their most directly comparable GAAP financial measures see page 43 of the presentation. Adjustments are attributable to non - cash expenses, largely related to Lithia warrant milestones, including $8.5 million of contra - revenue in 2019. These projections are for illustrative purposes only and should not be relied upon as being necessarily indicative of future results. Projections that are considered non - GAAP financial measures are presented on a non - GAAP basis without reconciliations of such forward - looking non - GAAP measures due to the inherent difficulty in forecasting and quantifying certain amounts that are necessary for such reconciliation. All historical annual GAAP financials shown are audited; quarterly, non - GAAP financials and projections are unaudited. Quarterly numbers are not shown under SAS 100 guidelines.
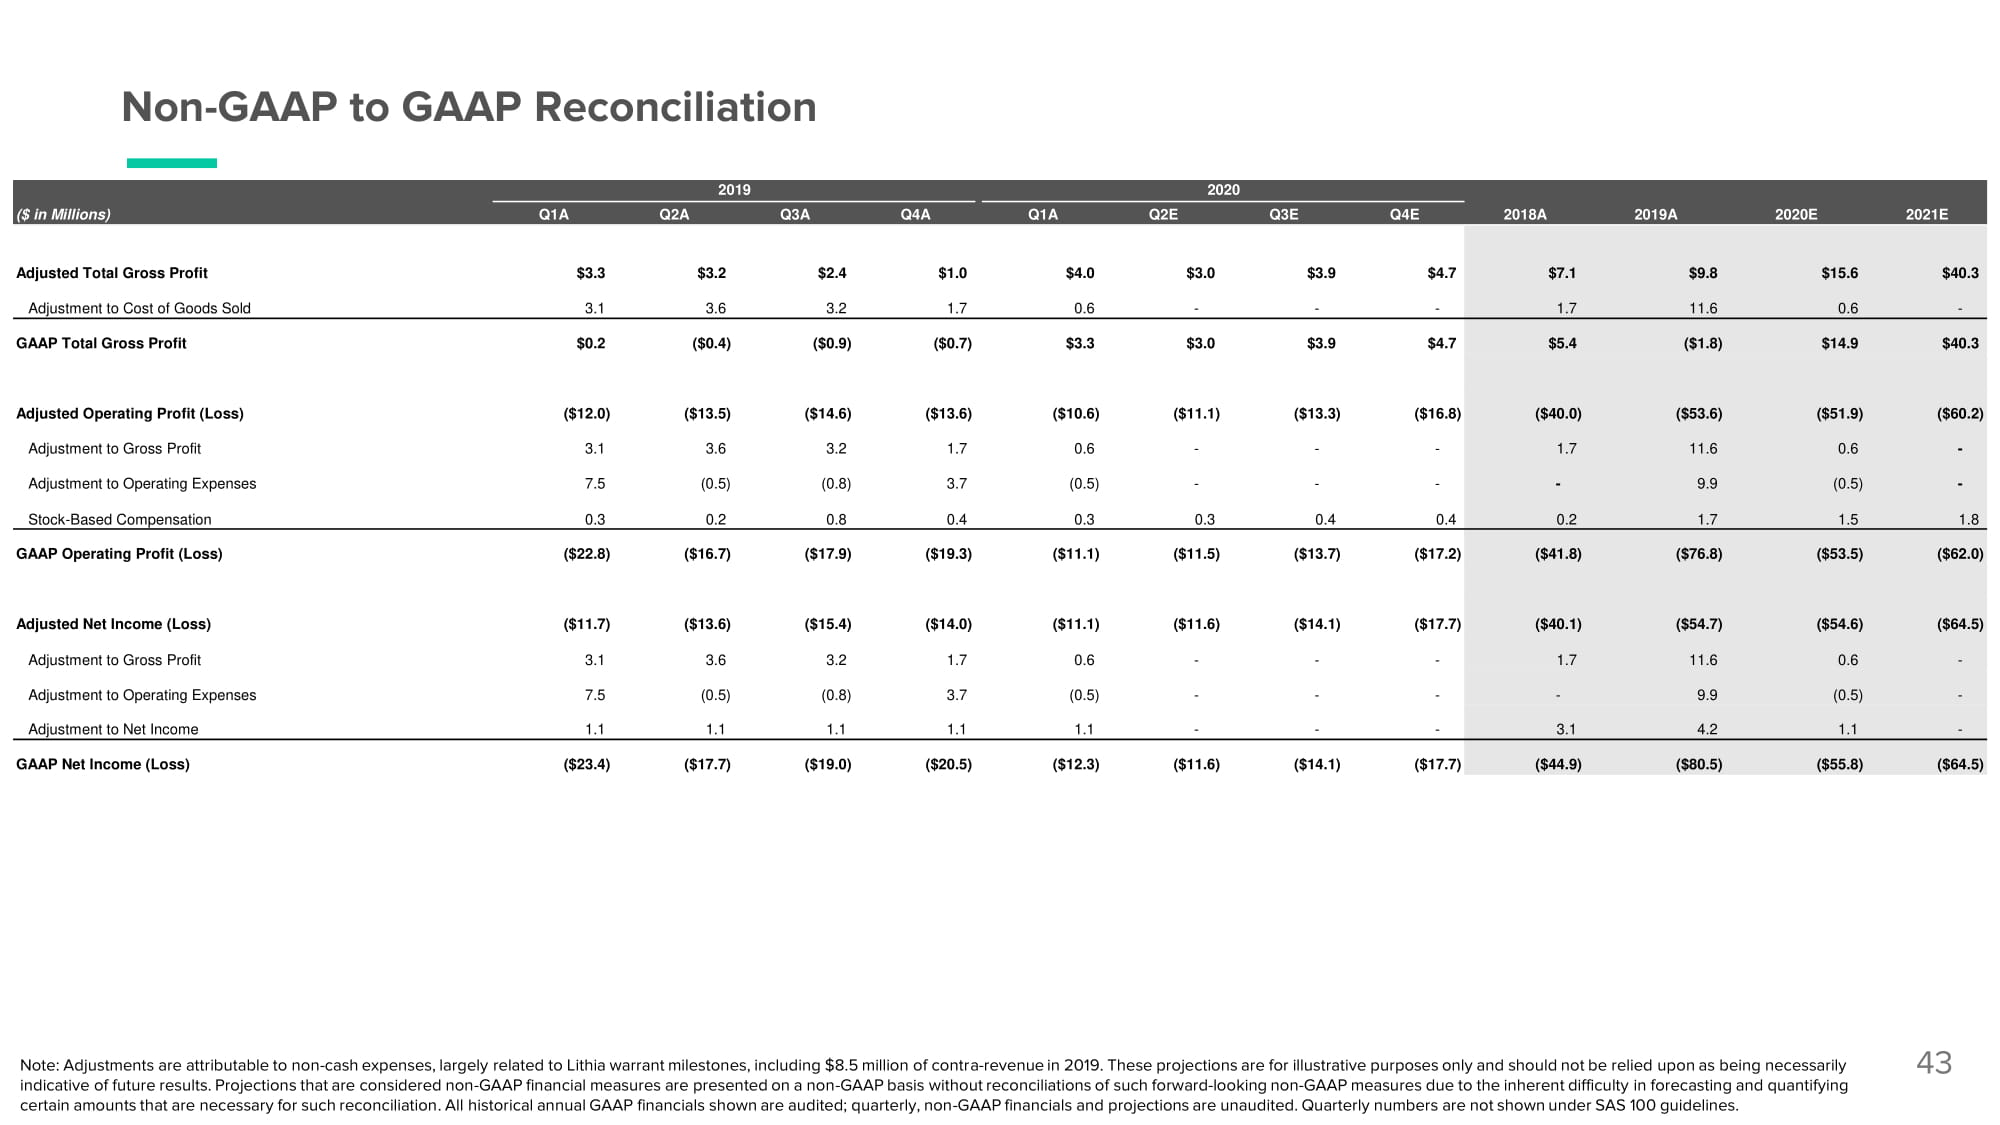
Non - GAAP to GAAP Reconciliation 43 ($ in Millions) Q1A 2019 Q2A Q3A Q4A Q1A 2020 Q2E Q3E Q4E 2018A 2019A 2020E 2021E Adjusted Total Gross Profit $3.3 $3.2 $2.4 $1.0 $4.0 $3.0 $3.9 $4.7 $7.1 $9.8 $15.6 $40.3 Adjustment to Cost of Goods Sold 3.1 3.6 3.2 1.7 0.6 - - - 1.7 11.6 0.6 - GAAP Total Gross Profit $0.2 ($ 0 .4) ($ 0 .9) ($ 0 .7) $3.3 $3.0 $3.9 $4.7 $5.4 ($ 1 .8) $14.9 $40.3 Adjusted Operating Profit (Loss) ($ 1 2. 0 ) ($ 1 3. 5 ) ($ 1 4. 6 ) ($ 1 3. 6 ) ($ 1 0. 6 ) ($ 1 1. 1 ) ($ 1 3. 3 ) ($ 1 6. 8 ) ($ 4 0. 0 ) ($ 5 3. 6 ) ($ 5 1. 9 ) ($ 6 0. 2 ) Adjustment to Gross Profit 3.1 3.6 3.2 1.7 0.6 - - - 1.7 11.6 0.6 - Adjustment to Operating Expenses 7.5 (0. 5 ) (0. 8 ) 3.7 (0. 5 ) - - - - 9.9 (0. 5 ) - Stock - Based Compensation 0.3 0.2 0.8 0.4 0.3 0.3 0.4 0.4 0.2 1.7 1.5 1.8 GAAP Operating Profit (Loss) ($ 2 2. 8 ) ($ 1 6. 7 ) ($ 1 7. 9 ) ($ 1 9. 3 ) ($ 1 1. 1 ) ($ 1 1. 5 ) ($ 1 3. 7 ) ($ 1 7. 2 ) ($ 4 1. 8 ) ($ 7 6. 8 ) ($ 5 3. 5 ) ($ 6 2. 0 ) Adjusted Net Income (Loss) ($ 1 1. 7 ) ($ 1 3. 6 ) ($ 1 5. 4 ) ($ 1 4. 0 ) ($ 1 1. 1 ) ($ 1 1. 6 ) ($ 1 4. 1 ) ($ 1 7. 7 ) ($ 4 0. 1 ) ($ 5 4. 7 ) ($ 5 4. 6 ) ($ 6 4. 5 ) Adjustment to Gross Profit 3.1 3.6 3.2 1.7 0.6 - - - 1.7 11.6 0.6 - Adjustment to Operating Expenses 7.5 (0. 5 ) (0. 8 ) 3.7 (0. 5 ) - - - - 9.9 (0. 5 ) - Adjustment to Net Income 1.1 1.1 1.1 1.1 1.1 - - - 3.1 4.2 1.1 - GAAP Net Income (Loss) ($ 2 3. 4 ) ($ 1 7. 7 ) ($ 1 9. 0 ) ($ 2 0. 5 ) ($ 1 2. 3 ) ($ 1 1. 6 ) ($ 1 4. 1 ) ($ 1 7. 7 ) ($ 4 4. 9 ) ($ 8 0. 5 ) ($ 5 5. 8 ) ($ 6 4. 5 ) Note : Adjustments are attributable to non - cash expenses, largely related to Lithia warrant milestones, including $ 8 . 5 million of contra - revenue in 2019 . These projections are for illustrative purposes only and should not be relied upon as being necessarily indicative of future results . Projections that are considered non - GAAP financial measures are presented on a non - GAAP basis without reconciliations of such forward - looking non - GAAP measures due to the inherent difficulty in forecasting and quantifying certain amounts that are necessary for such reconciliation . All historical annual GAAP financials shown are audited ; quarterly, non - GAAP financials and projections are unaudited . Quarterly numbers are not shown under SAS 100 guidelines .
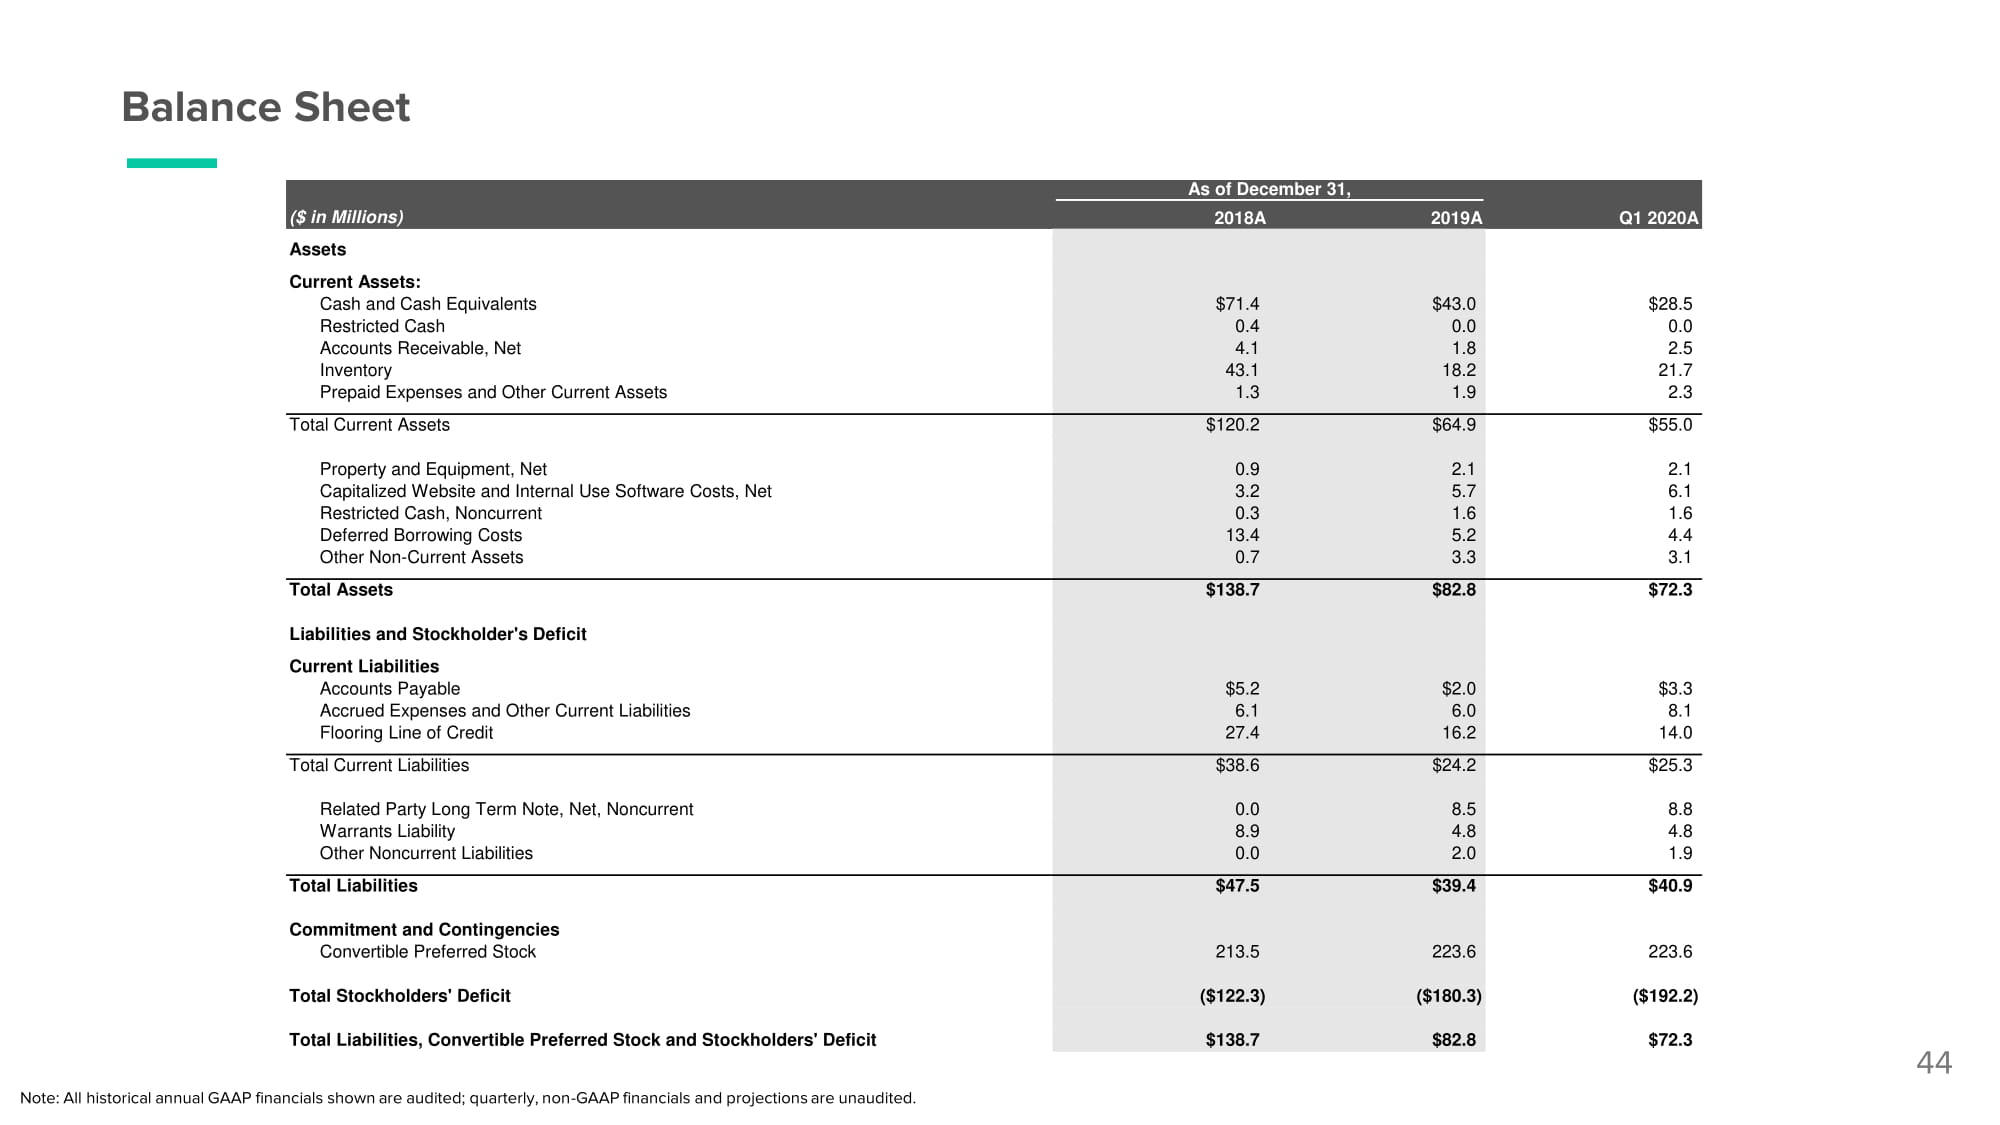
Balance Sheet 44 ($ in Millions) As of December 31, 2018A 2019A Q1 2020A Assets Current Assets: Cash and Cash Equivalents $ 7 1.4 $ 4 3.0 $ 2 8.5 Restricted Cash 0.4 0.0 0.0 Accounts Receivable, Net 4.1 1.8 2.5 Inventory 4 3 .1 1 8 .2 2 1 .7 Prepaid Expenses and Other Current Assets 1.3 1.9 2.3 Total Current Assets $ 1 2 0 .2 $ 6 4.9 $ 5 5.0 Property and Equipment, Net 0.9 2.1 2.1 Capitalized Website and Internal Use Software Costs, Net 3.2 5.7 6.1 Restricted Cash, Noncurrent 0.3 1.6 1.6 Deferred Borrowing Costs 1 3 .4 5.2 4.4 Other Non - Current Assets 0.7 3.3 3.1 Total Assets $ 1 3 8 .7 $ 8 2.8 $ 7 2.3 Liabilities and Stockholder's Deficit Current Liabilities Accounts Payable $ 5 .2 $ 2 .0 $ 3 .3 Accrued Expenses and Other Current Liabilities 6.1 6.0 8.1 Flooring Line of Credit 2 7 .4 1 6 .2 1 4 .0 Total Current Liabilities $ 3 8.6 $ 2 4.2 $ 2 5.3 Related Party Long Term Note, Net, Noncurrent 0.0 8.5 8.8 Warrants Liability 8.9 4.8 4.8 Other Noncurrent Liabilities 0.0 2.0 1.9 Total Liabilities $ 4 7.5 $ 3 9.4 $ 4 0.9 Commitment and Contingencies Convertible Preferred Stock 2 1 3.5 2 2 3.6 2 2 3.6 Total Stockholders' Deficit ($ 1 2 2 .3) ($ 1 8 0 .3) ($ 1 9 2 .2) Total Liabilities, Convertible Preferred Stock and Stockholders' Deficit $ 1 3 8 .7 $ 8 2.8 $ 7 2.3 Note: All historical annual GAAP financials shown are audited; quarterly, non - GAAP financials and projections are unaudited.
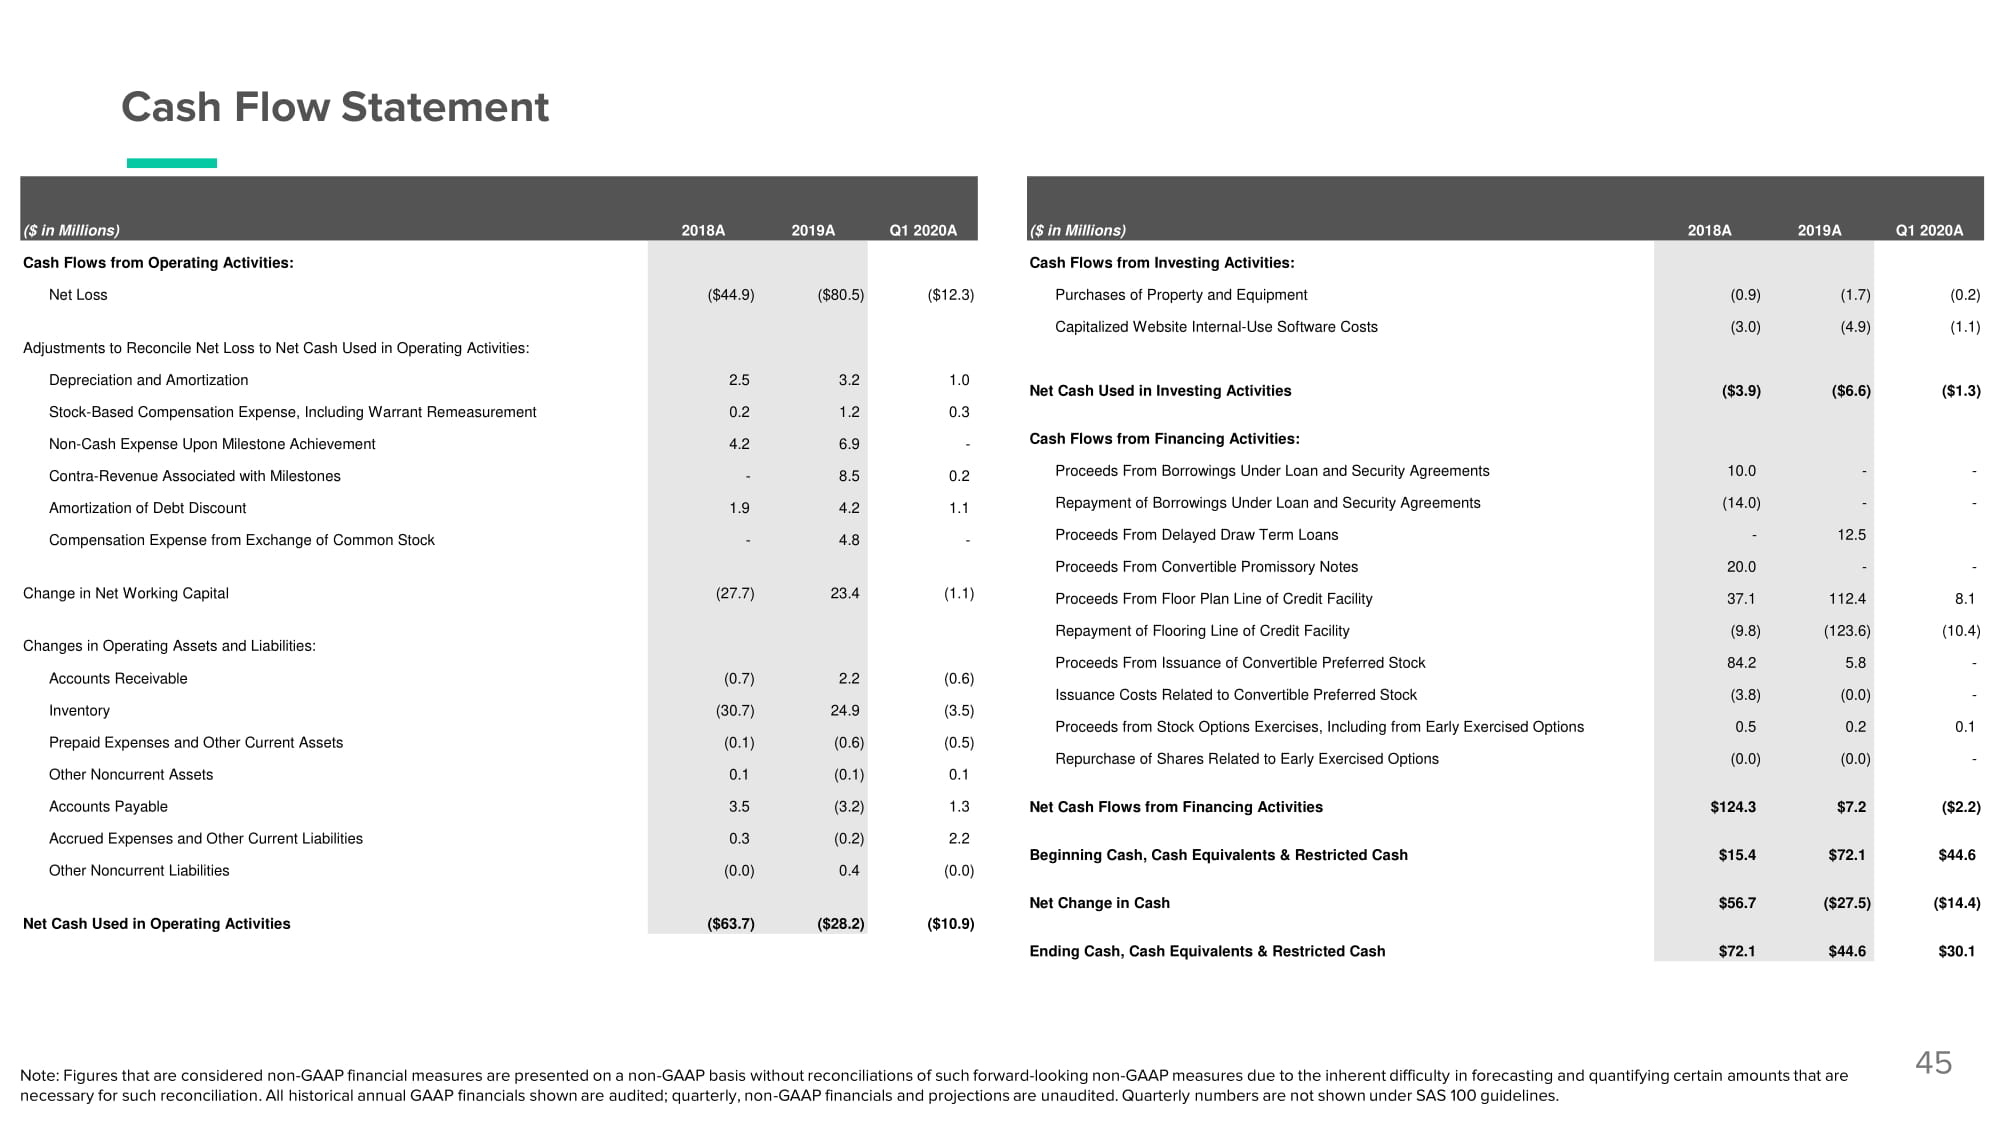
Cash Flow Statement 45 Change in Net Working Capital Changes in Operating Assets and Liabilities: Note: Figures that are considered non - GAAP financial measures are presented on a non - GAAP basis without reconciliations of such forward - looking non - GAAP measures due to the inherent difficulty in forecasting and quantifying certain amounts that are necessary for such reconciliation. All historical annual GAAP financials shown are audited; quarterly, non - GAAP financials and projections are unaudited. Quarterly numbers are not shown under SAS 100 guidelines. (27.7) 23.4 (1.1) Proceeds From Floor Plan Line of Credit Facility 3 7 .1 112.4 8.1 Repayment of Flooring Line of Credit Facility (9.8) (123.6) (1 0 .4) Accounts Receivable Inventory Prepaid Expenses and Other Current Assets Other Noncurrent Assets (0.7) (3 0 .7) (0.1) 0.1 2.2 24.9 (0.6) (0.1) (0.6) (3.5) (0.5) 0.1 Proceeds From Issuance of Convertible Preferred Stock Issuance Costs Related to Convertible Preferred Stock Proceeds from Stock Options Exercises, Including from Early Exercised Options Repurchase of Shares Related to Early Exercised Options 84.2 (3.8) 0.5 (0.0) 5.8 (0.0) 0.2 (0.0) - - 0.1 - Accounts Payable 3.5 (3.2) 1.3 Net Cash Flows from Financing Activities $ 1 2 4 .3 $7.2 ($ 2 .2) Accrued Expenses and Other Current Liabilities Other Noncurrent Liabilities 0.3 (0.0) (0.2) 0.4 2.2 (0.0) Beginning Cash, Cash Equivalents & Restricted Cash $ 1 5.4 $72.1 $ 4 4.6 Net Change in Cash $ 5 6.7 ($27.5) ($ 1 4.4) Net Cash Used in Operating Activities ($ 6 3.7) ($28.2) ($ 1 0.9) Ending Cash, Cash Equivalents & Restricted Cash $ 7 2.1 $44.6 $ 3 0.1 ($ in Millions) 2018A 2019A Q1 2020A ($ in Millions) 2018A 2019A Q1 2020A Cash Flows from Operating Activities: Cash Flows from Investing Activities: Net Loss ($ 4 4.9) ($ 8 0.5) ($ 1 2.3) Purchases of Property and Equipment (0.9) (1.7) (0.2) Adjustments to Reconcile Net Loss to Net Cash Used in Operating Activities: Capitalized Website Internal - Use Software Costs (3.0) (4.9) (1.1) Depreciation and Amortization Stock - Based Compensation Expense, Including Warrant Remeasurement 2.5 0.2 3.2 1.2 1.0 0.3 Net Cash Used in Investing Activities ($ 3 .9) ($ 6 .6) ($ 1 .3) Non - Cash Expense Upon Milestone Achievement 4.2 6.9 - Cash Flows from Financing Activities: Contra - Revenue Associated with Milestones - 8.5 0.2 Proceeds From Borrowings Under Loan and Security Agreements 1 0 .0 - - Amortization of Debt Discount 1.9 4.2 1.1 Repayment of Borrowings Under Loan and Security Agreements (1 4 .0) - - Compensation Expense from Exchange of Common Stock - 4.8 - Proceeds From Delayed Draw Term Loans - 1 2 .5 Proceeds From Convertible Promissory Notes 2 0 .0 - -