Attached files
| file | filename |
|---|---|
| EX-99.1 - EXHIBIT 99.1 - EARTHSTONE ENERGY INC | ex991pressrelease071620.htm |
| 8-K - 8-K - EARTHSTONE ENERGY INC | form8-kxoperationsandguida.htm |

Exhibit 99.2 Investor Presentation July 16, 2020 1
Disclaimer Forward-Looking Statements This presentation contains forward-looking statements within the meaning of Section 27A of the Securities Act of 1933, as amended (the “Securities Act”), and Section 21E of the Securities Exchange Act of 1934, as amended (the “Exchange Act”). Statements that are not strictly historical statements constitute forward-looking statements and may often, but not always, be identified by the use of such words such as “expects,” “believes,” “intends,” “anticipates,” “plans,” “estimates,” “guidance,” “target,” “potential,” “possible,” or “probable” or statements that certain actions, events or results “may,” “will,” “should,” or “could” be taken, occur or be achieved. The forward-looking statements include statements about the expected future reserves, production, financial position, business strategy, revenues, earnings, costs, capital expenditures and debt levels of the Company, and plans and objectives of management for future operations. Forward-looking statements are based on current expectations and assumptions and analyses made by Earthstone and its management in light of experience and perception of historical trends, current conditions and expected future developments, as well as other factors appropriate under the circumstances. However, whether actual results and developments will conform to expectations is subject to a number of material risks and uncertainties, including but not limited to: further and substantial declines in oil, natural gas liquids or natural gas prices; exposure to financial counterparty credit risk related to our derivative transactions; risks relating to any unforeseen liabilities; the level of success in exploration, development and production activities; adverse weather conditions that may negatively impact development or production activities; the timing of exploration and development expenditures; failures or defaults by interest owners to pay their share of capital and operating costs and expenses; inaccuracies of reserve estimates or assumptions underlying them; revisions to reserve estimates as a result of changes in commodity prices; impacts to financial statements as a result of impairment write-downs; risks related to levels of indebtedness and periodic redeterminations of the borrowing base under the Company’s credit agreement; Earthstone’s ability to generate sufficient cash flows from operations to meet the internally funded portion of its capital expenditures budget; Earthstone’s ability to obtain external capital to finance exploration and development operations and acquisitions; the ability to successfully complete any potential acquisitions and the risks related thereto; the impacts of hedging on results of operations; uninsured or underinsured losses resulting from oil and natural gas operations; Earthstone’s ability to replace oil and natural gas reserves; any loss of senior management or key technical personnel; and the direct and indirect impact on most or all of the foregoing on the evolving COVID-19 pandemic. Earthstone’s 2019 Annual Report on Form 10-K and subsequent, quarterly reports on Form 10-Q and current reports on Form 8-K, and other Securities and Exchange Commission (“SEC”) filings discuss some of the important risk factors identified that may affect Earthstone’s business, results of operations, and financial condition. Earthstone undertakes no obligation to revise or update publicly any forward-looking statements except as required by law. This presentation contains Earthstone’s 2020 production, capital expenditure and operating expense guidance. The actual levels of production, capital expenditures and operating expenses may be higher or lower than these estimates due to, among other things, uncertainty in drilling schedules, oil and natural gas prices, changes in market demand and unanticipated delays in production. These estimates are based on numerous assumptions. All or any of these assumptions may not prove to be accurate, which could result in actual results differing materially from estimates. No assurance can be made that any new wells will produce in line with historical performance, or that existing wells will continue to produce in line with expectations. Earthstone’s ability to fund its 2020 and future capital budgets is subject to numerous risks and uncertainties, including volatility in commodity prices and the potential for unanticipated increases in costs associated with drilling, production and transportation. For additional discussion of the factors that may cause us not to achieve our production estimates, see Earthstone’s filings with the SEC, including its 2019 Form 10-K, Form 10-Qs and Form 8-Ks. We do not undertakeanyobligationtoreleasepubliclytheresultsofanyfuturerevisionswemaymaketothisprospectivedataortoupdatethisprospectivedata to reflect events or circumstances after the date of this presentation. Therefore, you are cautioned not to place undue reliance on this information. Industry and Market Data This presentation has been prepared by Earthstone and includes market data and other statistical information from third-party sources, including independent industry publications, government publications or other published independent sources. Although Earthstone believes these third-party sources are reliable as of their respective dates, Earthstone has not independently verified the accuracy or completeness of this information. Some data are also based on Earthstone’s good faith estimates, which are derived from its review of internal sources as well as the third-party sources described above. Estimated Ultimate Recovery and Locations Management’s use of the term estimated ultimate recovery (“EUR”) in this presentation describes estimates of potentially recoverable hydrocarbons that the SEC rules prohibit from being included in filings with the SEC. These are more speculative than estimates of proved, probable and possible reserves and accordingly are subject to substantially greater risk of being actually realized, particularly in areas or zones where there has been limited or no drilling history. We include EUR to demonstrate what we believe to be the potential for future drilling and production by Earthstone. Actual quantities that may be ultimately recovered may differ substantially from estimates. Factors affecting ultimate recovery include the scope of the operators' ongoing drilling programs, which will be directly affected by the availability of capital, drilling and production costs, availability of drilling services and equipment, drilling results, lease expirations, transportation constraints, regulatory approvals and other factors, and actual drilling results, including geological and mechanical factors affecting recovery rates. Estimates of potential resources may also change significantly as the development of the properties underlying Earthstone's mineral interests provides additional data. This presentation also contains Earthstone’s internal estimates of its potential drilling locations, which may prove to be incorrect in a number of material ways. The actual number of locations that may be drilled may differ substantially from estimates. 2

Investment Highlights: Leading Small-Cap, Permian Focused Producer Top Investment Criteria Earthstone’s Qualifications Basin & Acreage High quality, Midland Basin acreage position Position ✓ Low Leverage ✓ Conservative balance sheet with ~1.0x leverage(1) 47% liquidity (cash + undrawn availability) on borrowing base after Strong Liquidity ✓ completing Spring 2020 redetermination ~8,000 barrels per day of 2Q-4Q 2020 oil production hedged at fixed High Commodity Price price of $57 per barrel WTI price (~$93mm MTM of hedge book as of Protection ✓ 3/31/20) Top quartile cash margins & leading cost structure with ~$13.50 per High Margin, Low Cost Boe of all-in cash costs(2) for 2019 and continuing trend with $12.92 Production ✓ per Boe in 1Q 2020 “Do the right thing” commitment to stakeholders, employees and Commitment & Focus ✓ environment (1) Reflects 1Q20 total debt / LTM Adjusted EBITDAX at 1Q20 (2) All-in cash costs measured for full year 2019 and includes lease operating expenses, ad valorem and production taxes, transportation expense, cash G&A expense and interest expense. Excludes impact of income taxes 3
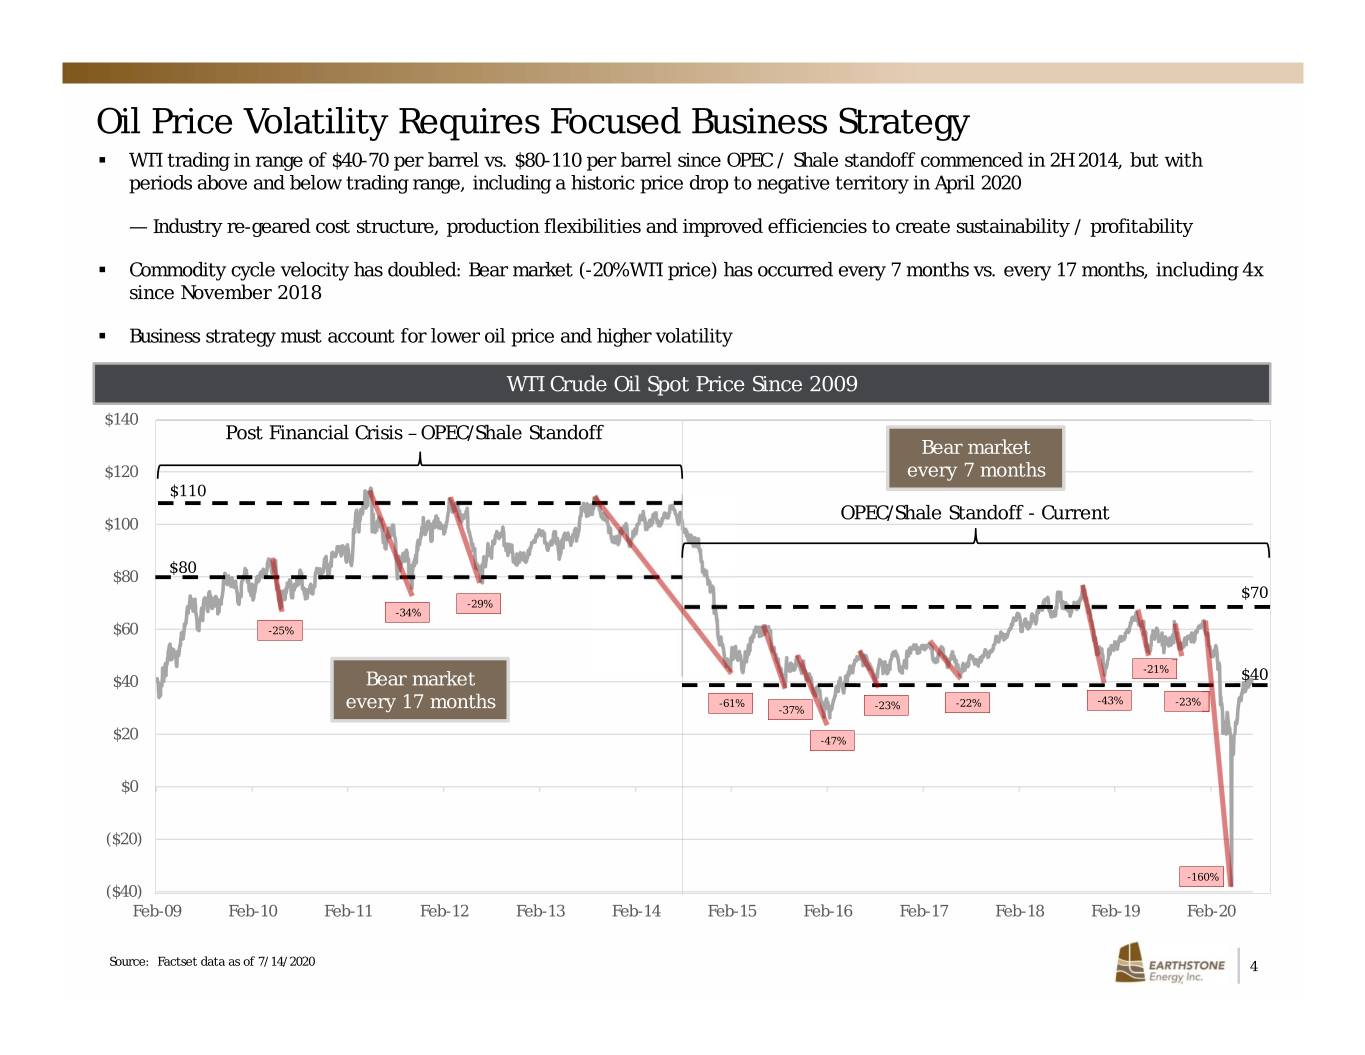
Oil Price Volatility Requires Focused Business Strategy . WTI trading in range of $40-70 per barrel vs. $80-110 per barrel since OPEC / Shale standoff commenced in 2H 2014, but with periods above and below trading range, including a historic price drop to negative territory in April 2020 — Industry re-geared cost structure, production flexibilities and improved efficiencies to create sustainability / profitability . Commodity cycle velocity has doubled: Bear market (-20% WTI price) has occurred every 7 months vs. every 17 months, including 4x since November 2018 . Business strategy must account for lower oil price and higher volatility WTI Crude Oil Spot Price Since 2009 $140 Post Financial Crisis – OPEC/Shale Standoff Bear market $120 every 7 months $110 OPEC/Shale Standoff - Current $100 $80 $80 $70 -29% -34% $60 -25% -21% $40 Bear market $40 -61% -22% -43% -23% every 17 months -37% -23% $20 -47% $0 ($20) -160% ($40) Feb-09 Feb-10 Feb-11 Feb-12 Feb-13 Feb-14 Feb-15 Feb-16 Feb-17 Feb-18 Feb-19 Feb-20 Source: Factset data as of 7/14/2020 4
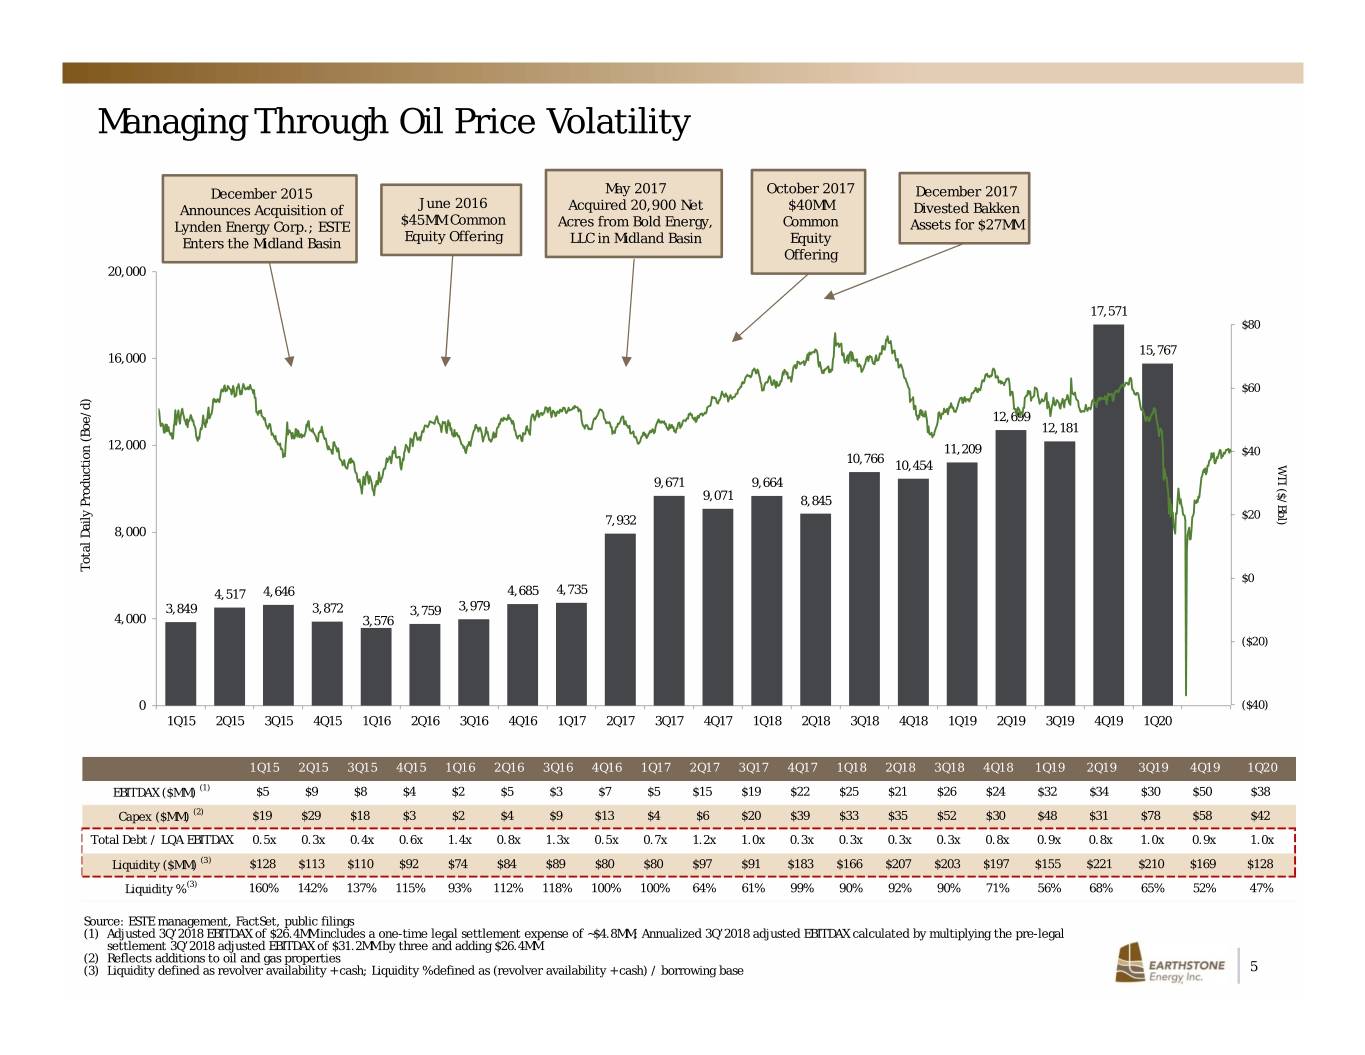
Managing Through Oil Price Volatility December 2015 May 2017 October 2017 December 2017 June 2016 Announces Acquisition of Acquired 20,900 Net $40MM Divested Bakken $45MM Common Lynden Energy Corp.; ESTE Acres from Bold Energy, Common Assets for $27MM Equity Offering Enters the Midland Basin LLC in Midland Basin Equity Offering 20,000 17,571 $80 15,767 16,000 $60 12,699 12,181 12,000 11,209 $40 10,766 ($/Bbl) WTI 10,454 9,671 9,664 9,071 8,845 7,932 $20 8,000 Total Production Daily (Boe/d) $0 4,517 4,646 4,685 4,735 3,849 3,872 3,759 3,979 4,000 3,576 ($20) 0 ($40) 1Q15 2Q15 3Q15 4Q15 1Q16 2Q16 3Q16 4Q16 1Q17 2Q17 3Q17 4Q17 1Q18 2Q18 3Q18 4Q18 1Q19 2Q19 3Q19 4Q19 1Q20 1Q15 2Q15 3Q15 4Q15 1Q16 2Q16 3Q16 4Q16 1Q17 2Q17 3Q17 4Q17 1Q18 2Q18 3Q18 4Q18 1Q19 2Q19 3Q19 4Q19 1Q20 EBITDAX ($MM) (1) $5 $9 $8 $4 $2 $5 $3 $7 $5 $15 $19 $22 $25 $21 $26 $24 $32 $34 $30 $50 $38 Capex ($MM) (2) $19 $29 $18 $3 $2 $4 $9 $13 $4 $6 $20 $39 $33 $35 $52 $30 $48 $31 $78 $58 $42 Total Debt / LQA EBITDAX 0.5x 0.3x 0.4x 0.6x 1.4x 0.8x 1.3x 0.5x 0.7x 1.2x 1.0x 0.3x 0.3x 0.3x 0.3x 0.8x 0.9x 0.8x 1.0x 0.9x 1.0x Liquidity ($MM) (3) $128 $113 $110 $92 $74 $84 $89 $80 $80 $97 $91 $183 $166 $207 $203 $197 $155 $221 $210 $169 $128 Liquidity % (3) 160% 142% 137% 115% 93% 112% 118% 100% 100% 64% 61% 99% 90% 92% 90% 71% 56% 68% 65% 52% 47% Source: ESTE management, FactSet, public filings (1) Adjusted 3Q’2018 EBITDAX of $26.4MM includes a one-time legal settlement expense of ~$4.8MM; Annualized 3Q’2018 adjusted EBITDAX calculated by multiplying the pre-legal settlement 3Q’2018 adjusted EBITDAX of $31.2MM by three and adding $26.4MM (2) Reflects additions to oil and gas properties (3) Liquidity defined as revolver availability + cash; Liquidity % defined as (revolver availability + cash) / borrowing base 5
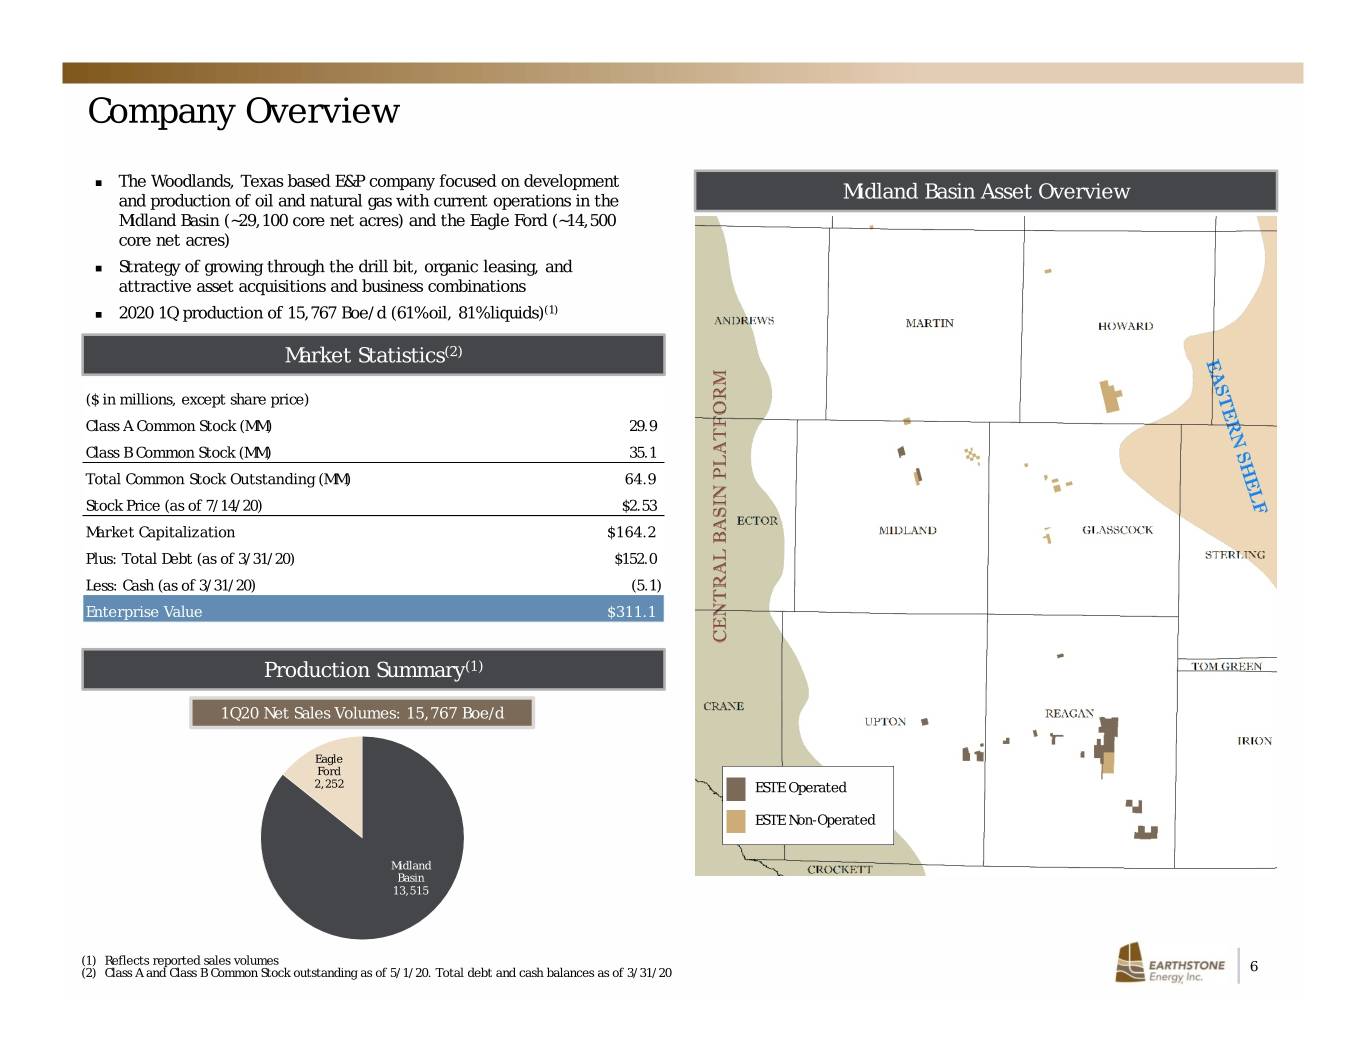
Company Overview The Woodlands, Texas based E&P company focused on development and production of oil and natural gas with current operations in the Midland Basin Asset Overview Midland Basin (~29,100 core net acres) and the Eagle Ford (~14,500 core net acres) Strategy of growing through the drill bit, organic leasing, and attractive asset acquisitions and business combinations (1) 2020 1Q production of 15,767 Boe/d (61% oil, 81% liquids) Market Statistics(2) ($ in millions, except share price) Class A Common Stock (MM) 29.9 Class B Common Stock (MM) 35.1 Total Common Stock Outstanding (MM) 64.9 Stock Price (as of 7/14/20) $2.53 Market Capitalization $164.2 Plus: Total Debt (as of 3/31/20) $152.0 Less: Cash (as of 3/31/20) (5.1) Enterprise Value $311.1 Production Summary(1) 1Q20 Net Sales Volumes: 15,767 Boe/d Eagle Ford ESTE Operated 2,252 ESTE Operated ESTE Non-Operated ESTE Non-Operated Midland Basin 13,515 (1) Reflects reported sales volumes (2) Class A and Class B Common Stock outstanding as of 5/1/20. Total debt and cash balances as of 3/31/20 6
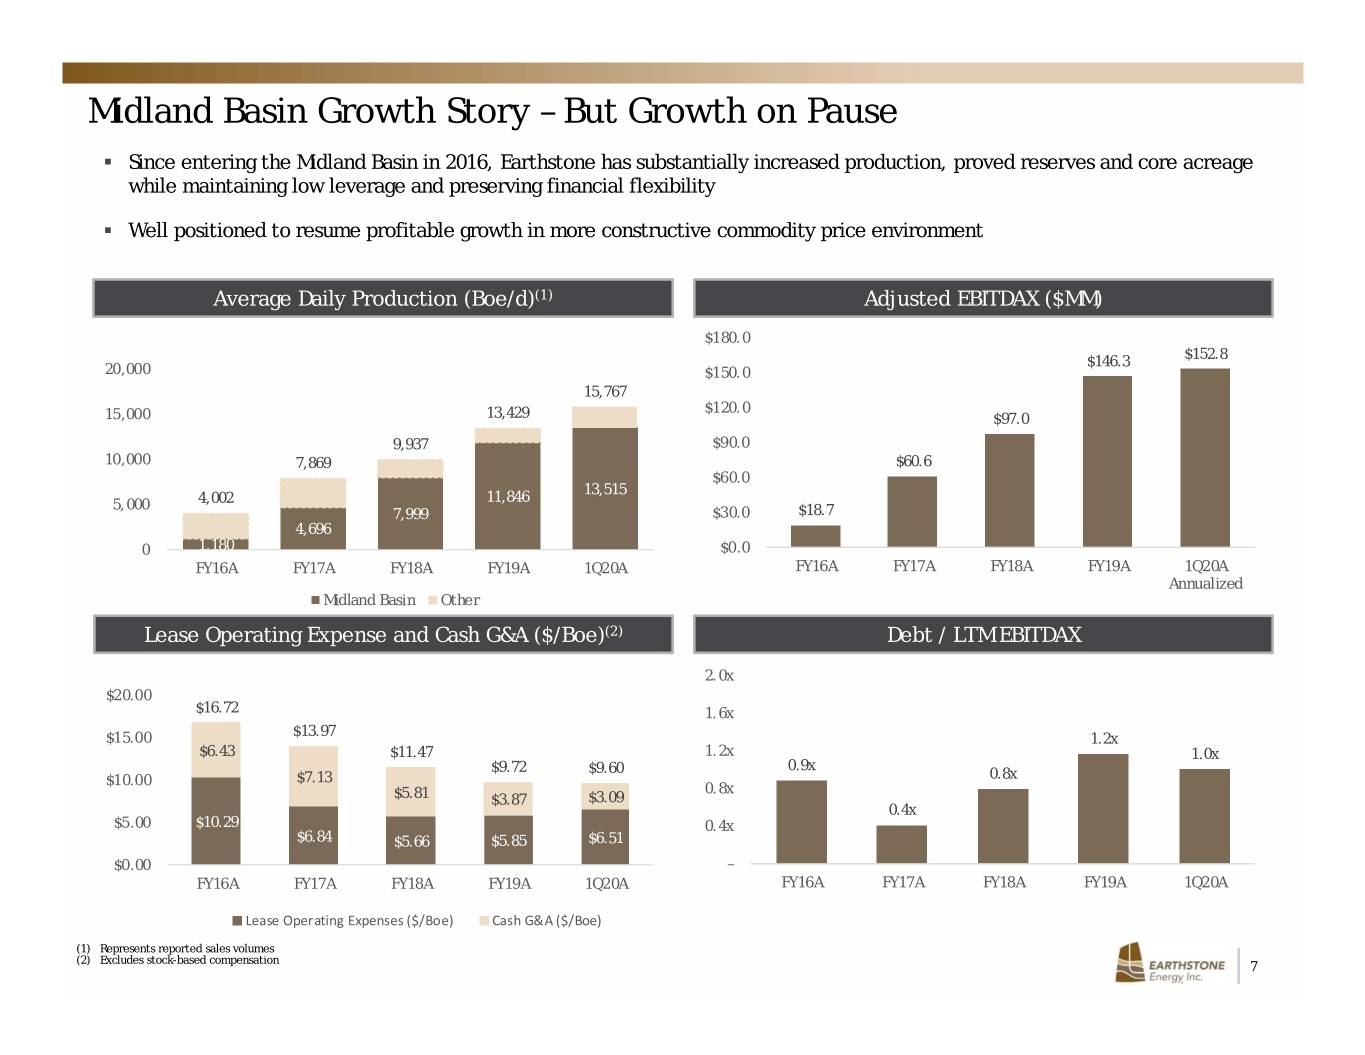
Midland Basin Growth Story – But Growth on Pause . Since entering the Midland Basin in 2016, Earthstone has substantially increased production, proved reserves and core acreage while maintaining low leverage and preserving financial flexibility . Well positioned to resume profitable growth in more constructive commodity price environment Average Daily Production (Boe/d)(1) Adjusted EBITDAX ($MM) $180.0 $152.8 $146.3 20,000 $150.0 15,767 $120.0 15,000 13,429 $97.0 9,937 $90.0 10,000 7,869 $60.6 $60.0 11,846 13,515 5,000 4,002 7,999 $30.0 $18.7 4,696 0 1,180 $0.0 FY16A FY17A FY18A FY19A 1Q20A FY16A FY17A FY18A FY19A 1Q20A Annualized Midland Basin Other Lease Operating Expense and Cash G&A ($/Boe)(2) Debt / LTM EBITDAX 2.0x $20.00 $16.72 1.6x $13.97 $15.00 1.2x $6.43 $11.47 1.2x 1.0x $9.72 $9.60 0.9x $10.00 $7.13 0.8x 0.8x $5.81 $3.87 $3.09 0.4x $5.00 $10.29 0.4x $6.84 $5.66 $5.85 $6.51 $0.00 – FY16A FY17A FY18A FY19A 1Q20A FY16A FY17A FY18A FY19A 1Q20A Lease Operating Expenses ($/Boe) Cash G&A ($/Boe) (1) Represents reported sales volumes (2) Excludes stock-based compensation 7

Low Cost Production Generates Leading Cash Margins 1Q20 All-in Cash Costs ($/Boe) (1) $40.00 ESTE: Large-Cap (2) Avg: SMid-Cap (2) Avg: $12.92 $11.10 $14.37 $30.00 $19.18 $20.00 $16.26 $16.45 $14.70 $14.86 $16.13 $12.92 $13.03 $10.95 $10.95 $10.96 $9.31 $9.86 $10.00 $0.00 ESTE Peer Peer Peer Peer Peer Peer Peer Peer Peer Peer Peer Peer 1 2 3 4 5 6 7 8 9 10 11 12 LOE (incl Workovers) Ad Val. & Prod. Taxes Transportation Cash G&A Interest Expense 1Q20 All-in Cash Margin ($/Boe) (1) $45.00 ESTE: Large-Cap (2) Avg: SMid-Cap (2) Avg: $25.32 $23.70 $17.39 $30.00 $25.32 $23.96 $24.89 $24.46 $22.24 $22.93 $19.72 $18.04 $18.05 $14.80 $16.12 $15.00 $12.24 $10.11 $0.00 ESTE Peer Peer Peer Peer Peer Peer Peer Peer Peer Peer Peer Peer 1 2 3 4 5 6 7 8 9 10 11 12 (1) All-in cash margin calculated on a per Boe basis as revenues after realized hedge impact less all-in cash costs, which consists of LOE, ad valorem and production taxes, transportation expense, cash G&A expense and interest expense. Excludes impact of income taxes. Cash G&A and interest expense includes expensing of capitalized cash G&A and capitalized interest expense, respectively. Companies that capitalized a portion of their cash G&A and/or interest expense include CDEV, CPE, CXO, FANG, MTDR, and XEC (2) Large-Cap includes: CXO, FANG, PXD. SMid-Cap includes: CDEV, CPE, LPI, MTDR, REI, SM, PE, WPX, XEC 8

Leading Leverage Metrics but Undervalued Equity Trading 1Q20 Total Debt / 1Q20 Annualized EBITDAX ESTE: Large-Cap (1) Avg: SMid-Cap (1) Avg: 6.0x 1.0x 1.4x 2.5x 3.7x 4.0x 3.3x 3.0x 2.5x 2.7x 2.1x 2.2x 2.3x 1.6x 2.0x 1.3x 1.0x 0.9x 1.0x – ESTE Peer Peer Peer Peer Peer Peer Peer Peer Peer Peer Peer Peer 1 2 3 4 5 6 7 8 9 10 11 12 Enterprise Value to 2020E EBITDAX 15.0x ESTE: Large-Cap (1) Avg: SMid-Cap (1) Avg: 2.6x 6.3x 5.0x 12.0x 9.0x 8.0x 6.5x 6.1x 5.7x 5.9x 6.0x 5.2x 5.6x 6.0x 4.7x 4.1x 3.1x 3.4x 2.6x 3.0x – ESTE Peer Peer Peer Peer Peer Peer Peer Peer Peer Peer Peer Peer 1 2 3 4 5 6 7 8 9 10 11 12 Source: Factset, Wall Street research. Market Data as of 7/14/20 (1) Large-Cap includes: CXO, FANG, PXD. SMid-Cap includes: CDEV, CPE, LPI, MTDR, REI, SM, PE, WPX, and XEC 9

Continuous Focus on Operational Improvement . A continued focus on driving down costs and increased efficiencies achieved by developing larger pads and driving down drilling and completion days Actual Drilling, Completions & Equip. Cost ($/Lat Ft.) (1) Average Number of Wells Per Pad $1,500 6.0 4.0 - 5.0 5.0 $1,200 $1,008 $926 4.0 $900 $845 $767 3.0 2.4 $600 2.0 1.7 1.8 $300 1.0 $0 0.0 2H17 FY18 FY19 1Q20 FY17 FY18 FY19 Future Pad Size All-in Frac Costs per Stage ($/Stage) Spud to Rig Release Days per 1,000’ (1)(2) $100,000 3.0 2.6 $80,854 $77,167 $75,000 2.0 2.0 $61,884 2.0 1.9 $56,600 $50,308 $50,000 1.0 $25,000 $0 0.0 1H18 2H18 1H19 2H19 1Q20 2H17 FY18 FY19 1Q20 (1) Excludes wells that required additional casing string or pilot well test. Includes operated Midland Basin wells only 10 (2) Spud to rig release days = average spud to rig release days / (average completed lateral foot/1000)
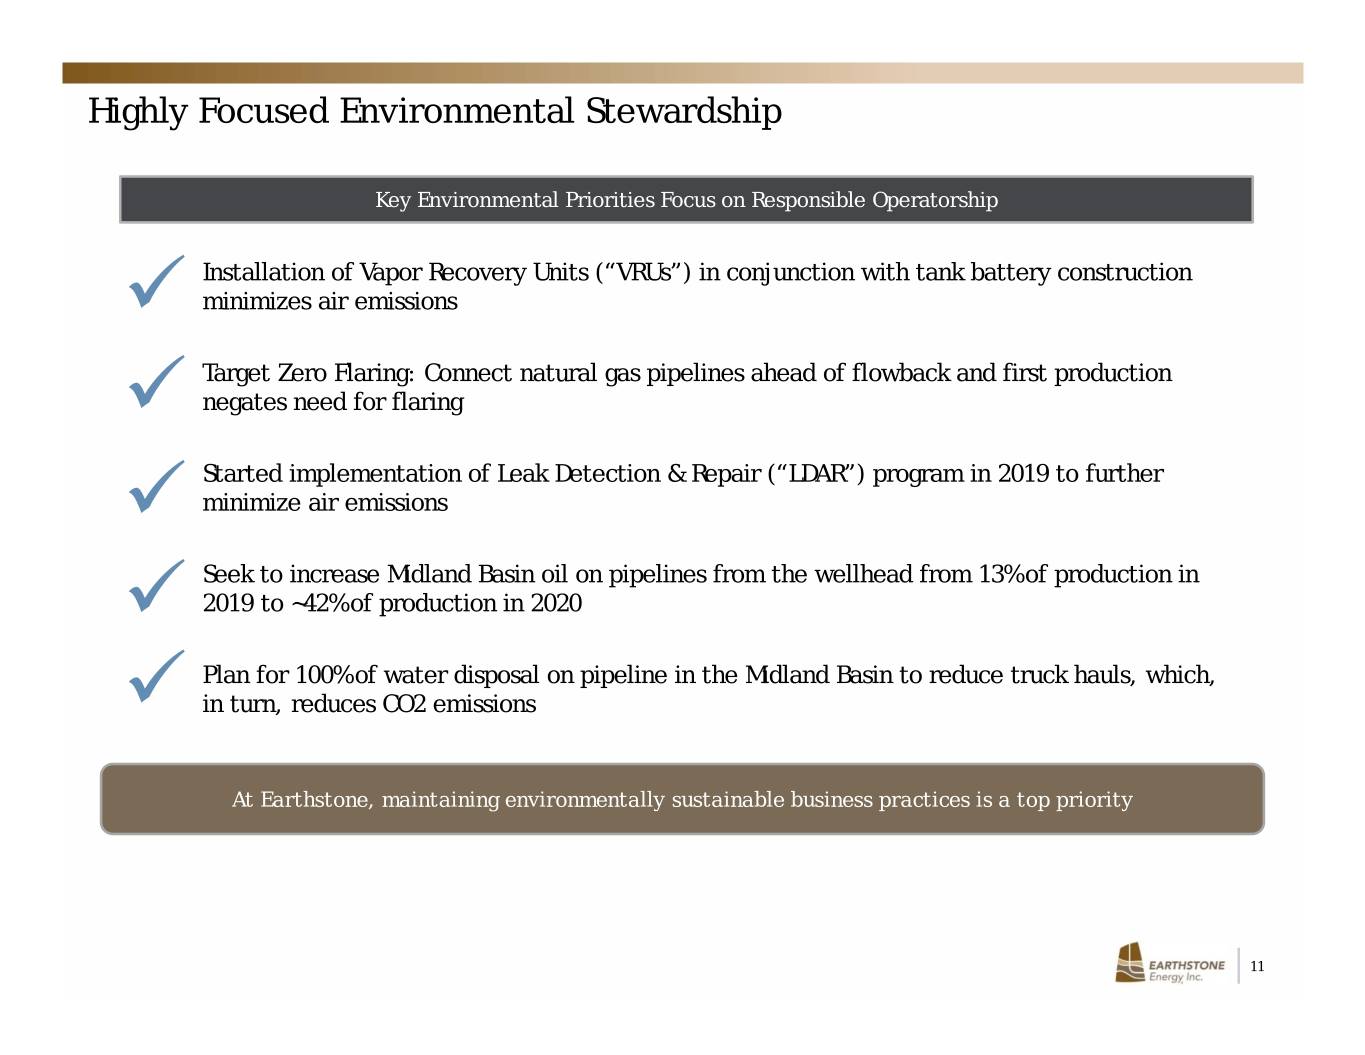
Highly Focused Environmental Stewardship Key Environmental Priorities Focus on Responsible Operatorship Installation of Vapor Recovery Units (“VRUs”) in conjunction with tank battery construction minimizes air emissions Target Zero Flaring: Connect natural gas pipelines ahead of flowback and first production negates need for flaring Started implementation of Leak Detection & Repair (“LDAR”) program in 2019 to further minimize air emissions Seek to increase Midland Basin oil on pipelines from the wellhead from 13% of production in 2019 to ~42% of production in 2020 Plan for 100% of water disposal on pipeline in the Midland Basin to reduce truck hauls, which, in turn, reduces CO2 emissions At Earthstone, maintaining environmentally sustainable business practices is a top priority 11

Asset Overview 12
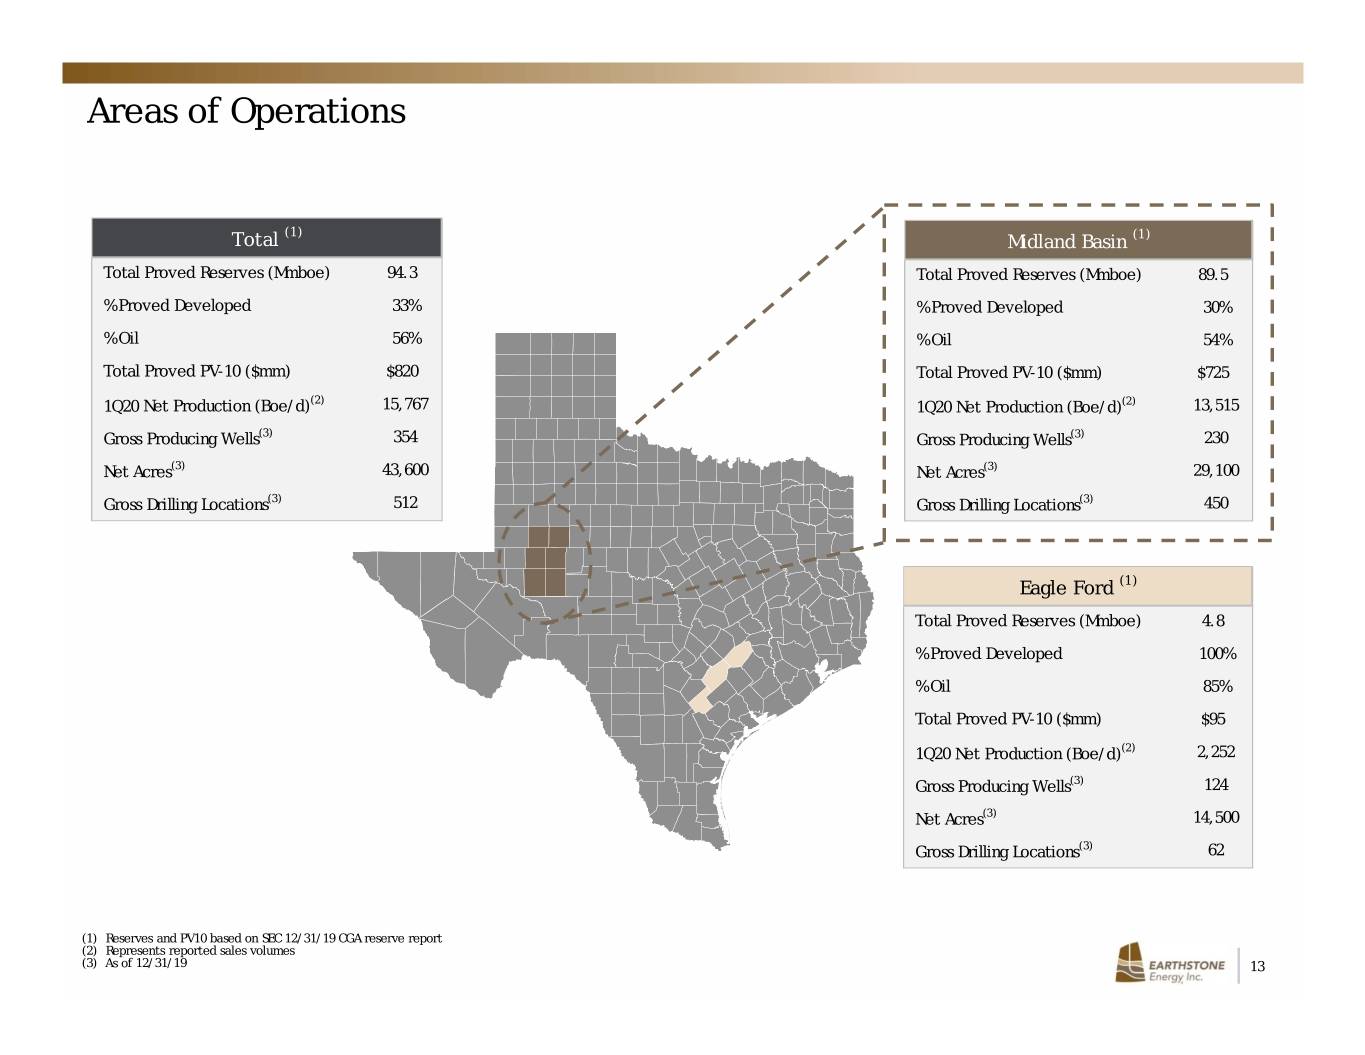
Areas of Operations (1) Total Midland Basin (1) Total Proved Reserves (Mmboe) 94.3 Total Proved Reserves (Mmboe) 89.5 % Proved Developed 33% % Proved Developed 30% % Oil 56% % Oil 54% Total Proved PV-10 ($mm) $820 Total Proved PV-10 ($mm) $725 1Q20 Net Production (Boe/d)(2) 15,767 1Q20 Net Production (Boe/d)(2) 13,515 Gross Producing Wells(3) 354 Gross Producing Wells(3) 230 Net Acres(3) 43,600 Net Acres(3) 29,100 Gross Drilling Locations(3) 512 Gross Drilling Locations(3) 450 Eagle Ford (1) Total Proved Reserves (Mmboe) 4.8 % Proved Developed 100% % Oil 85% Total Proved PV-10 ($mm) $95 1Q20 Net Production (Boe/d)(2) 2,252 Gross Producing Wells(3) 124 Net Acres(3) 14,500 Gross Drilling Locations(3) 62 (1) Reserves and PV10 based on SEC 12/31/19 CGA reserve report (2) Represents reported sales volumes (3) As of 12/31/19 13

Financial Overview 14
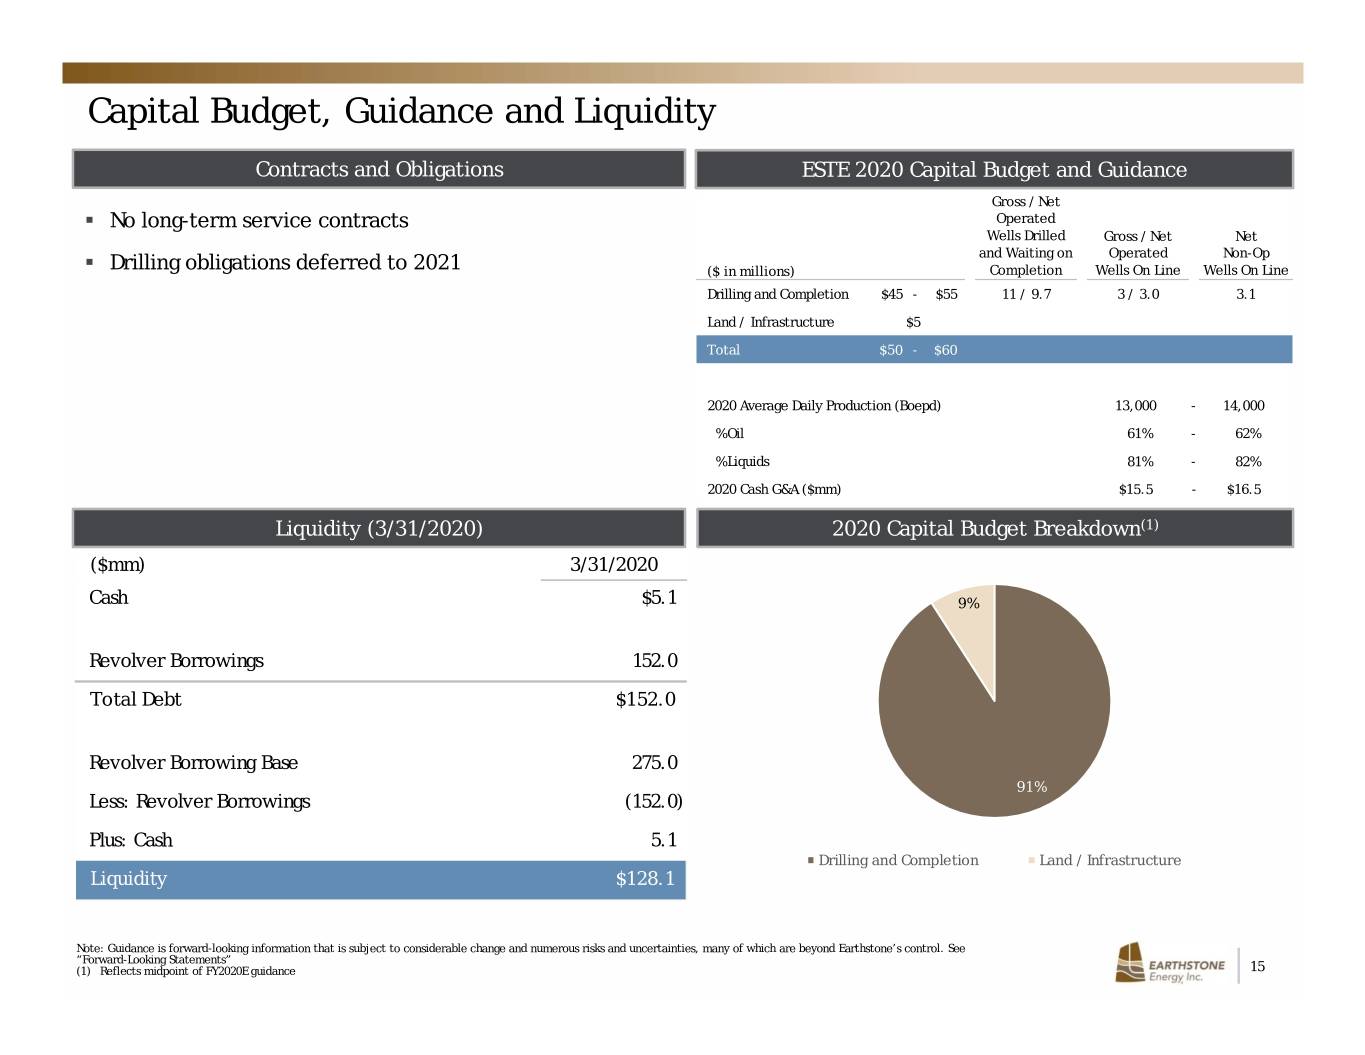
Capital Budget, Guidance and Liquidity Contracts and Obligations ESTE 2020 Capital Budget and Guidance Gross / Net . No long-term service contracts Operated Wells Drilled Gross / Net Net and Waiting on Operated Non-Op . Drilling obligations deferred to 2021 ($ in millions) Completion Wells On Line Wells On Line Drilling and Completion $45 - $55 11 / 9.7 3 / 3.0 3.1 Land / Infrastructure $5 Total $50 - $60 2020 Average Daily Production (Boepd) 13,000 - 14,000 % Oil 61% - 62% (2) % Liquids 81% - 82% 2020 Cash G&A ($mm) $15.5 - $16.5 Liquidity (3/31/2020) 2020 Capital Budget Breakdown(1) ($mm) 3/31/2020 Cash $5.1 9% Revolver Borrowings 152.0 Total Debt $152.0 Revolver Borrowing Base 275.0 91% Less: Revolver Borrowings (152.0) Plus: Cash 5.1 Drilling and Completion Land / Infrastructure Liquidity $128.1 Note: Guidance is forward-looking information that is subject to considerable change and numerous risks and uncertainties, many of which are beyond Earthstone’s control. See “Forward-Looking Statements” (1) Reflects midpoint of FY2020E guidance 15

Hedge Book Summary – 100% Swaps (as of 3/31/20) Oil Production Hedges - 100% Swaps Gas Production Hedges - 100% Swaps Period Volume (Bbls) Volume (Bbls/d) $/Bbl Period Volume (MMBtu) Volume (MMBtu/d) $/MMBtu Q2 2020 819,000 9,000 $53.44 Q2 2020 637,000 7,000 $2.850 Q3 2020 736,000 8,000 $57.35 Q3 2020 644,000 7,000 $2.850 Q4 2020 644,000 7,000 $61.15 Q4 2020 644,000 7,000 $2.850 FY 2020 2,896,000 7,913 $57.86 FY 2020 2,562,000 7,000 $2.850 FY 2021 1,460,000 4,000 $55.16 WTI Midland Argus Crude Basis Swaps WAHA Differential Basis Swaps Period Volume (Bbls) Volume (Bbls/d) $/Bbl (Differential) Period Volume (MMBtu) Volume (MMBtu/d) $/MMBtu FY 2020 2,562,000 7,000 ($1.40) FY 2020 2,562,000 7,000 ($1.065) FY 2021 1,825,000 5,000 $1.05 MEH Crude Oil Basis Swaps Period Volume (Bbls) Volume (Bbls/d) $/Bbl (Differential) FY 2020 366,000 1,000 $2.55 Oil Production Swaps(1) Gas Production Swaps (Volumes in Bbls/d) (Volumes in MMBtu/d) 12,000 15,000 8,000 7,000 7,000 10,000 7,996 8,000 4,000 5,000 5,000 4,000 0 0 2Q20 - 4Q20 FY21 2Q20 - 4Q20 Oil Swaps Crude Basis Swaps Gas Swaps WAHA Basis Swaps ESTE hedge book mark-to-market value (as of 3/31/20): ~$93mm (1) Crude basis swaps reflect Midland Argus and MEH crude basis swaps 16

Analyst Coverage Firm Analyst Contact Info Alliance Global Partners Bhakti Pavani / 949-296-3196 / bpavani@allianceg.com Coker Palmer Noel Parks / 215-913-7320 / parks@cokerpalmer.com Imperial Capital Jason Wangler / 713-892-5603 / jwangler@imperialcapital.com Johnson Rice Dun McIntosh / 504-584-1217 / dun@jrco.com Northland Jeff Grampp / 949-600-4150 / jgrampp@northlandcapitalmarkets.com RBC Brad Heffern / 512-708-6311 / brad.heffern@rbccm.com Roth John White / 949-720-7115 / jwhite@roth.com Stephens Gail Nicholson / 301-904-7466 / gail.nicholson@stephens.com SunTrust Neal Dingmann / 713-247-9000 / neal.dingmann@suntrust.com Wells Fargo Tom Hughes / 212-214-5022 / thomas.hughes@wellsfargo.com 17
Contact Information Mark Lumpkin, Jr. EVP, Chief Financial Officer Scott Thelander Vice President of Finance Corporate Offices Houston 1400 Woodloch Forest Drive | Suite 300 | The Woodlands, TX 77380 | (281) 298-4246 Midland 600 N. Marienfeld | Suite 1000 | Midland, TX 79701 | (432) 686-1100 Website www.earthstoneenergy.com 18

Appendix 19
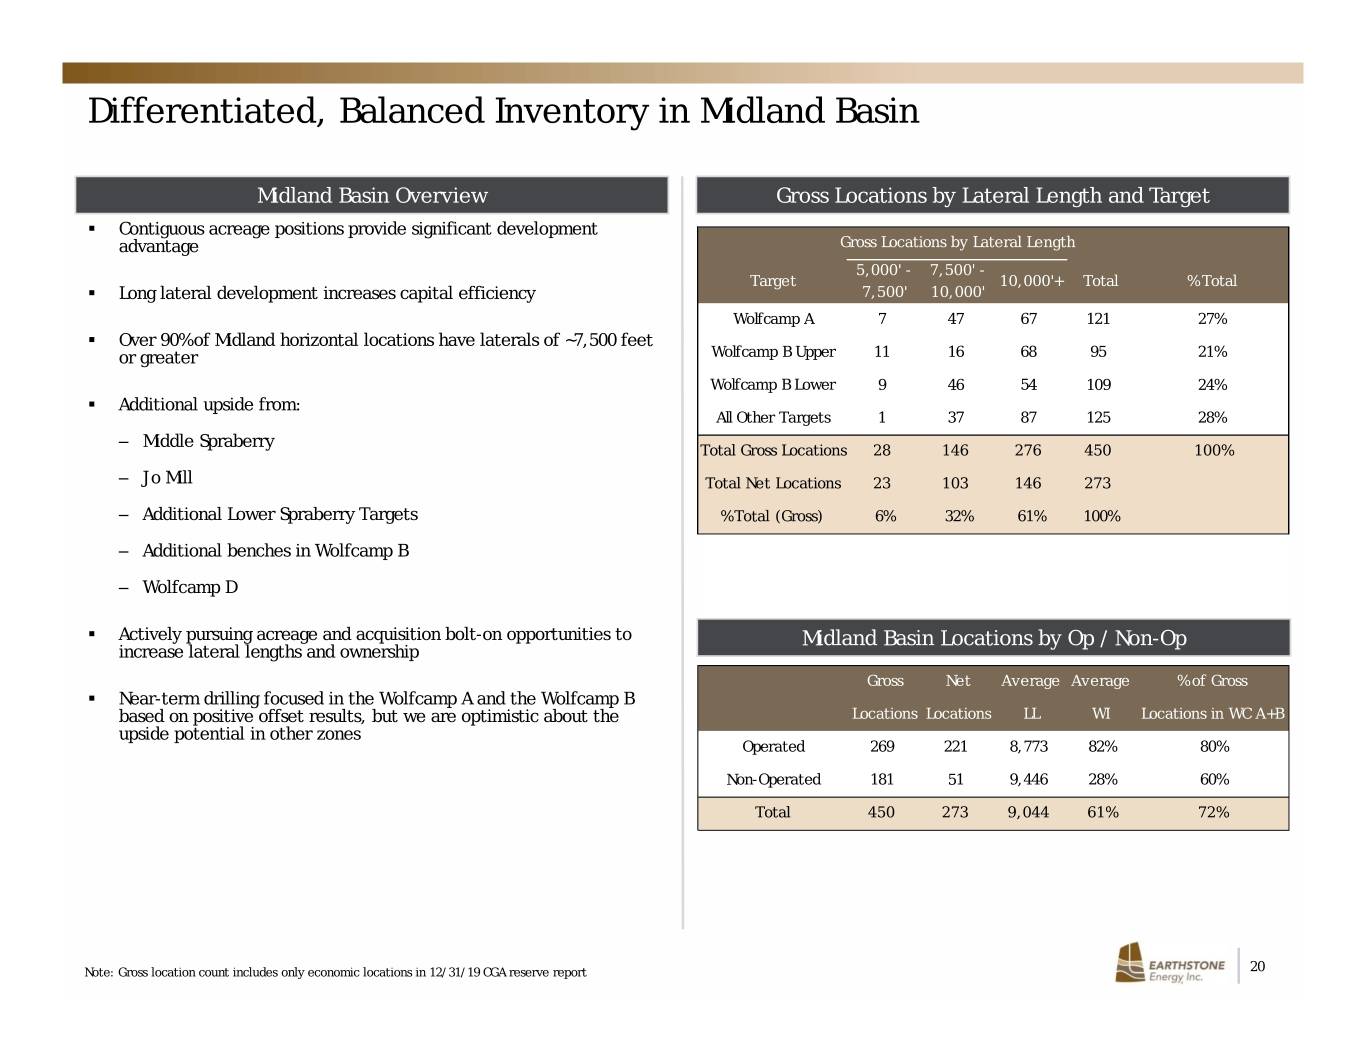
Differentiated, Balanced Inventory in Midland Basin Midland Basin Overview Gross Locations by Lateral Length and Target . Contiguous acreage positions provide significant development advantage Gross Locations by Lateral Length 5,000' - 7,500' - Target 10,000'+ Total % Total . Long lateral development increases capital efficiency 7,500' 10,000' Wolfcamp A 7 47 67 121 27% . Over 90% of Midland horizontal locations have laterals of ~7,500 feet or greater Wolfcamp B Upper 11 16 68 95 21% Wolfcamp B Lower 9 46 54 109 24% . Additional upside from: All Other Targets 1 37 87 125 28% – Middle Spraberry Total Gross Locations 28 146 276 450 100% – Jo Mill Total Net Locations 23 103 146 273 – Additional Lower Spraberry Targets % Total (Gross) 6% 32% 61% 100% – Additional benches in Wolfcamp B – Wolfcamp D . Actively pursuing acreage and acquisition bolt-on opportunities to Midland Basin Locations by Op / Non-Op increase lateral lengths and ownership Gross Net Average Average % of Gross . Near-term drilling focused in the Wolfcamp A and the Wolfcamp B based on positive offset results, but we are optimistic about the Locations Locations LL WI Locations in WC A+B upside potential in other zones Operated 269 221 8,773 82% 80% Non-Operated 181 51 9,446 28% 60% Total 450 273 9,044 61% 72% Note: Gross location count includes only economic locations in 12/31/19 CGA reserve report 20
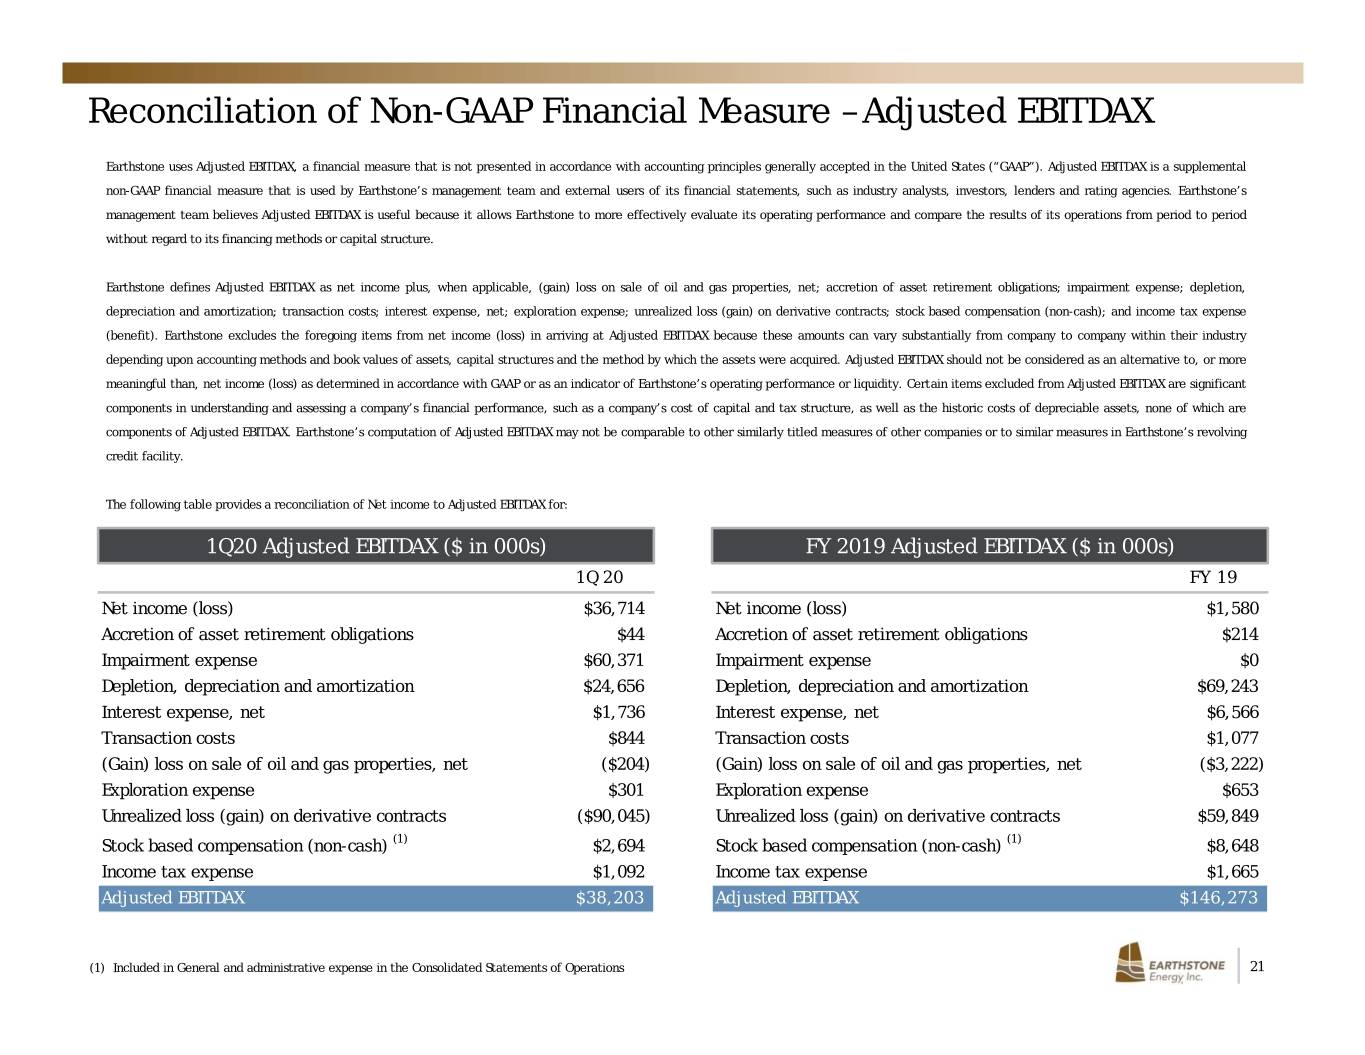
Reconciliation of Non-GAAP Financial Measure – Adjusted EBITDAX Earthstone uses Adjusted EBITDAX, a financial measure that is not presented in accordance with accounting principles generally accepted in the United States (“GAAP”). Adjusted EBITDAX is a supplemental non-GAAP financial measure that is used by Earthstone’s management team and external users of its financial statements, such as industry analysts, investors, lenders and rating agencies. Earthstone’s management team believes Adjusted EBITDAX is useful because it allows Earthstone to more effectively evaluate its operating performance and compare the results of its operations from period to period without regard to its financing methods or capital structure. Earthstone defines Adjusted EBITDAX as net income plus, when applicable, (gain) loss on sale of oil and gas properties, net; accretion of asset retirement obligations; impairment expense; depletion, depreciation and amortization; transaction costs; interest expense, net; exploration expense; unrealized loss (gain) on derivative contracts; stock based compensation (non-cash); and income tax expense (benefit). Earthstone excludes the foregoing items from net income (loss) in arriving at Adjusted EBITDAX because these amounts can vary substantially from company to company within their industry depending upon accounting methods and book values of assets, capital structures and the method by which the assets were acquired. Adjusted EBITDAX should not be considered as an alternative to, or more meaningful than, net income (loss) as determined in accordance with GAAP or as an indicator of Earthstone’s operating performance or liquidity. Certain items excluded from Adjusted EBITDAX are significant components in understanding and assessing a company’s financial performance, such as a company’s cost of capital and tax structure, as well as the historic costs of depreciable assets, none of which are components of Adjusted EBITDAX. Earthstone’s computation of Adjusted EBITDAX may not be comparable to other similarly titled measures of other companies or to similar measures in Earthstone’s revolving credit facility. The following table provides a reconciliation of Net income to Adjusted EBITDAX for: 1Q20 Adjusted EBITDAX ($ in 000s) FY 2019 Adjusted EBITDAX ($ in 000s) 1Q 20 FY 19 Net income (loss) $36,714 Net income (loss) $1,580 Accretion of asset retirement obligations $44 Accretion of asset retirement obligations $214 Impairment expense $60,371 Impairment expense $0 Depletion, depreciation and amortization $24,656 Depletion, depreciation and amortization $69,243 Interest expense, net $1,736 Interest expense, net $6,566 Transaction costs $844 Transaction costs $1,077 (Gain) loss on sale of oil and gas properties, net ($204) (Gain) loss on sale of oil and gas properties, net ($3,222) Exploration expense $301 Exploration expense $653 Unrealized loss (gain) on derivative contracts ($90,045) Unrealized loss (gain) on derivative contracts $59,849 Stock based compensation (non-cash) (1) $2,694 Stock based compensation (non-cash) (1) $8,648 Income tax expense $1,092 Income tax expense $1,665 Adjusted EBITDAX $38,203 Adjusted EBITDAX $146,273 (1) Included in General and administrative expense in the Consolidated Statements of Operations 21
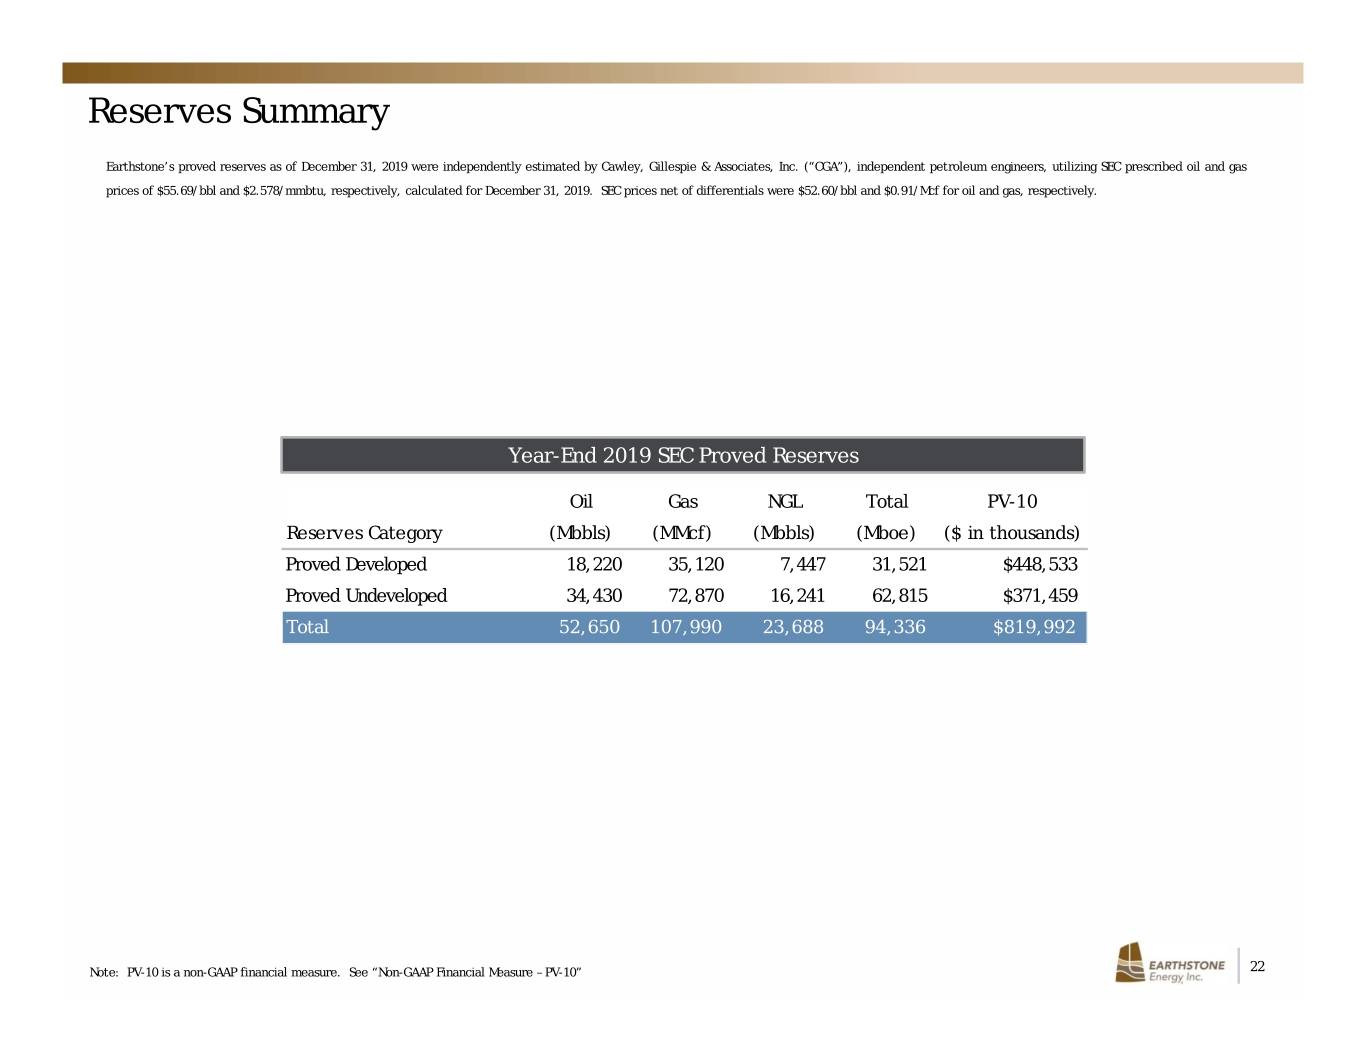
Reserves Summary Earthstone’s proved reserves as of December 31, 2019 were independently estimated by Cawley, Gillespie & Associates, Inc. (“CGA”), independent petroleum engineers, utilizing SEC prescribed oil and gas prices of $55.69/bbl and $2.578/mmbtu, respectively, calculated for December 31, 2019. SEC prices net of differentials were $52.60/bbl and $0.91/Mcf for oil and gas, respectively. Year-End 2019 SEC Proved Reserves Oil Gas NGL Total PV-10 Reserves Category (Mbbls) (MMcf) (Mbbls) (Mboe) ($ in thousands) Proved Developed 18,220 35,120 7,447 31,521 $448,533 Proved Undeveloped 34,430 72,870 16,241 62,815 $371,459 Total 52,650 107,990 23,688 94,336 $819,992 Note: PV-10 is a non-GAAP financial measure. See “Non-GAAP Financial Measure – PV-10” 22
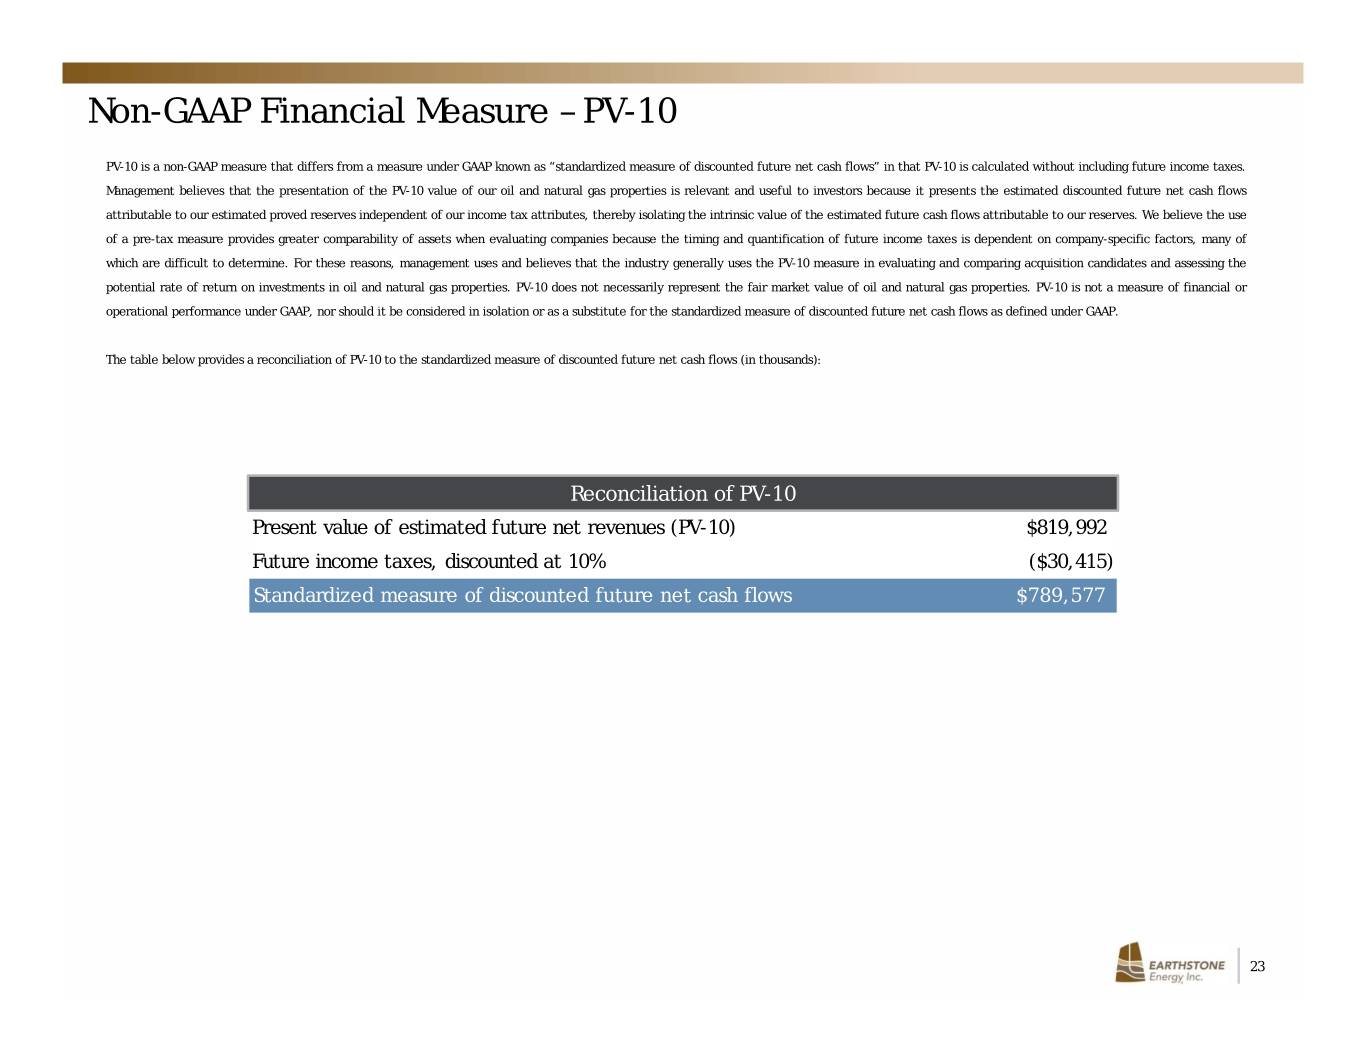
Non-GAAP Financial Measure – PV-10 PV-10 is a non-GAAP measure that differs from a measure under GAAP known as “standardized measure of discounted future net cash flows” in that PV-10 is calculated without including future income taxes. Management believes that the presentation of the PV-10 value of our oil and natural gas properties is relevant and useful to investors because it presents the estimated discounted future net cash flows attributable to our estimated proved reserves independent of our income tax attributes, thereby isolating the intrinsic value of the estimated future cash flows attributable to our reserves. We believe the use of a pre-tax measure provides greater comparability of assets when evaluating companies because the timing and quantification of future income taxes is dependent on company-specific factors, many of which are difficult to determine. For these reasons, management uses and believes that the industry generally uses the PV-10 measure in evaluating and comparing acquisition candidates and assessing the potential rate of return on investments in oil and natural gas properties. PV-10 does not necessarily represent the fair market value of oil and natural gas properties. PV-10 is not a measure of financial or operational performance under GAAP, nor should it be considered in isolation or as a substitute for the standardized measure of discounted future net cash flows as defined under GAAP. The table below provides a reconciliation of PV-10 to the standardized measure of discounted future net cash flows (in thousands): Reconciliation of PV-10 Present value of estimated future net revenues (PV-10) $819,992 Future income taxes, discounted at 10% ($30,415) Standardized measure of discounted future net cash flows $789,577 23
