Attached files
| file | filename |
|---|---|
| EX-99.1 - California Resources Corp | a20200715exhibit991.htm |
| EX-10.3 - California Resources Corp | a20200715exhibit103.htm |
| EX-10.2 - California Resources Corp | a20200715exhibit102.htm |
| EX-10.1 - California Resources Corp | a20200715exhibit101.htm |
| 8-K - 8-K - California Resources Corp | a20200715form8k.htm |

EXHIBIT 99.2 Cleansing Materials July 2020

Disclaimer Regarding Forward-Looking Statements FORWARD‐LOOKING STATEMENTS The information in this presentation and in any oral statements made in connection herewith include forward‐looking statements. All statements, other than statements of present or historical fact included in this presentation, including with regard to the financial position, results of operations, reserves, production, pricing, EBITDAX, cash flows, capital expenditures, operating costs, general and administrative costs and other data regarding the Company are forward‐looking statements. When used in this presentation, including any oral statements made in connection therewith, the words “could,” “should,” “will,” “may,” “believe,” “anticipate,” “intend,” “estimate,” “expect,” “project,” the negative of such terms and other similar expressions are intended to identify forward‐looking statements, although not all forward‐looking statements contain such identifying words. These forward‐looking statements are based on management’s current expectations and assumptions about future events and are based on currently available information as to the outcome and timing of future events. Except as otherwise required by applicable law, the Company disclaims any duty to update any forward‐looking statements, all of which are expressly qualified by the statements in this section, to reflect events or circumstances after the date of this presentation. The Company cautions you that these forward‐looking statements are subject to all of the risks and uncertainties, most of which are difficult to predict and many of which are beyond our control, incident to the development, production, gathering and sale of oil, natural gas and NGLs. These risks include, but are not limited to, commodity price changes, debt limitations on our financial flexibility, insufficient cash flow to fund planned investments, changes to our capital plan, legislative or regulatory changes, including those related to drilling, completion, well stimulation, operation, maintenance or abandonment of wells or facilities, managing energy, water, land, greenhouse gases or other emissions, protection of health, safety and the environment, or transportation, marketing and sale of our products, joint ventures and our ability to achieve expected results, the effects of pandemics, epidemics, outbreaks or other public health events (such as the coronavirus disease 2019 (COVID-19)), the recoverability of resources and unexpected geologic conditions, incorrect estimates of reserves and related future cash flows, changes in business strategy, insufficient capital or access to capital, effects of hedging transactions, equipment, service or labor price inflation or unavailability, availability or timing of, or conditions imposed on, permits and approvals, lower-than-expected production, reserves or resources from development projects or joint ventures, or higher-than-expected decline rates, disruptions due to accidents, mechanical failures, transportation or storage constraints, natural disasters, labor difficulties, cyber attacks or other catastrophic events or factors discussed in “Risk Factors” in the Company’s Annual Report on Form 10-K and any subsequent Quarterly Reports on Form 10-Q, which are available publicly on the SEC’s website at www.sec.gov. Should one or more of the risks or uncertainties described in this presentation and any oral statements made in connection therewith occur, or should underlying assumptions prove incorrect, actual results and plans could differ materially from those expressed in any forward‐looking statements. RESERVE INFORMATION This presentation contains volumes and values of our reserves. Reserve engineering is a process of estimating underground accumulations of hydrocarbons that cannot be measured in an exact way. The accuracy of any reserve estimate depends on the quality of available data, the interpretation of such data and price and cost assumptions made by reserve engineers. In addition, the results of drilling, testing and production activities may justify revisions of estimates that were made previously. If significant, such revisions could impact the Company’s strategy and change the schedule of any further production and development drilling on its properties. Accordingly, reserve and resource estimates may differ significantly from the quantities of oil and natural gas that are ultimately recovered USE OF PROJECTIONS This presentation contains projections of future production of oil, NGLs and natural gas produced, capital investment and estimated cash flows. The Company’s independent auditors have not audited, reviewed, compiled, or performed any procedures with respect to the projections for the purpose of their inclusion in this presentation, and accordingly, have not expressed an opinion or provided any other form of assurance with respect thereto for the purpose of this presentation. These projections are for illustrative purposes only and should not be relied upon as being necessarily indicative of future results. The assumptions and estimates underlying the projected information are inherently uncertain and are subject to a wide variety of significant business, economic and competitive risks and uncertainties that could cause actual results to differ materially from those contained in the projected information. Even if our assumptions and estimates are correct, projections are inherently uncertain due to a number of factors outside our control. Accordingly, there can be no assurance that the projected results are indicative of the future performance of the Company, or that actual results will not differ materially from those presented in the projected information. Inclusion of the projected information in this presentation should not be regarded as a representation by any person that the results contained in the projected information will be achieved. USE OF NON‐GAAP FINANCIAL MEASURES This presentation includes the non‐GAAP financial measures EBITDAX, Unlevered Free Cash Flow and PV-10. EBITDAX and Unlevered Free Cash Flow and as presented herein differ in certain respects from Adjusted EBITDAX and Free Cash Flow as reported by the Company for historical periods. These are forward-looking financial measures that are not presented in accordance with GAAP. These Non-GAAP financial measures are numerical measures of financial performance that exclude or include amounts so as to be different than the most directly comparable measure that would be presented in accordance with GAAP. Non-GAAP financial measures should not be considered in isolation or as a substitute for the most directly comparable GAAP measures. Our non-GAAP financial measures may be different from non-GAAP financial measures used by other companies. We do not attempt to reconcile these measures with the most directly comparable GAAP financial measures because, without unreasonable efforts, we are unable to predict and quantify with reasonable certainty certain amounts that are necessary for such reconciliations, including the amounts of non-GAAP adjustments, the amounts of which could be material INDUSTRY AND MARKET DATA This presentation includes market data and other statistical information from sources believed by the Company to be reliable, including independent industry publications, governmental publications or other published independent sources. Some data is also based on the good faith estimates of management, which are derived from its review of internal sources as well as the independent sources described above. Although the Company believes these sources are reliable, we have not independently verified the information and cannot guarantee its accuracy and completeness. NO OFFER This communication shall not constitute an offer to sell nor the solicitation of an offer to buy, nor shall there be any sale of securities in any state or jurisdiction in which such offer, solicitation or sale would be unlawful prior to registration or qualification under the securities laws of any such state or jurisdiction.

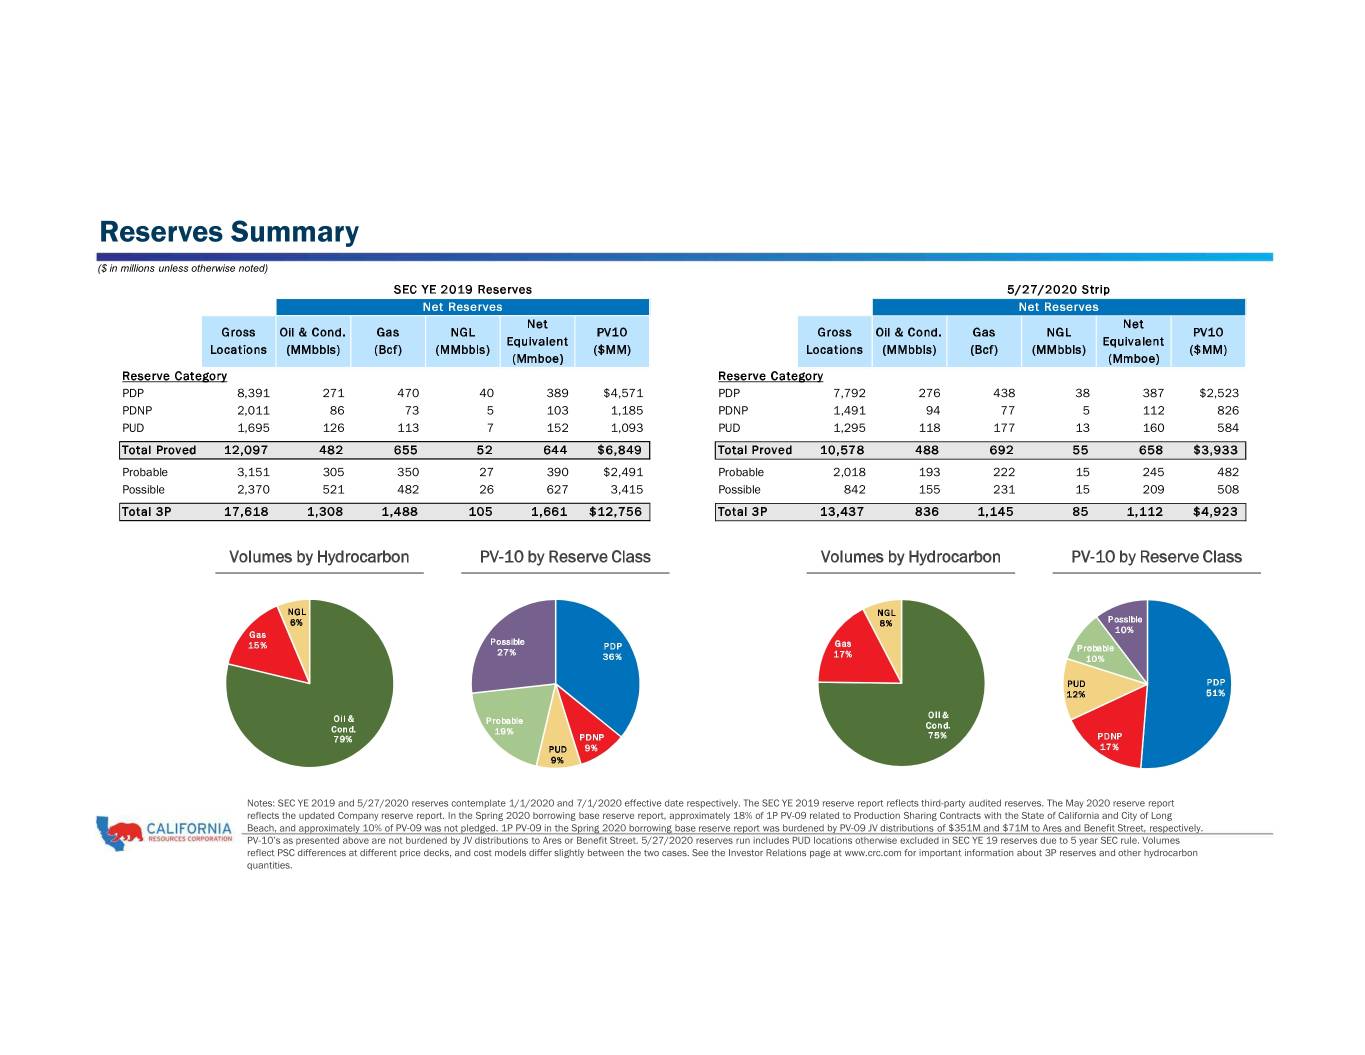
Reserves Summary ($ in millions unless otherwise noted) SEC YE 2019 Reserves 5/27/2020 Strip Net Reserves Net Reserves Net Net Gross Oil & Cond. Gas NGL PV10 Gross Oil & Cond. Gas NGL PV10 Equivalent Equivalent Locations (MMbbls) (Bcf) (MMbbls) ($MM) Locations (MMbbls) (Bcf) (MMbbls) ($MM) (Mmboe) (Mmboe) Reserve Category Reserve Category PDP 8,391 271 470 40 389 $4,571 PDP 7,792 276 438 38 387 $2,523 PDNP 2,011 86 73 5 103 1,185 PDNP 1,491 94 77 5 112 826 PUD 1,695 126 113 7 152 1,093 PUD 1,295 118 177 13 160 584 Total Proved 12,097 482 655 52 644 $6,849 Total Proved 10,578 488 692 55 658 $3,933 Probable 3,151 305 350 27 390 $2,491 Probable 2,018 193 222 15 245 482 Possible 2,370 521 482 26 627 3,415 Possible 842 155 231 15 209 508 Total 3P 17,618 1,308 1,488 105 1,661 $12,756 Total 3P 13,437 836 1,145 85 1,112 $4,923 Volumes by Hydrocarbon PV-10 by Reserve Class Volumes by Hydrocarbon PV-10 by Reserve Class NGL NGL 6% 8% Possible 10% Gas Possible 15% PDP Gas Probable 27% 17% 36% 10% PUD PDP 12% 51% Oil & Oil & Probable Cond. Cond. 19% 79% PDNP 75% PDNP PUD 9% 17% 9% Notes: SEC YE 2019 and 5/27/2020 reserves contemplate 1/1/2020 and 7/1/2020 effective date respectively. The SEC YE 2019 reserve report reflects third-party audited reserves. The May 2020 reserve report reflects the updated Company reserve report. In the Spring 2020 borrowing base reserve report, approximately 18% of 1P PV-09 related to Production Sharing Contracts with the State of California and City of Long Beach, and approximately 10% of PV-09 was not pledged. 1P PV-09 in the Spring 2020 borrowing base reserve report was burdened by PV-09 JV distributions of $351M and $71M to Ares and Benefit Street, respectively. PV-10’s as presented above are not burdened by JV distributions to Ares or Benefit Street. 5/27/2020 reserves run includes PUD locations otherwise excluded in SEC YE 19 reserves due to 5 year SEC rule. Volumes reflect PSC differences at different price decks, and cost models differ slightly between the two cases. See the Investor Relations page at www.crc.com for important information about 3P reserves and other hydrocarbon quantities.

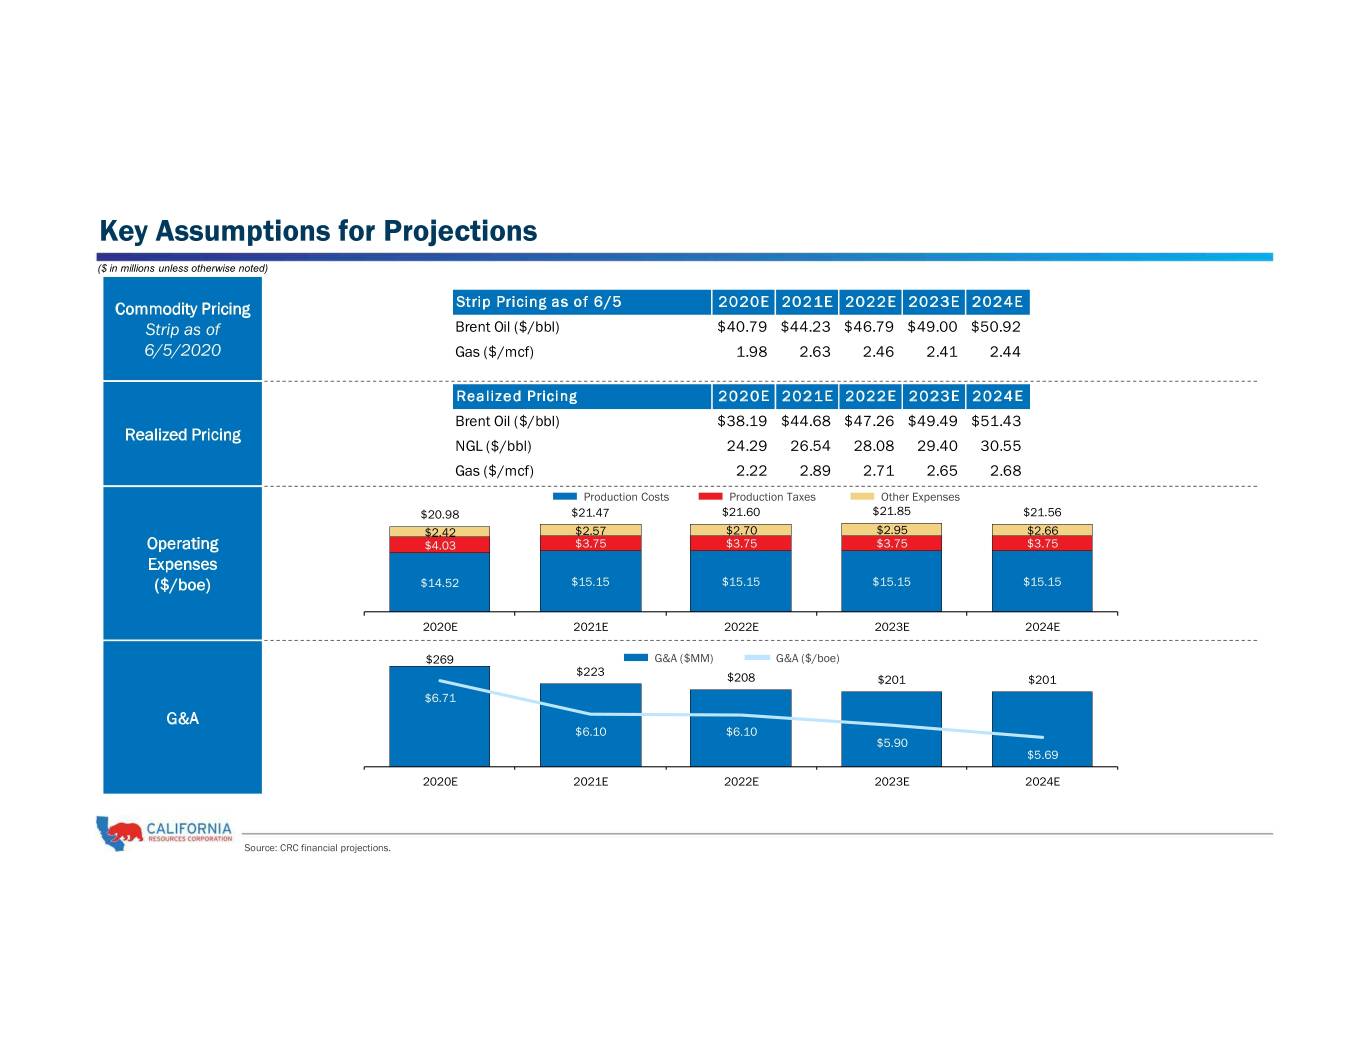
Key Assumptions for Projections ($ in millions unless otherwise noted) Commodity Pricing Strip Pricing as of 6/5 2020E 2021E 2022E 2023E 2024E Strip as of Brent Oil ($/bbl) $40.79 $44.23 $46.79 $49.00 $50.92 6/5/2020 Gas ($/mcf) 1.98 2.63 2.46 2.41 2.44 Realized Pricing 2020E 2021E 2022E 2023E 2024E Brent Oil ($/bbl) $38.19 $44.68 $47.26 $49.49 $51.43 Realized Pricing NGL ($/bbl) 24.29 26.54 28.08 29.40 30.55 Gas ($/mcf) 2.22 2.89 2.71 2.65 2.68 Production Costs Production Taxes Other Expenses $20.98 $21.47 $21.60 $21.85 $21.56 $2.42 $2.57 $2.70 $2.95 $2.66 Operating $4.03 $3.75 $3.75 $3.75 $3.75 Expenses ($/boe) $14.52 $15.15 $15.15 $15.15 $15.15 2020E 2021E 2022E 2023E 2024E $269 G&A ($MM) G&A ($/boe) $223 $208 $201 $201 $6.71 G&A $6.10 $6.10 $5.90 $5.69 2020E 2021E 2022E 2023E 2024E Source: CRC financial projections.

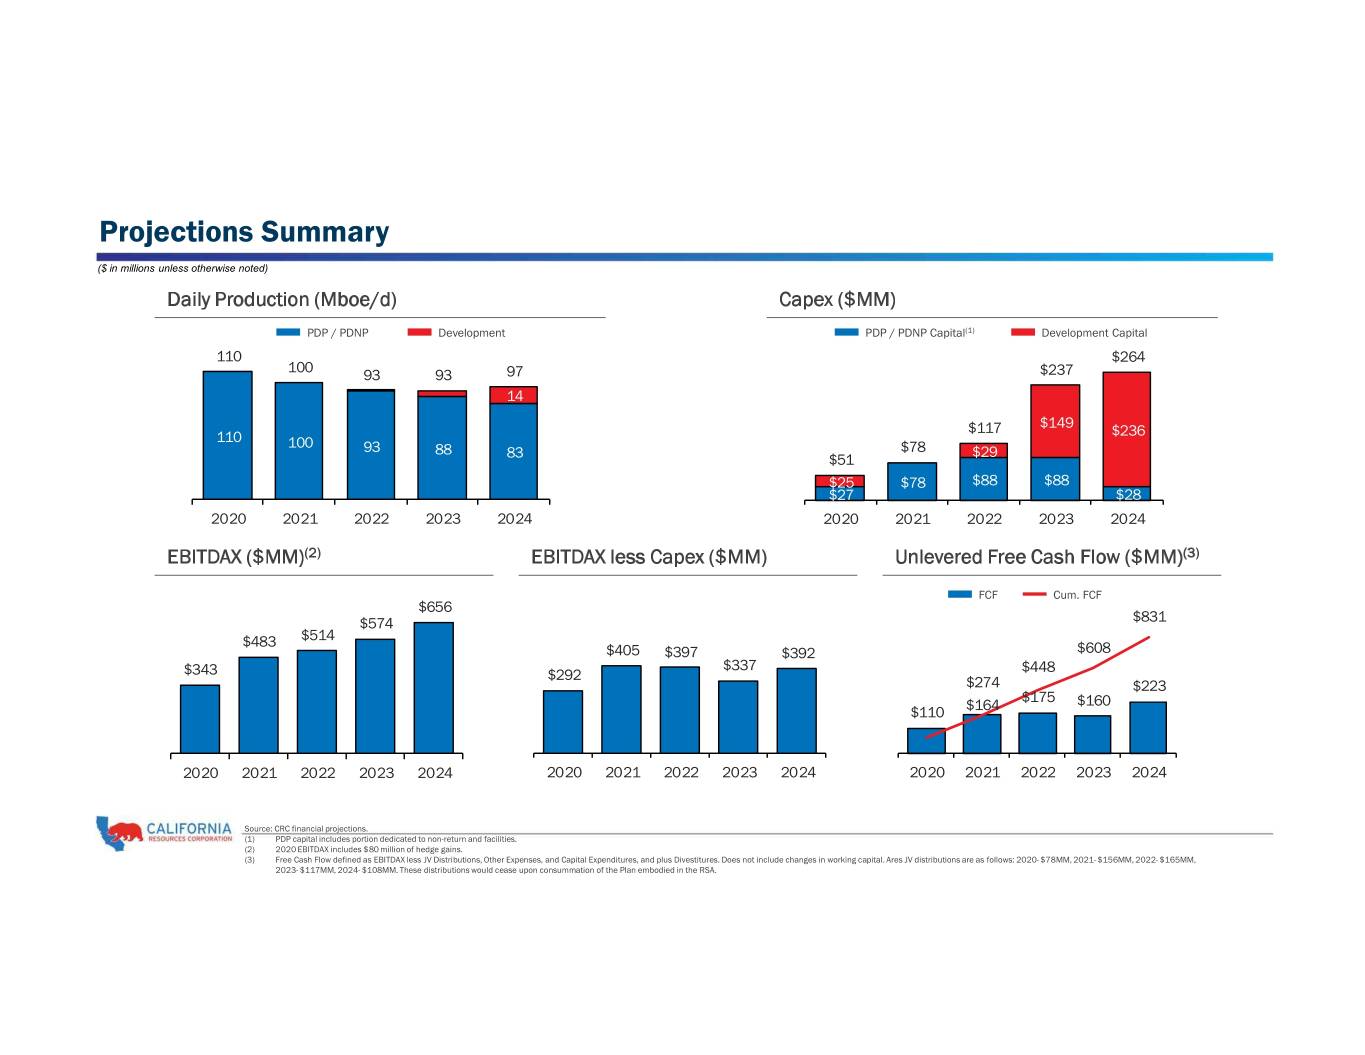
Projections Summary ($ in millions unless otherwise noted) Daily Production (Mboe/d) Capex ($MM) PDP / PDNP Development PDP / PDNP Capital(1) Development Capital 110 $264 100 93 93 97 $237 14 $149 $117 $236 110 100 93 88 $78 $29 83 $51 $25 $78 $88 $88 $27 $28 2020 2021 2022 2023 2024 2020 2021 2022 2023 2024 EBITDAX ($MM)(2) EBITDAX less Capex ($MM) Unlevered Free Cash Flow ($MM)(3) FCF Cum. FCF $656 $574 $831 $483 $514 $405 $397 $392 $608 $337 $448 $343 $292 $274 $223 $175 $160 $110 $164 2020 2021 2022 2023 2024 2020 2021 2022 2023 2024 2020 2021 2022 2023 2024 Source: CRC financial projections. (1) PDP capital includes portion dedicated to non-return and facilities. (2) 2020 EBITDAX includes $80 million of hedge gains. (3) Free Cash Flow defined as EBITDAX less JV Distributions, Other Expenses, and Capital Expenditures, and plus Divestitures. Does not include changes in working capital. Ares JV distributions are as follows: 2020- $78MM, 2021- $156MM, 2022- $165MM, 2023- $117MM, 2024- $108MM. These distributions would cease upon consummation of the Plan embodied in the RSA.
