Attached files
| file | filename |
|---|---|
| 8-K - 8-K - Grayscale Bitcoin Trust (BTC) | d861359d8k.htm |
Exhibit 99.1
Exhibit 99.1 Digital Asset Investment Report Q2 2020 grayscale.co
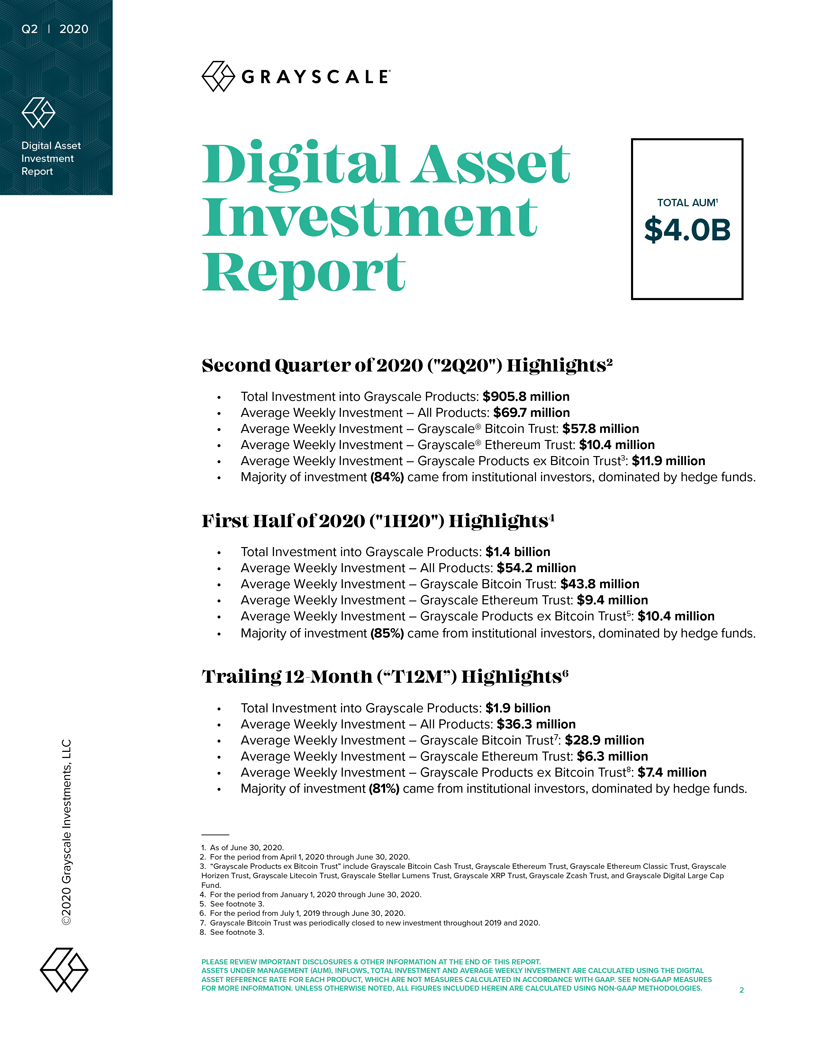
Q2 | 2020 Digital Asset Investment Report Digital Asset Investment TOTAL AUM1 $4.0B Report Second Quarter of 2020 (“2Q20”) Highlights2 • Total Investment into Grayscale Products: $905.8 million • Average Weekly Investment – All Products: $69.7 million • Average Weekly Investment – Grayscale® Bitcoin Trust: $57.8 million • Average Weekly Investment – Grayscale® Ethereum Trust: $10.4 million • Average Weekly Investment – Grayscale Products ex Bitcoin Trust3: $11.9 million • Majority of investment (84%) came from institutional investors, dominated by hedge funds. First Half of 2020 (“1H20”) Highlights4 • Total Investment into Grayscale Products: $1.4 billion • Average Weekly Investment – All Products: $54.2 million • Average Weekly Investment – Grayscale Bitcoin Trust: $43.8 million • Average Weekly Investment – Grayscale Ethereum Trust: $9.4 million • Average Weekly Investment – Grayscale Products ex Bitcoin Trust5: $10.4 million • Majority of investment (85%) came from institutional investors, dominated by hedge funds. Trailing 12-Month (“T12M”) Highlights6 • Total Investment into Grayscale Products: $1.9 billion • Average Weekly Investment – All Products: $36.3 million • Average Weekly Investment – Grayscale Bitcoin Trust7: $28.9 million LLC • Average Weekly Investment – Grayscale Ethereum Trust: $6.3 million • Average Weekly Investment – Grayscale Products ex Bitcoin Trust8: $7.4 million Investments, • Majority of investment (81%) came from institutional investors, dominated by hedge funds. 1. As of June 30, 2020. 2. For the period from April 1, 2020 through June 30, 2020. 3. “Grayscale Products ex Bitcoin Trust” include Grayscale Bitcoin Cash Trust, Grayscale Ethereum Trust, Grayscale Ethereum Classic Trust, Grayscale Grayscale Horizen Trust, Grayscale Litecoin Trust, Grayscale Stellar Lumens Trust, Grayscale XRP Trust, Grayscale Zcash Trust, and Grayscale Digital Large Cap Fund. 4. For the period from January 1, 2020 through June 30, 2020. 5. See footnote 3. 6. For the period from July 1, 2019 through June 30, 2020. ©2020 8. 7. Grayscale See footnote Bitcoin 3. Trust was periodically closed to new investment throughout 2019 and 2020. PLEASE REVIEW IMPORTANT DISCLOSURES & OTHER INFORMATION AT THE END OF THIS REPORT. ASSETS UNDER MANAGEMENT (AUM), INFLOWS, TOTAL INVESTMENT AND AVERAGE WEEKLY INVESTMENT ARE CALCULATED USING THE DIGITAL ASSET REFERENCE RATE FOR EACH PRODUCT, WHICH ARE NOT MEASURES CALCULATED IN ACCORDANCE WITH GAAP. SEE NON-GAAP MEASURES FOR MORE INFORMATION. UNLESS OTHERWISE NOTED, ALL FIGURES INCLUDED HEREIN ARE CALCULATED USING NON-GAAP METHODOLOGIES. 2
Q2 | 2020 The Takeaway Billion Dollar 1H20 and Largest Quarterly Raise: Grayscale recorded its largest Digital Asset quarterly inflows, $905.8 million in 2Q20, nearly double the previous quarterly Investment high of $503.7 million in 1Q20. For the first time, inflows into Grayscale products Report over a 6-month period crossed the $1 billion threshold, demonstrating sustained demand for digital asset exposure despite a backdrop characterized by economic uncertainty. Cumulative investment across the Grayscale family of products since inception has reached $2.6 billion.9 Grayscale Bitcoin Trust and Grayscale Ethereum Trust both experienced record quarterly inflows of $751.1 million and $135.2 million, respectively. Grayscale Bitcoin Trust Inflows Exceeded Magnitude of Newly-Mined Bitcoin: After Bitcoin’s halving in May, 2Q20 inflows into Grayscale Bitcoin Trust surpassed the number of newly-mined Bitcoin over the same period. With so much inflow to Grayscale Bitcoin Trust relative to newly-mined Bitcoin, there is a significant reduction in supply-side pressure, which may be a positive sign for Bitcoin price appreciation. However, these comparisons are simply to illustrate supply and demand in the market. They do not provide insight into the destination of any mined Bitcoin during the measured period. New Investor Interest and Multi-Product Institutional Investors: In 2Q20, new investors accounted for $124.1 million of inflows and 57% of the investor base, up from 49% during the T12M. Additionally, 81% of returning institutional investors in 2Q20 have now allocated to multiple products, an increase from T12M of 71%. Alternatives Continue to Gain Momentum: In 2Q20, demand for Grayscale Ethereum Trust accounted for almost 15% of total inflows into Grayscale products, the highest percentage to date. Grayscale® Ethereum Classic Trust and Grayscale® Digital Large Cap Fund combined have exceeded $50 million of inflows during the last 12 months. Grayscale® Litecoin Trust saw its largest inflows to date and Grayscale® Bitcoin Cash Trust saw its largest inflows since 2Q18. Quarterly Perspective LLC While long volatility was the winning trade in 1Q20, volatility was subdued in 2Q20 as risk assets steadily recovered. In 2Q20, digital assets outperformed most indices, and Zcash, Ethereum, and Stellar led the way returning 72%, 62%, and 62%, respectively. Despite unprecedented monetary intervention, gold has Investments, remained relatively muted in 2Q20 with 10% returns relative to Bitcoin (35%) and Grayscale the S&P 500 (19%). ©2020 9. Inception date: September 25, 2013. PLEASE REVIEW IMPORTANT DISCLOSURES & OTHER INFORMATION AT THE END OF THIS REPORT. 3
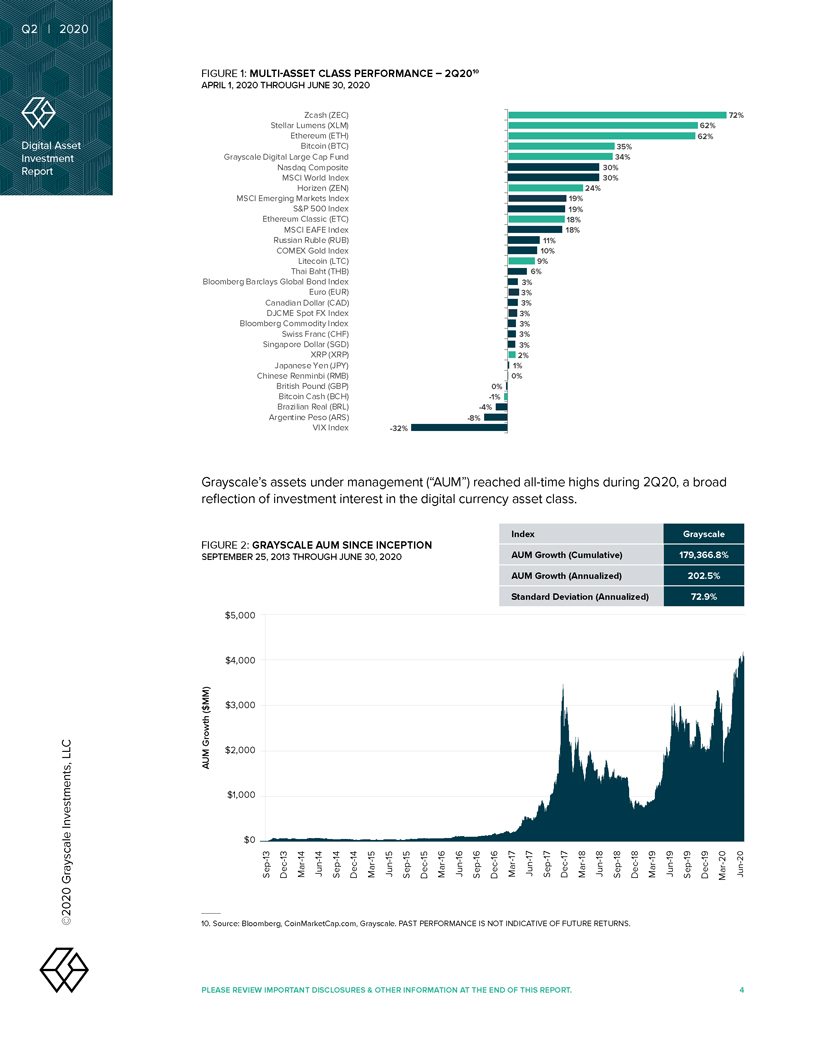
Q2 | 2020 FIGURE 1: MULTI-ASSET CLASS PERFORMANCE – 2Q2010 APRIL 1, 2020 THROUGH JUNE 30, 2020 Zcash (ZEC) 72% Stellar Lumens (XLM) 62% Ethereum (ETH) 62% Digital Asset Bitcoin (BTC) 35% Investment Grayscale Digital Large Cap Fund 34% Report Nasdaq Composite 30% MSCI World Index 30% Horizen (ZEN) 24% MSCI Emerging Markets Index 19% S&P 500 Index 19% Ethereum Classic (ETC) 18% MSCI EAFE Index 18% Russian Ruble (RUB) 11% COMEX Gold Index 10% Litecoin (LTC) 9% Thai Baht (THB) 6% Bloomberg Barclays Global Bond Index 3% Euro (EUR) 3% Canadian Dollar (CAD) 3% DJCME Spot FX Index 3% Bloomberg Commodity Index 3% Swiss Franc (CHF) 3% Singapore Dollar (SGD) 3% XRP (XRP) 2% Japanese Yen (JPY) 1% Chinese Renminbi (RMB) 0% British Pound (GBP) 0% Bitcoin Cash (BCH) -1% Brazilian Real (BRL) -4% Argentine Peso (ARS) -8% VIX Index -32% Grayscale’s assets under management (“AUM”) reached all-time highs during 2Q20, a broad reflection of investment interest in the digital currency asset class. FIGURE 2: GRAYSCALE AUM SINCE INCEPTION Index Grayscale SEPTEMBER 25, 2013 THROUGH JUNE 30, 2020 AUM Growth (Cumulative) 179,366.8% AUM Growth (Annualized) 202.5% Standard Deviation (Annualized) 72.9% $5,000 $4,000 $ MM) $3,000 ( Growth LLC $2,000 AUM Investments, $1,000 $0 13—13 — 14—14 14 — 14 15 15 15 15 16 16 16 16 17—17—17 — 17 18—18 — 18 18—19 19 19 19 20 20 — — — — — — Sep Dec Mar Jun Sep Dec Mar Jun Sep Dec Mar Jun Sep Dec Mar Jun Sep Dec Mar Jun Sep Dec Mar Jun Sep Dec — Jun Grayscale Mar ©2020 10. Source: Bloomberg, CoinMarketCap.com, Grayscale. PAST PERFORMANCE IS NOT INDICATIVE OF FUTURE RETURNS. PLEASE REVIEW IMPORTANT DISCLOSURES & OTHER INFORMATION AT THE END OF THIS REPORT. 4
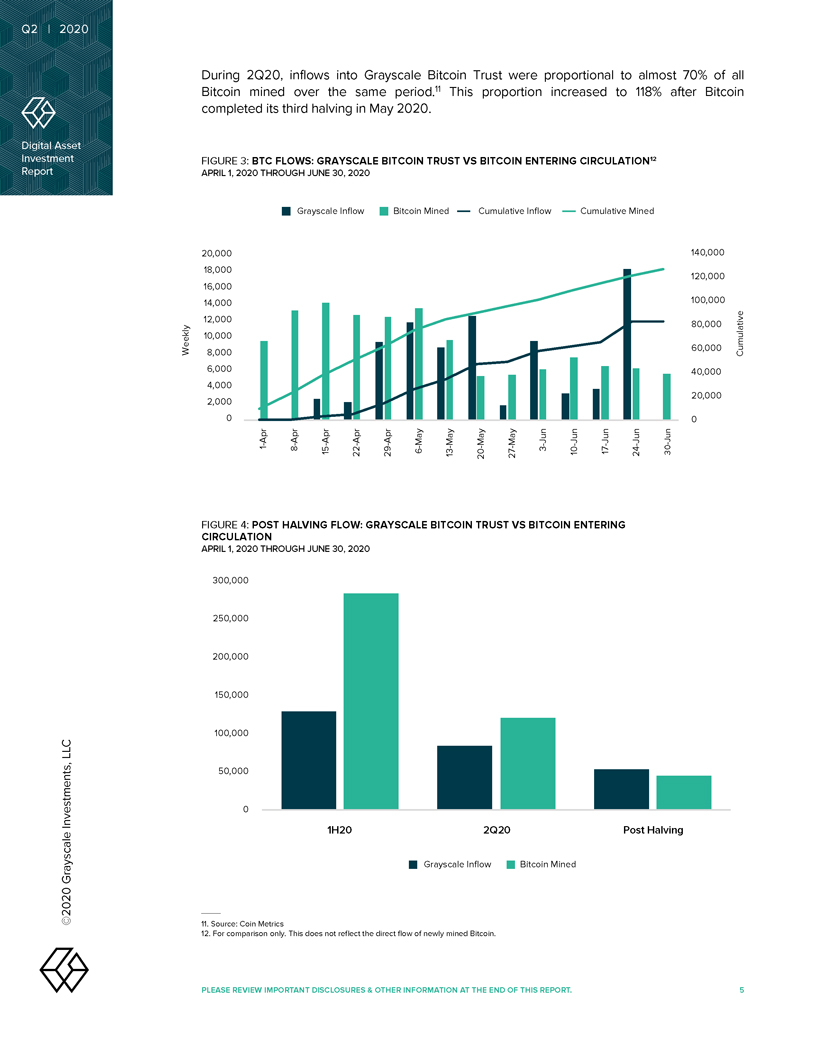
Q2 | 2020 During 2Q20, inflows into Grayscale Bitcoin Trust were proportional to almost 70% of all Bitcoin mined over the same period.11 This proportion increased to 118% after Bitcoin completed its third halving in May 2020. Digital Asset Investment FIGURE 3: BTC FLOWS: GRAYSCALE BITCOIN TRUST VS BITCOIN ENTERING CIRCULATION12 Report APRIL 1, 2020 THROUGH JUNE 30, 2020 Grayscale Inflow Bitcoin Mined Cumulative Inflow Cumulative Mined 20,000 140,000 18,000 16,000 120,000 14,000 100,000 12,000 80,000 10,000 Weekly 8,000 60,000 Cumulative 6,000 40,000 4,000 20,000 2,000 0 0 Apr Apr Apr Apr Apr May May May May Jun Jun Jun Jun Jun -1—8 — — — — 3 — — 15 22 29 6 13 20 27 10 17 24 30 FIGURE CIRCULATION 4: POST HALVING FLOW: GRAYSCALE BITCOIN TRUST VS BITCOIN ENTERING APRIL 1, 2020 THROUGH JUNE 30, 2020 300,000 250,000 200,000 150,000 100,000 LLC 50,000 Investments, 0 1H20 2Q20 Post Halving Grayscale Grayscale Inflow Bitcoin Mined ©2020 11. Source: Coin Metrics 12. For comparison only. This does not reflect the direct flow of newly mined Bitcoin. PLEASE REVIEW IMPORTANT DISCLOSURES & OTHER INFORMATION AT THE END OF THIS REPORT. 5
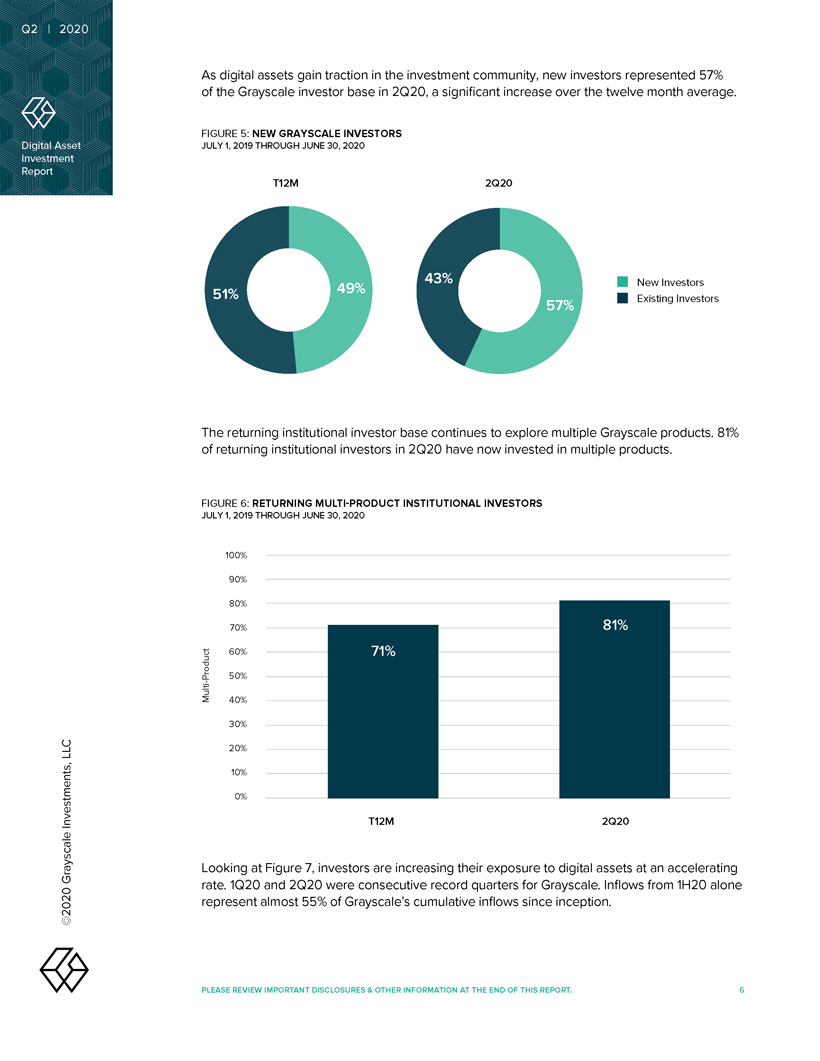
Q2 | 2020 As digital assets gain traction in the investment community, new investors represented 57% of the Grayscale investor base in 2Q20, a significant increase over the twelve month average. FIGURE 5: NEW GRAYSCALE INVESTORS Digital Asset JULY 1, 2019 THROUGH JUNE 30, 2020 Investment Report T12M 2Q20 43% New Investors 51% 49% 57% Existing Investors The returning institutional investor base continues to explore multiple Grayscale products. 81% of returning institutional investors in 2Q20 have now invested in multiple products. FIGURE 6: RETURNING MULTI-PRODUCT INSTITUTIONAL INVESTORS JULY 1, 2019 THROUGH JUNE 30, 2020 100% 90% 80% 70% 81% 60% 71% Product 50% Multi -40% 30% LLC 20% 10% 0% Investments, T12M 2Q20 Grayscale Looking at Figure 7, investors are increasing their exposure to digital assets at an accelerating rate. 1Q20 and 2Q20 were consecutive record quarters for Grayscale. Inflows from 1H20 alone ©2020 represent almost 55% of Grayscale’s cumulative inflows since inception. PLEASE REVIEW IMPORTANT DISCLOSURES & OTHER INFORMATION AT THE END OF THIS REPORT. 6
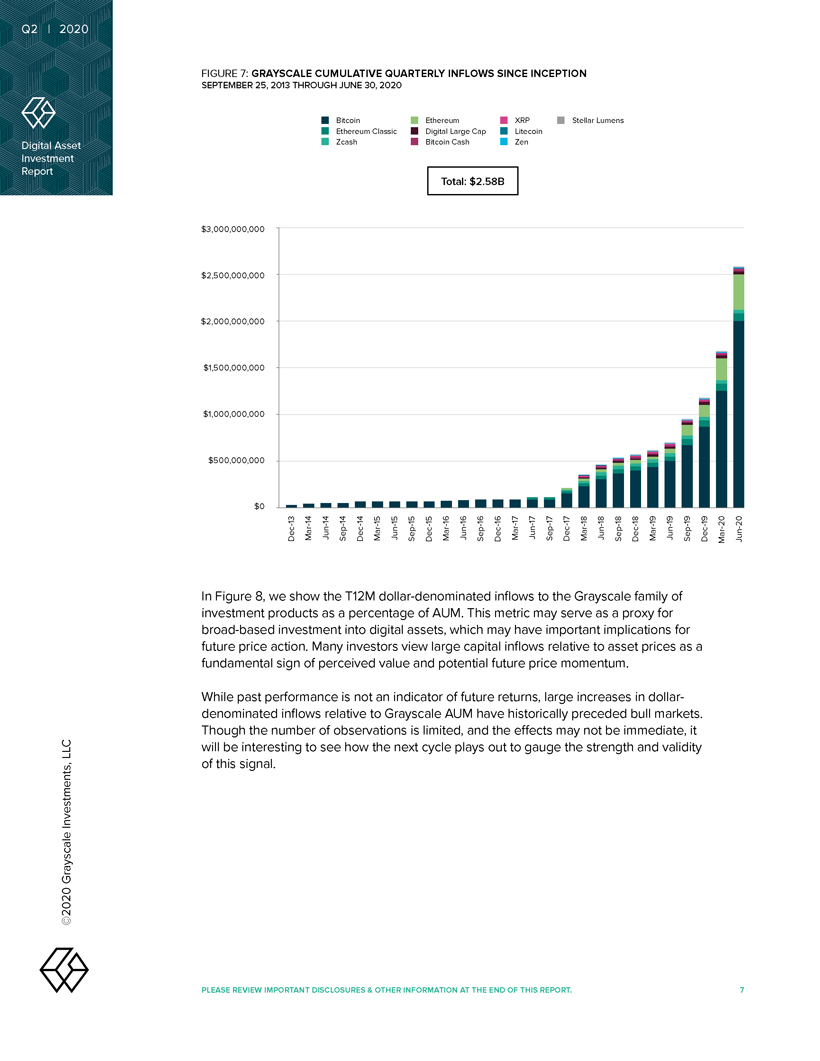
Q2 | 2020 FIGURE 7: GRAYSCALE CUMULATIVE QUARTERLY INFLOWS SINCE INCEPTION SEPTEMBER 25, 2013 THROUGH JUNE 30, 2020 Bitcoin Ethereum XRP Stellar Lumens Ethereum Classic Digital Large Cap Litecoin Digital Asset Zcash Bitcoin Cash Zen Investment Report Total: $2.58B $3,000,000,000 $2,500,000,000 $2,000,000,000 $1,500,000,000 $1,000,000,000 $500,000,000 $0 13 14 1414 14 15 15 15 15 16 16 16 16 17 17 17 17 18 18 18 18 19 19 1919—Dec Mar — Jun Sep—Dec — Mar—Jun Sep — Dec Mar—Jun—Sep — Dec Mar—Jun—Sep — Dec Mar—Jun—Sep—Dec — Mar—Jun Sep — Dec 20—20—Mar Jun In Figure 8, we show the T12M dollar-denominated inflows to the Grayscale family of investment products as a percentage of AUM. This metric may serve as a proxy for broad-based investment into digital assets, which may have important implications for future price action. Many investors view large capital inflows relative to asset prices as a fundamental sign of perceived value and potential future price momentum. While past performance is not an indicator of future returns, large increases in dollar- denominated inflows relative to Grayscale AUM have historically preceded bull markets. Though the number of observations is limited, and the effects may not be immediate, it LLC will be interesting to see how the next cycle plays out to gauge the strength and validity Investments, of this signal. Grayscale ©2020 PLEASE REVIEW IMPORTANT DISCLOSURES & OTHER INFORMATION AT THE END OF THIS REPORT. 7
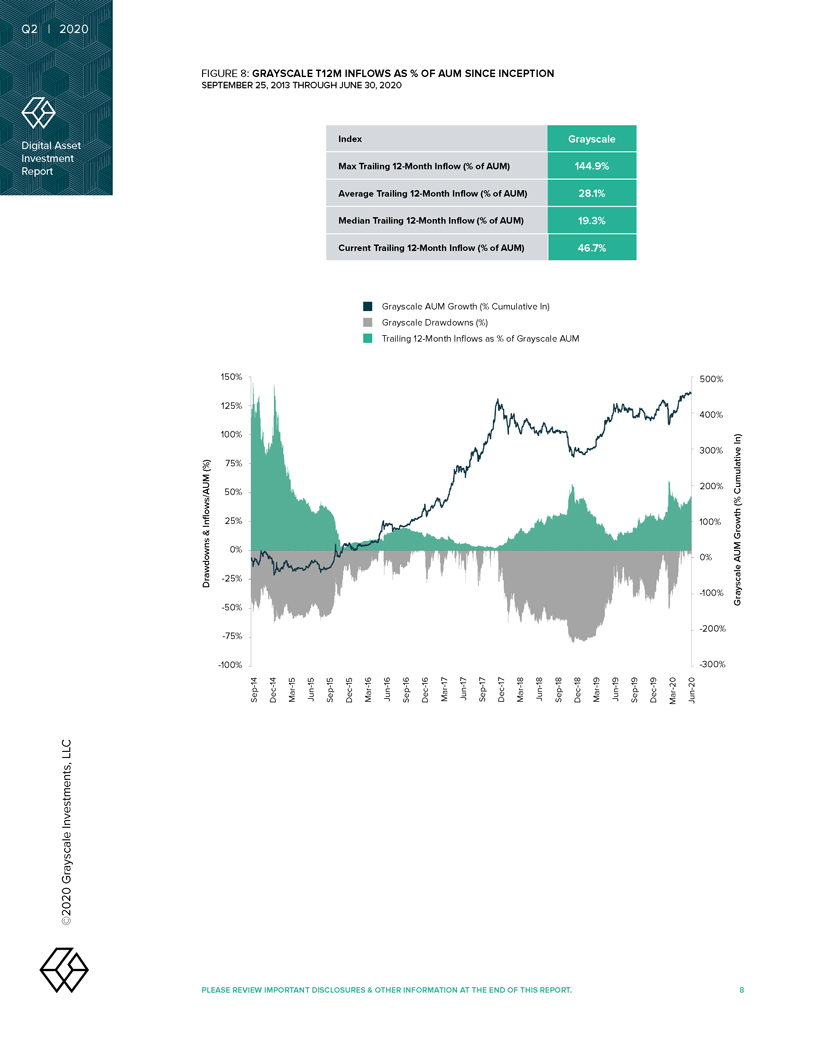
Q2 | 2020 FIGURE 8: GRAYSCALE T12M INFLOWS AS % OF AUM SINCE INCEPTION SEPTEMBER 25, 2013 THROUGH JUNE 30, 2020 Index Grayscale Digital Asset Investment Report Max Trailing 12-Month Inflow (% of AUM) 144.9% Average Trailing 12-Month Inflow (% of AUM) 28.1% Median Trailing 12-Month Inflow (% of AUM) 19.3% Current Trailing 12-Month Inflow (% of AUM) 46.7% Grayscale AUM Growth (% Cumulative ln) Grayscale Drawdowns (%) Trailing 12-Month Inflows as % of Grayscale AUM 150% 500% 125% 400% 100% ln) 300% (%) 75% 200% Cumulative 50% (% Inflows/AUM 25% 100% & Growth 0% 0% AUM Drawdowns -25% -100% Grayscale -50% -200% -75% -100% -300% 14 14 15 15 15 15 16 16 16 16 17 17 17 17 18 18 18 18 19 19 19 19—Sep—Dec—Mar Jun—Sep—Dec — Mar Jun — Sep Dec — Mar—Jun Sep—Dec—Mar—Jun—Sep—Dec — Mar Jun—Sep—Dec—20—20 -Mar Jun LLC Investments, Grayscale ©2020 PLEASE REVIEW IMPORTANT DISCLOSURES & OTHER INFORMATION AT THE END OF THIS REPORT. 8
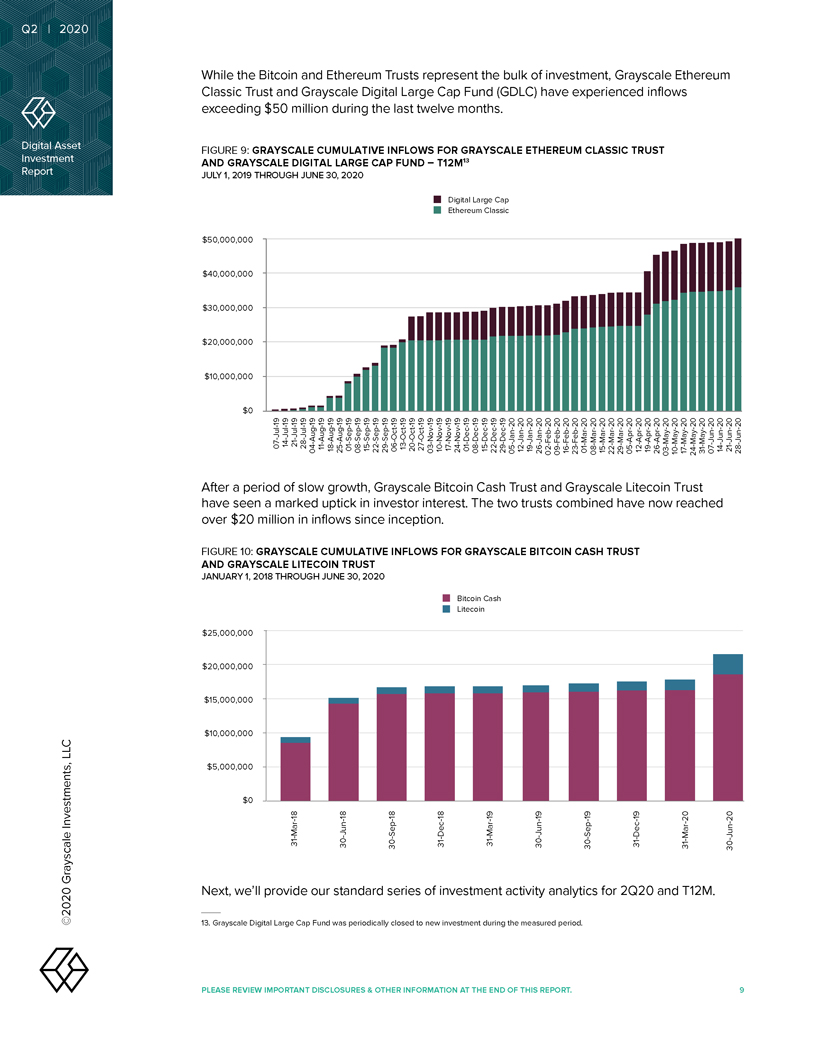
Q2 | 2020 While the Bitcoin and Ethereum Trusts represent the bulk of investment, Grayscale Ethereum Classic Trust and Grayscale Digital Large Cap Fund (GDLC) have experienced inflows exceeding $50 million during the last twelve months. Digital Asset FIGURE 9: GRAYSCALE CUMULATIVE INFLOWS FOR GRAYSCALE ETHEREUM CLASSIC TRUST Investment AND GRAYSCALE DIGITAL LARGE CAP FUND – T12M13 Report JULY 1, 2019 THROUGH JUNE 30, 2020 Digital Large Cap Ethereum Classic $50,000,000 $40,000,000 $30,000,000 $20,000,000 $10,000,000 $0—1919 — 19- 1919 — 19- 19- 1919 -19 — 19- 1919 -19 -19 — 19- 1919 — 19- 19- 1919 -19 — 19- 1919 -2020202020202020202020202020202020202020202020202020 JulJulJulJul ————————————-——-AugAugAugAugSepSepSepSepSep- Oct- OctOct -Oct -NovNovNovNovDecDecDecDecDecJanJanJanJanFebFebFebFebMarMarMarMarMarAprAprAprApr JunJunJunJun ——————————-——-MayMayMayMayMay—-————— 07142128 1118 01 15 06132027 1017 01 15 1219 01 15 1219 ——- 1421 04 25 08 2229 03 24 08 222905 2602091623 08 222905 26031017243107 28 After a period of slow growth, Grayscale Bitcoin Cash Trust and Grayscale Litecoin Trust have seen a marked uptick in investor interest. The two trusts combined have now reached over $20 million in inflows since inception. FIGURE 10: GRAYSCALE CUMULATIVE INFLOWS FOR GRAYSCALE BITCOIN CASH TRUST AND GRAYSCALE LITECOIN TRUST JANUARY 1, 2018 THROUGH JUNE 30, 2020 Bitcoin Cash Litecoin $25,000,000 $20,000,000 $15,000,000 $10,000,000 LLC $5,000,000 $0 18 18 18 18 19 19 19 19 20 20 Investments, — — — — — Mar Jun Sep Dec Mar Jun Sep Dec Jun — ——Mar — — 31 30 30 31 31 30 30 31—31 Grayscale 30 Next, we’ll provide our standard series of investment activity analytics for 2Q20 and T12M. ©2020 13. Grayscale Digital Large Cap Fund was periodically closed to new investment during the measured period. PLEASE REVIEW IMPORTANT DISCLOSURES & OTHER INFORMATION AT THE END OF THIS REPORT. 9
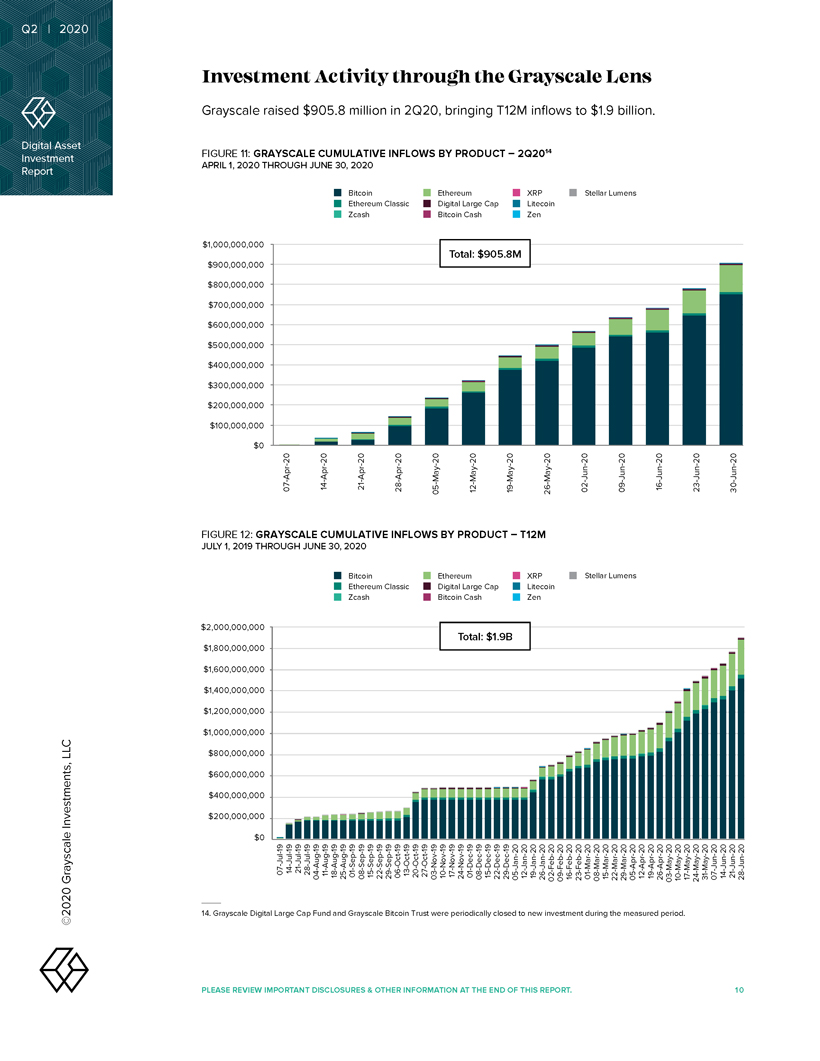
Q2 Digital Report ©2020 Grayscale Investments, LLC Investment Asset 2020 $ $ 14. $ $ $ $ $ $ $ $ $ $ $ $ $ $ JULY $ $ $ $ APRIL PLEASE 1, 1, FIGURE FIGURE Grayscale 201912:11: $ REVIEW $2020Grayscale Digital 0 200,000,000 400,000,000 600,000,000 800,000,000 1,000,000,000 1,200,000,000 1,400,000,0001,600,000,000 1,800,000,000 2,000,000,000 0 100,000,000 200,000,000 300,000,000 400,000,000 500,000,000 600,000,000 700,000,000800,000,000900,000,000 1,000,000,000 07-Jul-19 Large 14-Jul-19 07-Apr-20 21-Jul-19 THROUGH raised THROUGH IMPORTANT Cap 28-Jul-19 $ Investment GRAYSCALE GRAYSCALE 04-Aug-19 JUNE 14-Apr-20 Fund 11-Aug-19 JUNE 18-Aug-19 30, 905. and 25-Aug-19 30, 8 01-Sep-19 DISCLOSURES 08-Sep-19 2020 21-Apr-20 & 15-Sep-19 Zcash Bitcoin Zcash Bitcoin 2020 Grayscale 22-Sep-19 Ethereum Ethereum CUMULATIVE CUMULATIVE million 29-Sep-19 Activity OTHER 06-Oct-19 28-Apr-20 in Bitcoin 13-Oct-19 Classic Classic 20-Oct-19 Trust 27-Oct-19 03-Nov-19 INFLOWS INFLOWS 05-May-20 2Q20, were 10-Nov-19 17-Nov-19 BY BY INFORMATION 24-Nov-19 Bitcoin Digital Bitcoin Digital AT through 01-Dec-19 Ethereum Ethereum 12-May-20 Total: 08-Dec-19 Total: Cash Large $ CashLarge THE periodically 15-Dec-19 $ Cap Capbringing END 22-Dec-19 1. 905. PRODUCT the 29-Dec-19 PRODUCT closed 9B– 19-May-20 – OF 05-Jan-20 to 12-Jan-20 8M T12M THIS 19-Jan-20 new Zen XRP Zen XRP 26-Jan-20 T12M 26-May-20 2Q20 14 REPORT. 09 02- -Feb Feb- -20 20 Litecoin Litecoin inflows investment 23 16- -Feb Feb- -20 20 01-Mar-20 02-Jun-20 to 08-Mar-20 $ Grayscale during 15-Mar-20 Stellar Stellar 1. 22-Mar-20 9 the 29-Mar-20 09-Jun-20 05 12- -Apr Apr- -20 20 Lumens Lumens Lens measured 19-Apr-20 billion. 26-Apr-20 16-Jun-20 period. 03 10- -May May- -20 20 24 17- -May May- -20 20 23-Jun-20 31 07--May Jun- -20 20 21 14- -Jun Jun- -20 20 30-Jun-20 10 28-Jun-20
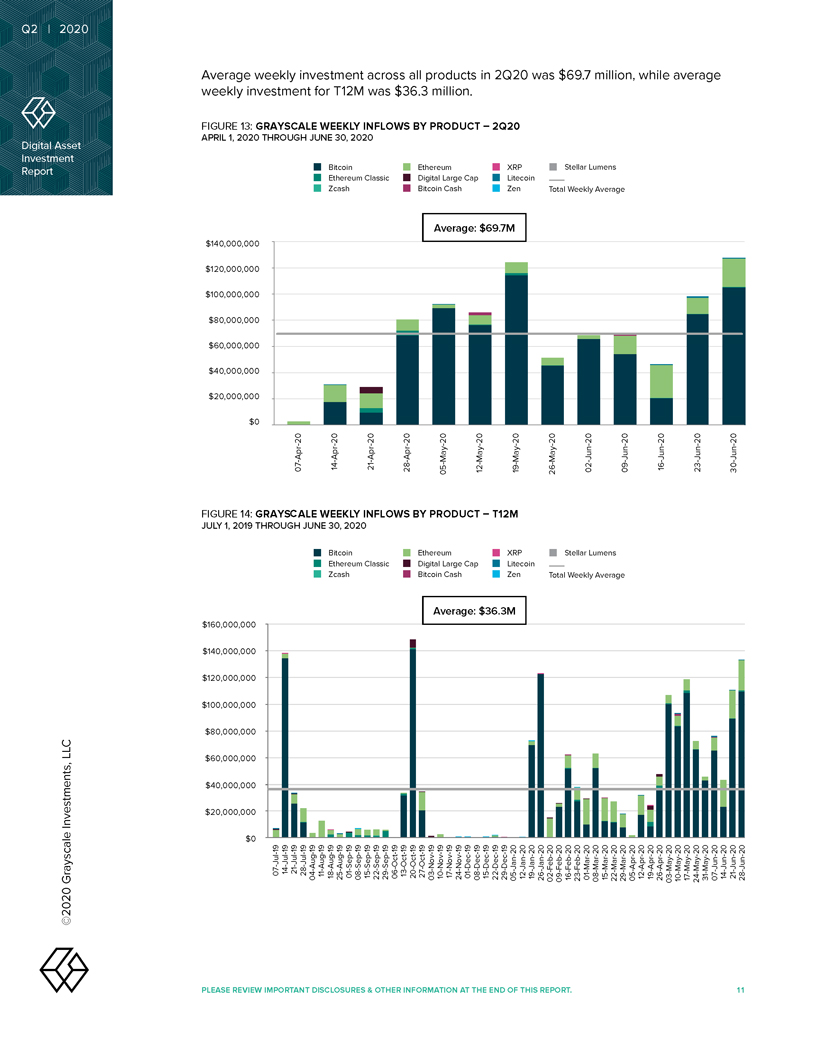
Q2Digital | Report ©2020 Grayscale Investments, LLC Investment Asset 2020$ $ $ $ $ $ $ $ $ $ $JULY $ $ $ $ APRILPLEASE 1, 1,FIGURE FIGURE weekly $ 201914: 13: Average0 20,000,000 40,000,000 60,000,000 80,000,000 100,000,000 120,000,000 140,000,000 160,000,000 $ 0 20,000,000 40,000,000 60,000,000 80,000,000 100,000,000 120,000,000 140,000,000 2020REVIEW 07 14- -Jul Jul- -19 19 GRAYS21-Jul-19C weeklyTHROUGH 07-Apr-20 28-Jul-19 THROUGHIMPORTANT investment04-Aug-19 ALE GRAYSCALE 11-Aug-19 JUNE 18-Aug-19 JUNE for25-Aug-19 30, 14-Apr-20 Zcash Zcash 30,01-Sep-19 Bitcoin WEEKLY Bitcoin WEEKLY08-Sep-19 Ethereum Ethereum T12MinvestmentDISCLOSURES 2020 & 15-Sep-19 21-Apr-20 2020 22-Sep-1929-Sep-19 Classic Classic was OTHER 06-Oct-19 $ 13-Oct-19 acrossINFLOWS 28-Apr-20 INFLOWS 20-Oct-19 3627-Oct-19 .allBY BY 3 03-Nov-19 Bitcoin Digital Bitcoin Digital 10-Nov-19 Ethereum 05-May-20 EthereumINFORMATION 17-Nov-19 24-Nov-19 Cash Large Cash LargeAT 01-Dec-19 million Average: .08-Dec-19 Cap PRODUCT Average: Cap PRODUCT products$ 12-May-20 THE 15-Dec-19 $ –– in22-Dec-19 36 69 END 29-Dec-19 . .OF 05-Jan-20 3M T12M 7M Zen XRP 19-May-20 Zen XRP 2Q2012-Jan-20 2Q20 THIS 19-Jan-20 Litecoin Litecoin 26-Jan-2002-Feb-20 26-May-20 was09-Feb-20 Total Total$ REPORT 16-Feb-20 . 23-Feb-20 69 Stellar Stellar .01-Mar-20 Weekly 02-Jun-20 Weekly 708-Mar-20 22 15- -Mar Mar- -20 20 Average Lumens Average Lumens 29 05--Mar Apr- -20 20 09-Jun-20 million,12-Apr-20 26 19- -Apr Apr- -20 2016-Jun-20 while03 10- -May May- -20 20 24 17- -May May- -20 2023-Jun-2031 07--May Jun- -20 20 average14-Jun-20 21-Jun-20 30-Jun-2011 28-Jun-20
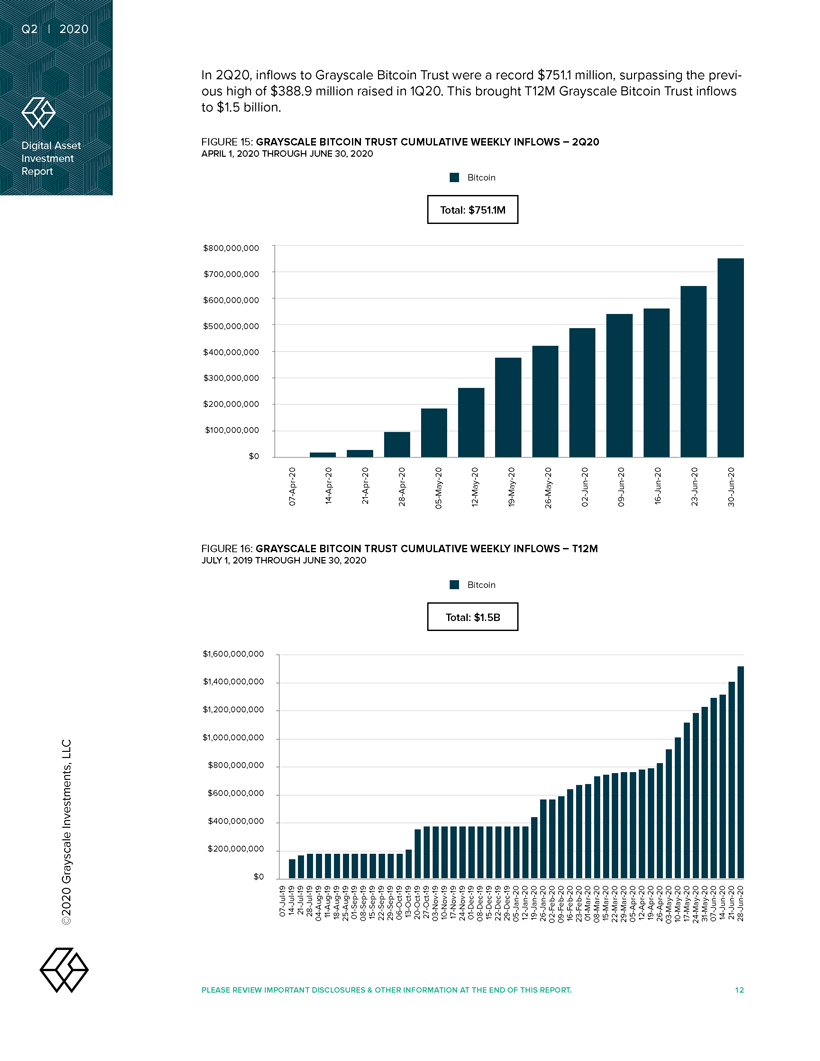
Q2 Digital Report ©2020 Grayscale Investments, LLC Investment Asset 2020 $ $ $ $ $ $ $ $ $ $ $ $ $ $ In $ $ to JULY ous $ APRIL PLEASE 1, 1. FIGURE1,FIGURE 201916:15: 5 high2Q20, $ $ 0 100,000,000 200,000,000 300,000,000 400,000,000 500,000,000 600,000,000 700,000,000 800,000,000 2020 REVIEW 0 200,000,000 400,000,000 600,000,000 800,000,000 1,000,000,000 1,200,000,000 1,400,000,000 1,600,000,000 of billion.$ 07 14- -Jul Jul- -19 19 07-Apr-20 inflows 21-Jul-19THROUGH THROUGH 388. IMPORTANT 28-Jul-19 9to GRAYSCALE GRAYSCALE 04-Aug-19 JUNE 11-Aug-19 14-Apr-20 JUNE 18-Aug-19 30, 25-Aug-19 30, 01-Sep-19 million BITCOIN BITCOIN DISCLOSURES 08-Sep-19 2020 21-Apr-20 & 2020 Grayscale 22 15- -Sep Sep- -19 19 29-Sep-19 TRUST TRUSTraised OTHER 06-Oct-19 28-Apr-20 in 13-Oct-19 Bitcoin 20 27- -Oct Oct- -19 19 03 10- -Nov Nov- -19 19 05-May-20 1Q20. Trust INFORMATION 17-Nov-19 24-Nov-19 CUMULATIVE Total: CUMULATIVE AT Total: This 01-Dec-19 08-Dec-19 $ 12-May-20 $ were THE 1. 15-Dec-19 Bitcoin 751. Bitcoin a END 22-Dec-19 5B 1M 29-Dec-19 WEEKLY WEEKLY OF 05-Jan-20 19-May-20 brought 12-Jan-20 record THIS 19-Jan-20 26-Jan-20 $ 02-Feb-20 26-May-20 T12M INFLOWS INFLOWS 09-Feb-20 751. REPORT. 16-Feb-20 1 23-Feb-20 01-Mar-20 T12M 02-Jun-20 08 15- -Mar Mar- -20 20 2Q20 Grayscalemillion, 22-Mar-20 09-Jun-20 29 05--Mar Apr- -20 20 19 12- -Apr Apr- -20 20 Bitcoin 26-Apr-20 16-Jun-20 03 10- -May May- -20 20 surpassing 17-May-20 Trust 24-May-20 23-Jun-20 the 31 07--May Jun- -20 20 21 14- -Jun Jun- -20 20 30-Jun-20 inflows 12 28-Jun-20 previ-
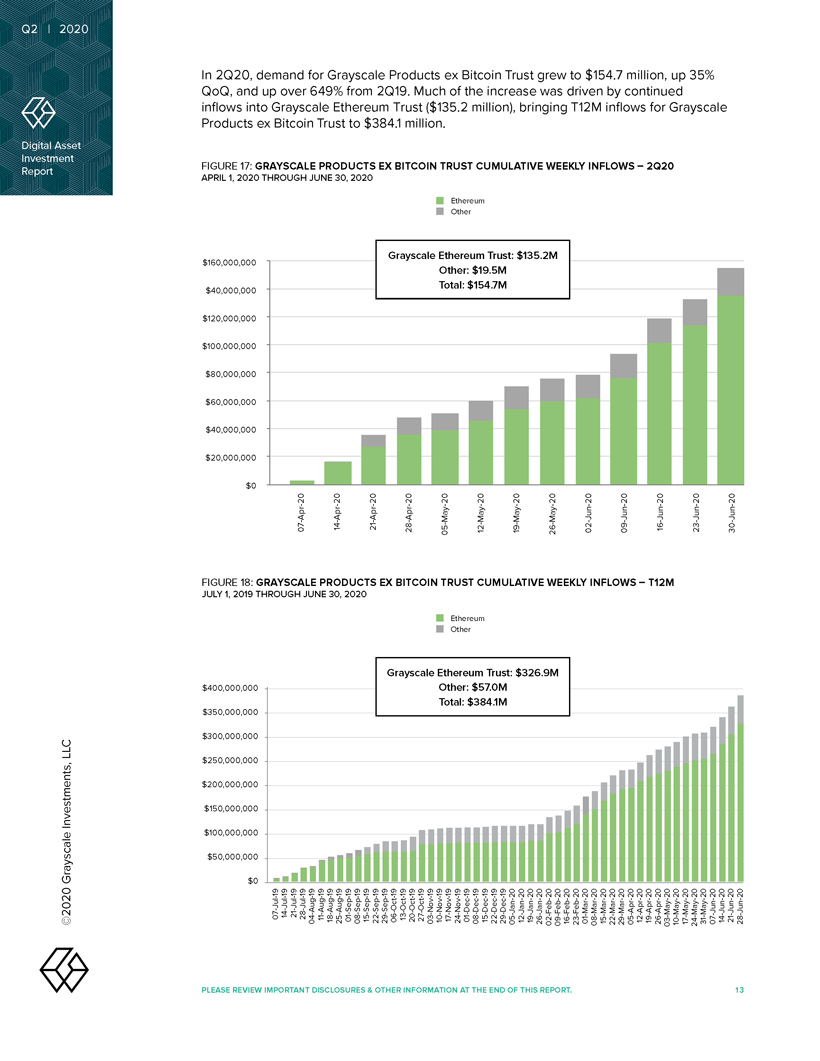
Q2 Digital | Report ©2020 Grayscale Investments, LLC Investment Asset 2020 $ $ $ $ $ $ $ $ $ $ $ $ $ $ $ $ In JULY APRIL PLEASE 1, 1,QoQ, FIGURE FIGURE inflows $ 17: 2Q20, $ 201918: Products 0 50,000,000 100,000,000 150,000,000 200,000,000 250,000,000 300,000,000 350,000,000 400,000,000 0 20,000,000 40,000,000 60,000,000 80,000,000 100,000,000 120,000,000 40,000,000 160,000,000 and 2020 REVIEW exinto 07-Jul-19 up 14-Jul-19 21-Jul-19 THROUGH 28-Jul-19 07-Apr-20 THROUGH overdemand IMPORTANT 04-Aug-19 GRAYSCALE GRAYSCALE Bitcoin 11-Aug-19 JUNE for 18-Aug-19 JUNEGrayscale 25-Aug-19 30, 14-Apr-20 649% 30 Trust 01-Sep-19, DISCLOSURES 08-Sep-19 2020 to & 15-Sep-19 2020 $ from 22-Sep-19 PRODUCTS 21-Apr-20 PRODUCTS 29-Sep-19 Grayscale EX EX Ethereum OTHER 06-Oct-19 . 384 13-Oct-19 1 2Q19 20-Oct-19 28-Apr-20 Trust. 27-Oct-19 03-Nov-19 Grayscale Grayscale BITCOIN( 10-Nov-19 BITCOIN million$ Products INFORMATION 17-Nov-19 05-May-20 . 135Muchex 24-Nov-19 Total: .of AT 01-Dec-19 Other: OtherTotal: Other: Other 2 $ TRUST $ TRUST 08-Dec-19 $ Ethereum Ethereum 12-May-20 $ Ethereum Ethereum the THE 15-Dec-19 19 384 . 57 154 . . 22-Dec-19 . Bitcoin END 29-Dec-19 1M 0M Trust: 7M 5M Trust: 05-Jan-20 million), OF 19-May-20 12-Jan-20 $ $ THIS 19-Jan-20 135 increaseTrust 26-Jan-20 326 . CUMULATIVE .CUMULATIVE 09 02- -Feb Feb- -20 20 9M 26-May-20 2M wasgrew REPORT 16-Feb-20 bringing . 23-Feb-20 to 01-Mar-20 WEEKLYWEEKLY 08-Mar-20 02-Jun-20 T12Mdriven$ 15-Mar-20 154 22-Mar-20 by. 29-Mar-20 09-Jun-20 7 05-Apr-20 INFLOWS INFLOWS 12-Apr-20– – inflows 19-Apr-20 26-Apr-20 16-Jun-20 for million, 03-May-20 T12M 2Q20 10-May-20 continuedup 17-May-20 24 31- -May May- -20 20 23-Jun-20 35% 07-Jun-20 14-Jun-20 Grayscale 21-Jun-20 30-Jun-20 13 28-Jun-20
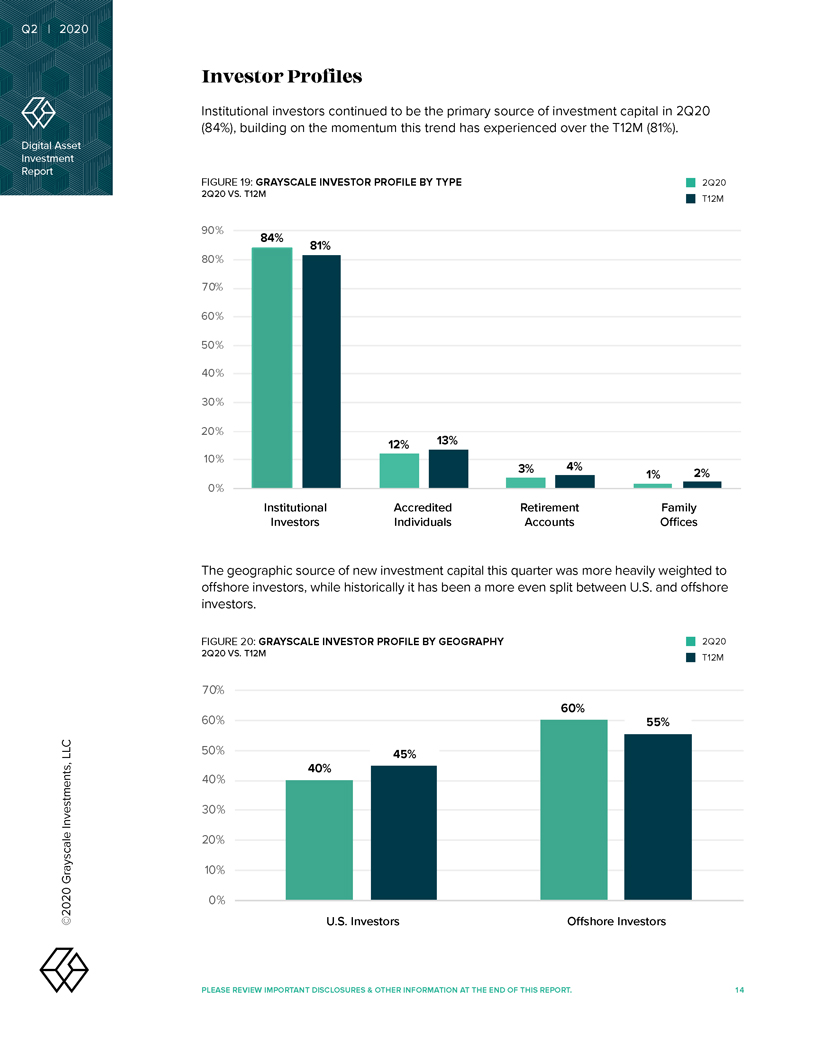
Q2 | 2020 Investor Profiles Institutional investors continued to be the primary source of investment capital in 2Q20 (84%), building on the momentum this trend has experienced over the T12M (81%). Digital Asset Investment Report FIGURE 19: GRAYSCALE INVESTOR PROFILE BY TYPE 2Q20 2Q20 VS. T12M T12M 90% 84% 81% 80% 70% 60% 50% 40% 30% 20% 12% 13% 10% 3% 4% 1% 2% 0% Institutional Accredited Retirement Family Investors Individuals Accounts Offices The geographic source of new investment capital this quarter was more heavily weighted to offshore investors, while historically it has been a more even split between U.S. and offshore investors. FIGURE 20: GRAYSCALE INVESTOR PROFILE BY GEOGRAPHY 2Q20 2Q20 VS. T12M T12M 70% 60% 60% 55% LLC 50% 45% 40% 40% Investments, 30% 20% Grayscale 10% 0% ©2020 U.S. Investors Offshore Investors PLEASE REVIEW IMPORTANT DISCLOSURES & OTHER INFORMATION AT THE END OF THIS REPORT. 14
Q2 2020 Conclusion In a quarter characterized by unprecedented global events, inflows to Grayscale products reached $905.8 million, bringing capital raised during 1H20 to $1.4 Digital Asset billion. The record inflows reflect rapidly growing demand for digital assets, as Investment investors increasingly look to diversify their portfolios amid aggressive monetary Report and fiscal intervention resulting from the COVID-19 crisis. New investors accounted for 57% of the investor base in 2Q20, up from 49% over T12M. While Grayscale Bitcoin Trust continues to generate the majority of investor demand, alternative products are gaining momentum, illustrating a trend of increasing diversification within the digital currency asset class. In 2Q20, Grayscale Ethereum Trust saw over $135 million of inflows, almost 15% of total inflows into Grayscale products. Grayscale Ethereum Classic Trust and Digital Large Cap Fund recorded over $50 million of inflows during the last 12 months. Grayscale Litecoin Trust and Grayscale Bitcoin Cash Trust have surpassed $20 million in combined inflows since inception. With inflows over the last six months alone that eclipse cumulative assets raised over the prior six years, it’s difficult to ignore the empirical data signaling a shift in sentiment towards digital assets from individual and institutional investors alike. LLC Investments, Grayscale ©2020 PLEASE REVIEW IMPORTANT DISCLOSURES & OTHER INFORMATION AT THE END OF THIS REPORT. 15
Q2 2020 About Grayscale Investments® Grayscale Investments is the world’s largest digital currency asset manager, with more Digital Asset than $4.0B in assets under management as of June 30, 2020. Through its family of 10 Investment investment products, Grayscale provides access and exposure to the digital currency Report asset class in the form of a traditional security without the challenges of buying, storing, and safekeeping digital currencies directly. With a proven track record and unrivaled experience, Grayscale’s products operate within existing regulatory frameworks, creating secure and compliant exposure for investors. For more information, please visit www.grayscale.co and follow @GrayscaleInvest. LLC Investments, Grayscale ©2020 PLEASE REVIEW IMPORTANT DISCLOSURES & OTHER INFORMATION AT THE END OF THIS REPORT. 16
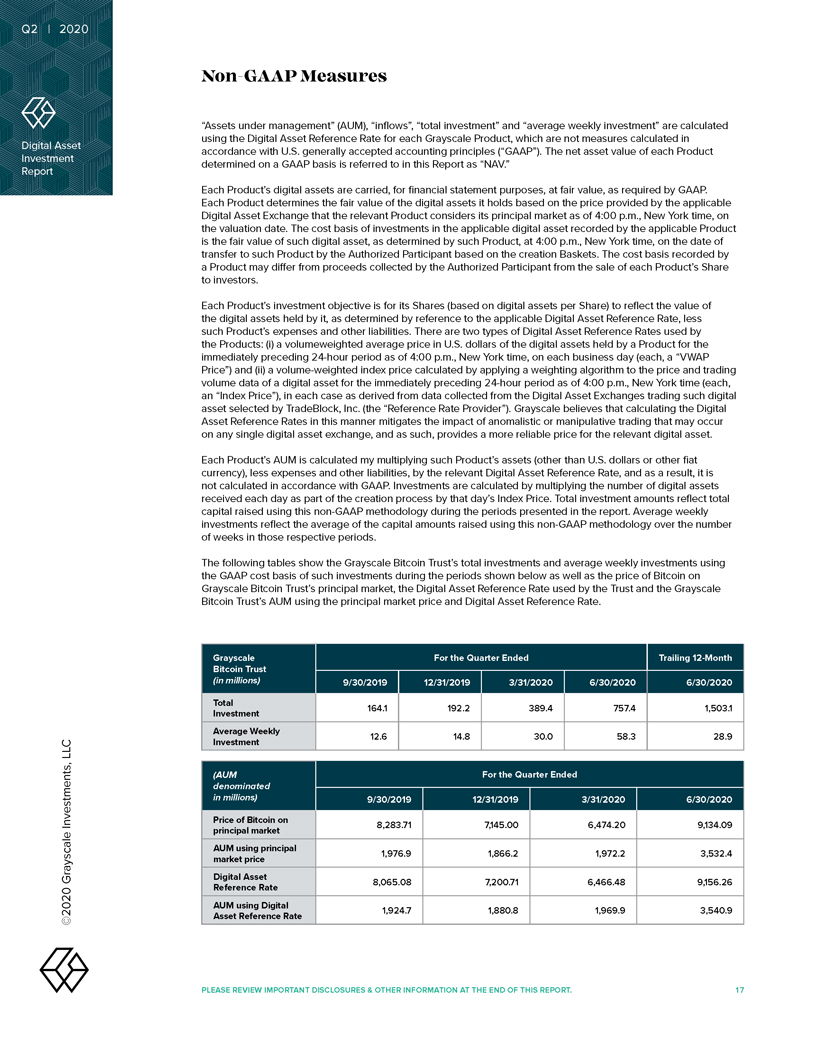
Q2 2020 Non-GAAP Measures “Assets under management” (AUM), “inflows”, “total investment” and “average weekly investment” are calculated using the Digital Asset Reference Rate for each Grayscale Product, which are not measures calculated in Digital Asset accordance with U.S. generally accepted accounting principles (“GAAP”). The net asset value of each Product Investment determined on a GAAP basis is referred to in this Report as “NAV.” Report Each Product’s digital assets are carried, for financial statement purposes, at fair value, as required by GAAP. Each Product determines the fair value of the digital assets it holds based on the price provided by the applicable Digital Asset Exchange that the relevant Product considers its principal market as of 4:00 p.m., New York time, on the valuation date. The cost basis of investments in the applicable digital asset recorded by the applicable Product is the fair value of such digital asset, as determined by such Product, at 4:00 p.m., New York time, on the date of transfer to such Product by the Authorized Participant based on the creation Baskets. The cost basis recorded by a Product may differ from proceeds collected by the Authorized Participant from the sale of each Product’s Share to investors. Each Product’s investment objective is for its Shares (based on digital assets per Share) to reflect the value of the digital assets held by it, as determined by reference to the applicable Digital Asset Reference Rate, less such Product’s expenses and other liabilities. There are two types of Digital Asset Reference Rates used by the Products: (i) a volumeweighted average price in U.S. dollars of the digital assets held by a Product for the immediately preceding 24-hour period as of 4:00 p.m., New York time, on each business day (each, a “VWAP Price”) and (ii) a volume-weighted index price calculated by applying a weighting algorithm to the price and trading volume data of a digital asset for the immediately preceding 24-hour period as of 4:00 p.m., New York time (each, an “Index Price”), in each case as derived from data collected from the Digital Asset Exchanges trading such digital asset selected by TradeBlock, Inc. (the “Reference Rate Provider”). Grayscale believes that calculating the Digital Asset Reference Rates in this manner mitigates the impact of anomalistic or manipulative trading that may occur on any single digital asset exchange, and as such, provides a more reliable price for the relevant digital asset. Each Product’s AUM is calculated my multiplying such Product’s assets (other than U.S. dollars or other fiat currency), less expenses and other liabilities, by the relevant Digital Asset Reference Rate, and as a result, it is not calculated in accordance with GAAP. Investments are calculated by multiplying the number of digital assets received each day as part of the creation process by that day’s Index Price. Total investment amounts reflect total capital raised using this non-GAAP methodology during the periods presented in the report. Average weekly investments reflect the average of the capital amounts raised using this non-GAAP methodology over the number of weeks in those respective periods. The following tables show the Grayscale Bitcoin Trust’s total investments and average weekly investments using the GAAP cost basis of such investments during the periods shown below as well as the price of Bitcoin on Grayscale Bitcoin Trust’s principal market, the Digital Asset Reference Rate used by the Trust and the Grayscale Bitcoin Trust’s AUM using the principal market price and Digital Asset Reference Rate. Grayscale For the Quarter Ended Trailing 12-Month Bitcoin Trust (in millions) 9/30/2019 12/31/2019 3/31/2020 6/30/2020 6/30/2020 Total 164.1 192.2 389.4 757.4 1,503.1 Investment Average Weekly 12.6 14.8 30.0 58.3 28.9 LLC Investment (AUM For the Quarter Ended denominated in millions) 9/30/2019 12/31/2019 3/31/2020 6/30/2020 Price of Bitcoin on Investments, 8,283.71 7,145.00 6,474.20 9,134.09 principal market AUM using principal 1,976.9 1,866.2 1,972.2 3,532.4 market price Grayscale Digital Asset 8,065.08 7,200.71 6,466.48 9,156.26 Reference Rate AUM using Digital 1,924.7 1,880.8 1,969.9 3,540.9 ©2020 Asset Reference Rate PLEASE REVIEW IMPORTANT DISCLOSURES & OTHER INFORMATION AT THE END OF THIS REPORT. 17
Q2 2020 Important Disclosures & Other Information ©Grayscale Investments, LLC. All content is original and has been researched and produced by Digital Asset Grayscale Investments, LLC (“Grayscale”) unless otherwise stated herein. No part of this content may Investment be reproduced in any form, or referred to in any other publication, without the express consent of Report Grayscale. This report is for informational purposes only and does not constitute an offer to sell or the solicitation of an offer to sell or buy any security in any jurisdiction where such an offer or solicitation would be illegal. There is not enough information contained in this report to make an investment decision and any information contained herein should not be used as a basis for this purpose. This report does not constitute a recommendation or take into account the particular investment objectives, financial situations, or needs of investors. Investors are not to construe the contents of this report as legal, tax or investment advice, and should consult their own advisors concerning an investment in digital assets. The price and value of assets referred to in this research and the income from them may fluctuate. Past performance is not indicative of the future performance of any assets referred to herein. Fluctuations in exchange rates could have adverse effects on the value or price of, or income derived from, certain investments. Investors should be aware that Grayscale is the sponsor of Grayscale Bitcoin Trust (BTC), Grayscale Bitcoin Cash Trust (BCH), Grayscale Ethereum Trust (ETH), Grayscale Ethereum Classic Trust (ETC), Grayscale Litecoin Trust (LTC), Grayscale Horizen Trust (ZEN), Grayscale Stellar Lumens Trust (XLM), Grayscale XRP Trust (XRP) and Grayscale Zcash Trust (ZEC) (each, a Trust) and the manager of Grayscale Digital Large Cap Fund LLC (the Fund). The Trusts and the Fund are collectively referred to herein as the Products. Any Product currently offering Share creations is referred to herein as an Offered Product. Information provided about an Offered Product is not intended to be, nor should it be construed or used as investment, tax or legal advice, and prospective investors should consult their own advisors concerning an investment in such Offered Product. This report does not constitute an offer to sell or the solicitation of an offer to buy interests in any of the Products. Any offer or solicitation of an investment in a Product may be made only by delivery of such Product’s confidential offering documents (the Offering Documents) to qualified accredited investors (as defined under Rule 501(a) of Regulation D of the U.S. Securities Act of 1933, as amended), which contain material information not contained herein and which supersede the information provided herein in its entirety. The Products are private investment vehicles. Shares of Grayscale Bitcoin Trust (BTC) and Grayscale Digital Large Cap Fund, which are only offered on a periodic basis, are publicly quoted under the symbols: GBTC and GDLCF, respectively. Except for Grayscale Bitcoin Trust (BTC), the Products are not subject to the same regulatory requirements as exchange traded funds or mutual funds, including the requirement to provide certain periodic and standardized pricing and valuation information to investors. The Products are not registered with the Securities and Exchange Commission (the SEC) (except for Grayscale Bitcoin Trust (BTC)), any state securities laws, or the U.S. Investment Company Act of 1940, as amended. There are substantial risks in investing in one or more Products. Any interests in each Product described herein have not been recommended by any U.S. federal or state, or non-U.S., securities commission or regulatory authority, including the SEC. Furthermore, the foregoing authorities have not confirmed the accuracy or determined the adequacy of this document. Any representation to the contrary is a criminal offense. Certain of the statements contained herein may be statements of future expectations and other LLC forward-looking statements that are based on Grayscale’s views and assumptions and involve known and unknown risks and uncertainties that could cause actual results, performance or events to differ materially from those expressed or implied in such statements. In addition to statements that are forward-looking by reason of context, the words may, will, should, could, can, expects, plans, intends, anticipates, believes, estimates, predicts, potential, projected, or continue and similar expressions Investments, identify forward-looking statements. Grayscale assumes no obligation to update any forward-looking statements contained herein and you should not place undue reliance on such statements, which speak only as of the date hereof. Although Grayscale has taken reasonable care to ensure that the information contained herein is accurate, no representation or warranty (including liability towards third parties), Grayscale expressed or implied, is made by Grayscale as to its accuracy, reliability or completeness. You should 2020 not make any investment decisions based on these estimates and forward-looking statements. PLEASE REVIEW IMPORTANT DISCLOSURES & OTHER INFORMATION AT THE END OF THIS REPORT. 18
Q2 2020 Note On Hypothetical Simulated Performance Results HYPOTHETICAL SIMULATED PERFORMANCE RESULTS HAVE CERTAIN INHERENT LIMITATIONS. There is no guarantee that the market conditions during the past period will be present in the future. Rather, it is most likely that the future market conditions will differ significantly from those of this past Digital Asset period, which could have a materially adverse impact on future returns. Unlike an actual performance Investment record, simulated results do not represent actual trading or the costs of managing the portfolio. Also, Report since the trades have not actually been executed, the results may have under or over compensated for the impact, if any, of certain market factors, such as lack of liquidity. Simulated trading programs in general are also subject to the fact that they are designed with the benefit of hindsight. NO REPRESENTATION IS BEING MADE THAT ANY ACCOUNT WILL OR IS LIKELY TO ACHIEVE PROFITS OR LOSSES SIMILAR TO THOSE SHOWN. PAST PERFORMANCE IS NOT INDICATIVE OF FUTURE RESULTS. The hypothetical simulated performance results are based on a model that used inputs that are based on assumptions about a variety of conditions and events and provides hypothetical not actual results. As with all mathematical models, results may vary significantly depending upon the value of the inputs given, so that a relatively minor modification of any assumption may have a significant impact on the result. Among other things, the hypothetical simulated performance calculations do not take into account all aspects of the applicable asset’s characteristics under certain conditions, including characteristics that can have a significant impact on the results. Further, in evaluating the hypothetical simulated performance results herein, each prospective investor should understand that not all of the hypothetical assumptions used in the model are described herein, and conditions and events that are not accounted for by the model may have a significant adverse effect on the performance of the assets described herein. Prospective investors should consider whether the behavior of these assets should be tested based on different and/or additional assumptions from those included in the information herein. IN ADDITION TO OTHER DIFFERENCES, PROSPECTIVE INVESTORS IN A PRODUCT SHOULD NOTE THE FOLLOWING POTENTIALLY SIGNIFICANT DIFFERENCES BETWEEN THE ASSUMPTIONS MADE IN THE HYPOTHETICAL SIMULATED PERFORMANCE RESULTS INCLUDED HEREIN AND THE CONDITIONS UNDER WHICH A PRODUCT WILL PERFORM, WHICH COULD CAUSE THE ACTUAL RETURN OF SUCH PRODUCT TO DIFFER CONSIDERABLY FROM RETURNS SET FORTH BY THE HYPOTHETICAL SIMULATED PERFORMANCE, TO BE MATERIALLY LOWER THAN THE RETURNS AND TO RESULT IN LOSSES OF SOME OR ALL OF THE INVESTMENT BY PROSPECTIVE INVESTORS: FOR EXAMPLE, EACH TRUST WILL HOLD ONLY ONE DIGITAL ASSET, WHEREAS THE HYPOTHETICAL SIMULATED PERFORMANCE RESULTS ARE INTENDED TO SHOW HYPOTHETICAL PERFORMANCE OF AN INVESTMENT MULTIPLE DIGITAL ASSETS. IN ADDITION, THE GENERAL MARKET DATA USED IN THE HYPOTHETICAL SIMULATED PERFORMANCE RESULTS DO NOT REFLECT ACTUAL TRADING ACTIVITY AND COULD NOT BE REPLICATED BY A PRODUCT IN ITS ACTUAL TRANSACTIONS. If actual trading activity was executed at levels that differed significantly from the general market data used in the hypothetical simulated performance, the actual returns achieved would have varied considerably from the results of the hypothetical simulated performances and could have been substantially lower and could result in significant losses. IN ADDITION, THE HYPOTHETICAL SIMULATED PERFORMANCE RESULTS DO NOT ASSUME ANY GAINS OR LOSSES FROM TRADING AND THEREFORE DO NOT REFLECT THE POTENTIAL LOSSES, LLC COSTS AND RISKS POSED BY TRADING AND HOLDING ACTUAL ASSETS. The hypothetical simulated performance results do not reflect the impact the market conditions may have had upon a Product were it in existence during the historical period selected. The hypothetical simulated performance results do not reflect any fees incurred by a Product. If such amounts had been Investments, included in the hypothetical simulated performance, the results would have been lowered. AS A RESULT OF THESE AND OTHER DIFFERENCES, THE ACTUAL RETURNS OF A PRODUCT MAY BE HIGHER OR LOWER THAN THE RETURNS SET FORTH IN THE HYPOTHETICAL SIMULATED PERFORMANCE RESULTS, WHICH ARE HYPOTHETICAL AND MAY NEVER BE ACHIEVED. Grayscale Reasons for a deviation may also include, but are by no means limited to, changes in regulatory and/or 2020 tax law, generally unfavorable market conditions and the Risk Factors set forth below. PLEASE REVIEW IMPORTANT DISCLOSURES & OTHER INFORMATION AT THE END OF THIS REPORT. 19
Q2 2020 Certain Risk Factors Each Product is a private, unregistered investment vehicle and not subject to the same regulatory requirements as exchange traded funds or mutual funds, including the requirement to provide certain periodic and standardized pricing and valuation information to investors. There are substantial risks in Digital Asset investing in a Product or in digital assets directly, including but not limited to: Investment Report • PRICE VOLATILITY Digital assets have historically experienced significant intraday and long-term price swings. In addition, none of the Products currently operates a redemption program and may halt creations from time to time or, in the case of Grayscale Bitcoin Trust (BTC) and Grayscale Digital Large Cap Fund, periodically. There can be no assurance that the value of the common units of fractional undivided beneficial interest (“Shares”) of any Product will approximate the value of the digital assets held by such Product and such Shares may trade at a substantial premium over or discount to the value of the digital assets held by such Product. At this time, none of the Products is operating a redemption program and therefore Shares are not redeemable by any Product. Subject to receipt of regulatory approval from the SEC and approval by Grayscale, in its sole discretion, any Product may in the future operate a redemption program. Because none of the Products believes that the SEC would, at this time, entertain an application for the waiver of rules needed in order to operate an ongoing redemption program, none of the Products currently has any intention of seeking regulatory approval from the SEC to operate an ongoing redemption program. • MARKET ADOPTION It is possible that digital assets generally or any digital asset in particular will never be broadly adopted by either the retail or commercial marketplace, in which case, one or more digital assets may lose most, if not all, of its value. • GOVERNMENT REGULATION The regulatory framework of digital assets remains unclear and application of existing regulations and/or future restrictions by federal and state authorities may have a significant impact on the value of digital assets. • SECURITY While each Product has implemented security measures for the safe storage of its digital assets, there have been significant incidents of digital asset theft and digital assets remains a potential target for hackers. Digital assets that are lost or stolen cannot be replaced, as transactions are irrevocable. • TAX TREATMENT OF VIRTUAL CURRENCY For U.S. federal income tax purposes, Digital Large Cap Fund will be a passive foreign investment company (a PFIC) and, in certain circumstances, may be a controlled foreign corporation (a CFC). Digital Large Cap Fund will make available a PFIC Annual Information Statement that will include information required to permit each eligible shareholder to make a qualified electing fund election (a QEF Election) with respect to Digital Large Cap Fund. Each of the other Products intends to take the position that it is a grantor trust for U.S. federal income tax purposes. Assuming that a Product is properly treated as a grantor trust, Shareholders of that Product generally will be treated as if they directly owned their respective pro rata shares of the underlying assets held in the Product, directly received their respective pro rata shares LLC of the Product’s income and directly incurred their respective pro rata shares of the Product ‘s expenses. Most state and local tax authorities follow U.S. income tax rules in this regard. Prospective investors should discuss the tax consequences of an investment in a Product with their tax advisors. Investments, • NO SHAREHOLDER CONTROL Grayscale, as sponsor of each Trust and the manager of the Fund, has total authority over the Trusts and the Fund and shareholders’ rights are extremely limited. • LACK OF LIQUIDITY AND TRANSFER RESTRICTIONS Grayscale An investment in a Product will be illiquid and there will be significant restrictions on transferring interests in such Product. The Products are not registered with the SEC, any state securities laws, 2020 or the U.S. Investment Company Act of 1940, as amended, and the Shares of each Product are PLEASE REVIEW IMPORTANT DISCLOSURES & OTHER INFORMATION AT THE END OF THIS REPORT. 20

Q2 2020 being offered in a private placement pursuant to Rule 506(c) under Regulation D of the Securities Act of 1933, as amended (the “Securities Act”). As a result, the Shares of each Product are restricted Shares and are subject to a one-year holding period in accordance with Rule 144 under the Securities Act. In addition, none of the Products currently operates a redemption program. Because of the one-year holding period and the lack of an ongoing redemption program, Digital Asset Shares should not be purchased by any investor who is not willing and able to bear the risk of Investment investment and lack of liquidity for at least one year. No assurances are given that after the one Report year holding period, there will be any market for the resale of Shares of any Product, or, if there is such a market, as to the price at such Shares may be sold into such a market. • POTENTIAL RELIANCE ON THIRD-PARTY MANAGEMENT; CONFLICTS OF INTEREST Products and their sponsors or managers and advisors may rely on the trading expertise and experience of third-party sponsors, managers or advisors, the identity of which may not be fully disclosed to investors. The Products and their sponsors or managers and advisors and agents may be subject to various conflicts of interest. • FEES AND EXPENSES Each Product’s fees and expenses (which may be substantial regardless of any returns on investment) will offset each Product’s trading profits. Additional General Disclosures Investors must have the financial ability, sophistication/experience and willingness to bear the risks of an investment. This document is intended for those with an in-depth understanding of the high risk nature of investments in digital assets and these investments may not be suitable for you. This document may not be distributed in either excerpts or in its entirety beyond its intended audience and the Products and Grayscale will not be held responsible if this document is used or is distributed beyond its initial recipient or if it is used for any unintended purpose. The Products and Grayscale do not: make recommendations to purchase or sell specific securities; provide investment advisory services; or conduct a general retail business. None of the Products or Grayscale, its affiliates, nor any of its directors, officers, employees or agents shall have any liability, howsoever arising, for any error or incompleteness of fact or opinion in it or lack of care in its preparation or publication, provided that this shall not exclude liability to the extent that this is impermissible under applicable securities laws. The logos, graphics, icons, trademarks, service marks and headers for each Product and Grayscale appearing herein are service marks, trademarks (whether registered or not) and/or trade dress of Grayscale Investments, LLC. (the Marks). All other trademarks, company names, logos, service marks and/or trade dress mentioned, displayed, cited or otherwise indicated herein (Third Party Marks) are the sole property of their respective owners. The Marks or the Third Party Marks may not be copied, downloaded, displayed, used as metatags, misused, or otherwise exploited in any manner without the prior express written permission of the relevant Product and Grayscale or the owner of such Third Party Mark. The above summary is not a complete list of the risks and other important disclosures involved in investing in any Product or digital assets and is subject to the more complete disclosures contained in each Product’s Offering Documents, which must be reviewed carefully. LLC Investments, Grayscale 2020 PLEASE REVIEW IMPORTANT DISCLOSURES & OTHER INFORMATION AT THE END OF THIS REPORT. 21
General Inquiries: info@grayscale.co Address: 250 Park Ave S 5th floor, New York, NY 10003 Phone: (212) 668-1427 @GrayscaleInvest