Attached files
| file | filename |
|---|---|
| EX-32.2 - EXHIBIT 32.2 - CHS INC | ex-32253120.htm |
| EX-32.1 - EXHIBIT 32.1 - CHS INC | ex-32153120.htm |
| EX-31.2 - EXHIBIT 31.2 - CHS INC | ex-31253120.htm |
| EX-31.1 - EXHIBIT 31.1 - CHS INC | ex-31153120.htm |
| EX-10.1 - EXHIBIT 10.1 - CHS INC | ex101cofinaomnibusamendmen.htm |
UNITED STATES SECURITIES AND EXCHANGE COMMISSION
Washington, D.C. 20549
Form 10-Q
þ | Quarterly Report pursuant to Section 13 or 15(d) of the Securities Exchange Act of 1934 for the quarterly period ended May 31, 2020. | ||
or | |||
o | Transition Report pursuant to Section 13 or 15(d) of the Securities Exchange Act of 1934 for the transition period from to | ||
Commission file number: 001-36079
CHS Inc.
(Exact name of Registrant as specified in its charter)
Minnesota (State or other jurisdiction of incorporation or organization) | 41-0251095 (I.R.S. Employer Identification Number) | |
5500 Cenex Drive Inver Grove Heights, Minnesota 55077 (Address of principal executive offices, including zip code) | (651) 355-6000 (Registrant’s telephone number, including area code) | |
Securities registered pursuant to Section 12(b) of the Act:
Title of each class | Trading symbol(s) | Name of each exchange on which registered |
8% Cumulative Redeemable Preferred Stock | CHSCP | The Nasdaq Stock Market LLC |
Class B Cumulative Redeemable Preferred Stock, Series 1 | CHSCO | The Nasdaq Stock Market LLC |
Class B Reset Rate Cumulative Redeemable Preferred Stock, Series 2 | CHSCN | The Nasdaq Stock Market LLC |
Class B Reset Rate Cumulative Redeemable Preferred Stock, Series 3 | CHSCM | The Nasdaq Stock Market LLC |
Class B Cumulative Redeemable Preferred Stock, Series 4 | CHSCL | The Nasdaq Stock Market LLC |
Indicate by check mark whether the Registrant (1) has filed all reports required to be filed by Section 13 or 15(d) of the Securities Exchange Act of 1934 during the preceding 12 months (or for such shorter period that the Registrant was required to file such reports), and (2) has been subject to such filing requirements for the past 90 days.
YES þ NO o
Indicate by check mark whether the Registrant has submitted electronically every Interactive Data File required to be submitted pursuant to Rule 405 of Regulation S-T (§232.405 of this chapter) during the preceding 12 months (or for such shorter period that the Registrant was required to submit such files).
YES þ NO o
Indicate by check mark whether the Registrant is a large accelerated filer, an accelerated filer, a non-accelerated filer, a smaller reporting company, or an emerging growth company. See the definitions of "large accelerated filer," "accelerated filer," "smaller reporting company," and "emerging growth company" in Rule 12b-2 of the Exchange Act.
Large accelerated filer o | Accelerated filer o | Non-accelerated filer þ | Smaller reporting company o | Emerging growth company o |
If an emerging growth company, indicate by check mark if the Registrant has elected not to use the extended transition period for complying with any new or revised financial accounting standards provided pursuant to Section 13(a) of the Exchange Act. o
Indicate by check mark whether the Registrant is a shell company (as defined in Rule 12b-2 of the Exchange Act).
YES o NO þ
Indicate the number of shares outstanding of each of the Registrant's classes of common stock, as of the latest practicable date:
The Registrant has no common stock outstanding.
TABLE OF CONTENTS
Page No. | ||
Unless the context otherwise requires, for purposes of this Quarterly Report on Form 10-Q, the words "CHS," "we," "us" or "our" refer to CHS Inc., a Minnesota cooperative corporation, and its subsidiaries as of May 31, 2020.
FORWARD-LOOKING STATEMENTS
This Quarterly Report on Form 10-Q contains and our other publicly available documents may contain, and our officers, directors and other representatives may from time to time make "forward-looking statements" within the meaning of the safe harbor provisions of the U.S. Private Securities Litigation Reform Act of 1995. Forward-looking statements can be identified by words such as "anticipate," "intend," "plan," "goal," "seek," "believe," "project," "estimate," "expect," "strategy," "future," "likely," "may," "should," "will" and similar references to future periods. Forward-looking statements are neither historical facts nor assurances of future performance. Instead, they are based only on our current beliefs, expectations and assumptions regarding the future of our businesses, financial condition and results of operations, future plans and strategies, projections, anticipated events and trends, the economy and other future conditions. Because forward-looking statements relate to the future, they are subject to inherent uncertainties, risks and changes in circumstances that are difficult to predict and many of which are outside of our control. Our actual results and financial condition may differ materially from those indicated in the forward-looking statements. Therefore, you should not place undue reliance on any of these forward-looking statements. Important factors that could cause our actual results and financial condition to differ materially from those indicated in the forward-looking statements are discussed or identified in our public filings made with the U.S. Securities and Exchange Commission, including in the "Risk Factors" discussion in Item 1A of our Annual Report on Form 10-K for the year ended August 31, 2019, and Part II, Item 1A of this Quarterly Report on Form 10-Q. Any forward-looking statements made by us in this Quarterly Report on Form 10-Q are based only on information currently available to us and speak only as of the date on which the statement is made. We undertake no obligation to publicly update any forward-looking statement, whether written or oral, that may be made from time to time, whether as a result of new information, future developments or otherwise, except as required by applicable law.
1
PART I. FINANCIAL INFORMATION
ITEM 1. FINANCIAL STATEMENTS
CHS INC. AND SUBSIDIARIES
CONDENSED CONSOLIDATED BALANCE SHEETS
(Unaudited)
May 31, 2020 | August 31, 2019 | ||||||
(Dollars in thousands) | |||||||
ASSETS | |||||||
Current assets: | |||||||
Cash and cash equivalents | $ | 408,115 | $ | 211,179 | |||
Receivables | 2,574,207 | 2,731,209 | |||||
Inventories | 2,818,758 | 2,854,288 | |||||
Other current assets | 1,258,553 | 865,919 | |||||
Total current assets | 7,059,633 | 6,662,595 | |||||
Investments | 3,666,959 | 3,683,996 | |||||
Property, plant and equipment | 4,999,082 | 5,088,708 | |||||
Other assets | 1,101,550 | 1,012,195 | |||||
Total assets | $ | 16,827,224 | $ | 16,447,494 | |||
LIABILITIES AND EQUITIES | |||||||
Current liabilities: | |||||||
Notes payable | $ | 2,215,583 | $ | 2,156,108 | |||
Current portion of long-term debt | 28,200 | 39,210 | |||||
Accounts payable | 1,751,354 | 1,931,415 | |||||
Accrued expenses | 566,258 | 555,323 | |||||
Other current liabilities | 1,061,487 | 901,651 | |||||
Total current liabilities | 5,622,882 | 5,583,707 | |||||
Long-term debt | 1,764,367 | 1,749,901 | |||||
Other liabilities | 659,689 | 496,356 | |||||
Commitments and contingencies (Note 13) | |||||||
Equities: | |||||||
Preferred stock | 2,264,038 | 2,264,038 | |||||
Equity certificates | 4,896,148 | 4,988,877 | |||||
Accumulated other comprehensive loss | (241,165 | ) | (226,933 | ) | |||
Capital reserves | 1,852,826 | 1,584,158 | |||||
Total CHS Inc. equities | 8,771,847 | 8,610,140 | |||||
Noncontrolling interests | 8,439 | 7,390 | |||||
Total equities | 8,780,286 | 8,617,530 | |||||
Total liabilities and equities | $ | 16,827,224 | $ | 16,447,494 | |||
The accompanying notes are an integral part of the condensed consolidated financial statements (unaudited).
2
CHS INC. AND SUBSIDIARIES
CONDENSED CONSOLIDATED STATEMENTS OF OPERATIONS
(Unaudited)
Three Months Ended May 31, | Nine Months Ended May 31, | ||||||||||||||
2020 | 2019 | 2020 | 2019 | ||||||||||||
(Dollars in thousands) | |||||||||||||||
Revenues | $ | 7,241,031 | $ | 8,497,941 | $ | 21,460,742 | $ | 23,465,769 | |||||||
Cost of goods sold | 7,022,672 | 8,274,170 | 20,601,785 | 22,343,944 | |||||||||||
Gross profit | 218,359 | 223,771 | 858,957 | 1,121,825 | |||||||||||
Marketing, general and administrative expenses | 180,439 | 217,527 | 548,340 | 551,438 | |||||||||||
Operating earnings | 37,920 | 6,244 | 310,617 | 570,387 | |||||||||||
Interest expense | 26,661 | 42,773 | 95,043 | 122,950 | |||||||||||
Other income | (8,076 | ) | (32,938 | ) | (32,926 | ) | (69,835 | ) | |||||||
Equity income from investments | (51,114 | ) | (65,170 | ) | (135,174 | ) | (173,394 | ) | |||||||
Income before income taxes | 70,449 | 61,579 | 383,674 | 690,666 | |||||||||||
Income tax (benefit) expense | (27,052 | ) | 6,866 | (18,258 | ) | 40,534 | |||||||||
Net income | 97,501 | 54,713 | 401,932 | 650,132 | |||||||||||
Net (loss) income attributable to noncontrolling interests | (147 | ) | 93 | 955 | (758 | ) | |||||||||
Net income attributable to CHS Inc. | $ | 97,648 | $ | 54,620 | $ | 400,977 | $ | 650,890 | |||||||
The accompanying notes are an integral part of the condensed consolidated financial statements (unaudited).
3
CHS INC. AND SUBSIDIARIES
CONDENSED CONSOLIDATED STATEMENTS OF COMPREHENSIVE INCOME
(Unaudited)
Three Months Ended May 31, | Nine Months Ended May 31, | ||||||||||||||
2020 | 2019 | 2020 | 2019 | ||||||||||||
(Dollars in thousands) | |||||||||||||||
Net income | $ | 97,501 | $ | 54,713 | $ | 401,932 | $ | 650,132 | |||||||
Other comprehensive (loss) income, net of tax: | |||||||||||||||
Pension and other postretirement benefits | 3,490 | 1,496 | 12,309 | 5,599 | |||||||||||
Cash flow hedges | 6,817 | (15,817 | ) | (4,867 | ) | (7,155 | ) | ||||||||
Foreign currency translation adjustment | (12,316 | ) | (7,992 | ) | (21,674 | ) | (5,484 | ) | |||||||
Other comprehensive loss, net of tax | (2,009 | ) | (22,313 | ) | (14,232 | ) | (7,040 | ) | |||||||
Comprehensive income | 95,492 | 32,400 | 387,700 | 643,092 | |||||||||||
Comprehensive (loss) income attributable to noncontrolling interests | (147 | ) | 93 | 955 | (758 | ) | |||||||||
Comprehensive income attributable to CHS Inc. | $ | 95,639 | $ | 32,307 | $ | 386,745 | $ | 643,850 | |||||||
The accompanying notes are an integral part of the condensed consolidated financial statements (unaudited).
4
CHS INC. AND SUBSIDIARIES
CONDENSED CONSOLIDATED STATEMENTS OF CASH FLOWS
(Unaudited)
Nine Months Ended May 31, | |||||||
2020 | 2019 | ||||||
(Dollars in thousands) | |||||||
Cash flows from operating activities: | |||||||
Net income | $ | 401,932 | $ | 650,132 | |||
Adjustments to reconcile net income to net cash provided by (used in) operating activities: | |||||||
Depreciation and amortization, including amortization of deferred major maintenance | 408,613 | 401,798 | |||||
Equity income from investments, net of distributions received | 1,339 | (39,674 | ) | ||||
Provision for doubtful accounts | 7,692 | 36,874 | |||||
Deferred taxes | (11,811 | ) | 34,786 | ||||
Other, net | 67,625 | (46,157 | ) | ||||
Changes in operating assets and liabilities, net of acquisitions: | |||||||
Receivables | 25,290 | (446,846 | ) | ||||
Inventories | (5,602 | ) | (199,339 | ) | |||
Accounts payable and accrued expenses | (185,503 | ) | 174,855 | ||||
Other, net | (183,732 | ) | (436,518 | ) | |||
Net cash provided by operating activities | 525,843 | 129,911 | |||||
Cash flows from investing activities: | |||||||
Acquisition of property, plant and equipment | (316,506 | ) | (278,589 | ) | |||
Proceeds from disposition of property, plant and equipment | 28,257 | 46,414 | |||||
Expenditures for major maintenance | (10,414 | ) | (210,837 | ) | |||
Changes in CHS Capital notes receivable, net | 219,173 | (112,608 | ) | ||||
Financing extended to customers | (5,139 | ) | (10,492 | ) | |||
Payments from customer financing | 21,341 | 84,189 | |||||
Business acquisitions, net of cash acquired | — | (119,421 | ) | ||||
Other investing activities, net | 14,755 | 8,854 | |||||
Net cash used in investing activities | (48,533 | ) | (592,490 | ) | |||
Cash flows from financing activities: | |||||||
Proceeds from notes payable and long-term debt | 19,841,762 | 20,715,683 | |||||
Payments on notes payable, long-term debt and capital lease obligations | (19,805,609 | ) | (20,236,780 | ) | |||
Preferred stock dividends paid | (126,501 | ) | (126,501 | ) | |||
Redemptions of equities | (86,272 | ) | (76,397 | ) | |||
Cash patronage dividends paid | (90,112 | ) | (75,669 | ) | |||
Other financing activities, net | (25,475 | ) | (25,993 | ) | |||
Net cash (used in) provided by financing activities | (292,207 | ) | 174,343 | ||||
Effect of exchange rate changes on cash and cash equivalents | (786 | ) | (382 | ) | |||
Increase (decrease) in cash and cash equivalents and restricted cash | 184,317 | (288,618 | ) | ||||
Cash and cash equivalents and restricted cash at beginning of period | 299,675 | 543,940 | |||||
Cash and cash equivalents and restricted cash at end of period | $ | 483,992 | $ | 255,322 | |||
The accompanying notes are an integral part of the condensed consolidated financial statements (unaudited).
5
CHS INC. AND SUBSIDIARIES
NOTES TO CONDENSED CONSOLIDATED FINANCIAL STATEMENTS (Unaudited)
Note 1 Basis of Presentation and Significant Accounting Policies
Basis of Presentation
These unaudited condensed consolidated financial statements reflect, in the opinion of management, all normal recurring adjustments necessary for a fair statement of our financial position, results of operations and cash flows for the periods presented. The results of operations and cash flows for interim periods are not necessarily indicative of results for a full fiscal year because of the seasonal nature of our businesses, among other things. Our unaudited condensed consolidated financial statements and notes are presented as permitted by the requirements for Quarterly Reports on Form 10-Q and should be read in conjunction with the consolidated financial statements and notes thereto for the year ended August 31, 2019, included in our Annual Report on Form 10-K, filed with the Securities and Exchange Commission ("SEC").
Certain captions within the Condensed Consolidated Balance Sheets, Condensed Consolidated Statements of Operations and Condensed Consolidated Statements of Cash Flows have been combined within other captions as allowed by SEC financial statement reporting requirements under Regulation S-X. Prior year information has been revised to conform with the current presentation.
The recent outbreak and pandemic of the novel coronavirus known as COVID-19 and other factors resulted in substantial reductions in demand and sharp price declines in certain industries in which we operate during the third quarter of fiscal 2020, particularly with respect to the production of renewable fuels and other energy products. Based on these deteriorated macroeconomic and industry conditions, management considered the impacts on each of our businesses and determined that we needed to perform interim impairment assessments of goodwill and asset groups, as of April 30, 2020, for a reporting unit within our Ag segment that operates in the renewable fuels industry. Recent third-party price outlooks, projections of future volumes, expenses and other cash flows and a discount rate reflective of the relative risk of the cash flows were used to estimate fair value. Management believes the assumptions utilized in the assessment are appropriate and reasonable for estimating fair value. The estimated fair value of the reporting unit exceeded the carrying amount by approximately 18%, and thus no impairment was recorded. Management will continue to monitor results and projected cash flows to assess whether any impairment may be necessary in the future.
Significant Accounting Policies
The following significant accounting policy was updated or changed since our Annual Report on Form 10-K for the year ended August 31, 2019.
Leases
As described in the "Recent Accounting Pronouncements" section, we adopted Accounting Standards Update ("ASU") No. 2016-02, Leases, as amended (collectively "Accounting Standards Codification ("ASC") Topic 842"), on September 1, 2019, using the modified retrospective approach. Our accounting policies and additional disclosures with respect to ASC Topic 842 are included in Note 14, Leases.
Recent Accounting Pronouncements
Except for the recent accounting pronouncements described below, other recent accounting pronouncements are not expected to have a material impact on our condensed consolidated financial statements.
Adopted
We adopted ASC Topic 842 as of September 1, 2019, using the modified retrospective approach. In addition, we used the additional optional transition method and package of practical expedients in the period of adoption without retrospective adjustment to previous periods presented, although we elected not to apply the hindsight practical expedient available under the standard. As a result of using the modified retrospective method, prior periods have not been restated, and a $33.7 million cumulative-effect adjustment was recorded to increase the opening balance of capital reserves as of the adoption date related to recognition of previously deferred gains associated with the sale-leaseback of our primary corporate office building located in Inver Grove Heights, Minnesota. Additionally, adoption of ASC Topic 842 resulted in the recognition of operating lease right-
6
of-use assets and associated lease liabilities of $268.4 million and $267.0 million, respectively, as of September 1, 2019. Adoption of ASC Topic 842 did not have a material impact on our Condensed Consolidated Statements of Operations or Condensed Consolidated Statements of Cash Flows. Additional information and further disclosures related to our leases and lease-related financial statement amounts are included within Note 14, Leases.
Not Yet Adopted
In June 2016, the Financial Accounting Standards Board issued ASU No. 2016-13, Financial Instruments - Credit Losses ("ASC Topic 326"): Measurement of Credit Losses on Financial Instruments. The amendments in this ASU introduce a new approach, based on expected losses, to estimate credit losses on certain types of financial instruments. This ASU is intended to provide financial statement users with more decision-useful information about the expected credit losses associated with most financial assets measured at amortized cost and certain other instruments, including trade and other receivables, loans, held-to-maturity debt securities, net investments in leases and off-balance-sheet credit exposures. Entities are required to apply the provisions of this ASU as a cumulative-effect adjustment to capital reserves as of the beginning of the first reporting period in which the guidance is adopted. This ASU is effective for us beginning September 1, 2020, for our fiscal year 2021 and for interim periods within that fiscal year. The impact of adoption will depend on the composition of our portfolio at the adoption date and we are currently finalizing our evaluation of the impact of adoption on our condensed consolidated financial statements through various data-gathering activities, development of a credit loss model and accounting policy election determinations.
Note 2 Revenues
The following table presents revenues recognized under ASC Topic 606, Revenue from Contracts with Customers ("ASC Topic 606"), disaggregated by reportable segment, as well as the amount of revenues recognized under ASC Topic 815, Derivatives and Hedging ("ASC Topic 815"), and other applicable accounting guidance for the three and nine months ended May 31, 2020, and 2019. Other applicable accounting guidance primarily includes revenues recognized under ASC Topic 842, Leases, and ASC Topic 470, Debt, that fall outside the scope of ASC Topic 606.
ASC Topic 606 | ASC Topic 815 | Other Guidance | Total Revenues | |||||||||||||
Three Months Ended May 31, 2020 | (Dollars in thousands) | |||||||||||||||
Energy | $ | 762,053 | $ | 128,866 | $ | — | $ | 890,919 | ||||||||
Ag | 2,026,588 | 4,290,627 | 20,686 | 6,337,901 | ||||||||||||
Corporate and Other | 6,027 | — | 6,184 | 12,211 | ||||||||||||
Total revenues | $ | 2,794,668 | $ | 4,419,493 | $ | 26,870 | $ | 7,241,031 | ||||||||
Three Months Ended May 31, 2019 | ||||||||||||||||
Energy | $ | 1,544,533 | $ | 193,512 | $ | — | $ | 1,738,045 | ||||||||
Ag | 2,234,378 | 4,485,089 | 25,648 | 6,745,115 | ||||||||||||
Corporate and Other | 4,841 | — | 9,940 | 14,781 | ||||||||||||
Total revenues | $ | 3,783,752 | $ | 4,678,601 | $ | 35,588 | $ | 8,497,941 | ||||||||
Nine Months Ended May 31, 2020 | ||||||||||||||||
Energy | $ | 3,831,806 | $ | 415,586 | $ | — | $ | 4,247,392 | ||||||||
Ag | 4,446,097 | 12,681,108 | 46,753 | 17,173,958 | ||||||||||||
Corporate and Other | 16,910 | — | 22,482 | 39,392 | ||||||||||||
Total revenues | $ | 8,294,813 | $ | 13,096,694 | $ | 69,235 | $ | 21,460,742 | ||||||||
Nine Months Ended May 31, 2019 | ||||||||||||||||
Energy | $ | 4,826,762 | $ | 547,348 | $ | — | $ | 5,374,110 | ||||||||
Ag | 4,574,203 | 13,375,276 | 95,578 | 18,045,057 | ||||||||||||
Corporate and Other | 14,818 | — | 31,784 | 46,602 | ||||||||||||
Total revenues | $ | 9,415,783 | $ | 13,922,624 | $ | 127,362 | $ | 23,465,769 | ||||||||
7
Less than 1% of revenues accounted for under ASC Topic 606 included within the table above are recorded over time; these revenues are primarily related to service contracts.
Contract Assets and Contract Liabilities
Contract assets relate to unbilled amounts arising from goods that have already been transferred to the customer where the right to payment is not conditional upon the passage of time. This results in recognition of an asset, as the amount of revenue recognized at a certain point in time exceeds the amount billed to the customer. Contract assets are recorded in receivables within our Condensed Consolidated Balance Sheets and were not material as of May 31, 2020, and August 31, 2019.
Contract liabilities relate to advance payments from customers for goods and services that we have yet to provide. Contract liabilities of $204.7 million and $207.5 million as of May 31, 2020, and August 31, 2019, respectively, are recorded within other current liabilities on our Condensed Consolidated Balance Sheets. For the three months ended May 31, 2020, and 2019, we recognized revenues of $50.5 million and $67.9 million, respectively. For the nine months ended May 31, 2020, and 2019, we recognized revenues of $182.0 million and $148.9 million, respectively. These amounts were included in the other current liabilities balance at the beginning of the respective periods.
Note 3 Receivables
May 31, 2020 | August 31, 2019 | ||||||
(Dollars in thousands) | |||||||
Trade accounts receivable | $ | 1,766,166 | $ | 1,803,284 | |||
CHS Capital short-term notes receivable | 474,425 | 592,909 | |||||
Other | 524,975 | 511,821 | |||||
Gross receivables | 2,765,566 | 2,908,014 | |||||
Less: allowances and reserves | 191,359 | 176,805 | |||||
Total receivables | $ | 2,574,207 | $ | 2,731,209 | |||
Receivables are composed of trade accounts receivable, short-term notes receivable in our wholly-owned subsidiary, CHS Capital, LLC ("CHS Capital"), and other receivables, less an allowance for doubtful accounts.
Notes receivable from commercial borrowers are collateralized by various combinations of mortgages, personal property, accounts and notes receivable, inventories and assignments of capital stock from certain regional cooperatives. These loans are originated in various states, primarily in the Upper Midwest region of the United States, the most significant of which include North Dakota, Minnesota and Montana. CHS Capital also has loans receivable from producer borrowers that are collateralized by various combinations of growing crops, livestock, inventories, accounts receivable, personal property and supplemental mortgages and are originated in the same states as the commercial notes.
In addition to the short-term balances included in the table above, CHS Capital had long-term notes receivable, with durations of generally not more than 10 years, totaling $93.6 million and $180.0 million as of May 31, 2020, and August 31, 2019, respectively. Long-term notes receivable are included in other assets on our Condensed Consolidated Balance Sheets. As of May 31, 2020, and August 31, 2019, the commercial notes represented 45% and 41%, respectively, and the producer notes represented 55% and 59%, respectively, of total CHS Capital notes receivable.
CHS Capital has commitments to extend credit to customers if there are no violations of contractually established conditions. As of May 31, 2020, CHS Capital customers had additional available credit of $762.2 million. No significant troubled debt restructuring activity occurred and no third-party customer or borrower accounted for more than 10% of the total receivables balance as of May 31, 2020, or August 31, 2019.
8
Note 4 Inventories
May 31, 2020 | August 31, 2019 | ||||||
(Dollars in thousands) | |||||||
Grain and oilseed | $ | 1,021,535 | $ | 1,024,645 | |||
Energy | 681,364 | 717,378 | |||||
Agronomy | 967,451 | 954,037 | |||||
Processed grain and oilseed | 108,115 | 109,900 | |||||
Other | 40,293 | 48,328 | |||||
Total inventories | $ | 2,818,758 | $ | 2,854,288 | |||
As of May 31, 2020, and August 31, 2019, we valued approximately 16% of inventories, primarily crude oil and refined fuels within our Energy segment, using the lower of cost, determined on the LIFO method, or net realizable value. If the FIFO method of accounting had been used, inventories would have been lower than the reported amount by $79.0 million and higher than the reported amount by $215.0 million as of May 31, 2020, and August 31, 2019, respectively. Actual valuation of inventory under the LIFO method can be made only at the end of each year based on inventory levels and costs at that time. Interim LIFO calculations are based on management's estimates of expected year-end inventory levels and values and are subject to the final year-end LIFO inventory valuation. During the third quarter of fiscal 2020, we experienced price declines in our energy inventories associated with the novel corona virus COVID-19 pandemic. As a result, we recorded a noncash, lower of cost or market charge of $42.0 million in cost of goods sold to reduce the carrying value of our energy inventories to their market value at the end of the period. This charge may increase or decrease in the fourth quarter of fiscal 2020, based upon market prices observed at our fiscal year-end. Any adjustments that exist as of our fiscal year-end would be incorporated into the LIFO carrying value of the inventories.
Note 5 Investments
May 31, 2020 | August 31, 2019 | ||||||
(Dollars in thousands) | |||||||
Equity method investments: | |||||||
CF Industries Nitrogen, LLC | $ | 2,724,668 | $ | 2,708,942 | |||
Ventura Foods, LLC | 364,726 | 374,516 | |||||
Ardent Mills, LLC | 206,476 | 209,027 | |||||
Other equity method investments | 247,778 | 267,247 | |||||
Other investments | 123,311 | 124,264 | |||||
Total investments | $ | 3,666,959 | $ | 3,683,996 | |||
Equity Method Investments
Joint ventures and other investments, in which we have significant ownership and influence but not control, are accounted for in our condensed consolidated financial statements using the equity method of accounting. Our primary equity method investments are described below. In addition to recognition of our share of income from equity method investments, our equity method investments are evaluated for indicators of other-than-temporary impairment on an ongoing basis in accordance with accounting principles generally accepted in the United States ("U.S. GAAP"). Other investments consist primarily of investments in cooperatives without readily determinable fair values and are generally measured at cost, unless an impairment or other observable market price change occurs, requiring an adjustment.
CF Nitrogen
We have a $2.7 billion investment in CF Industries Nitrogen, LLC ("CF Nitrogen"), a strategic venture with CF Industries Holdings, Inc. ("CF Industries"). The investment consists of an approximate 10% membership interest (based on product tons) in CF Nitrogen. We account for this investment using the hypothetical liquidation at book value method, recognizing our share of the earnings and losses of CF Nitrogen based upon our contractual claims on the entity's net assets pursuant to the liquidation provisions of the CF Nitrogen Limited Liability Company Agreement, adjusted for the semi-annual cash distributions we receive as a result of our membership interest in CF Nitrogen. For the three months ended May 31, 2020,
9
and 2019, equity earnings were $41.3 million and $42.0 million, respectively. For the nine months ended May 31, 2020, and 2019, equity earnings were $104.0 million and $118.4 million, respectively. These amounts are included as equity income from investments in our Nitrogen Production segment.
The following table provides summarized unaudited financial information for our equity method investment in CF Nitrogen for the nine months ended May 31, 2020, and 2019:
Nine Months Ended May 31, | |||||||
2020 | 2019 | ||||||
Net sales | $ | 1,954,660 | $ | 2,219,267 | |||
Gross profit | 481,711 | 560,631 | |||||
Net earnings | 452,859 | 536,409 | |||||
Earnings attributable to CHS Inc. | 104,021 | 118,415 | |||||
Ventura Foods and Ardent Mills
We have a 50% interest in Ventura Foods, LLC ("Ventura Foods"), which is a joint venture with Wilsey Foods, Inc., a majority-owned subsidiary of MK USA Holdings, Inc., that produces and distributes primarily vegetable-oil-based products. Additionally, we have a 12% interest in Ardent Mills, LLC ("Ardent Mills"), which is a joint venture with Cargill Incorporated and Conagra Brands, Inc., and combines the North American flour milling operations of the three parent companies. We account for Ventura Foods and Ardent Mills as equity method investments, and our share of the results of these equity methods investments are included in Corporate and Other.
The following table provides aggregate summarized unaudited financial information for our equity method investments in Ventura Foods and Ardent Mills for the nine months ended May 31, 2020, and 2019:
Nine Months Ended May 31, | |||||||
2020 | 2019 | ||||||
Net sales | $ | 4,101,502 | $ | 4,427,127 | |||
Gross profit | 686,045 | 391,338 | |||||
Net earnings | 134,774 | 152,315 | |||||
Earnings attributable to CHS Inc. | 29,770 | 50,415 | |||||
Our investments in other equity method investees are not significant in relation to our condensed consolidated financial statements, either individually or in the aggregate.
Note 6 Notes Payable and Long-Term Debt
Our notes payable and long-term debt are subject to various restrictive requirements for maintenance of minimum consolidated net worth and other financial ratios. We were in compliance with our debt covenants as of May 31, 2020. The table below summarizes our notes payable as of May 31, 2020, and August 31, 2019.
May 31, 2020 | August 31, 2019 | ||||||
(Dollars in thousands) | |||||||
Notes payable | $ | 1,573,594 | $ | 1,330,550 | |||
CHS Capital notes payable | 641,989 | 825,558 | |||||
Total notes payable | $ | 2,215,583 | $ | 2,156,108 | |||
As of May 31, 2020, our primary line of credit was a five-year unsecured revolving credit facility with a syndicate of domestic and international banks. The credit facility provides a committed amount of $2.75 billion that expires on July 16, 2024. As of May 31, 2020, and August 31, 2019, the outstanding balance on this facility was $800.0 million and $335.0 million, respectively. Additionally, on September 30, 2019, CHS Capital entered into a credit agreement with a revolving note. Under this agreement, CHS Capital has available capacity of $100.0 million, of which no amount was outstanding as of May 31, 2020.
10
We have a receivables and loans securitization facility ("Securitization Facility") with certain unaffiliated financial institutions ("Purchasers"). Under the Securitization Facility, we and certain of our subsidiaries ("Originators") sell trade accounts and notes receivable ("Receivables") to Cofina Funding, LLC ("Cofina"), a wholly-owned bankruptcy-remote indirect subsidiary of CHS. Cofina in turn transfers the Receivables to the Purchasers, and this arrangement is accounted for as a secured borrowing. We use the proceeds from the sale of Receivables under the Securitization Facility for general corporate purposes and settlements are made on a monthly basis. The Securitization Facility was amended on June 26, 2020, to extend its termination date to September 24, 2020, which may be further extended.
On June 26, 2020, we also amended our repurchase facility ("Repurchase Facility") related to the Securitization Facility. Under the Repurchase Facility, we can borrow up to $150.0 million, collateralized by a subordinated note issued by Cofina in favor of the Originators and representing a portion of the outstanding balance of the Receivables sold by the Originators to Cofina under the Securitization Facility. As of May 31, 2020, and August 31, 2019, the outstanding balance under the Repurchase Facility was $150.0 million.
Interest expense for the three months ended May 31, 2020, and 2019, was $26.7 million and $42.8 million, respectively, net of capitalized interest of $2.7 million and $2.5 million, respectively. Interest expense for the nine months ended May 31, 2020, and 2019, was $95.0 million and $123.0 million, respectively, net of capitalized interest of $8.9 million and $7.1 million, respectively.
11
Note 7 Equities
Changes in Equities
Changes in equities for the nine months ended May 31, 2020, and 2019, are as follows:
Equity Certificates | Accumulated Other Comprehensive Loss | ||||||||||||||||||||||||||||||
Capital Equity Certificates | Nonpatronage Equity Certificates | Nonqualified Equity Certificates | Preferred Stock | Capital Reserves | Noncontrolling Interests | Total Equities | |||||||||||||||||||||||||
(Dollars in thousands) | |||||||||||||||||||||||||||||||
Balances, August 31, 2019 | $ | 3,753,493 | $ | 29,074 | $ | 1,206,310 | $ | 2,264,038 | $ | (226,933 | ) | $ | 1,584,158 | $ | 7,390 | $ | 8,617,530 | ||||||||||||||
Reversal of prior year redemption estimates | 5,447 | — | — | — | — | — | — | 5,447 | |||||||||||||||||||||||
Redemptions of equities | (4,721 | ) | (54 | ) | (672 | ) | — | — | — | — | (5,447 | ) | |||||||||||||||||||
Preferred stock dividends | — | — | — | — | — | (84,334 | ) | — | (84,334 | ) | |||||||||||||||||||||
ASC Topic 842 cumulative-effect adjustment | — | — | — | — | — | 33,707 | — | 33,707 | |||||||||||||||||||||||
Other, net | (8 | ) | — | (39 | ) | — | — | (1,312 | ) | 410 | (949 | ) | |||||||||||||||||||
Net income | — | — | — | — | — | 177,882 | 855 | 178,737 | |||||||||||||||||||||||
Other comprehensive loss, net of tax | — | — | — | — | (1,638 | ) | — | — | (1,638 | ) | |||||||||||||||||||||
Estimated 2020 cash patronage refunds | — | — | — | — | — | (28,504 | ) | — | (28,504 | ) | |||||||||||||||||||||
Estimated 2020 equity redemptions | (91,633 | ) | — | — | — | — | — | — | (91,633 | ) | |||||||||||||||||||||
Balances, November 30, 2019 | $ | 3,662,578 | $ | 29,020 | $ | 1,205,599 | $ | 2,264,038 | $ | (228,571 | ) | $ | 1,681,597 | $ | 8,655 | $ | 8,622,916 | ||||||||||||||
Reversal of prior year patronage and redemption estimates | 3,387 | — | (472,398 | ) | — | — | 562,398 | — | 93,387 | ||||||||||||||||||||||
Distribution of 2019 patronage refunds | — | — | 474,066 | — | — | (564,096 | ) | — | (90,030 | ) | |||||||||||||||||||||
Redemptions of equities | (2,998 | ) | (20 | ) | (369 | ) | — | — | — | — | (3,387 | ) | |||||||||||||||||||
Preferred stock dividends | — | — | — | — | — | (42,167 | ) | — | (42,167 | ) | |||||||||||||||||||||
Other, net | (201 | ) | — | 3 | — | — | 10 | (324 | ) | (512 | ) | ||||||||||||||||||||
Net income | — | — | — | — | — | 125,447 | 247 | 125,694 | |||||||||||||||||||||||
Other comprehensive loss, net of tax | — | — | — | — | (10,585 | ) | — | — | (10,585 | ) | |||||||||||||||||||||
Estimated 2020 cash patronage refunds | — | — | — | — | — | (22,206 | ) | — | (22,206 | ) | |||||||||||||||||||||
Estimated 2020 equity redemptions | (49,154 | ) | — | — | — | — | — | — | (49,154 | ) | |||||||||||||||||||||
Balances, February 29, 2020 | $ | 3,613,612 | $ | 29,000 | $ | 1,206,901 | $ | 2,264,038 | $ | (239,156 | ) | $ | 1,740,983 | $ | 8,578 | $ | 8,623,956 | ||||||||||||||
Reversal of prior year redemption estimates | 67,438 | — | 10,000 | — | — | — | — | 77,438 | |||||||||||||||||||||||
Distribution of 2019 patronage refunds | — | — | 327 | — | — | (409 | ) | — | (82 | ) | |||||||||||||||||||||
Redemptions of equities | (64,273 | ) | (91 | ) | (13,074 | ) | — | — | — | — | (77,438 | ) | |||||||||||||||||||
Other, net | (1,544 | ) | (7 | ) | (116 | ) | — | — | 1,053 | 8 | (606 | ) | |||||||||||||||||||
Net income (loss) | — | — | — | — | — | 97,648 | (147 | ) | 97,501 | ||||||||||||||||||||||
Other comprehensive loss, net of tax | — | — | — | — | (2,009 | ) | — | — | (2,009 | ) | |||||||||||||||||||||
Estimated 2020 cash patronage refunds | — | — | — | — | — | 13,551 | — | 13,551 | |||||||||||||||||||||||
Estimated 2020 equity redemptions | 47,975 | — | — | — | — | — | — | 47,975 | |||||||||||||||||||||||
Balances, May 31, 2020 | $ | 3,663,208 | $ | 28,902 | $ | 1,204,038 | $ | 2,264,038 | $ | (241,165 | ) | $ | 1,852,826 | $ | 8,439 | $ | 8,780,286 | ||||||||||||||
12
Equity Certificates | Accumulated Other Comprehensive Loss | ||||||||||||||||||||||||||||||
Capital Equity Certificates | Nonpatronage Equity Certificates | Nonqualified Equity Certificates | Preferred Stock | Capital Reserves | Noncontrolling Interests | Total Equities | |||||||||||||||||||||||||
(Dollars in thousands) | |||||||||||||||||||||||||||||||
Balances, August 31, 2018 | $ | 3,837,580 | $ | 29,498 | $ | 742,378 | $ | 2,264,038 | $ | (199,915 | ) | $ | 1,482,003 | $ | 9,446 | $ | 8,165,028 | ||||||||||||||
Reversal of prior year redemption estimates | 24,072 | — | — | — | — | — | — | 24,072 | |||||||||||||||||||||||
Redemptions of equities | (22,004 | ) | (183 | ) | (1,885 | ) | — | — | — | — | (24,072 | ) | |||||||||||||||||||
Preferred stock dividends | — | — | — | — | — | (84,334 | ) | — | (84,334 | ) | |||||||||||||||||||||
Reclassification of unrealized (gain) loss on investments | — | — | — | — | (4,706 | ) | 4,706 | — | — | ||||||||||||||||||||||
Other, net | (409 | ) | — | (26 | ) | — | — | 3,436 | 318 | 3,319 | |||||||||||||||||||||
Net income (loss) | — | — | — | — | — | 347,504 | (389 | ) | 347,115 | ||||||||||||||||||||||
Other comprehensive income, net of tax | — | — | — | — | 389 | — | — | 389 | |||||||||||||||||||||||
Estimated 2019 cash patronage refunds | — | — | — | — | — | (89,344 | ) | — | (89,344 | ) | |||||||||||||||||||||
Estimated 2019 equity redemptions | (50,081 | ) | — | — | — | — | — | — | (50,081 | ) | |||||||||||||||||||||
Balances, November 30, 2018 | $ | 3,789,158 | $ | 29,315 | $ | 740,467 | $ | 2,264,038 | $ | (204,232 | ) | $ | 1,663,971 | $ | 9,375 | $ | 8,292,092 | ||||||||||||||
Reversal of prior year patronage and redemption estimates | 6,681 | — | (345,330 | ) | — | — | 420,330 | — | 81,681 | ||||||||||||||||||||||
Distribution of 2018 patronage refunds | — | — | 349,353 | — | — | (424,333 | ) | — | (74,980 | ) | |||||||||||||||||||||
Redemptions of equities | (5,988 | ) | (74 | ) | (619 | ) | — | — | — | — | (6,681 | ) | |||||||||||||||||||
Preferred stock dividends | — | — | — | — | — | (42,167 | ) | — | (42,167 | ) | |||||||||||||||||||||
Other, net | (774 | ) | — | 2,589 | — | — | (2,888 | ) | (581 | ) | (1,654 | ) | |||||||||||||||||||
Net income (loss) | — | — | — | — | — | 248,766 | (462 | ) | 248,304 | ||||||||||||||||||||||
Other comprehensive income, net of tax | — | — | — | — | 14,884 | — | — | 14,884 | |||||||||||||||||||||||
Estimated 2019 cash patronage refunds | — | — | — | — | — | (69,400 | ) | — | (69,400 | ) | |||||||||||||||||||||
Estimated 2019 equity redemptions | (39,850 | ) | — | — | — | — | — | — | (39,850 | ) | |||||||||||||||||||||
Balances, February 28, 2019 | $ | 3,749,227 | $ | 29,241 | $ | 746,460 | $ | 2,264,038 | $ | (189,348 | ) | $ | 1,794,279 | $ | 8,332 | $ | 8,402,229 | ||||||||||||||
Reversal of prior year redemption estimates | 45,815 | — | — | — | — | — | — | 45,815 | |||||||||||||||||||||||
Distribution of 2018 patronage refunds | — | — | 3,212 | — | — | (3,901 | ) | — | (689 | ) | |||||||||||||||||||||
Redemptions of equities | (34,798 | ) | (34 | ) | (10,812 | ) | — | — | — | — | (45,644 | ) | |||||||||||||||||||
Other, net | (1,285 | ) | — | (3,722 | ) | — | — | 4,526 | 11 | (470 | ) | ||||||||||||||||||||
Net income (loss) | — | — | — | — | — | 54,620 | 93 | 54,713 | |||||||||||||||||||||||
Other comprehensive loss, net of tax | — | — | — | — | (22,313 | ) | — | — | (22,313 | ) | |||||||||||||||||||||
Estimated 2019 cash patronage refunds | — | — | — | — | — | (15,494 | ) | — | (15,494 | ) | |||||||||||||||||||||
Estimated 2019 equity redemptions | (6,438 | ) | — | — | — | — | — | — | (6,438 | ) | |||||||||||||||||||||
Balances, May 31, 2019 | $ | 3,752,521 | $ | 29,207 | $ | 735,138 | $ | 2,264,038 | $ | (211,661 | ) | $ | 1,834,030 | $ | 8,436 | $ | 8,411,709 | ||||||||||||||
Preferred Stock Dividends
The following is a summary of dividends per share by series of preferred stock for the nine months ended May 31, 2020, and 2019. Note that due to the timing of dividend declarations during the fiscal year, no declarations were made during the third quarter of fiscal 2020 or fiscal 2019.
Nine Months Ended May 31, | |||||||||
Nasdaq symbol | 2020 | 2019 | |||||||
Series of preferred stock: | (Dollars per share) | ||||||||
8% Cumulative Redeemable | CHSCP | $ | 1.50 | $ | 1.50 | ||||
Class B Cumulative Redeemable, Series 1 | CHSCO | 1.48 | 1.48 | ||||||
Class B Reset Rate Cumulative Redeemable, Series 2 | CHSCN | 1.33 | 1.33 | ||||||
Class B Reset Rate Cumulative Redeemable, Series 3 | CHSCM | 1.27 | 1.27 | ||||||
Class B Cumulative Redeemable, Series 4 | CHSCL | 1.41 | 1.41 | ||||||
13
Accumulated Other Comprehensive Income (Loss)
Changes in accumulated other comprehensive income (loss) by component, net of tax, are as follows for the nine months ended May 31, 2020, and 2019:
Pension and Other Postretirement Benefits | Cash Flow Hedges | Foreign Currency Translation Adjustment | Total | ||||||||||||
(Dollars in thousands) | |||||||||||||||
Balance as of August 31, 2019, net of tax | $ | (172,478 | ) | $ | 15,297 | $ | (69,752 | ) | $ | (226,933 | ) | ||||
Other comprehensive income (loss), before tax: | |||||||||||||||
Amounts before reclassifications | (85 | ) | (3,331 | ) | (2,411 | ) | (5,827 | ) | |||||||
Amounts reclassified | 4,977 | (4,473 | ) | — | 504 | ||||||||||
Total other comprehensive income (loss), before tax | 4,892 | (7,804 | ) | (2,411 | ) | (5,323 | ) | ||||||||
Tax effect | 181 | 1,932 | 1,572 | 3,685 | |||||||||||
Other comprehensive income (loss), net of tax | 5,073 | (5,872 | ) | (839 | ) | (1,638 | ) | ||||||||
Balance as of November 30, 2019, net of tax | $ | (167,405 | ) | $ | 9,425 | $ | (70,591 | ) | $ | (228,571 | ) | ||||
Other comprehensive income (loss), before tax: | |||||||||||||||
Amounts before reclassifications | — | (5,975 | ) | (8,540 | ) | (14,515 | ) | ||||||||
Amounts reclassified | 4,977 | (1,747 | ) | — | 3,230 | ||||||||||
Total other comprehensive income (loss), before tax | 4,977 | (7,722 | ) | (8,540 | ) | (11,285 | ) | ||||||||
Tax effect | (1,231 | ) | 1,910 | 21 | 700 | ||||||||||
Other comprehensive income (loss), net of tax | 3,746 | (5,812 | ) | (8,519 | ) | (10,585 | ) | ||||||||
Balance as of February 29, 2020, net of tax | $ | (163,659 | ) | $ | 3,613 | $ | (79,110 | ) | $ | (239,156 | ) | ||||
Other comprehensive income (loss), before tax: | |||||||||||||||
Amounts before reclassifications | (340 | ) | 7,795 | (12,515 | ) | (5,060 | ) | ||||||||
Amounts reclassified | 4,977 | 1,263 | — | 6,240 | |||||||||||
Total other comprehensive income (loss), before tax | 4,637 | 9,058 | (12,515 | ) | 1,180 | ||||||||||
Tax effect | (1,147 | ) | (2,241 | ) | 199 | (3,189 | ) | ||||||||
Other comprehensive income (loss), net of tax | 3,490 | 6,817 | (12,316 | ) | (2,009 | ) | |||||||||
Balance as of May 31, 2020, net of tax | $ | (160,169 | ) | $ | 10,430 | $ | (91,426 | ) | $ | (241,165 | ) | ||||
14
Pension and Other Postretirement Benefits | Unrealized Net Gain on Available for Sale Investments | Cash Flow Hedges | Foreign Currency Translation Adjustment | Total | |||||||||||||||
(Dollars in thousands) | |||||||||||||||||||
Balance as of August 31, 2018, net of tax | $ | (140,335 | ) | $ | 8,861 | $ | (5,882 | ) | $ | (62,559 | ) | $ | (199,915 | ) | |||||
Other comprehensive income (loss), before tax: | |||||||||||||||||||
Amounts before reclassifications | 175 | — | (317 | ) | (25 | ) | (167 | ) | |||||||||||
Amounts reclassified | 2,565 | — | (1,475 | ) | — | 1,090 | |||||||||||||
Total other comprehensive income (loss), before tax | 2,740 | — | (1,792 | ) | (25 | ) | 923 | ||||||||||||
Tax effect | (639 | ) | — | 485 | (380 | ) | (534 | ) | |||||||||||
Other comprehensive income (loss), net of tax | 2,101 | — | (1,307 | ) | (405 | ) | 389 | ||||||||||||
Reclassifications | 416 | (8,861 | ) | 983 | 2,756 | (4,706 | ) | ||||||||||||
Balance as of November 30, 2018, net of tax | $ | (137,818 | ) | $ | — | $ | (6,206 | ) | $ | (60,208 | ) | $ | (204,232 | ) | |||||
Other comprehensive income (loss), before tax: | |||||||||||||||||||
Amounts before reclassifications | 102 | — | 18,954 | 3,176 | 22,232 | ||||||||||||||
Amounts reclassified | 2,564 | — | (5,677 | ) | — | (3,113 | ) | ||||||||||||
Total other comprehensive income (loss), before tax | 2,666 | — | 13,277 | 3,176 | 19,119 | ||||||||||||||
Tax effect | (664 | ) | — | (3,308 | ) | (263 | ) | (4,235 | ) | ||||||||||
Other comprehensive income, net of tax | 2,002 | — | 9,969 | 2,913 | 14,884 | ||||||||||||||
Balance as of February 28, 2019, net of tax | $ | (135,816 | ) | $ | — | $ | 3,763 | $ | (57,295 | ) | $ | (189,348 | ) | ||||||
Other comprehensive income (loss), before tax: | |||||||||||||||||||
Amounts before reclassifications | (164 | ) | — | (19,680 | ) | (7,725 | ) | (27,569 | ) | ||||||||||
Amounts reclassified | 2,564 | — | (1,385 | ) | — | 1,179 | |||||||||||||
Total other comprehensive income (loss), before tax | 2,400 | — | (21,065 | ) | (7,725 | ) | (26,390 | ) | |||||||||||
Tax effect | (904 | ) | — | 5,248 | (267 | ) | 4,077 | ||||||||||||
Other comprehensive income (loss), net of tax | 1,496 | — | (15,817 | ) | (7,992 | ) | (22,313 | ) | |||||||||||
Balance as of May 31, 2019, net of tax | $ | (134,320 | ) | $ | — | $ | (12,054 | ) | $ | (65,287 | ) | $ | (211,661 | ) | |||||
Amounts reclassified from accumulated other comprehensive income (loss) were related to pension and other postretirement benefits, cash flow hedges, available-for-sale investments and foreign currency translation adjustments. Pension and other postretirement reclassifications include amortization of net actuarial loss, prior service credit and transition amounts and are recorded as cost of goods sold, marketing, general and administrative expenses, and other income (see Note 8, Benefit Plans, for further information). Gains or losses associated with cash flow hedges are recorded as cost of goods sold (see Note 11, Derivative Financial Instruments and Hedging Activities, for further information). Gains or losses on the sale of available-for-sale investments and foreign currency translation reclassifications related to sales of businesses are recorded as other income.
Note 8 Benefit Plans
We have various pension and other defined benefit and defined contribution plans, in which substantially all employees may participate. We also have nonqualified supplemental executive and Board retirement plans.
15
Components of net periodic benefit costs for the three and nine months ended May 31, 2020, and 2019, are as follows:
Three Months Ended May 31, | |||||||||||||||||||||||
Qualified Pension Benefits | Nonqualified Pension Benefits | Other Benefits | |||||||||||||||||||||
2020 | 2019 | 2020 | 2019 | 2020 | 2019 | ||||||||||||||||||
Components of net periodic benefit costs: | (Dollars in thousands) | ||||||||||||||||||||||
Service cost | $ | 10,538 | $ | 9,648 | $ | 101 | $ | 78 | $ | 262 | $ | 263 | |||||||||||
Interest cost | 5,431 | 7,099 | 107 | 186 | 187 | 274 | |||||||||||||||||
Expected return on assets | (11,671 | ) | (11,242 | ) | — | — | — | — | |||||||||||||||
Prior service cost (credit) amortization | 45 | 42 | (28 | ) | (19 | ) | (111 | ) | (139 | ) | |||||||||||||
Actuarial loss (gain) amortization | 5,396 | 3,087 | 25 | 1 | (348 | ) | (407 | ) | |||||||||||||||
Net periodic benefit cost | $ | 9,739 | $ | 8,634 | $ | 205 | $ | 246 | $ | (10 | ) | $ | (9 | ) | |||||||||
Nine Months Ended May 31, | |||||||||||||||||||||||
Qualified Pension Benefits | Nonqualified Pension Benefits | Other Benefits | |||||||||||||||||||||
2020 | 2019 | 2020 | 2019 | 2020 | 2019 | ||||||||||||||||||
Components of net periodic benefit costs: | (Dollars in thousands) | ||||||||||||||||||||||
Service cost | $ | 31,613 | $ | 28,944 | $ | 304 | $ | 233 | $ | 787 | $ | 790 | |||||||||||
Interest cost | 16,292 | 21,297 | 322 | 560 | 560 | 821 | |||||||||||||||||
Expected return on assets | (35,013 | ) | (33,726 | ) | — | — | — | — | |||||||||||||||
Prior service cost (credit) amortization | 134 | 127 | (85 | ) | (56 | ) | (334 | ) | (417 | ) | |||||||||||||
Actuarial loss (gain) amortization | 16,187 | 9,261 | 74 | 2 | (1,044 | ) | (1,221 | ) | |||||||||||||||
Settlement loss | — | 169 | — | — | — | — | |||||||||||||||||
Net periodic benefit cost | $ | 29,213 | $ | 26,072 | $ | 615 | $ | 739 | $ | (31 | ) | $ | (27 | ) | |||||||||
The service cost component of defined benefit net periodic benefit cost is recorded in cost of goods sold and marketing, general and administrative expenses. The other components of net periodic benefit cost are recorded in other income.
Employer Contributions
Any contributions made during fiscal 2020 will depend primarily on market returns on the pension plan assets and minimum funding level requirements. No contributions were made to the pension plans during the nine months ended May 31, 2020, and we do not currently anticipate being required to make contributions for our pension plans in fiscal 2020.
Note 9 Income Taxes
Our effective tax rate for the three months ended May 31, 2020, was (38.4)%, compared to 11.1% for the three months ended May 31, 2019. Our effective tax rate for the nine months ended May 31, 2020, was (4.8)%, compared to 5.9% for the nine months ended May 31, 2019. The decreased effective tax rate reflects a tax benefit for the settlement of a U.S. federal audit resulting in additional tax credit carryovers, as well as the equity management assumptions used in fiscal 2020 and the associated impact on income taxes.
It is reasonably possible that the amount of unrecognized tax benefits could significantly change within the next 12 months. We have ongoing federal, state and international income tax audits in various jurisdictions and are evaluating uncertain tax positions that may be challenged by local tax authorities and not fully sustained. These uncertain tax positions are reviewed on an ongoing basis and adjusted in light of facts and circumstances, including progression of tax audits, developments in case law and closing of statutes of limitation. The total amounts of unrecognized tax benefits that, if recognized, would affect the effective tax rate as of May 31, 2020, and August 31, 2019, are $111.1 million and $93.3 million, respectively.
16
Note 10 Segment Reporting
We are an integrated agricultural enterprise, providing grain, foods and energy resources to businesses and consumers on a global basis. We provide a wide variety of products and services, from initial agricultural inputs such as fuels, farm supplies, crop nutrient and crop protection products, to agricultural outputs that include grains and oilseeds, grain and oilseed processing and food products, and the production and marketing of ethanol. We define our operating segments in accordance with ASC Topic 280, Segment Reporting, to reflect the manner in which our chief operating decision-maker, our Chief Executive Officer, evaluates performance and allocates resources in managing our businesses. We have aggregated those operating segments into three reportable segments: Energy, Ag and Nitrogen Production.
Our Energy segment produces and provides primarily for the wholesale distribution of petroleum products and transportation of those products. Our Ag segment purchases and further processes or resells grains and oilseeds originated by our country operations business, by our member cooperatives and by third parties; serves as a wholesaler and retailer of crop inputs; and produces and markets ethanol. Our Nitrogen Production segment consists solely of our equity method investment in CF Nitrogen, which entitles us, pursuant to a supply agreement that we entered into with CF Nitrogen, to purchase up to a specified quantity of granular urea and urea ammonium nitrate ("UAN") annually from CF Nitrogen. Corporate and Other represents our financing and hedging businesses, which primarily consist of commodities hedging and financial services related to crop production. Our nonconsolidated investments in Ventura Foods and Ardent Mills are also included in Corporate and Other.
Corporate administrative expenses and interest are allocated to each business segment and Corporate and Other, based on direct usage for services that can be tracked, such as information technology and legal, and other factors or considerations relevant to the costs incurred.
Many of our business activities are highly seasonal and operating results vary throughout the year. For example, in our Ag segment, our country operations business generally experiences higher volumes and income during the spring planting season and the fall harvest season, and our agronomy business generally experiences higher volumes and income during the spring planting season. Our global grain marketing operations are subject to fluctuations in volume and earnings based on producer harvests, world grain prices and demand. Our Energy segment generally experiences higher volumes and profitability in certain operating areas, such as refined products, in the summer and early fall when gasoline and diesel fuel usage is highest and is subject to global supply and demand forces. Other energy products, such as propane, may experience higher volumes and profitability during the winter heating and crop-drying seasons.
Our revenues, assets and cash flows can be significantly affected by global market prices for commodities such as petroleum products, natural gas, grains, oilseeds, crop nutrients and flour. Changes in market prices for commodities that we purchase without a corresponding change in the selling prices of those products can affect revenues and operating earnings. Commodity prices are affected by a wide range of factors beyond our control, including weather, crop damage due to plant disease or insects, drought, availability and adequacy of supply, government regulations and policies, world events, and general political and economic conditions.
While our revenues and operating results are derived primarily from businesses and operations that are wholly-owned or subsidiaries and limited liability companies in which we have a controlling interest, a portion of our business operations are conducted through companies in which we hold ownership interests of 50% or less or do not control the operations. See Note 5, Investments, for more information on these entities.
Reconciling amounts primarily represent the elimination of revenues between segments. Such transactions are executed at market prices to more accurately evaluate the profitability of individual business segments.
17
Segment information for the three and nine months ended May 31, 2020, and 2019, is presented in the tables below. Our Ag segment information includes results associated with our acquisition of the remaining 75% ownership interest in West Central Distribution, LLC ("WCD") that we did not previously own prior to March 1, 2019. Results are comparable for the three months ended May 31, 2020, and 2019; however, results for the nine months ended May 31, 2020, and 2019, are not comparable as the results of WCD were not included during the first six months of fiscal 2019. Refer to further details related to our acquisition of the remaining 75% ownership interest in WCD that we did not previously own in Note 15, Acquisitions.
Energy | Ag | Nitrogen Production | Corporate and Other | Reconciling Amounts | Total | ||||||||||||||||||
Three Months Ended May 31, 2020 | (Dollars in thousands) | ||||||||||||||||||||||
Revenues, including intersegment revenues | $ | 960,352 | $ | 6,340,386 | $ | — | $ | 13,515 | $ | (73,222 | ) | $ | 7,241,031 | ||||||||||
Intersegment revenues | (69,433 | ) | (2,485 | ) | — | (1,304 | ) | 73,222 | — | ||||||||||||||
Revenues, net of intersegment revenues | $ | 890,919 | $ | 6,337,901 | $ | — | $ | 12,211 | $ | — | $ | 7,241,031 | |||||||||||
Operating earnings (loss) | (56,792 | ) | 95,328 | (7,936 | ) | 7,320 | — | 37,920 | |||||||||||||||
Interest expense | (145 | ) | 16,261 | 10,176 | 1,810 | (1,441 | ) | 26,661 | |||||||||||||||
Other income | (614 | ) | (8,294 | ) | (355 | ) | (254 | ) | 1,441 | (8,076 | ) | ||||||||||||
Equity income from investments | (1,269 | ) | (7,999 | ) | (41,264 | ) | (582 | ) | — | (51,114 | ) | ||||||||||||
Income (loss) before income taxes | $ | (54,764 | ) | $ | 95,360 | $ | 23,507 | $ | 6,346 | $ | — | $ | 70,449 | ||||||||||
Energy | Ag | Nitrogen Production | Corporate and Other | Reconciling Amounts | Total | ||||||||||||||||||
Three Months Ended May 31, 2019 | (Dollars in thousands) | ||||||||||||||||||||||
Revenues, including intersegment revenues | $ | 1,841,290 | $ | 6,749,182 | $ | — | $ | 16,418 | $ | (108,949 | ) | $ | 8,497,941 | ||||||||||
Intersegment revenues | (103,245 | ) | (4,067 | ) | — | (1,637 | ) | 108,949 | — | ||||||||||||||
Revenues, net of intersegment revenues | $ | 1,738,045 | $ | 6,745,115 | $ | — | $ | 14,781 | $ | — | $ | 8,497,941 | |||||||||||
Operating earnings (loss) | 572 | 12,090 | (9,040 | ) | 2,622 | — | 6,244 | ||||||||||||||||
Interest expense | 1,171 | 26,675 | 13,140 | 3,883 | (2,096 | ) | 42,773 | ||||||||||||||||
Other income | (1,098 | ) | (31,685 | ) | (399 | ) | (1,852 | ) | 2,096 | (32,938 | ) | ||||||||||||
Equity income from investments | (760 | ) | (4,012 | ) | (41,959 | ) | (18,439 | ) | — | (65,170 | ) | ||||||||||||
Income before income taxes | $ | 1,259 | $ | 21,112 | $ | 20,178 | $ | 19,030 | $ | — | $ | 61,579 | |||||||||||
Energy | Ag | Nitrogen Production | Corporate and Other | Reconciling Amounts | Total | ||||||||||||||||||
Nine Months Ended May 31, 2020 | (Dollars in thousands) | ||||||||||||||||||||||
Revenues, including intersegment revenues | $ | 4,550,155 | $ | 17,183,820 | $ | — | $ | 43,514 | $ | (316,747 | ) | $ | 21,460,742 | ||||||||||
Intersegment revenues | (302,763 | ) | (9,862 | ) | — | (4,122 | ) | 316,747 | — | ||||||||||||||
Revenues, net of intersegment revenues | $ | 4,247,392 | $ | 17,173,958 | $ | — | $ | 39,392 | $ | — | $ | 21,460,742 | |||||||||||
Operating earnings (loss) | 241,594 | 88,102 | (26,318 | ) | 7,239 | — | 310,617 | ||||||||||||||||
Interest expense | 43 | 57,761 | 34,277 | 8,680 | (5,718 | ) | 95,043 | ||||||||||||||||
Other income | (2,516 | ) | (31,142 | ) | (2,272 | ) | (2,714 | ) | 5,718 | (32,926 | ) | ||||||||||||
Equity (income) loss from investments | (2,242 | ) | 830 | (104,021 | ) | (29,741 | ) | — | (135,174 | ) | |||||||||||||
Income before income taxes | $ | 246,309 | $ | 60,653 | $ | 45,698 | $ | 31,014 | $ | — | $ | 383,674 | |||||||||||
Total assets as of May 31, 2020 | $ | 4,545,401 | $ | 6,742,438 | $ | 2,743,305 | $ | 2,796,080 | $ | — | $ | 16,827,224 | |||||||||||
Energy | Ag | Nitrogen Production | Corporate and Other | Reconciling Amounts | Total | ||||||||||||||||||
Nine Months Ended May 31, 2019 | (Dollars in thousands) | ||||||||||||||||||||||
Revenues, including intersegment revenues | $ | 5,722,338 | $ | 18,056,033 | $ | — | $ | 52,179 | $ | (364,781 | ) | $ | 23,465,769 | ||||||||||
Intersegment revenues | (348,228 | ) | (10,976 | ) | — | (5,577 | ) | 364,781 | — | ||||||||||||||
Revenues, net of intersegment revenues | $ | 5,374,110 | $ | 18,045,057 | $ | — | $ | 46,602 | $ | — | $ | 23,465,769 | |||||||||||
Operating earnings (loss) | 537,932 | 45,088 | (24,048 | ) | 11,415 | — | 570,387 | ||||||||||||||||
Interest expense | 3,756 | 73,073 | 42,161 | 7,945 | (3,985 | ) | 122,950 | ||||||||||||||||
Other income | (4,301 | ) | (64,341 | ) | (2,362 | ) | (2,816 | ) | 3,985 | (69,835 | ) | ||||||||||||
Equity (income) loss from investments | (1,828 | ) | (2,675 | ) | (118,416 | ) | (50,475 | ) | — | (173,394 | ) | ||||||||||||
Income before income taxes | $ | 540,305 | $ | 39,031 | $ | 54,569 | $ | 56,761 | $ | — | $ | 690,666 | |||||||||||
18
Note 11 Derivative Financial Instruments and Hedging Activities
Our derivative instruments primarily consist of commodity and forward contracts and, to a minor degree, may include foreign currency and interest rate swap contracts. These contracts are economic hedges of price risk, but we do not apply hedge accounting under ASC Topic 815, except with respect to certain interest rate swap contracts accounted for as fair value hedges and certain future crude oil purchases that are accounted for as cash flow hedges. Derivative instruments are primarily recorded within other current assets and other current liabilities on our Condensed Consolidated Balance Sheets at fair value as described in Note 12, Fair Value Measurements.
Derivatives Not Designated as Hedging Instruments
The following tables present the gross fair values of derivative assets, derivative liabilities and margin deposits (cash collateral) recorded on our Condensed Consolidated Balance Sheets, along with related amounts permitted to be offset in accordance with U.S. GAAP. We have elected not to offset derivative assets and liabilities when we have the right of offset under ASC Topic 210-20, Balance Sheet - Offsetting, or when the instruments are subject to master netting arrangements under ASC Topic 815-10-45, Derivatives and Hedging - Overall.
May 31, 2020 | |||||||||||||||
Amounts Not Offset on Condensed Consolidated Balance Sheet but Eligible for Offsetting | |||||||||||||||
Gross Amount Recognized | Cash Collateral | Derivative Instruments | Net Amount | ||||||||||||
(Dollars in thousands) | |||||||||||||||
Derivative Assets | |||||||||||||||
Commodity derivatives | $ | 377,198 | $ | — | $ | 48,562 | $ | 328,636 | |||||||
Foreign exchange derivatives | 13,828 | — | 11,728 | 2,100 | |||||||||||
Embedded derivative asset | 18,636 | — | — | 18,636 | |||||||||||
Total | $ | 409,662 | $ | — | $ | 60,290 | $ | 349,372 | |||||||
Derivative Liabilities | |||||||||||||||
Commodity derivatives | $ | 282,505 | $ | 1,487 | $ | 95,559 | $ | 185,459 | |||||||
Foreign exchange derivatives | 92,962 | — | 11,728 | 81,234 | |||||||||||
Total | $ | 375,467 | $ | 1,487 | $ | 107,287 | $ | 266,693 | |||||||
August 31, 2019 | |||||||||||||||
Amounts Not Offset on Condensed Consolidated Balance Sheet but Eligible for Offsetting | |||||||||||||||
Gross Amount Recognized | Cash Collateral | Derivative Instruments | Net Amount | ||||||||||||
(Dollars in thousands) | |||||||||||||||
Derivative Assets | |||||||||||||||
Commodity derivatives | $ | 215,030 | $ | — | $ | 58,726 | $ | 156,304 | |||||||
Foreign exchange derivatives | 10,334 | — | 7,108 | 3,226 | |||||||||||
Embedded derivative asset | 21,364 | — | — | 21,364 | |||||||||||
Total | $ | 246,728 | $ | — | $ | 65,834 | $ | 180,894 | |||||||
Derivative Liabilities | |||||||||||||||
Commodity derivatives | $ | 223,410 | $ | 4,191 | $ | 41,647 | $ | 177,572 | |||||||
Foreign exchange derivatives | 20,609 | — | 7,108 | 13,501 | |||||||||||
Total | $ | 244,019 | $ | 4,191 | $ | 48,755 | $ | 191,073 | |||||||
Derivative assets and liabilities with maturities of 12 months or less are recorded in other current assets and other current liabilities, respectively, on our Condensed Consolidated Balance Sheets. Derivative assets and liabilities with maturities greater than 12 months are recorded in other assets and other liabilities, respectively, on our Condensed Consolidated Balance Sheets. The amount of long-term derivative assets, excluding derivatives designated as cash flow or fair value hedges, recorded on our Condensed Consolidated Balance Sheets as of May 31, 2020, and August 31, 2019, was $25.3 million and $26.6 million, respectively. The amount of long-term derivative liabilities, excluding derivatives designated as cash flow or fair value hedges,
19
recorded on our Condensed Consolidated Balance Sheets as of May 31, 2020, and August 31, 2019, was $9.0 million and $7.4 million, respectively.
The majority of our derivative instruments have not been designated as hedging instruments. The following table sets forth the pretax gains (losses) on derivatives not accounted for as hedging instruments that have been included in our Condensed Consolidated Statements of Operations for the three and nine months ended May 31, 2020, and 2019.
Three Months Ended May 31, | Nine Months Ended May 31, | ||||||||||||||||
Location of Gain (Loss) | 2020 | 2019 | 2020 | 2019 | |||||||||||||
(Dollars in thousands) | |||||||||||||||||
Commodity derivatives | Cost of goods sold | $ | 85,259 | $ | (23,749 | ) | $ | 228,201 | $ | 41,814 | |||||||
Foreign exchange derivatives | Cost of goods sold | (129,699 | ) | (13,040 | ) | (177,008 | ) | 14,941 | |||||||||
Foreign exchange derivatives | Marketing, general and administrative expenses | (2,553 | ) | (7 | ) | (615 | ) | (1,421 | ) | ||||||||
Embedded derivative | Other income | 355 | 399 | 2,272 | 2,362 | ||||||||||||
Total | $ | (46,638 | ) | $ | (36,397 | ) | $ | 52,850 | $ | 57,696 | |||||||
Commodity Contracts
As of May 31, 2020, and August 31, 2019, we had outstanding commodity futures and options contracts that were used as economic hedges, as well as fixed-price forward contracts related to physical purchases and sales of commodities. The table below presents the notional volumes for all outstanding commodity contracts accounted for as derivative instruments.
May 31, 2020 | August 31, 2019 | ||||||||||
Long | Short | Long | Short | ||||||||
(Units in thousands) | |||||||||||
Grain and oilseed (bushels) | 673,234 | 788,434 | 547,096 | 717,522 | |||||||
Energy products (barrels) | 18,970 | 9,168 | 13,895 | 4,663 | |||||||
Processed grain and oilseed (tons) | 858 | 1,686 | 597 | 2,454 | |||||||
Crop nutrients (tons) | 144 | — | 76 | 23 | |||||||
Ocean freight (metric tons) | 435 | 250 | 295 | 85 | |||||||
Natural gas (MMBtu) | — | — | 130 | — | |||||||
Foreign Exchange Contracts
We conduct a substantial portion of our business in U.S. dollars, but we are exposed to risks relating to foreign currency fluctuations primarily due to global grain marketing transactions in South America, the Asia Pacific region and Europe, and purchases of products from Canada. We use foreign currency derivative instruments to mitigate the impact of exchange rate fluctuations. Although we have some risk exposure related to foreign currency transactions, a larger impact with exchange rate fluctuations is the ability of foreign buyers to purchase U.S. agricultural products and the competitiveness of U.S. agricultural products compared to the same products offered by alternative sources of world supply. The notional amounts of our foreign exchange derivative contracts were $1.5 billion and $894.7 million as of May 31, 2020, and August 31, 2019, respectively.
Embedded Derivative Asset
Under the terms of our strategic investment in CF Nitrogen, if the CF Industries credit rating is reduced below certain levels by two of three specified credit ratings agencies, we are entitled to receive a nonrefundable annual payment of $5.0 million from CF Industries. These payments will continue on an annual basis until the date that the CF Industries credit rating is upgraded to or above certain levels by two of the three specified credit ratings agencies or February 1, 2026, whichever is earlier.
Since the CF Industries credit rating was reduced below the specified levels during fiscal 2017, we have received an annual payment of $5.0 million from CF Industries. Gains totaling $2.3 million and $2.4 million were recognized in other income in our Condensed Consolidated Statements of Operations for the nine months ended May 31, 2020, and 2019, respectively. The fair value of the embedded derivative asset recorded on our Condensed Consolidated Balance Sheet as of May 31, 2020, was equal to $18.6 million. The current and long-term portions of the embedded derivative asset are included in
20
other current assets and other assets on our Condensed Consolidated Balance Sheets, respectively. See Note 12, Fair Value Measurements, for additional information regarding valuation of the embedded derivative asset.
Derivatives Designated as Fair Value or Cash Flow Hedging Strategies
Fair Value Hedges
During the third quarter of fiscal 2020, we unwound all our interest rate swaps resulting in a $16.4 million gain, which is being amortized over the life of the fixed-rate debt for which the swaps had previously been designated as fair value hedges, through fiscal 2025. As of August 31, 2019, we had outstanding interest rate swaps with an aggregate notional amount of $365.0 million designated as fair value hedges of portions of our fixed-rate debt. Our objective in entering into these transactions was to offset changes in the fair value of the debt associated with the risk of variability in the three-month U.S. dollar LIBOR interest rate ("LIBOR"), in essence converting the fixed-rate debt to variable-rate debt. Under these interest rate swaps, we received fixed-rate interest payments and made interest payments based on the three-month LIBOR. Offsetting changes in the fair values of both the swap instruments and the hedged debt were recorded contemporaneously each period and only created an impact to earnings to the extent the hedge was ineffective.
The following table presents the fair value of our derivative interest rate swap instruments designated as fair value hedges and the line item on our Condensed Consolidated Balance Sheets in which they are recorded.
Balance Sheet Location | May 31, 2020 | August 31, 2019 | ||||||
(Dollars in thousands) | ||||||||
Other assets | $ | — | $ | 9,841 | ||||
The following table sets forth the pretax gains (losses) on derivatives accounted for as hedging instruments that have been included in our Condensed Consolidated Statements of Operations for the three and nine months ended May 31, 2020, and 2019.
Three Months Ended May 31, | Nine Months Ended May 31, | |||||||||||||||||
Gain (Loss) on Fair Value Hedging Relationships | Location of Gain (Loss) | 2020 | 2019 | 2020 | 2019 | |||||||||||||
(Dollars in thousands) | ||||||||||||||||||
Interest rate swaps | Interest expense | $ | (4,705 | ) | $ | (8,122 | ) | $ | (1,897 | ) | $ | (15,129 | ) | |||||
Hedged item | Interest expense | 4,705 | 8,122 | 1,897 | 15,129 | |||||||||||||
Total | $ | — | $ | — | $ | — | $ | — | ||||||||||
The following table provides the location and carrying amount of hedged liabilities in our Condensed Consolidated Balance Sheets as of May 31, 2020, and August 31, 2019.
May 31, 2020 | August 31, 2019 | |||||||||||||||
Balance Sheet Location | Carrying Amount of Hedged Liabilities | Cumulative Amount of Fair Value Hedging Adjustments Included in Carrying Amount of Hedged Liabilities | Carrying Amount of Hedged Liabilities | Cumulative Amount of Fair Value Hedging Adjustments Included in Carrying Amount of Hedged Liabilities | ||||||||||||
(Dollars in thousands) | ||||||||||||||||
Long-term debt | $ | — | $ | — | $ | 334,389 | $ | 30,611 | ||||||||
Cash Flow Hedges
In fiscal 2018, our Energy segment began designating certain pay-fixed, receive-variable, cash-settled swaps as cash flow hedges of future crude oil purchases. We also began designating certain pay-variable, receive-fixed, cash-settled swaps as cash flow hedges of future refined product sales. These hedging instruments and the related hedged items are exposed to significant market price risk and potential volatility. As part of our risk management strategy, we look to hedge a portion of our expected future crude oil needs and the resulting refined product output based on prevailing futures prices, management's expectations about future commodity price changes and our risk appetite. As of May 31, 2020, and August 31, 2019, the aggregate notional amount of cash flow hedges was 10.0 million and 7.7 million barrels, respectively.
21
The following table presents the fair value of our commodity derivative instruments designated as cash flow hedges and the line items on our Condensed Consolidated Balance Sheets in which they are recorded.
Derivative Assets | Derivative Liabilities | |||||||||||||||||
Balance Sheet Location | May 31, 2020 | August 31, 2019 | Balance Sheet Location | May 31, 2020 | August 31, 2019 | |||||||||||||
(Dollars in thousands) | (Dollars in thousands) | |||||||||||||||||
Other current assets | $ | 39,620 | $ | 33,179 | Other current liabilities | $ | 15,945 | $ | 5,351 | |||||||||
The following table presents the pretax gains (losses) recorded in other comprehensive income relating to cash flow hedges for the three and nine months ended May 31, 2020, and 2019:
Three Months Ended May 31, | Nine Months Ended May 31, | |||||||||||||||
2020 | 2019 | 2020 | 2019 | |||||||||||||
(Dollars in thousands) | ||||||||||||||||
Commodity derivatives | $ | 11,081 | $ | (21,029 | ) | $ | (4,153 | ) | $ | (9,323 | ) | |||||
The following table presents the pretax gains relating to cash flow hedges that were reclassified from accumulated other comprehensive loss into our Condensed Consolidated Statements of Operations for the three and nine months ended May 31, 2020, and 2019:
Three Months Ended May 31, | Nine Months Ended May 31, | ||||||||||||||||
Location of Gain | 2020 | 2019 | 2020 | 2019 | |||||||||||||
(Dollars in thousands) | |||||||||||||||||
Commodity derivatives | Cost of goods sold | $ | 884 | $ | 1,810 | $ | 7,862 | $ | 9,812 | ||||||||
Note 12 Fair Value Measurements
ASC Topic 820, Fair Value Measurements and Disclosures, defines fair value as the price that would be received for an asset or paid to transfer a liability (an exit price) in the principal or most advantageous market for the asset or liability in an orderly transaction between market participants on the measurement date. The standard also establishes a hierarchy for inputs used in measuring fair value, which requires an entity to maximize use of observable inputs and minimize use of unobservable inputs when measuring fair value. Observable inputs are inputs or market data that a market participant would obtain from independent sources to value the asset or liability. Unobservable inputs are inputs that reflect our assumptions about the factors market participants would use in valuing the asset or liability developed based on the best information available in the circumstances. The fair value hierarchy consists of three levels: Level 1 inputs are quoted prices (unadjusted) in active markets for identical assets or liabilities. Level 2 inputs include quoted prices for similar assets or liabilities in active markets, quoted prices for identical or similar assets or liabilities in markets that are not active, and inputs (other than quoted prices) that are observable for the asset or liability, either directly or indirectly. Level 3 inputs are unobservable inputs for the asset or liability. Categorization within the valuation hierarchy is based upon the lowest level of input that is significant to the fair value measurement.
22
Recurring fair value measurements as of May 31, 2020, and August 31, 2019, are as follows:
May 31, 2020 | |||||||||||||||
Quoted Prices in Active Markets for Identical Assets (Level 1) | Significant Other Observable Inputs (Level 2) | Significant Unobservable Inputs (Level 3) | Total | ||||||||||||
(Dollars in thousands) | |||||||||||||||
Assets | |||||||||||||||
Commodity derivatives | $ | 43,785 | $ | 373,033 | $ | — | $ | 416,818 | |||||||
Foreign exchange derivatives | — | 13,733 | — | 13,733 | |||||||||||
Deferred compensation assets | 44,668 | — | — | 44,668 | |||||||||||
Embedded derivative asset | — | 18,636 | — | 18,636 | |||||||||||
Segregated investments | 94,233 | — | — | 94,233 | |||||||||||
Other assets | 5,478 | — | — | 5,478 | |||||||||||
Total | $ | 188,164 | $ | 405,402 | $ | — | $ | 593,566 | |||||||
Liabilities | |||||||||||||||
Commodity derivatives | $ | 89,891 | $ | 208,559 | $ | — | $ | 298,450 | |||||||
Foreign exchange derivatives | — | 92,962 | — | 92,962 | |||||||||||
Total | $ | 89,891 | $ | 301,521 | $ | — | $ | 391,412 | |||||||
August 31, 2019 | |||||||||||||||
Quoted Prices in Active Markets for Identical Assets (Level 1) | Significant Other Observable Inputs (Level 2) | Significant Unobservable Inputs (Level 3) | Total | ||||||||||||
(Dollars in thousands) | |||||||||||||||
Assets | |||||||||||||||
Commodity derivatives | $ | 67,817 | $ | 180,392 | $ | — | $ | 248,209 | |||||||
Foreign exchange derivatives | — | 10,339 | — | 10,339 | |||||||||||
Interest rate swap derivatives | — | 9,841 | — | 9,841 | |||||||||||
Deferred compensation assets | 40,368 | — | — | 40,368 | |||||||||||
Embedded derivative asset | — | 21,364 | — | 21,364 | |||||||||||
Segregated investments | 77,777 | — | — | 77,777 | |||||||||||
Other assets | 6,519 | — | — | 6,519 | |||||||||||
Total | $ | 192,481 | $ | 221,936 | $ | — | $ | 414,417 | |||||||
Liabilities | |||||||||||||||
Commodity derivatives | $ | 40,305 | $ | 188,455 | $ | — | $ | 228,760 | |||||||
Foreign exchange derivatives | — | 20,701 | — | 20,701 | |||||||||||
Total | $ | 40,305 | $ | 209,156 | $ | — | $ | 249,461 | |||||||
Commodity and foreign exchange derivatives. Exchange-traded futures and options contracts are valued based on unadjusted quoted prices in active markets and are classified within Level 1. Our forward commodity purchase and sales contracts with fixed-price components, select ocean freight contracts and other over-the-counter ("OTC") derivatives are determined using inputs that are generally based on exchange traded prices and/or recent market bids and offers, adjusted for location-specific inputs, and are classified within Level 2. Location-specific inputs are driven by local market supply and demand and are generally based on broker or dealer quotations or market transactions in either the listed or OTC markets. Changes in the fair values of these contracts are recognized in our Condensed Consolidated Statements of Operations as a component of cost of goods sold.
Interest rate swap derivatives. Fair values of our interest rate swap derivatives are determined using valuation models that are widely accepted in the market to value these OTC derivative contracts. The specific terms of the contracts, as well as market observable inputs, such as interest rates and credit risk assumptions, are factored into the models. As all significant
23
inputs are market observable, all interest rate swaps are classified within Level 2. Changes in the fair values of contracts not designated as hedging instruments for accounting purposes are recognized in our Condensed Consolidated Statements of Operations as a component of interest expense. See Note 11, Derivative Financial Instruments and Hedging Activities, for additional information about interest rate swaps designated as fair value and cash flow hedges.
Deferred compensation and other assets. Our deferred compensation investments consist primarily of rabbi trust assets that are valued based on unadjusted quoted prices on active exchanges and are classified within Level 1. Changes in the fair values of these other assets are primarily recognized in our Condensed Consolidated Statements of Operations as a component of marketing, general and administrative expenses.
Embedded derivative asset. The embedded derivative asset relates to contingent payments inherent to our investment in CF Nitrogen. The inputs used in the fair value measurement include the probability of future upgrades and downgrades of the CF Industries credit rating based on historical credit rating movements of other public companies and the discount rates applied to potential annual payments based on applicable historical and current yield coupon rates. Based on these observable inputs, our fair value measurement is classified within Level 2. See Note 11, Derivative Financial Instruments and Hedging Activities, for additional information.
Segregated investments. Our segregated investments are composed primarily of U.S. Treasury securities, which are valued using quoted market prices and classified within Level 1.
There were no material transfers between Level 1, Level 2 and Level 3 assets and liabilities during the three or nine months ended May 31, 2020.
Note 13 Commitments and Contingencies
Environmental
We are required to comply with various environmental laws and regulations incidental to our normal business operations. To meet compliance requirements, we establish reserves for the probable future costs of remediation of identified issues, which are included in cost of goods sold and marketing, general and administrative expenses in our Condensed Consolidated Statements of Operations. The resolution of any such matters may affect consolidated net income for any fiscal period; however, we believe any resulting liabilities, individually or in aggregate, will not have a material effect on our condensed consolidated financial statements during any fiscal year.
Other Litigation and Claims
We are involved as a defendant in various lawsuits, claims and disputes, which are in the normal course of our business. The resolution of any such matters may affect net income for any fiscal period; however, we believe any resulting liabilities, individually or in aggregate, will not have a material effect on our condensed consolidated financial statements during any fiscal year.
Guarantees
We are a guarantor for lines of credit and performance obligations of related, nonconsolidated companies. Our bank covenants allow maximum guarantees of $1.0 billion, of which $163.8 million were outstanding on May 31, 2020. We have collateral for a portion of these contingent obligations. We have not recorded a liability related to the contingent obligations as we do not expect to pay out any cash related to them, and the fair values are considered immaterial. The underlying loans to the counterparties for which we provide these guarantees were current as of May 31, 2020.
Note 14 Leases
We adopted ASC Topic 842 on September 1, 2019, using the modified retrospective approach. In addition, we used the additional optional transition method and package of practical expedients in the period of adoption without retrospective adjustment to previous periods presented, although we elected not to apply the hindsight practical expedient. As a result of using the additional optional transition method and following a modified retrospective approach, prior periods have not been restated, and a $33.7 million cumulative-effect adjustment was recorded to increase the opening balance of capital reserves as of the adoption date related to recognition of previously deferred gains associated with the sale-leaseback of our primary corporate office building located in Inver Grove Heights, Minnesota. Our accounting for finance leases (previously referred to as capital leases) remains substantially unchanged; however, adoption of ASC Topic 842 resulted in recognition of operating
24
lease right of use assets and associated lease liabilities of $268.4 million and $267.0 million, respectively, as of September 1, 2019. Adoption of ASC Topic 842 did not have a material impact on our Condensed Consolidated Statements of Operations or Condensed Consolidated Statements of Cash Flows.
We assess arrangements at inception to determine whether they contain a lease. An arrangement is considered to contain a lease if it conveys the right to control the use of an asset for a period of time in exchange for consideration. The right to control the use of an asset must include both (a) the right to obtain substantially all economic benefits associated with an identified asset and (b) the right to direct how and for what purpose the identified asset is used. Certain arrangements provide us with the right to use an identified asset; however, most of these arrangements are not considered to represent a lease as we do not control how and for what purpose the identified asset is used. For example, our supply agreements, warehousing and distribution services agreements, and transportation services agreements generally do not contain leases.
We lease property, plant and equipment used in our operations primarily under operating lease agreements and, to a lesser extent, under finance lease agreements. Our operating leases are primarily for railcars, equipment, vehicles and office space, many of which contain renewal options and escalation clauses. Renewal options are included as part of the right of use asset and liability when it is reasonably certain that we will exercise the renewal option; however, renewal options are generally not included as we are not reasonably certain to exercise such options.
Operating lease right of use assets and liabilities for operating leases are recognized at the lease commencement date for leases in excess of 12 months based on the present value of lease payments over the lease term. For measurement and classification of lease agreements, lease and nonlease components are grouped into a single lease component for all asset classes. Variable lease payments are excluded from measurement of right of use assets and liabilities and generally include payments for nonlease components such as maintenance costs, payments for leased assets beyond their noncancelable lease term and payments for other nonlease components such as sales tax. The discount rate used to calculate present value is our collateralized incremental borrowing rate or, if available, the rate implicit in the lease. The incremental borrowing rate is determined for each lease based primarily on its lease term. Certain lease arrangements include rental payments adjusted annually based on changes in an inflation index. Our lease arrangements generally do not contain residual value guarantees or material restrictive covenants.
Lease expense is recognized on a straight-line basis over the lease term. The components of lease expense recognized in our Condensed Consolidated Statements of Operations are as follows:
Three Months Ended May 31, 2020 | Nine Months Ended May 31, 2020 | ||||||
(Dollars in thousands) | |||||||
Operating lease expense | $ | 17,057 | $ | 53,155 | |||
Finance lease expense: | |||||||
Amortization of assets | 1,908 | 5,170 | |||||
Interest on lease liabilities | 257 | 742 | |||||
Short-term lease expense | 3,108 | 12,768 | |||||
Variable lease expense | 1,176 | 2,089 | |||||
Total net lease expense* | $ | 23,506 | $ | 73,924 | |||
*Income related to sub-lease activity is not material and has been excluded from the table above.
25
Supplemental balance sheet information related to operating and finance leases is as follows:
Balance Sheet Location | May 31, 2020 | ||||
(Dollars in thousands) | |||||
Operating leases | |||||
Assets | |||||
Operating lease right of use assets | Other assets | $ | 261,125 | ||
Liabilities | |||||
Current operating lease liabilities | Accrued expenses | 57,470 | |||
Long-term operating lease liabilities | Other liabilities | 206,299 | |||
Total operating lease liabilities | $ | 263,769 | |||
Finance leases | |||||
Assets | |||||
Finance lease assets | Property, plant and equipment | $ | 42,854 | ||
Liabilities | |||||
Current finance lease liabilities | Current portion of long-term debt | 6,710 | |||
Long-term finance lease liabilities | Long-term debt | 22,443 | |||
Total finance lease liabilities | $ | 29,153 | |||
Weighted average remaining lease term (in years) | |||||
Operating leases | 8.5 | ||||
Finance leases | 6.2 | ||||
Weighted average discount rate | |||||
Operating leases | 3.13 | % | |||
Finance leases | 3.31 | % | |||
Supplemental cash flow and other information related to operating and finance leases are as follows:
Nine Months Ended May 31, 2020 | |||
(Dollars in thousands) | |||
Cash paid for amounts included in measurement of lease liabilities: | |||
Operating cash flows from operating leases | $ | 45,718 | |
Operating cash flows from finance leases | 742 | ||
Financing cash flows from finance leases | 5,239 | ||
Supplemental noncash information: | |||
Right of use assets obtained in exchange for lease liabilities | 32,567 | ||
Right of use asset modifications | 6,507 | ||
26
Maturities of lease liabilities as of May 31, 2020, were as follows:
May 31, 2020 | |||||||
Finance Leases | Operating Leases | ||||||
(Dollars in thousands) | |||||||
Remainder of fiscal 2020 | $ | 1,689 | $ | 17,401 | |||
Fiscal 2021 | 7,297 | 61,134 | |||||
Fiscal 2022 | 6,141 | 47,348 | |||||
Fiscal 2023 | 5,472 | 37,260 | |||||
Fiscal 2024 | 3,067 | 29,368 | |||||
After fiscal 2024 | 9,339 | 174,940 | |||||
Total maturities of lease liabilities | 33,005 | 367,451 | |||||
Less amounts representing interest | 3,852 | 103,682 | |||||
Present value of future minimum lease payments | 29,153 | 263,769 | |||||
Less current obligations | 6,710 | 57,470 | |||||
Long-term obligations | $ | 22,443 | $ | 206,299 | |||
Disclosures Related to Periods Prior to Adoption of New Lease Standard
The following pertains to previously disclosed information from Note 6, Property, Plant and Equipment, and Note 15, Commitments and Contingencies, contained in our Annual Report on Form 10-K for the fiscal year ended August 31, 2019, which incorporates information about leases now in the scope of ASC Topic 842 discussed above. Total rental expense for operating leases was $113.3 million, $88.5 million and $81.3 million for the years ended August 31, 2019, 2018 and 2017, respectively. Various leases under capital lease totaled $62.7 million and $50.0 million as of August 31, 2019 and 2018, respectively. Accumulated amortization on assets under capital leases was $20.6 million and $18.9 million as of August 31, 2019 and 2018, respectively. Minimum future lease payments required under noncancelable capital and operating leases as of August 31, 2019, were as follows:
August 31, 2019 | |||||||
Capital Leases | Operating Leases | ||||||
(Dollars in thousands) | |||||||
Fiscal 2020 | $ | 6,761 | $ | 87,168 | |||
Fiscal 2021 | 6,199 | 57,381 | |||||
Fiscal 2022 | 5,021 | 43,665 | |||||
Fiscal 2023 | 4,548 | 34,328 | |||||
Fiscal 2024 | 2,638 | 26,793 | |||||
Thereafter | 6,517 | 92,653 | |||||
Total minimum future lease payments | 31,684 | $ | 341,988 | ||||
Less amount representing interest | 3,445 | ||||||
Present value of net minimum lease payments | $ | 28,239 | |||||
Note 15 Acquisitions
On March 1, 2019, we completed our acquisition of the remaining 75% ownership interest in WCD, a full-service wholesale distributor of agronomy products that operates primarily in the United States. The purchase price was equal to $113.4 million, including $6.7 million that was previously paid and $106.7 million paid on March 1, 2019, of which the net cash flows were reduced by $8.0 million of cash acquired. Prior to completing this acquisition and through February 28, 2019, we had a 25% ownership interest in WCD, which was accounted for under the equity method of accounting whereby we shared in the economics of WCD earnings on a pro rata basis. By acquiring the remaining ownership interest in WCD, we were able to expand our agronomy platform, position ourselves as a leading supply partner to cooperatives and retailers serving growers throughout the United States and add value for our owners. The WCD enterprise value was determined using a discounted cash flow model in which the fair value of the business was estimated based on the earning capacity of WCD. We estimated the fair value of the previously held equity interest to be equal to 25% of the total fair value of WCD, which was implied based on the price we paid for the remaining 75% interest. The acquisition-date fair value of the previous equity interest was $37.8 million
27
and is included in measurement of the consideration transferred. We recognized a gain of approximately $19.1 million as a result of remeasuring our prior equity interest in WCD held before acquisition of the remaining 75% interest. The gain was included in other income in our Condensed Consolidated Statements of Operations for the third quarter of fiscal 2019.
Allocation of the purchase price for this transaction resulted in goodwill of $61.4 million, which is nondeductible for tax purposes, and definite-lived intangible assets of $47.2 million. As this acquisition is not considered to have a material impact on our financial statements, pro forma results of operations are not presented. The acquisition resulted in fair value measurements that are not on a recurring basis and did not have a material impact on our Condensed Consolidated Statements of Operations. Purchase accounting has been finalized and the fair values assigned to the net assets acquired are as follows:
(Dollars in thousands) | |||
Cash | $ | 8,033 | |
Current assets | 708,764 | ||
Property, plant and equipment | 44,064 | ||
Goodwill | 61,358 | ||
Intangible assets | 47,200 | ||
Other assets | 55 | ||
Liabilities | (718,262 | ) | |
Total net assets acquired | $ | 151,212 | |
Operating results for WCD are included in our Condensed Consolidated Statements of Operations from the day of the acquisition on March 1, 2019. WCD revenues and income before income taxes were $410.0 million and $14.2 million, respectively, for the nine months ended May 31, 2020, and $255.6 million and $10.5 million, respectively, for the nine months ended May 31, 2019. Due to the timing of the acquisition during the third quarter of fiscal 2019, WCD's results prior to acquisition were not included in the comparable year-to-date period of the prior year.
28
ITEM 2. MANAGEMENT'S DISCUSSION AND ANALYSIS OF FINANCIAL CONDITION AND RESULTS OF OPERATIONS
This Management's Discussion and Analysis of Financial Condition and Results of Operations ("MD&A") is intended to provide a reader of our financial statements with a narrative from the perspective of our management on our financial condition and results of operations, liquidity and certain other factors that may affect our future results. Our MD&A is presented in the following sections:
• | Overview |
• | Business Strategy |
• | Fiscal 2020 Third Quarter Highlights |
• | Fiscal 2020 Trends Update |
• | Operating Metrics |
• | Results of Operations |
• | Liquidity and Capital Resources |
• | Off-Balance Sheet Financing Arrangements |
• | Contractual Obligations |
• | Critical Accounting Policies |
• | Effect of Inflation and Foreign Currency Transactions |
• | Recent Accounting Pronouncements |
Our MD&A should be read in conjunction with our Annual Report on Form 10-K for the year ended August 31, 2019 (including the information presented therein under Risk Factors), as well as the condensed consolidated financial statements and the related notes included in Item 1 of Part I, and the risk factor included in Item 1A of Part II of this Quarterly Report on Form 10-Q.
Overview
CHS Inc. is a diversified company that provides grain, food, agronomy and energy resources to businesses and consumers on a global scale. As a cooperative, we are owned by farmers, ranchers and member cooperatives across the United States. We also have preferred shareholders who own our five series of preferred stock, all of which are listed and traded on the Nasdaq Global Select Market. We operate in the following three reportable segments:
• | Energy. Produces and provides primarily for the wholesale distribution and transportation of petroleum products. |
• | Ag. Purchases and further processes or resells grains and oilseeds originated by our country operations business, by our member cooperatives and by third parties; also serves as a wholesaler and retailer of agronomy products. |
• | Nitrogen Production. Consists solely of our equity method investment in CF Nitrogen and produces and distributes nitrogen fertilizer. |
In addition, our financing and hedging businesses, along with our nonconsolidated wheat milling and food production and distribution joint ventures, have been aggregated within Corporate and Other.
The condensed consolidated financial statements include the accounts of CHS and all subsidiaries and limited liability companies in which we have a controlling interest. The effects of all significant intercompany transactions have been eliminated.
Corporate administrative expenses and interest are allocated to each reporting segment, along with Corporate and Other, based on direct use of services, such as information technology and legal, and other factors or considerations relevant to the costs incurred.
Management's Focus. When evaluating our operating performance, management focuses on gross profit and income before income taxes ("IBIT"). As a company that operates heavily in global commodities, there is significant unpredictability and volatility in pricing, costs and global trade volumes. Consequently, we focus on managing the margin we can earn and the resulting IBIT. Management also focuses on ensuring balance sheet strength through appropriate management of financial liquidity, leverage, capital allocation and cash flow optimization.
Seasonality. Many of our business activities are highly seasonal and our operating results vary throughout the year. Our revenues and income generally trend lower during the second and fourth fiscal quarters and higher during the first and third fiscal quarters; however, weather or other events may impact this trend, particularly for IBIT. For example, in our Ag
29
segment, our country operations business generally experiences higher volumes and income during the fall harvest and spring planting seasons, which generally correspond to our first and third fiscal quarters, respectively. Additionally, our agronomy business generally experiences higher volumes and income during the spring planting season. Our global grain marketing operations are subject to fluctuations in volume and income based on producer harvests, world grain prices, demand and global trade volumes. Our Energy segment generally experiences higher volumes and profitability in certain operating areas, such as refined products, in the spring, summer and early fall when gasoline and diesel fuel use by agricultural producers is highest and is subject to global supply and demand forces. Other energy products, such as propane, generally experience higher volumes and profitability during the winter heating and fall crop-drying seasons. The graphs below depict the seasonality inherent in our businesses.
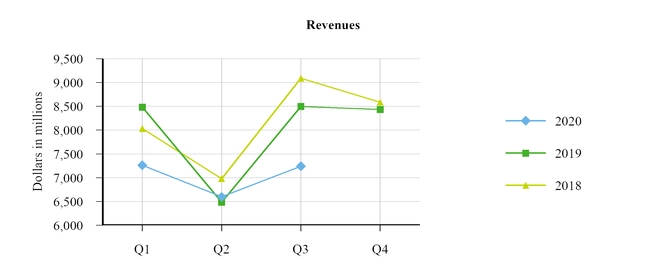
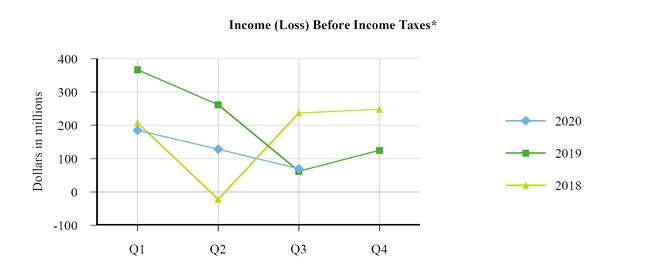
* Income (loss) before income taxes experienced deviations from historical trends during fiscal 2020, fiscal 2019 and fiscal 2018 as a result of gains on sales of noncore assets, recoveries of previously recorded losses and a combination of other factors, including the impact of COVID-19 that negatively impacted our Energy segment earnings and poor weather conditions that negatively impacted our Ag segment earnings.
Pricing and Volumes. Our revenues, assets and cash flows can be significantly affected by global market prices and sales volumes of commodities such as petroleum products, natural gas, grains, oilseed products and agronomy products. Changes in market prices for commodities we purchase without a corresponding change in the selling prices of those products can affect revenues and operating earnings. Similarly, increased or decreased sales volumes without a corresponding change in the purchase and selling prices of those products can affect revenues and operating earnings. Commodity prices and sales volumes are affected by a wide range of factors beyond our control, including weather, crop damage due to plant disease or insects, drought, availability/adequacy of supply of a commodity, availability of reliable rail and river transportation network, outbreaks of disease, government regulations/policies, global trade disputes and general political/economic conditions.
30
Foreign Corrupt Practices Act Update. As previously reported in our Annual Report on Form 10-K for the year ended August 31, 2019, in the fourth quarter of fiscal 2018, we contacted the U.S. Department of Justice ("DOJ") and the U.S. Securities and Exchange Commission ("SEC") to voluntarily self-disclose potential violations of the Foreign Corrupt Practices Act of 1977 ("FCPA") in connection with a small number of reimbursements made to Mexican customs agents in the 2014-2015 time period for payments customs agents made to Mexican customs officials in connection with inspections of grain crossing the U.S.-Mexican border by railcar. In connection with its review of this matter, we have cooperated with the DOJ’s and SEC’s evaluation of other areas of potential interest relating to the FCPA. On February 25, 2020, we received a letter from the DOJ stating that it had closed its inquiry into each of these matters without taking any action against us and acknowledging its appreciation of our cooperation. We are still fully cooperating with the SEC’s ongoing evaluation of these FCPA-related matters. At this time, the SEC has not taken a position on these FCPA-related matters, and we are unable to predict when the SEC’s review of these matters will be completed or what regulatory or other outcomes may result.
Business Strategy
Our business strategies focus on an enterprise-wide effort to create an experience that empowers customers to make CHS their first choice, expands market access to add value for our owners, and transforms and evolves our core businesses by capitalizing on changing market dynamics. To execute on these strategies, we are focused on implementing agile, efficient and sustainable new technology platforms; building robust and efficient supply chains; hiring, developing and retaining high-performing, diverse and passionate teams; achieving operational excellence and continuous improvement; and maintaining a strong balance sheet.
Fiscal 2020 Third Quarter Highlights
• | Improved weather conditions during the spring planting season compared to the prior year drove increased volumes and margin across much of our Ag segment during the third quarter of fiscal 2020. |
• | Less advantageous market conditions in our refined fuels business, driven primarily by the recent outbreak and pandemic of the novel coronavirus known as COVID-19 and other factors, resulted in volume and price declines and significantly reduced earnings compared to the prior year. |
• | As more fully described in Note 1, Basis of Presentation and Significant Accounting Policies, of the notes to our condensed consolidated financial statements included in this Quarterly Report on Form 10-Q, due to the macroeconomic and industry conditions in the early months of the third quarter of fiscal 2020, a goodwill impairment test of a reporting unit and long-lived asset tests in our Ag segment were deemed necessary. As a result of these tests, the estimated fair value of the reporting unit and undiscounted cash flows of the asset groups exceeded the carrying values, and thus no impairments were recorded. We will continue to monitor financial results and projected cash flows to assess whether any impairments may be necessary in the future. |
• | Similar to other energy producers, price declines and volatility associated with the novel coronavirus known as COVID-19 pandemic, impacted our refined fuels business and resulted in a $42.0 million noncash charge to reduce inventories to their market value at the end of the period. This charge may increase or decrease in the fourth quarter of fiscal 2020, based on market prices observed at our fiscal year-end. Any adjustments that exist as of year-end would be considered permanent and incorporated into the LIFO carrying value of the inventories. |
• | As more fully described in Item 4 of Part I of this Quarterly Report on Form 10-Q, we continued dedicating significant internal and external resources, as well as executive and board focus, to improving our control environment. |
• | We responded to the COVID-19 pandemic by implementing significant remote working arrangements for approximately half our global employees, increased hygiene and infection control processes at all of our facilities and developed risk mitigation and exposure policies applicable to our enterprise. The costs of these activities were not and are not expected to be material. In addition, our operations were deemed to be essential infrastructure industries by federal and state governments, which allowed us to continue operating all of our facilities and operations. |
Fiscal 2020 Trends Update
As with virtually all other companies in the United States, we are dealing with COVID-19. We continue to mobilize our resources (operational, people and financial) to be in a position to best serve our customers, owners and other stakeholders as the social, economic and financial impacts of COVID-19 continue to unfold. Most of our operations are considered to be essential and we believe our operations will continue to not be significantly impacted; however, periods of depressed demand and pricing within the U.S. ethanol production and refined fuels industries during the third quarter of fiscal 2020 resulted in decreased profitability and the need to assess for potential impairments. As a result, we recorded a noncash charge to reduce our refined fuels inventory to its market value at the end of the period. Like all energy producers, we are impacted by fluctuations in energy commodity prices by the requirement to reduce our inventory values to the lower of cost or market and should energy commodity prices continue to decline, we may be subject to additional noncash lower of cost or market adjustments, which
31
could be significant. To the extent that market prices recover, we may be able to recover prior net realizable value adjustments. Refer to Item 1A of Part II of this Quarterly Report on Form 10-Q, for additional considerations of the risks that COVID-19 may continue to have on our business, liquidity, capital resources and financial results.
Our Energy and Ag segments operate in cyclical environments. Unforeseen market conditions can positively or negatively impact the energy industry, including the significant volume and price decreases that negatively impacted the energy industry during March and April 2020. We are unable to predict how long the current environment will last or the severity of the financial and operational impacts; however, we expect the uncertain and volatile market conditions in the energy industry to remain through the fourth quarter of fiscal 2020.
The agricultural industry continues to operate in a challenging environment that has been characterized by generally lower margins, reduced liquidity and increased leverage that have resulted from a period of reduced commodity prices. More favorable weather conditions during the fiscal 2020 spring planting season compared to the prior year provided an opportunity for increased volumes and improved earnings across much of our Ag segment. However, trade relations between the United States and foreign trade partners, particularly those that purchase large quantities of agricultural commodities, while improving, are still not normalized as of the end of the third quarter ended May 31, 2020, resulting in unpredictable impacts to agricultural commodity prices and volumes sold. We are unable to predict how long the current environment will last or how severe the effects will ultimately be on our pricing and volumes. In addition to global supply and demand impacts, regional factors such as unpredictable weather conditions could continue to impact our operations. As a result, we expect revenues, margins and cash flows from core operations in our Ag segment to remain under pressure through the remainder of fiscal 2020, which will continue to put pressure on associated asset valuations.
Operating Metrics
Energy
Our Energy segment operations primarily include our Laurel, Montana, and McPherson, Kansas, refineries, which process crude oil to produce refined products, including gasolines, distillates and other products. The following table provides information about our consolidated refinery operations.
Three Months Ended May 31, | Nine Months Ended May 31, | ||||||||||
2020 | 2019 | 2020 | 2019 | ||||||||
Refinery throughput volumes | (Barrels per day) | ||||||||||
Heavy, high-sulfur crude oil | 90,118 | 73,344 | 90,976 | 90,261 | |||||||
All other crude oil | 61,328 | 31,043 | 71,730 | 53,733 | |||||||
Other feedstocks and blendstocks | 6,657 | 1,402 | 12,184 | 9,859 | |||||||
Total refinery throughput volumes | 158,103 | 105,789 | 174,890 | 153,853 | |||||||
Refined fuel yields | |||||||||||
Gasolines | 73,196 | 46,457 | 84,837 | 71,269 | |||||||
Distillates | 68,920 | 45,508 | 73,172 | 64,930 | |||||||
We are subject to the Renewable Fuels Standard, which requires refiners to blend renewable fuels (e.g., ethanol, biodiesel) into their finished transportation fuels or purchase renewable energy credits, known as Renewable Identification Numbers ("RINs"), in lieu of blending. The U.S. Environmental Protection Agency generally establishes new annual renewable fuel percentage standards for each compliance year in the preceding year. We generate RINs through our blending activities, but we cannot generate enough RINs to meet the needs of our refining capacity and RINs must be purchased on the open market. The price of RINs can be volatile and can impact profitability.
32
In addition to our internal operational reliability, the profitability of our Energy segment is largely driven by crack spreads (e.g., the price differential between refined products and inputs such as crude oil) and WCS crude oil differentials (e.g., the price differential between West Texas Intermediate ("WTI") crude oil and WCS crude oil), which are driven by the supply and demand of refined product markets. Crack spreads decreased during the three and nine months ended May 31, 2020, compared to the same periods during the prior year, contributing to a significant decline in IBIT for the Energy segment. The WCS crude oil differential also declined during the nine months ended May 31, 2020, contributing to the decline in IBIT; however, the WCS crude oil differential increased during the three months ended May 31, 2020, partially offsetting the overall IBIT decrease. The table below provides information about average market reference prices and differentials that impact our Energy segment.
Three Months Ended May 31, | Nine Months Ended May 31, | ||||||||||||||
2020 | 2019 | 2020 | 2019 | ||||||||||||
Market indicators | |||||||||||||||
WTI crude oil (dollars per barrel) | $ | 25.22 | $ | 61.00 | $ | 45.76 | $ | 59.55 | |||||||
WTI - WCS crude oil differential (dollars per barrel) | $ | 15.89 | $ | 9.67 | $ | 16.81 | $ | 22.80 | |||||||
Group 3 2:1:1 crack spread (dollars per barrel)* | $ | 9.38 | $ | 21.65 | $ | 13.69 | $ | 18.88 | |||||||
Group 3 5:3:2 crack spread (dollars per barrel)* | $ | 8.26 | $ | 21.18 | $ | 12.69 | $ | 17.61 | |||||||
D6 ethanol RIN (dollars per RIN) | $ | 0.3414 | $ | 0.1586 | $ | 0.2342 | $ | 0.1653 | |||||||
D4 ethanol RIN (dollars per RIN) | $ | 0.5131 | $ | 0.3748 | $ | 0.5112 | $ | 0.4237 | |||||||
*Group 3 refers to the oil refining and distribution system serving the Midwest markets from the Gulf Coast through the Plains States.
Ag
Our Ag segment operations work together to facilitate the production, purchase, sale and eventual use of grain and other agricultural commodities within the United States, as well as internationally. Profitability in our Ag segment is largely driven by throughput and production volumes, as well as commodity price spreads; however, revenues and cost of goods sold ("COGS") are largely affected by market-driven commodity prices that are outside our control. The table below provides information about average market prices for agricultural commodities and our sales/throughput volumes that impacted our Ag segment for the three and nine months ended May 31, 2020, and 2019.
Three Months Ended May 31, | Nine Months Ended May 31, | ||||||||||||||||
Market Source* | 2020 | 2019 | 2020 | 2019 | |||||||||||||
Commodity prices | |||||||||||||||||
Corn (dollars per bushel) | Chicago Board of Trade | $ | 3.26 | $ | 3.79 | $ | 3.63 | $ | 3.71 | ||||||||
Soybeans (dollars per bushel) | Chicago Board of Trade | $ | 8.59 | $ | 8.68 | $ | 8.86 | $ | 8.75 | ||||||||
Wheat (dollars per bushel) | Chicago Board of Trade | $ | 5.22 | $ | 5.32 | $ | 5.26 | $ | 5.56 | ||||||||
Urea (dollars per ton) | Green Markets NOLA | $ | 239.00 | $ | 254.00 | $ | 228.00 | $ | 268.00 | ||||||||
UAN (dollars per ton) | Green Markets NOLA | $ | 145.00 | $ | 166.00 | $ | 145.00 | $ | 193.00 | ||||||||
Ethanol (dollars per gallon) | Chicago Platts | $ | 1.03 | $ | 1.35 | $ | 1.29 | $ | 1.29 | ||||||||
Volumes | |||||||||||||||||
Grain and oilseed (thousands of bushels) | 761,645 | 562,314 | 1,839,432 | 1,780,330 | |||||||||||||
North American grain and oilseed port throughput (thousands of bushels) | 145,789 | 149,036 | 409,739 | 463,440 | |||||||||||||
Crop nutrients (thousands of tons) | 2,319 | 2,351 | 5,645 | 5,300 | |||||||||||||
Ethanol (thousands of gallons) | 171,034 | 231,656 | 618,834 | 703,739 | |||||||||||||
*Market source information represents the average month-end price during the period.
33
Results of Operations
Three Months Ended May 31, 2020, and 2019
Three Months Ended May 31, | |||||||||||||
2020 | % of Revenues | 2019 | % of Revenues | ||||||||||
(Dollars in thousands) | |||||||||||||
Revenues | $ | 7,241,031 | 100.0 | % | $ | 8,497,941 | 100.0 | % | |||||
Cost of goods sold | 7,022,672 | 97.0 | 8,274,170 | 97.4 | |||||||||
Gross profit | 218,359 | 3.0 | 223,771 | 2.6 | |||||||||
Marketing, general and administrative expenses | 180,439 | 2.5 | 217,527 | 2.6 | |||||||||
Operating earnings | 37,920 | 0.5 | 6,244 | 0.1 | |||||||||
Interest expense | 26,661 | 0.4 | 42,773 | 0.5 | |||||||||
Other income | (8,076 | ) | (0.1 | ) | (32,938 | ) | (0.4 | ) | |||||
Equity income from investments | (51,114 | ) | (0.7 | ) | (65,170 | ) | (0.8 | ) | |||||
Income before income taxes | 70,449 | 1.0 | 61,579 | 0.7 | |||||||||
Income tax (benefit) expense | (27,052 | ) | (0.4 | ) | 6,866 | 0.1 | |||||||
Net income | 97,501 | 1.3 | 54,713 | 0.6 | |||||||||
Net (loss) income attributable to noncontrolling interests | (147 | ) | — | 93 | — | ||||||||
Net income attributable to CHS Inc. | $ | 97,648 | 1.3 | % | $ | 54,620 | 0.6 | % | |||||
The charts below detail revenues, net of intersegment revenues, and IBIT by reportable segment for the three months ended May 31, 2020. Our Nitrogen Production reportable segment represents an equity method investment that records earnings and allocated expenses, but not revenues.
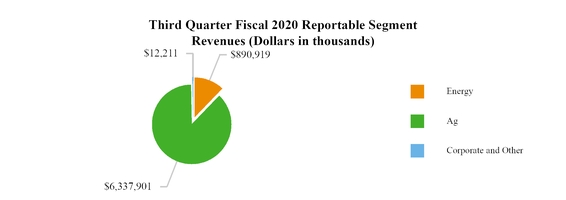
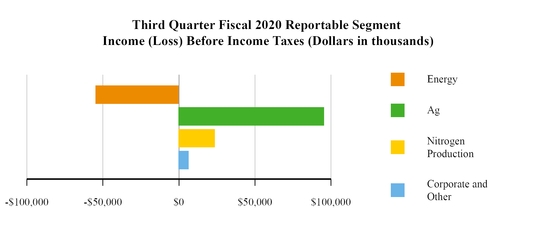
34
Income Before Income Taxes by Segment
Energy
Three Months Ended May 31, | Change | |||||||||||||
2020 | 2019 | Dollars | Percent | |||||||||||
(Dollars in thousands) | ||||||||||||||
Income (loss) before income taxes | $ | (54,764 | ) | $ | 1,259 | $ | (56,023 | ) | (4,449.8 | )% | ||||
The following waterfall analysis and commentary presents the changes in our Energy segment IBIT for the three months ended May 31, 2020, compared to the same period during the prior year.
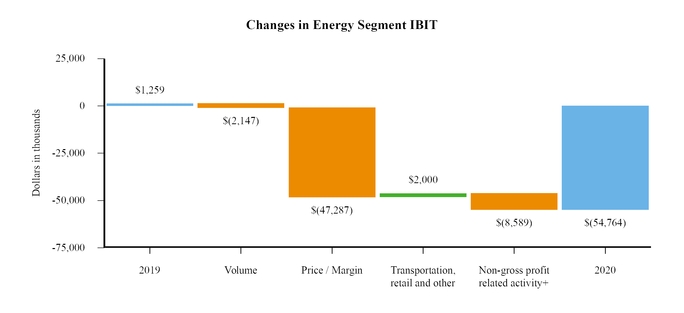
+See commentary related to these changes in the marketing, general and administrative expenses, interest expense, other income and equity income from investments sections of this Results of Operations.
The $56.0 million decrease in Energy segment IBIT reflects the following:
• | A $42.0 million noncash charge to reduce our refined fuels inventories to their market value at the end of the period. |
• | Lower refined fuels margins due to less advantageous market conditions compared to the same period of the prior year as a result of decreased crack spreads, which were partially offset by improved WCS crude oil differentials experienced on heavy Canadian crude oil processed by our refineries. |
• | Improved propane margins due to hedging gains. |
35
Ag
Three Months Ended May 31, | Change | |||||||||||||
2020 | 2019 | Dollars | Percent | |||||||||||
(Dollars in thousands) | ||||||||||||||
Income before income taxes | $ | 95,360 | $ | 21,112 | $ | 74,248 | 351.7 | % | ||||||
The following waterfall analysis and commentary presents the changes in our Ag segment IBIT for the three months ended May 31, 2020, compared to the same period during the prior year.
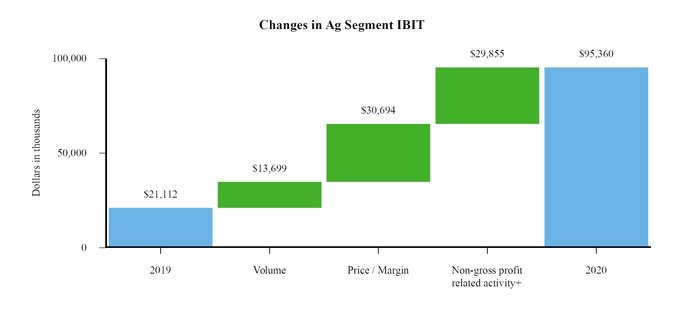
+See commentary related to these changes in the marketing, general and administrative expenses, interest expense, other income and equity income from investments sections of this Results of Operations.
The $74.2 million increase in Ag segment IBIT reflects the following:
• | Improved margins and volumes across much of the Ag segment as a result of more favorable weather conditions for spring planting compared to the same period during the prior year as well as improved, but not normalized, trade relations between the United States and foreign trade partners. |
• | The improved volume and margins associated with the spring planting season were partially offset by decreased margins and volumes in our renewable fuels and processing and food ingredients businesses attributable to COVID-19 related demand shocks in food service and transportation sectors. |
• | A combination of lower nongross profit-related expenses contributed to a $29.9 million IBIT increase, primarily related to a $29.5 million loan loss reserve recorded during the three months ended May 31, 2019, that did not reoccur during the three months ended May 31, 2020. |
All Other Segments
Three Months Ended May 31, | Change | |||||||||||||
2020 | 2019 | Dollars | Percent | |||||||||||
(Dollars in thousands) | ||||||||||||||
Nitrogen Production IBIT* | $ | 23,507 | $ | 20,178 | $ | 3,329 | 16.5 | % | ||||||
Corporate and Other IBIT | $ | 6,346 | $ | 19,030 | $ | (12,684 | ) | (66.7 | )% | |||||
*See Note 5, Investments, of the notes to the condensed consolidated financial statements that are included in this Quarterly Report on Form 10-Q for additional information.
Our Nitrogen Production segment IBIT increased as a result of decreased interest expense associated with our CF Nitrogen investment during the three months ended May 31, 2020, attributable to lower interest rates. Corporate and Other IBIT decreased primarily as a result of decreased earnings from our equity investment in Ventura Foods, which experienced a significant reduction in demand due to COVID-19 related demand shocks in the food service sector.
36
Revenues by Segment
Energy
Three Months Ended May 31, | Change | |||||||||||||
2020 | 2019 | Dollars | Percent | |||||||||||
(Dollars in thousands) | ||||||||||||||
Revenues | $ | 890,919 | $ | 1,738,045 | $ | (847,126 | ) | (48.7 | )% | |||||
The following waterfall analysis and commentary presents the changes in our Energy segment revenues for the three months ended May 31, 2020, compared to the same period during the prior year.
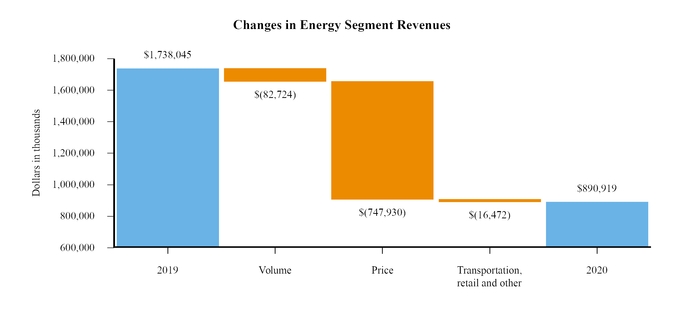
The $847.1 million decrease in Energy segment revenues reflects the following:
• | Decreased selling prices and volumes for refined fuels driven by global market conditions, including the impact of COVID-19 demand shock in the transportation sector and product mix, contributed to $713.4 million and $80.4 million decreases in revenues, respectively. |
• | Decreased selling prices for propane driven by global market and weather conditions contributed to a $33.3 million decrease in revenues. |
37
Ag
Three Months Ended May 31, | Change | |||||||||||||
2020 | 2019 | Dollars | Percent | |||||||||||
(Dollars in thousands) | ||||||||||||||
Revenues | $ | 6,337,901 | $ | 6,745,115 | $ | (407,214 | ) | (6.0 | )% | |||||
The following waterfall analysis and commentary presents the changes in our Ag segment revenues for the three months ended May 31, 2020, compared to the same period during the prior year.
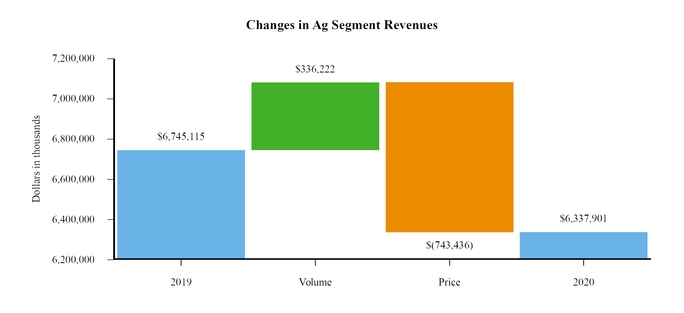
The $407.2 million decrease in Ag segment revenues reflects the following:
• | Decreased prices across most of the Ag segment were driven by global market conditions and product mix. Lower pricing for grain and oilseed contributed to a $484.6 million decrease in revenues and the remaining price decrease was attributed to lower selling prices for agronomy products, feed and farm supplies and renewable fuels. |
• | Volume increases across most of the Ag segment resulted from improved, but not normalized, trade relations between the United States and foreign trade partners and more favorable weather conditions for spring planting compared to the same period of the prior year. Stronger grain and oilseed movement contributed to a $298.2 million increase in revenues with the remaining increase being composed primarily of improved sales volumes of agronomy products and feed and farm supplies used for spring planting. These increased volumes were partially offset by lower volumes of renewable fuels and processing and food ingredients, which experienced lower demand as a result of demand shock in the food service and transportation sectors that followed the COVID-19 pandemic. |
All Other Segments
Three Months Ended May 31, | Change | |||||||||||||
2020 | 2019 | Dollars | Percent | |||||||||||
(Dollars in thousands) | ||||||||||||||
Corporate and Other revenues* | $ | 12,211 | $ | 14,781 | $ | (2,570 | ) | (17.4 | )% | |||||
*Our Nitrogen Production reportable segment represents an equity method investment that records earnings and allocated expenses, but not revenues.
Corporate and Other revenues decreased during the three months ended May 31, 2020, compared to the same period during the prior year as a result of lower revenues in our financing business due to market-driven interest rate reductions.
38
Cost of Goods Sold by Segment
Energy
Three Months Ended May 31, | Change | |||||||||||||
2020 | 2019 | Dollars | Percent | |||||||||||
(Dollars in thousands) | ||||||||||||||
Cost of goods sold | $ | 893,922 | $ | 1,693,613 | $ | (799,691 | ) | (47.2 | )% | |||||
The following waterfall analysis and commentary presents the changes in our Energy segment COGS for the three months ended May 31, 2020, compared to the same period during the prior year.
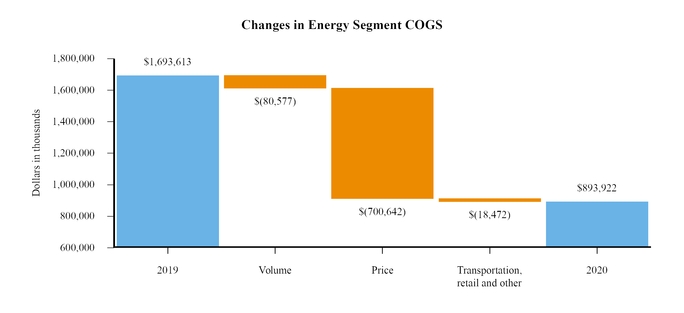
The $799.7 million decrease in Energy segment COGS reflects the following:
• | Decreased costs and volumes for refined fuels driven by global market conditions, including the demand shock in the transportation sector that followed the COVID-19 pandemic and product mix, contributed to $635.6 million and $78.5 million decreases in COGS, respectively. |
• | Decreased costs for propane driven by global market conditions contributed to a $63.8 million decrease of COGS. |
• | The decreases were partially offset by a $42.0 million noncash charge to reflect the lower market value of our refined fuels inventories at the end of the period. |
39
Ag
Three Months Ended May 31, | Change | |||||||||||||
2020 | 2019 | Dollars | Percent | |||||||||||
(Dollars in thousands) | ||||||||||||||
Cost of goods sold | $ | 6,129,293 | $ | 6,580,901 | $ | (451,608 | ) | (6.9 | )% | |||||
The following waterfall analysis and commentary presents the changes in our Ag segment COGS for the three months ended May 31, 2020, compared to the same period during the prior year.
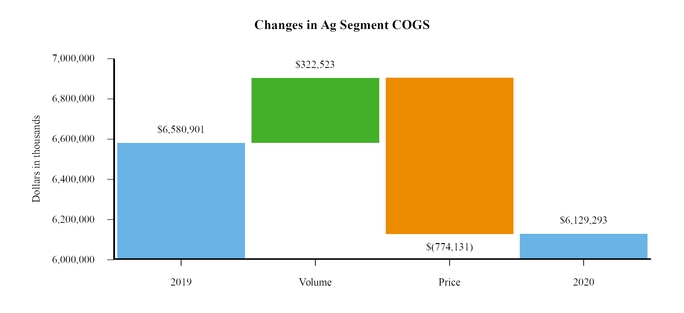
The $451.6 million decrease in Ag segment COGS reflects the following:
• | Decreased prices across most of the Ag segment were driven by global market conditions and product mix. Lower prices for grain and oilseed contributed to a $492.3 million decrease of COGS and the remaining price decrease was attributed to lower prices for agronomy products, feed and farm supplies and renewable fuels. |
• | Volume increases across most of the Ag segment resulted from improved, but not normalized, trade relations between the United States and foreign trade partners and more favorable weather conditions for spring planting compared to the same period of the prior year. Stronger grain and oilseed movement contributed to a $298.9 million increase of COGS with the remaining increase being composed primarily of improved sales volumes of agronomy products and feed and farm supplies used for spring planting. These increased volumes were partially offset by lower volumes of renewable fuels and processing and food ingredients, which experienced lower demand as a result of demand shock in the food service and transportation sectors that followed the COVID-19 pandemic. |
All Other Segments
Three Months Ended May 31, | Change | ||||||||||||
2020 | 2019 | Dollars | Percent | ||||||||||
(Dollars in thousands) | |||||||||||||
Nitrogen Production COGS | $ | 430 | $ | 1,076 | $ | (646 | ) | NM* | |||||
Corporate and Other COGS | $ | (973 | ) | $ | (1,420 | ) | $ | 447 | NM* | ||||
*NM - not meaningful
There were no significant changes to COGS in our Nitrogen Production segment or Corporate and Other during the three months ended May 31, 2020, compared to the same period during the prior year.
40
Marketing, General and Administrative Expenses
Three Months Ended May 31, | Change | |||||||||||||
2020 | 2019 | Dollars | Percent | |||||||||||
(Dollars in thousands) | ||||||||||||||
Marketing, general and administrative expenses | $ | 180,439 | $ | 217,527 | $ | (37,088 | ) | (17.0 | )% | |||||
Decreased marketing, general and administrative expenses were primarily due to a $29.5 million loan loss reserve recorded during the three months ended May 31, 2019, that did not reoccur during the three months ended May 31, 2020. The remaining decrease resulted primarily from decreased consulting expenses and incentive-based compensation compared to the same period of the prior year.
Interest Expense
Three Months Ended May 31, | Change | |||||||||||||
2020 | 2019 | Dollars | Percent | |||||||||||
(Dollars in thousands) | ||||||||||||||
Interest expense | $ | 26,661 | $ | 42,773 | $ | (16,112 | ) | (37.7 | )% | |||||
Interest expense decreased during the three months ended May 31, 2020, as a result of lower interest rates and decreased average outstanding debt balances compared to the same period of the prior year.
Other Income
Three Months Ended May 31, | Change | |||||||||||||
2020 | 2019 | Dollars | Percent | |||||||||||
(Dollars in thousands) | ||||||||||||||
Other income | $ | 8,076 | $ | 32,938 | $ | (24,862 | ) | (75.5 | )% | |||||
Other income decreased primarily as a result of nonoperating gains recognized during the prior year, which did not reoccur during the three months ended May 31, 2020, including a $19.1 million gain recognized in connection with the acquisition of the remaining 75% ownership in WCD during the three months ended May 31, 2019.
Equity Income from Investments
Three Months Ended May 31, | Change | |||||||||||||
2020 | 2019 | Dollars | Percent | |||||||||||
(Dollars in thousands) | ||||||||||||||
Equity income from investments* | $ | 51,114 | $ | 65,170 | $ | (14,056 | ) | (21.6 | )% | |||||
*See Note 5, Investments, of the notes to the condensed consolidated financial statements that are included in this Quarterly Report on Form 10-Q for additional information.
We record equity income or loss for investments in which we have an ownership interest of 50% or less and have significant influence, but not control, for our proportionate share of income or loss reported by the entity, without consolidating the revenues and expenses of the entity in our Condensed Consolidated Statements of Operations. Equity income from investments decreased during the three months ended May 31, 2020, compared to the same period during the prior year, primarily due to $17.4 million of lower equity income associated with our equity method investment in Ventura Foods, which experienced a significant reduction in demand due to COVID-19.
41
Income Tax Expense
Three Months Ended May 31, | Change | |||||||||||||
2020 | 2019 | Dollars | Percent | |||||||||||
(Dollars in thousands) | ||||||||||||||
Income tax (benefit) expense | $ | (27,052 | ) | $ | 6,866 | $ | (33,918 | ) | (494.0 | )% | ||||
Decreased income tax expense during the three months ended May 31, 2020, primarily reflects a tax benefit related to the settlement of a U.S. federal audit resulting in additional tax credit carryovers, as well as equity management assumptions used in fiscal 2020 and the associated impact on income taxes. Effective tax rates for the three months ended May 31, 2020, and 2019, were (38.4)% and 11.1%, respectively. Federal and state statutory rates applied to nonpatronage business activity were 24.7% and 24.6% for the three months ended May 31, 2020, and 2019, respectively. Income taxes and effective tax rate vary each year based on profitability and nonpatronage business activity during each of the comparable years.
42
Nine Months Ended May 31, 2020, and 2019
Nine Months Ended May 31, | |||||||||||||
2020 | % of Revenues | 2019 | % of Revenues | ||||||||||
(Dollars in thousands) | |||||||||||||
Revenues | $ | 21,460,742 | 100.0 | % | $ | 23,465,769 | 100.0 | % | |||||
Cost of goods sold | 20,601,785 | 96.0 | 22,343,944 | 95.2 | |||||||||
Gross profit | 858,957 | 4.0 | 1,121,825 | 4.8 | |||||||||
Marketing, general and administrative expenses | 548,340 | 2.6 | 551,438 | 2.3 | |||||||||
Operating earnings | 310,617 | 1.4 | 570,387 | 2.4 | |||||||||
Interest expense | 95,043 | 0.4 | 122,950 | 0.5 | |||||||||
Other income | (32,926 | ) | (0.2 | ) | (69,835 | ) | (0.3 | ) | |||||
Equity income from investments | (135,174 | ) | (0.6 | ) | (173,394 | ) | (0.7 | ) | |||||
Income before income taxes | 383,674 | 1.8 | 690,666 | 2.9 | |||||||||
Income tax (benefit) expense | (18,258 | ) | (0.1 | ) | 40,534 | 0.2 | |||||||
Net income | 401,932 | 1.9 | 650,132 | 2.8 | |||||||||
Net income (loss) attributable to noncontrolling interests | 955 | — | (758 | ) | — | ||||||||
Net income attributable to CHS Inc. | $ | 400,977 | 1.9 | % | $ | 650,890 | 2.8 | % | |||||
The charts below detail revenues, net of intersegment revenues, and IBIT by reportable segment for the nine months ended May 31, 2020. Our Nitrogen Production reportable segment represents an equity method investment that records earnings and allocated expenses, but not revenues.
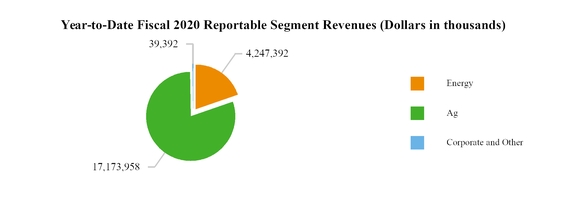
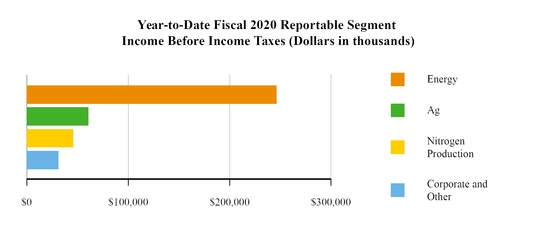
43
Income Before Income Taxes by Segment
Energy
Nine Months Ended May 31, | Change | |||||||||||||
2020 | 2019 | Dollars | Percent | |||||||||||
(Dollars in thousands) | ||||||||||||||
Income before income taxes | $ | 246,309 | $ | 540,305 | $ | (293,996 | ) | (54.4 | )% | |||||
The following waterfall analysis and commentary presents the changes in our Energy segment IBIT for the nine months ended May 31, 2020, compared to the same period during the prior year.
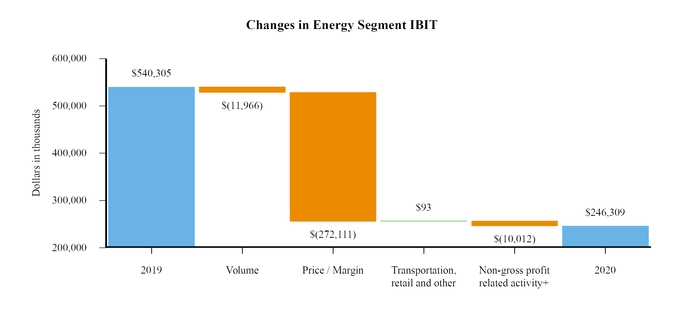
+See commentary related to these changes in the marketing, general and administrative expenses, interest expense, other income and equity income from investments sections of this Results of Operations.
The $294.0 million decrease in Energy segment IBIT reflects the following:
• | Recognition of an $80.8 million gain associated with certain federal excise tax credits as a reduction of COGS during the second quarter of fiscal 2019 that did not reoccur during the current year. |
• | A $42.0 million noncash charge during the third quarter of fiscal 2020 to reduce our refined fuels inventories to their market value at the end of the period. |
• | Significantly less advantageous market conditions in our refined fuels business compared to the same period of the prior year drove lower margins. These market conditions were driven by a combination of decreased WCS crude oil differentials experienced on heavy Canadian crude oil, which is processed by our refineries, and decreased crack spreads. |
• | The decreased IBIT was partially offset by increased volumes and improved propane margins due to hedging gains and significant propane demand for crop drying and home heating, particularly during the first quarter of fiscal 2020. |
44
Ag
Nine Months Ended May 31, | Change | |||||||||||||
2020 | 2019 | Dollars | Percent | |||||||||||
(Dollars in thousands) | ||||||||||||||
Income (loss) before income taxes | $ | 60,653 | $ | 39,031 | $ | 21,622 | 55.4 | % | ||||||
The following waterfall analysis and commentary presents the changes in our Ag segment IBIT for the nine months ended May 31, 2020, compared to the same period during the prior year.
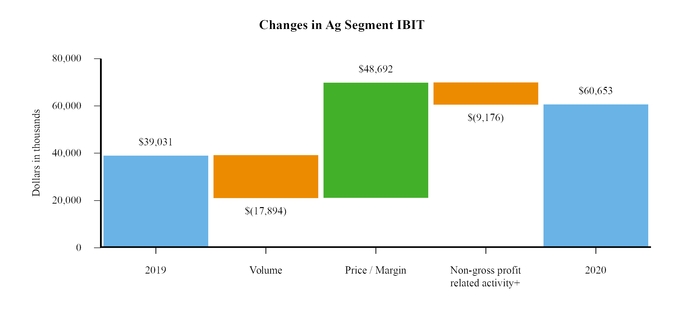
+See commentary related to these changes in the marketing, general and administrative expenses, interest expense, other income and equity income from investments sections of this Results of Operations.
The $21.6 million increase in Ag segment IBIT reflects the following:
• | Improved margins across much of the Ag segment as a result of more favorable weather conditions for spring planting compared to the same period during the prior year. |
• | Decreased volumes across much of the Ag segment due to poor weather conditions and a smaller crop to harvest in the fall of 2019 across much of the agricultural region of the United States in which we operate and global trade tensions between the United States and foreign trading partners, particularly during the first half of fiscal 2020. These volume decreases were partially offset by increased volumes associated with agronomy products that were primarily attributable to our acquisition of the remaining 75% ownership interest in WCD on March 1, 2019, the results of which were not included in the entire comparable period of the prior year. |
All Other Segments
Nine Months Ended May 31, | Change | |||||||||||||
2020 | 2019 | Dollars | Percent | |||||||||||
(Dollars in thousands) | ||||||||||||||
Nitrogen Production IBIT* | $ | 45,698 | $ | 54,569 | $ | (8,871 | ) | (16.3 | )% | |||||
Corporate and Other IBIT | $ | 31,014 | $ | 56,761 | $ | (25,747 | ) | (45.4 | )% | |||||
*See Note 5, Investments, of the notes to the condensed consolidated financial statements that are included in this Quarterly Report on Form 10-Q for additional information.
Our Nitrogen Production segment IBIT decreased as a result of lower equity method income from our investment in CF Nitrogen during the nine months ended May 31, 2020, attributable to decreased market pricing of urea and UAN, which are produced and sold by CF Nitrogen. Corporate and Other IBIT decreased primarily as a result of lower earnings from our investment in Ventura Foods, which experienced a significant reduction in demand due to COVID-19, and decreased interest income from our financing businesses due to lower interest rates during the nine months ended May 31, 2020, compared to the same period during the prior year.
45
Revenues by Segment
Energy
Nine Months Ended May 31, | Change | |||||||||||||
2020 | 2019 | Dollars | Percent | |||||||||||
(Dollars in thousands) | ||||||||||||||
Revenues | $ | 4,247,392 | $ | 5,374,110 | $ | (1,126,718 | ) | (21.0 | )% | |||||
The following waterfall analysis and commentary presents the changes in our Energy segment revenues for the nine months ended May 31, 2020, compared to the same period during the prior year.
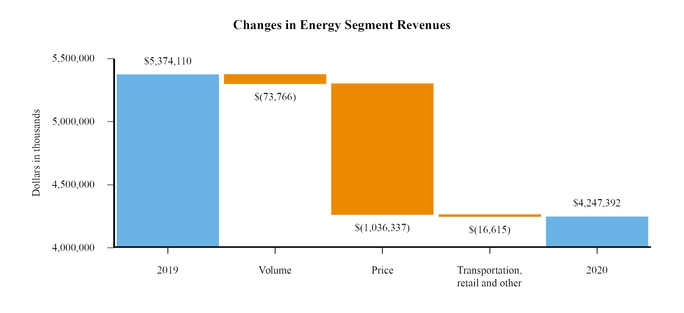
The $1.1 billion decrease in Energy segment revenues reflects the following:
• | Decreased selling prices for refined fuels and propane were driven by global market conditions, including the impact of COVID-19 and product mix, which contributed to $873.6 million and $162.5 million decreases in revenues, respectively. |
• | A 3% decrease of refined fuels volumes contributed to a $126.3 million decrease in revenues, which was partially offset by a 9% increase of propane volumes that contributed to a $52.5 million increase in revenues. Decreased volumes of refined fuels were attributable primarily to lower demand resulting from demand shock in the transportation sector that followed the COVID-19 pandemic and during the fall harvest as a result of poor weather conditions and a smaller crop to harvest in the fall of 2019 across much of the agricultural region of the United States in which we operate. Increased volumes of propane resulted from significant propane demand for crop drying and home heating, particularly during the first half of fiscal 2020. |
46
Ag
Nine Months Ended May 31, | Change | |||||||||||||
2020 | 2019 | Dollars | Percent | |||||||||||
(Dollars in thousands) | ||||||||||||||
Revenues | $ | 17,173,958 | $ | 18,045,057 | $ | (871,099 | ) | (4.8 | )% | |||||
The following waterfall analysis and commentary presents the changes in our Ag segment revenues for the nine months ended May 31, 2020, compared to the same period during the prior year.
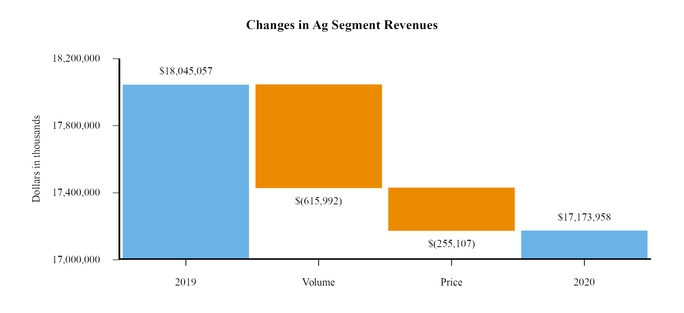
The $871.1 million decrease in Ag segment revenues reflects the following:
• | Volume decreases were primarily driven by lower feed and farm supply and grain and oilseed volumes that contributed to $456.4 million and $366.3 million decreases in revenues, respectively. The decreased volumes resulted from a combination of challenges experienced recently in the agricultural commodity market, including poor weather conditions during fiscal 2019 in the agricultural region of the United States that contributed to lower crop yields and fewer acres planted/harvested, and the impact of global trade tensions between the United States and foreign trading partners, particularly during the first half of fiscal 2020. These volume decreases were partially offset by increased volumes associated with agronomy products due to heightened spring demand and the increase in revenues that resulted from the March 1, 2019, acquisition of the remaining 75% ownership interest in WCD that we did not previously own, the results of which were not included in the entire comparable period of the prior year. |
• | Decreased pricing driven by global market conditions and product mix contributed to $345.8 million and $327.5 million decreases in revenues for grain and oilseed and agronomy, respectively. However, these price decreases were partially offset by market-driven price increases for other products, including feed and farm supplies that increased revenues by $413.5 million. |
All Other Segments
Nine Months Ended May 31, | Change | |||||||||||||
2020 | 2019 | Dollars | Percent | |||||||||||
(Dollars in thousands) | ||||||||||||||
Corporate and Other revenues* | $ | 39,392 | $ | 46,602 | $ | (7,210 | ) | (15.5 | )% | |||||
*Our Nitrogen Production reportable segment represents an equity method investment that records earnings and allocated expenses, but not revenues.
Corporate and Other revenues decreased during the nine months ended May 31, 2020, compared to the same period during the prior year, primarily due to lower revenues in our financing business due to market-driven interest rate reductions.
47
Cost of Goods Sold by Segment
Energy
Nine Months Ended May 31, | Change | |||||||||||||
2020 | 2019 | Dollars | Percent | |||||||||||
(Dollars in thousands) | ||||||||||||||
Cost of goods sold | $ | 3,850,176 | $ | 4,692,910 | $ | (842,734 | ) | (18.0 | )% | |||||
The following waterfall analysis and commentary presents the changes in our Energy segment COGS for the nine months ended May 31, 2020, compared to the same period during the prior year.
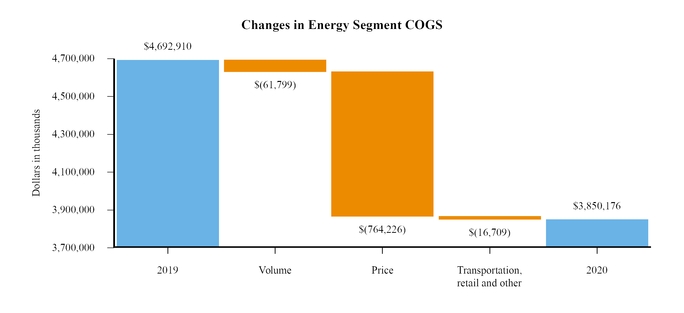
The $842.7 million decrease in Energy segment COGS reflects the following:
• | Decreased costs and a 3% volume decrease for refined fuels driven by global market conditions, including the demand shock in the transportation sector that followed the COVID-19 pandemic and product mix, contributed to $527.8 million and $109.8 million decreases in COGS, respectively. |
• | Decreased costs for propane driven by global market and weather conditions and hedging gains contributed to a $153.5 million decrease of COGS, which was partially offset by a $48.0 million increase driven by a 9% volume increase that resulted from significant propane demand for crop drying and home heating during the first half of fiscal 2020. |
• | The decrease was partially offset by a $42.0 million noncash charge to reduce our refined fuels inventories to their market value at the end of the period and recognition of an $80.8 million gain associated with certain federal excise tax credits as a reduction of COGS during the second quarter of fiscal 2019 that did not reoccur during the current year. |
48
Ag
Nine Months Ended May 31, | Change | |||||||||||||
2020 | 2019 | Dollars | Percent | |||||||||||
(Dollars in thousands) | ||||||||||||||
Cost of goods sold | $ | 16,752,073 | $ | 17,653,970 | $ | (901,897 | ) | (5.1 | )% | |||||
The following waterfall analysis and commentary presents the changes in our Ag segment COGS for the nine months ended May 31, 2020, compared to the same period during the prior year.
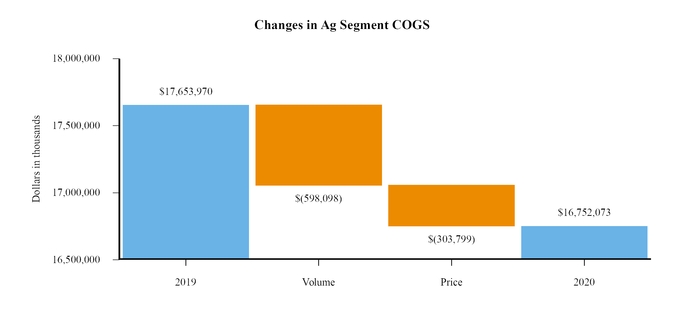
The $901.9 million decrease in Ag segment COGS reflects the following:
• | Volume decreases were primarily driven by lower feed and farm supply and grain and oilseed volumes that contributed to $413.5 million and $364.2 million decreases of COGS, respectively. The decreased volumes resulted from a combination of challenges experienced recently in the agricultural commodity market, including poor weather conditions during fiscal 2019 in the agricultural region of the United States that contributed to lower crop yields and fewer acres planted/harvested, and the impact of global trade tensions between the United States and foreign trading partners, particularly the first half of fiscal 2020. These volume decreases were partially offset by increased volumes associated with agronomy products due to heightened spring demand and the increase of COGS that resulted from the March 1, 2019, acquisition of the remaining 75% ownership interest in WCD that we did not previously own, the results of which were not included in the entire comparable period of the prior year. |
• | Decreased pricing driven by global market conditions and product mix contributed to $401.3 million and $301.8 million decreases of COGS for grain and oilseed and agronomy, respectively. However, these price decreases were partially offset by market-driven price increases for other products, including feed and farm supplies that increased COGS by $360.8 million. |
All Other Segments
Nine Months Ended May 31, | Change | ||||||||||||
2020 | 2019 | Dollars | Percent | ||||||||||
(Dollars in thousands) | |||||||||||||
Nitrogen Production COGS | $ | 1,964 | $ | 1,537 | $ | 427 | NM* | ||||||
Corporate and Other COGS | $ | (2,428 | ) | $ | (4,473 | ) | $ | 2,045 | NM* | ||||
*NM - not meaningful
There were no significant changes to COGS in our Nitrogen Production segment or Corporate and Other during the nine months ended May 31, 2020, compared to the same period during the prior year.
49
Marketing, General and Administrative Expenses
Nine Months Ended May 31, | Change | |||||||||||||
2020 | 2019 | Dollars | Percent | |||||||||||
(Dollars in thousands) | ||||||||||||||
Marketing, general and administrative expenses | $ | 548,340 | $ | 551,438 | $ | (3,098 | ) | (0.6 | )% | |||||
Decreased marketing, general and administrative expenses were primarily due to the impact of a $25.5 million loan loss reserve recorded during the nine months ended May 31, 2019, that did not reoccur during the nine months ended May 31, 2020. The decrease was mostly offset by increased maintenance expenses associated with our information technology platforms and increased expenses related to the implementation of our new enterprise resource planning software. In addition, we had decreased compensation expenses associated with a reduced accrual for potential incentive-based compensation during the current year which was mostly offset by increased payroll expenses due to the employees who joined CHS following our acquisition of the remaining 75% ownership interest in WCD, which were not included in the entire comparable period of the prior year.
Interest Expense
Nine Months Ended May 31, | Change | |||||||||||||
2020 | 2019 | Dollars | Percent | |||||||||||
(Dollars in thousands) | ||||||||||||||
Interest expense | $ | 95,043 | $ | 122,950 | $ | (27,907 | ) | (22.7 | )% | |||||
Interest expense decreased during the nine months ended May 31, 2020, as a result of lower interest rates during the nine months ended May 31, 2020, and decreased average outstanding debt balances compared to the same period of the prior year.
Other Income
Nine Months Ended May 31, | Change | |||||||||||||
2020 | 2019 | Dollars | Percent | |||||||||||
(Dollars in thousands) | ||||||||||||||
Other income | $ | 32,926 | $ | 69,835 | $ | (36,909 | ) | (52.9 | )% | |||||
Other income decreased primarily as a result of nonoperating gains recognized during the nine months ended May 31, 2019, that did not reoccur during the current year, including a $19.1 million gain recognized in connection with the acquisition of the remaining 75% ownership in WCD during the nine months ended May 31, 2019.
Equity Income from Investments
Nine Months Ended May 31, | Change | |||||||||||||
2020 | 2019 | Dollars | Percent | |||||||||||
(Dollars in thousands) | ||||||||||||||
Equity income from investments* | $ | 135,174 | $ | 173,394 | $ | (38,220 | ) | (22.0 | )% | |||||
*See Note 5, Investments, of the notes to the condensed consolidated financial statements that are included in this Quarterly Report on Form 10-Q for additional information.
Equity income from investments decreased during the nine months ended May 31, 2020, compared to the same period during the prior year, primarily due to lower equity income associated with our equity method investments in CF Nitrogen, Ventura Foods and Ardent Mills, which together decreased by a total of $35.0 million. The decreased equity method income for these investments was driven by reduced urea and UAN pricing for CF Nitrogen, negative impacts of COVID-19 for Ventura Foods and lower product margins and volumes as a result of customer consolidation for Ardent Mills.
50
Income Tax Expense
Nine Months Ended May 31, | Change | |||||||||||||
2020 | 2019 | Dollars | Percent | |||||||||||
(Dollars in thousands) | ||||||||||||||
Income tax (benefit) expense | $ | (18,258 | ) | $ | 40,534 | $ | (58,792 | ) | (145.0 | )% | ||||
Decreased income tax expense during the nine months ended May 31, 2020, primarily reflects a tax benefit related to the settlement of a U.S. federal audit resulting in additional tax credit carryovers, as well as equity management assumptions used in fiscal 2020 and the associated impact on income taxes. Effective tax rates for the nine months ended May 31, 2020, and 2019, were (4.8)% and 5.9%, respectively. Federal and state statutory rates applied to nonpatronage business activity were 24.7% and 24.6% for the nine months ended May 31, 2020, and 2019, respectively. Income taxes and effective tax rate vary each year based on profitability and nonpatronage business activity during each of the comparable years.
Liquidity and Capital Resources
Summary
In assessing our financial condition, we consider factors such as working capital and internal benchmarking related to our applicable covenants and other financial criteria. We fund our operations primarily through a combination of cash flows from operations supplemented with borrowings under our revolving credit facility. We fund our capital expenditures and growth primarily through cash, operating cash flow and long-term debt financing.
On May 31, 2020, we had working capital, defined as current assets less current liabilities, of $1.4 billion, and a current ratio, defined as current assets divided by current liabilities, of 1.3 compared to working capital of $1.1 billion and a current ratio of 1.2 on August 31, 2019. On May 31, 2019, we had working capital of $828.4 million and a current ratio of 1.1 compared to working capital of $759.0 million and a current ratio of 1.1 on August 31, 2018.
As of May 31, 2020, we had cash and cash equivalents of $408.1 million, total equities of $8.8 billion, long-term debt (including current maturities) of $1.8 billion and notes payable of $2.2 billion. Our capital allocation priorities include maintaining the safety and compliance of our operations, paying interest on debt and preferred stock dividends, returning cash to our member-owners in the form of cash patronage and equity redemptions and taking advantage of strategic opportunities that benefit our owners. We will continue to consider opportunities to further diversify and enhance our sources and amounts of liquidity. We believe cash generated by operating and investing activities, along with available borrowing capacity under our credit facility, will be sufficient to support our operations for the foreseeable future and we expect to remain in compliance with our loan covenants.
As we continue to navigate the impact of COVID-19 on our business and operations, we have strengthened our liquidity through a variety of means, including curtailing certain spending, reprioritizing capital expenditures and increasing cash on the balance sheet by drawing on our revolving lines of credit. We are actively managing our short-term and long-term liquidity needs, which we expect will include entering into an agreement to raise up to $300 million of debt in the fourth quarter of fiscal 2020. The funding of these notes is anticipated to take place during the first half of fiscal 2021 and will be used to refinance upcoming debt maturities in fiscal 2021 and add liquidity. We also continue to actively monitor counterparty risk.
Fiscal 2020 and 2019 Activity
During fiscal 2019, we completed our acquisition of the remaining 75% ownership interest in WCD that we did not previously own by paying $106.7 million, of which net cash flows were reduced by $8.0 million of cash acquired. WCD is now included in our Ag segment and deepens our presence in the agronomy products market. See Note 15, Acquisitions, of the notes to our condensed consolidated financial statements included in this Quarterly Report on Form 10-Q for additional information.
We also completed planned major maintenance activities during fiscal 2019, which contributed to cash outflows of $232.1 million for the year ended August 31, 2019.
We have a receivables and loans securitization facility ("Securitization Facility") with certain unaffiliated financial institutions ("Purchasers"), which is accounted for as a secured borrowing. Under the Securitization Facility, we and certain of our subsidiaries ("Originators") sell trade accounts and notes receivable ("Receivables") to Cofina Funding, LLC ("Cofina"), a wholly-owned bankruptcy-remote indirect subsidiary of CHS. Cofina in turn transfers the Receivables to the Purchasers. The
51
amount available under the Securitization Facility fluctuates over time based on the total amount of eligible Receivables generated during the normal course of business. As of May 31, 2020, total availability under the Securitization Facility was $383.0 million, all of which had been utilized.
We also have a repurchase facility ("Repurchase Facility") related to the Securitization Facility. Under the Repurchase Facility, we can borrow up to $150.0 million, collateralized by a subordinated note issued by Cofina in favor of the Originators and representing a portion of the outstanding balance of the Receivables sold by the Originators to Cofina under the Securitization Facility. As of May 31, 2020, and August 31, 2019, the outstanding balance under the Repurchase Facility was $150.0 million.
On June 26, 2020, we amended our existing Securitization Facility and Repurchase Facility. As a result of the amendment, the maximum availability of the Securitization Facility was decreased from $700.0 million to $500.0 million and the termination date of the Securitization Facility was extended to September 24, 2020, which may be further extended.
Cash Flows
The following table presents summarized cash flow data for the nine months ended May 31, 2020, and 2019:
Nine Months Ended May 31, | Change | |||||||||||||
2020 | 2019 | Dollars | Percent | |||||||||||
(Dollars in thousands) | ||||||||||||||
Net cash provided by operating activities | $ | 525,843 | $ | 129,911 | $ | 395,932 | 304.8 | % | ||||||
Net cash used in investing activities | (48,533 | ) | (592,490 | ) | 543,957 | 91.8 | % | |||||||
Net cash (used in) provided by financing activities | (292,207 | ) | 174,343 | (466,550 | ) | (267.6 | )% | |||||||
Effect of exchange rate changes on cash and cash equivalents | (786 | ) | (382 | ) | (404 | ) | (105.8 | )% | ||||||
Net increase (decrease) in cash and cash equivalents and restricted cash | $ | 184,317 | $ | (288,618 | ) | $ | 472,935 | 163.9 | % | |||||
Cash flows from operating activities can fluctuate significantly from period to period as a result of various factors, including seasonality and timing differences associated with purchases, sales, taxes and other business decisions. The $395.9 million increase in cash provided by operating activities reflects a combination of working capital decreases, primarily associated with decreased receivables and inventories, which were partially offset by other changes, including decreased net income.
The $544.0 million decrease in cash used in investing activities primarily reflects increased collections of $331.8 million associated with CHS Capital notes receivable, decreased expenditures for major repairs and the acquisition of the remaining 75% ownership interest in WCD during the third quarter of fiscal 2019.
The $466.6 million decrease in cash provided by financing activities primarily reflects increased net cash outflows associated with our notes payable and long-term debt facilities, a $14.4 million increase in cash patronage paid and an increase in equity redemption payments of $9.9 million.
Future Uses of Cash
We expect to utilize cash and cash equivalents, along with cash generated by operating activities to fund capital expenditures, major repairs, debt and interest payments, preferred stock dividends, patronage, equity redemptions and business continuity efforts amid the COVID-19 outbreak and pandemic. The following is a summary of our primary cash requirements for fiscal 2020:
• | Capital expenditures. We expect total capital expenditures for fiscal 2020 to be approximately $457.0 million, compared to capital expenditures of $443.2 million in fiscal 2019. During the nine months ended May 31, 2020, we acquired property, plant and equipment of $316.5 million. |
• | Debt and interest. We expect to repay approximately $39.2 million of long-term debt and finance lease obligations and incur interest payments related to long-term debt of approximately $76.2 million during fiscal 2020. During the nine months ended May 31, 2020, we repaid $20.0 million of scheduled long-term debt maturities. |
• | Preferred stock dividends. We had approximately $2.3 billion of preferred stock outstanding at May 31, 2020. We expect to pay dividends on our preferred stock of approximately $168.7 million during fiscal 2020. |
52
• | Patronage. Our Board of Directors authorized approximately $90.0 million of our fiscal 2019 patronage sourced earnings to be paid to our member owners during fiscal 2020. |
• | Equity redemptions. Our Board of Directors authorized and we expect total redemptions of approximately $100.0 million to be distributed in fiscal 2020 in the form of redemptions of qualified and nonqualified equity owned by individual producer members and association members. During the nine months ended May 31, 2020, we redeemed $86.3 million of member equity. |
Future Sources of Cash
We fund our current operations primarily through a combination of cash flows from operations and committed and uncommitted revolving credit facilities, including our Securitization Facility and Repurchase Facility. We believe these sources will provide adequate liquidity to meet our working capital needs. We fund certain of our long-term capital needs, primarily those related to acquisitions of property, plant and equipment, with cash flows from operations and by issuing long-term debt and term loans. We intend to enter into an agreement to raise up to $300.0 million of debt in the fourth quarter of fiscal 2020, the funding of which is anticipated to take place during the first half of fiscal 2021. In addition, our wholly-owned subsidiary, CHS Capital, makes loans to member cooperatives, businesses and individual producers of agricultural products included in our cash flows from investing activities, and has financing sources as detailed below in CHS Capital Financing.
Working Capital Financing
We finance our working capital needs through committed and uncommitted lines of credit with domestic and international banks. We believe our current cash balances and our available capacity on our committed lines of credit will provide adequate liquidity to meet our working capital needs. The following table summarizes our primary lines of credit as of May 31, 2020:
Primary Revolving Credit Facilities | Maturities | Total Capacity | Borrowings Outstanding | Interest Rates: Based on All Tier Levels for Revolver and Capacity of Uncommitted | ||||||||
(Fiscal Year) | (Dollars in thousands) | |||||||||||
Committed five-year unsecured facility | 2024 | $ | 2,750,000 | $ | 800,000 | LIBOR or Base Rate + 0.00% to 1.55% | ||||||
Uncommitted bilateral facilities | 2020 | 330,000 | 200,000 | LIBOR or Base Rate + 0.00% to 1.375% | ||||||||
Subsequent to May 31, 2020, an additional $250.0 million of capacity became available through the uncommitted bilateral facilities. We also intend to renew $80.0 million of existing capacity on the uncommitted bilateral facilities during the fourth quarter of fiscal 2020 that expired subsequent to May 31, 2020.
Our primary line of credit is a five-year unsecured revolving credit facility with a syndicate of domestic and international banks. The credit facility provides a committed amount of $2.75 billion that expires on July 16, 2024.
In addition to our uncommitted bilateral facilities above, our wholly-owned subsidiaries CHS Europe S.a.r.l. and CHS Agronegocio Industria e Comercio Ltda had uncommitted lines of credit with $380.8 million outstanding as of May 31, 2020. In addition, our other international subsidiaries had lines of credit outstanding of $141.7 million as of May 31, 2020.
Long-term Debt Financing
The following table presents summarized long-term debt data (including current maturities) as of May 31, 2020, and August 31, 2019:
May 31, 2020 | August 31, 2019 | ||||||
(Dollars in thousands) | |||||||
Private placement debt | $ | 1,365,316 | $ | 1,379,840 | |||
Bank financing | 366,000 | 366,000 | |||||
Finance lease obligations | 29,153 | 28,239 | |||||
Other notes and contract payable | 35,241 | 18,601 | |||||
Deferred financing costs | (3,143 | ) | (3,569 | ) | |||
$ | 1,792,567 | $ | 1,789,111 | ||||
53
CHS Capital Financing
For a description of the Securitization Facility, see above in Fiscal 2020 and 2019 Activity.
CHS Capital sells loan commitments it has originated to Compeer Financial, PCA, d/b/a ProPartners Financial on a recourse basis. Total outstanding commitments under the program were $150.0 million as of May 31, 2020, of which $80.2 million was borrowed with an interest rate of 1.49%.
CHS Capital borrows funds under short-term notes issued as part of a surplus funds program. Borrowings under this program are unsecured and bear interest at variable rates ranging from 0.35% to 1.4% as of May 31, 2020, and are due upon demand. Borrowings under these notes totaled $78.6 million as of May 31, 2020.
On September 30, 2019, CHS Capital entered into a credit agreement with a revolving note. Under this agreement, CHS Capital has available capacity of $100.0 million of which no amount was outstanding as of May 31, 2020.
Covenants
Our long-term debt is mostly unsecured; however, restrictive covenants under various debt agreements require maintenance of minimum consolidated net worth and other financial ratios. We were in compliance with all debt covenants and restrictions as of May 31, 2020. Based on our current 2020 projections, we expect continued covenant compliance.
All outstanding private placement notes conform to financial covenants applicable to those of our amended and restated five-year unsecured revolving credit facility. The notes provide that if our ratio of consolidated funded debt to consolidated cash flows is greater than 3.0 to 1.0, the interest rate on all outstanding notes will be increased by 0.25% until the ratio becomes 3.0 or less. During the nine months ended May 31, 2020, and 2019, our ratio of funded debt to consolidated cash flows remained below 3.0 to 1.0.
Patronage and Equity Redemptions
In accordance with our bylaws and upon approval by our Board of Directors, annual net earnings from patronage sources are distributed to consenting patrons following the close of each fiscal year and are based on amounts using financial statement earnings. Patronage earnings for the year ended August 31, 2019, were distributed during the nine months ended May 31, 2020, including the $90.1 million cash portion of this distribution. During the nine months ended May 31, 2019, we distributed cash patronage of $75.7 million.
In accordance with authorization from our Board of Directors, we expect total cash redemptions related to the year ended August 31, 2019, that will be distributed in fiscal 2020, to be approximately $100.0 million and to include redemptions of qualified and nonqualified equity owned by individual producer members and associations. During the nine months ended May 31, 2020, $86.3 million of that amount was redeemed in cash, compared to $76.4 million redeemed in cash during the nine months ended May 31, 2019.
54
Preferred Stock
Dividends paid on our preferred stock during the nine months ended May 31, 2020, and 2019, were $126.5 million. The following is a summary of our outstanding preferred stock as of May 31, 2020, all shares of which are listed on the Global Select Market of Nasdaq:
Nasdaq Symbol | Issuance Date | Shares Outstanding | Redemption Value | Net Proceeds (a) | Dividend Rate (b) (c) | Dividend Payment Frequency | Redeemable Beginning (d) | |||||||||||||||
(Dollars in millions) | ||||||||||||||||||||||
8% Cumulative Redeemable | CHSCP | (e) | 12,272,003 | $ | 306.8 | $ | 311.2 | 8.00 | % | Quarterly | 7/18/2023 | |||||||||||
Class B Cumulative Redeemable, Series 1 | CHSCO | (f) | 21,459,066 | $ | 536.5 | $ | 569.3 | 7.875 | % | Quarterly | 9/26/2023 | |||||||||||
Class B Reset Rate Cumulative Redeemable, Series 2 | CHSCN | 3/11/2014 | 16,800,000 | $ | 420.0 | $ | 406.2 | 7.10 | % | Quarterly | 3/31/2024 | |||||||||||
Class B Reset Rate Cumulative Redeemable, Series 3 | CHSCM | 9/15/2014 | 19,700,000 | $ | 492.5 | $ | 476.7 | 6.75 | % | Quarterly | 9/30/2024 | |||||||||||
Class B Cumulative Redeemable, Series 4 | CHSCL | 1/21/2015 | 20,700,000 | $ | 517.5 | $ | 501.0 | 7.50 | % | Quarterly | 1/21/2025 | |||||||||||
(a) Includes patron equities redeemed with preferred stock.
(b) Class B Reset Rate Cumulative Redeemable Preferred Stock, Series 2, accumulates dividends at a rate of 7.10% per year until March 31, 2024, and then at a rate equal to the three-month LIBOR plus 4.298%, not to exceed 8.00% per annum, subsequent to March 31, 2024.
(c) Class B Reset Rate Cumulative Redeemable Preferred Stock, Series 3, accumulates dividends at a rate of 6.75% per year until September 30, 2024, and then at a rate equal to the three-month LIBOR plus 4.155%, not to exceed 8.00% per annum, subsequent to September 30, 2024.
(d) Preferred stock is redeemable for cash at our option, in whole or in part, at a per share price equal to the per share liquidation preference of $25.00 per share, plus all dividends accumulated and unpaid on that share to and including the date of redemption, beginning on the dates set forth in this column.
(e) The 8% Cumulative Redeemable Preferred Stock was issued at various times from 2003 through 2010.
(f) Shares of Class B Cumulative Redeemable Preferred Stock, Series 1, were issued on September 26, 2013; August 25, 2014; March 31, 2016; and March 30, 2017.
Off-Balance Sheet Financing Arrangements
Guarantees
We are a guarantor for lines of credit and performance obligations of related companies. As of May 31, 2020, our bank covenants allowed maximum guarantees of $1.0 billion, of which $163.8 million were outstanding. We have collateral for a portion of these contingent obligations. We have not recorded a liability related to the contingent obligations as we do not expect to pay out any cash related to them, and the fair values are considered immaterial. The underlying loans to the counterparties for which we provide guarantees were current as of May 31, 2020.
Debt
We have no material off-balance sheet debt.
Loan Participations
We engaged in off-balance sheet arrangements through certain loan participation agreements. Refer to further details about these arrangements in Note 3, Receivables, of the notes to the consolidated financial statements in our Annual Report on Form 10-K for the year ended August 31, 2019.
55
Contractual Obligations
Our contractual obligations presented in Management's Discussion and Analysis of Financial Condition and Results of Operations in our Annual Report on Form 10-K for the year ended August 31, 2019, have not materially changed during the nine months ended May 31, 2020.
Critical Accounting Policies
Other than as described within the Significant Accounting Policies section of Note 1, Basis of Presentation and Significant Accounting Policies, to our unaudited condensed consolidated financial statements included in this Quarterly Report on Form 10-Q, our critical accounting policies as presented in Management's Discussion and Analysis of Financial Condition and Results of Operations in our Annual Report on Form 10-K for the year ended August 31, 2019, have not materially changed during the nine months ended May 31, 2020.
Effect of Inflation and Foreign Currency Transactions
We believe that inflation and foreign currency fluctuations have not had a material effect on our operations, since we conduct an insignificant portion of our business in foreign currencies.
Recent Accounting Pronouncements
See Note 1, Basis of Presentation and Significant Accounting Policies, to our unaudited condensed consolidated financial statements included in this Quarterly Report on Form 10-Q for a description of recent accounting pronouncements that apply to us.
ITEM 3. QUANTITATIVE AND QUALITATIVE DISCLOSURES ABOUT MARKET RISK
We did not experience material changes in market risk exposures for the period ended May 31, 2020, that would affect the quantitative and qualitative disclosures presented in our Annual Report on Form 10-K for the year ended August 31, 2019.
ITEM 4. CONTROLS AND PROCEDURES
Evaluation of Disclosure Controls and Procedures
Under the supervision and with the participation of our management, including our Chief Executive Officer and Chief Financial Officer, we evaluated the effectiveness of our disclosure controls and procedures (as defined in Rule 13a-15(e) under the Securities Exchange Act of 1934 (the "Exchange Act")), as of May 31, 2020. Based on that evaluation, our Chief Executive Officer and Chief Financial Officer concluded that, as of that date, our disclosure controls and procedures were not effective because of the material weaknesses in our internal control over financial reporting disclosed within Management's Annual Report on Internal Control Over Financial Reporting in Item 9A of our Annual Report on Form 10-K for the year ended August 31, 2019.
Status of Remediation of Material Weaknesses in Internal Control Over Financial Reporting
Remediation Actions Taken During the Quarter Ended May 31, 2020
The following remediation efforts were taken during the quarter ended May 31, 2020:
• | Held bi-weekly steering committee meetings consisting of senior finance, legal, information technology ("IT"), operational and human resources leaders to oversee the design and implementation of remediation plans. |
• | Continued developing, executing and monitoring detailed remediation plans in response to each of the remaining previously identified material weaknesses. |
56
Ongoing Remediation Efforts
We continue to enhance our overall financial control environment through the following:
• | Continued execution of our plans designed to remediate the two remaining previously identified material weaknesses, including (1) implementing and reinforcing an adequate process for monitoring proper functioning of internal controls to verify that our accounting policies and procedures are consistently and adequately being performed as relevant by a sufficient number of resources with appropriate knowledge and training and (2) designing and maintaining effective controls over certain IT general controls for information systems that are relevant to the preparation of our financial statements and testing the effectiveness of remediated controls. |
• | Continued hiring for our teams in functional areas as necessary to ensure the size and skill set of those teams is adequate given the size, scale and complexity of our organization, industry and required internal controls over financial reporting. |
Changes in Internal Control Over Financial Reporting
There have been no changes in internal control over financial reporting during the quarter ended May 31, 2020, that have materially affected, or are reasonably likely to materially affect, our internal control over financial reporting.
57
PART II. OTHER INFORMATION
ITEM 1. LEGAL PROCEEDINGS
We are involved as a defendant in various lawsuits, claims and disputes, which are in the normal course of our business. The resolution of any such matters may affect consolidated net income for any fiscal period; however, our management believes any resulting liabilities, individually or in aggregate, will not have a material effect on our condensed consolidated financial statements during any fiscal year.
ITEM 1A. RISK FACTORS
There have been no material changes from the risk factors disclosed in Item 1A of our Annual Report on Form 10-K for the year ended August 31, 2019, except as set forth below. The risk factor below updates the risk factor first included in Part II, Item 1A of our Quarterly Report on Form 10-Q for the quarterly period ended February 29, 2020.
Our business and operations have been and may continue to be adversely affected by the recent COVID-19 outbreak or other similar outbreaks.
Outbreaks of contagious diseases, including the recent outbreak and pandemic of the novel coronavirus that was first detected in Wuhan, China, in December 2019, known as COVID-19, and other adverse public health developments in countries and states where we operate, have had and are expected to continue to have an adverse effect on our business, financial condition and results of operations. These effects include a potential negative impact on the availability of our key personnel; temporary closures of our facilities or the facilities of our members, business partners, customers, suppliers, third-party service providers or other vendors; and the interruption of domestic and global supply chains, distribution channels, liquidity and capital or financial markets. In addition, we have taken and will continue to take temporary precautionary measures intended to help minimize the risk of COVID-19 to our employees, including requiring administrative and other groups of our employees to work remotely, suspending nonessential travel and restricting attendance at industry events and in-person work-related meetings, which could negatively affect our business. Further, COVID-19 has resulted in a widespread health crisis that has affected and is expected to continue to adversely affect the economies and financial markets of many countries and most areas of the United States, which may affect demand for our products and services, such as the declines in demand in our refined fuels, renewable fuels and processing and food ingredients businesses and Ventura Foods experienced during the three months ended May 31, 2020, and our ability to obtain financing for our business. The declines in demand experienced by our refined fuels, renewable fuels and processing and food ingredients businesses and Ventura Foods have adversely affected, and may continue to, and any of these other events could, adversely affect, our business and our financial results. The extent to which COVID-19 will impact our business and our financial results in the future will depend on future developments, which are highly uncertain and cannot be predicted. Such developments may include the ongoing geographic spread of the virus, the severity of the disease, the duration of the outbreak, the extent of any reoccurrence of the coronavirus, the development of vaccines or therapeutic treatments that can restore consumer and business economic confidence and the type and duration of actions that may be taken by various governmental authorities in response to the outbreak and the impact on the U.S. and the global economy, including whether the agricultural industry continues to be designated an essential infrastructure industry and may continue to operate if future lockdowns occur. As a result, at the time of this filing, it is not possible to predict the overall future impact of COVID-19 on our business, liquidity, capital resources and financial results.
58
ITEM 6. EXHIBITS
Exhibit | Description |
Omnibus Amendment No. 6, dated as of May 1, 2020, by and among Cofina Funding, LLC, as seller, CHS Inc., as servicer and as an originator, CHS Capital, LLC, as an originator, each of the conduit purchasers, committed purchasers and purchaser agents set forth on the signature pages thereto and MUFG Bank Ltd. f/k/a The Bank of Tokyo-Mitsubishi UFJ, Ltd., New York Branch, as administrative agent | |
Certification of the Chief Executive Officer Pursuant to Section 302 of the Sarbanes-Oxley Act of 2002. | |
Certification of the Chief Financial Officer Pursuant to Section 302 of the Sarbanes-Oxley Act of 2002. | |
Certification of the Chief Executive Officer Pursuant to 18 U.S.C. Section 1350, as Adopted Pursuant to Section 906 of the Sarbanes-Oxley Act of 2002. | |
Certification of the Chief Financial Officer Pursuant to 18 U.S.C. Section 1350, as Adopted Pursuant to Section 906 of the Sarbanes-Oxley Act of 2002. | |
101 | The following financial information from the CHS Inc. Quarterly Report on Form 10-Q for the quarterly period ended May 31, 2020, formatted in Extensible Business Reporting Language (XBRL): (i) the Condensed Consolidated Balance Sheets, (ii) the Condensed Consolidated Statements of Operations, (iii) the Condensed Consolidated Statements of Comprehensive Income, (iv) the Condensed Consolidated Statements of Cash Flows, and (v) the Notes to the Condensed Consolidated Financial Statements. |
59
SIGNATURES
Pursuant to the requirements of the Securities Exchange Act of 1934, as amended, the registrant has duly caused this report to be signed on its behalf by the undersigned, thereunto duly authorized.
CHS Inc.
(Registrant)
Date: | July 7, 2020 | By: | /s/ Olivia Nelligan | ||
Olivia Nelligan | |||||
Executive Vice President and Chief Financial Officer | |||||
60