Attached files
| file | filename |
|---|---|
| 8-K - FORM 8-K - AKORN INC | tm2024052d1_8k.htm |
Exhibit 99.1

Updated 2020 Forecast June 2020

Disclaimer By reading or reviewing the presentation slides, you agree to be bound by the following limitations. This presentation has been prepared for informational and background purposes only and the information contained herein (unle ss otherwise indicated) has been provided by Akorn, Inc. (together with its subsidiaries, the “Company”). It is confidential and does not constitute or form p art of, and should not be construed as, an offer or invitation to subscribe for, underwrite or otherwise acquire, any securities of the Company or any of its affiliates or enter into any other transaction, nor should it or any part of it form the basis of, or be relied on in connection with, any contract to purchase or subscribe for any sec uri ties of the Company or any of its affiliates, or with any other contract or commitment whatsoever. This presentation does not constitute an information or offering memorandum or a security purchase agreement in whole or in p art . Neither this presentation nor any part of it may be reproduced or redistributed, passed on, or the contents otherwise divulged, directly or indirectly, to any oth er person (excluding the recipient’s professional advisers) or published in whole or in part for any purpose without the prior written consent of the Company. This presentation does not purport to be all - inclusive or to contain all of the information that a person considering the purcha se of any securities may require to make a full analysis of the matters referred to herein. Each recipient of this presentation must make its own independent investig ati on and analysis of, or entering into any other transaction, any securities or other transaction and its own determination of the suitability of any investment, with p art icular reference to its own investment objectives and experience and any other factors which may be relevant to it in connection with such investment. Any assumptions, views or opinions (including statements, projections, forecasts or other forward - looking statements) contained in this presentation represent the assumptions, views or opinions of the Company as at the date indicated and are subject to change without notice. All informat ion not separately sourced is from internal Company data and estimates. The information contained in this presentation has not been independently verified and no representation or warranty, express or implied, is made as to the fairness, accuracy, completeness or correctness of the information contained herein and no reliance should be placed on it. None of the Co mpany or any of its affiliates, advisers, connected persons or any other person accept any liability for any loss howsoever arising (in negligence or otherwi se) , directly or indirectly, from this presentation or its contents or otherwise arising in connection with this presentation. This shall not, however, restrict or exc lude or limit any duty or liability to a person under any applicable law or regulation of any jurisdiction that may not lawfully be disclaimed. 2

Disclaimer (Continued) This presentation includes statements that may constitute “forward - looking statements,” including statements regarding the effects of COVID - 19, as well as expected product launches, plant spending, cash flow, revenue, the Company's long - term business plan and outlook, the Chapter 11 Cases an d the Company's ability to continue operating in the ordinary course while the Chapter 11 Cases are pending, the Company's continued engagement in discu ssi ons with certain of its lenders regarding the Sale, and the Company's ability to complete the Sale . When used in this presentation, the words “will,” “expect,” “continue,” “believe,” “seek,” “anticipate,” “estimate,” “intend,” “could,” “would,” “strives” and similar expressions are generally intended to identify fo rwa rd - looking statements. These statements are made pursuant to the safe harbor provisions of Section 27A of the Securities Act of 1933, as amended, and Section 21E of the Securities Exchange Act of 1934, as amended (the “Exchange Act”). A number of important factors could cause actual results of the Company and its subsidiaries to differ materially from those indicated by such forward - looking statements. These factors include, but are not limited to: ( i ) the Company’s ability to consummate the Sale; (ii) potential adverse effects of the Chapter 11 Cases on the Company’s liquidity and results of operations; (iii) the Company’s ability to obtain t ime ly approval by the Court with respect to the motions filed in the Chapter 11 Cases; (iv) objections that could protract the Chapter 11 Cases; (v) employee attrition a nd the Company’s ability to retain senior management and other key personnel due to the distractions and uncertainties; (vi) the Company’s ability to comply with the r est rictions imposed by the terms and conditions of the DIP Facility and other financing arrangements; (vii) the Company’s ability to maintain relationships with s upp liers, customers, employees and other third parties and regulatory authorities as a result of the Chapter 11 Cases; (viii) the effects of the Chapter 11 Cases on t he Company and on the interests of various constituents, including holders of the Company’s common stock; (ix) the Court’s rulings on the outcome of the Chapter 11 Case s g enerally; (x) the length of time that the Company will operate under Chapter 11 protection and the continued availability of operating capital during the pendency of the Chapter 11 Cases; (xi) risks associated with third party motions in the Chapter 11 Cases, which may interfere with the Company’s ability to consummate the Sa le or an alternative transaction; (xii) increased administrative and legal costs related to the Chapter 11 process; potential delays in the Chapter 11 process due to the effects of the COVID - 19 virus; (xiii) other litigation and inherent risks involved in a bankruptcy process; and (xiv) such other risks and uncertainties out lin ed in the risk factors detailed in Part I, Item 1A, “Risk Factors,” of the Company’s Annual Report on Form 10 - K for the fiscal year ended December 31, 2019 (as filed with the S EC on February 26, 2020), Part II, Item 1A, “Risk Factors,” of the Company’s Quarterly Report on Form 10 - Q for the fiscal quarter ended March 31, 2020 (as filed wi th the SEC on May 11, 2020) and other risk factors identified from time to time in the Company’s filings with the SEC. Readers should carefully review these risk factors, and should not place undue reliance on the Company’s forward - looking statements. These forward - looking statements are based on information, plans and estim ates at the date of this presentation. The Company undertakes no obligation to update any forward - looking statements to reflect changes in underlying ass umptions or factors, new information, future events or other change. This presentation includes certain non - GAAP financial measures, including Adjusted Gross Margin, Adjusted Operating Income, Adju sted EBITDA, Unlevered Free Cash Flow From Operations and Unlevered Free Cash Flow. While the Company believes these are useful measures for investors, t hey are not presented in accordance with GAAP. You should not consider non - GAAP measures in isolation or as a substitute for net income, net cash (used i n) provided by operating activities or any other items calculated in accordance with GAAP. In addition, Adjusted EBITDA has inherent material limitati ons as a performance measure because it adds back certain expenses to net income, resulting in those expenses not being taken into account in the applicable finan cia l measure. Because not all companies use identical calculations, the presentation herein of non - GAAP financial measures may not be comparable to other similarly titl ed measures of other companies. Reconciliations of the non - GAAP financial measures included in this presentation to amounts reported under GAAP appear in the Ap pendix of this presentation. Projections of GAAP measures are not provided for 2021 because such figures are not available on a forward - looking basis and rec onciliations of projected non - GAAP measures to their closest respective GAAP measures for 2021 are not provided because they could not be derived without u nre asonable effort. This presentation is not directed to, or intended for distribution to or use by, any person or entity that is a citizen or re sid ent or located in any locality, state, country or other jurisdiction where such distribution, publication, availability or use would be contrary to law or regulation of such j uri sdiction or which would require any registration or licensing within such jurisdiction. This presentation or any part thereof is not for publication or release i n t he United States, Australia, Canada or Japan. Any failure to comply with these restrictions may constitute a violation of the laws of other jurisdictions. This presentatio n m ust not be acted on or relied on by persons who are not eligible to invest in securities. Any investment or investment activity to which this presentation relate s i s available only to persons eligible to invest in securities and will be engaged in only with such persons. 3
Disclaimer (Continued) This presentation may include information from the S&P Capital IQ Platform Service. Such information is subject to the follow ing : “Copyright © 2020, S&P Capital IQ (and its affiliates, as applicable). This may contain information obtained from third parties, including ratings from credit rat ings agencies such as Standard & Poor’s. Reproduction and distribution of third party content in any form is prohibited except with the prior written permission of th e r elated third party. Third party content providers do not guarantee the accuracy, completeness, timeliness or availability of any information, including ratings, and are not responsible for any errors or omissions (negligent or otherwise), regardless of the cause, or for the results obtained from the use of such content. THIRD PAR TY CONTENT PROVIDERS GIVE NO EXPRESS OR IMPLIED WARRANTIES, INCLUDING, BUT NOT LIMITED TO, ANY WARRANTIES OF MERCHANTABILITY OR FITNESS FOR A PARTICULAR PURPOSE OR USE. THIRD PARTY CONTENT PROVIDERS SHALL NOT BE LIABLE FOR ANY DIRECT, INDIRECT, INCIDENTAL, EXEMPLARY, COMPENSATORY, PUNITIVE, SPECIAL OR CONSEQUENTIAL DAMAGES, COSTS, EXPENSES, LEGAL FEES, OR LOSSES (INCLUDING LOST INCOME OR PROFITS AND OPPORTUNITY COSTS OR LOSSES CAUSED BY NEGLIGENCE) IN CONNECTION WITH ANY USE OF THEIR CONTENT, INCLUDING RATINGS. Credit ratings are statements of opinions and are not statements of fact or recommendations to purchase, hold or sel l s ecurities. They do not address the suitability of securities or the suitability of securities for investment purposes, and should not be relied on as investment ad vice”. This presentation may include information from SNL Financial LC. Such information is subject to the following: “CONTAINS COPY RIG HTED AND TRADE SECRET MATERIAL DISTRIBUTED UNDER LICENSE FROM SNL. FOR RECIPIENT’S INTERNAL USE ONLY”. The information contained in this presentation is provided as at the date of this presentation and is subject to change witho ut notice. 4
Important Information By accepting this presentation, the recipient agrees to use the information herein in accordance with its compliance policies , c ontractual obligations (including, but not limited to, the provisions of that certain confidentiality agreement entered into between the recipient and Akorn, Inc. (the “Co mpany”)), applicable law, including United States federal and state, United Kingdom and other applicable securities laws. This presentation may contain material non - public information concerning the company and its subsidiaries or other affiliates or the securities of any of the foregoing. By accepting this presentation, the recipient agrees, with respect to any such information, that it will not trade or effect oth er transactions to which such information may be relevant until such time as the information is made generally available or is no longer relevant. The recipient agrees th at this restriction will apply to its entire firm other than any personnel who are permitted to trade by such recipient’s legal or compliance department due to the existe nce of information barriers that restrict the recipient’s firm from trading on the basis of material non - public information. 5

Table of Contents • Updated 2020 Forecast • Appendix: Monthly Support Schedules • Appendix: GAAP to Adjusted Reconciliations 6

Key Drivers of 2020 Performance and Outlook 7 Recent Performance Update • COVID - 19 severely impacted our performance beginning in Q2 as demand for our products was reduced by fewer hospital visits and restricted patient access to ophthalmology and optometrist practices. o For the overall portfolio, pull - through at the Big - 3 wholesalers was down an estimated 30% from the peak week of March 30th to the trough week of April 30th. o Several ophthalmology products saw a reduction in pull - through exceeding approximately 80% from peak to trough. o Sales were further pressured by wholesalers focusing on inventories (DOH) in response to lower pull - through, causing our sales to bottom out in May. o Pull - through at the wholesalers have improved in recent weeks. However, the trend is still below historical levels given that some COVID - 19 restrictions remain in place and precautions have limited hospital/clinic productivity. • A gradual recovery to historical pre - COVID pull - through/product utilization is expected by Q4 as restrictions are eased and hospital/clinic productivity normalizes. o Assumes no demand changes due to additional COVID surges. • New product revenue reflects current expectations for approval and launch readiness. • 2020 has also been updated to reflect normal forecast adjustments related to current contract positions and competitive dynamics. These impacts are assumed to carry forward into 2021. Expectations 2H 2020

Updated 2020 Forecast • April and May expected to represent the low point regarding COVID - 19 impact with expected recovery throughout the remainder of the year. • Q4 forecast growth includes new product launch and return to pre - COVID business performance. Note: Reconciliations of Gross Margin to Adjusted Gross Margin, Operating Loss to Adjusted Operating Income, and Net (Loss) I nco me to Adjusted EBITDA appear on pages 18 and 20 of the Appendix. 1. Defined as GAAP gross margin plus non - cash stock compensation expense, amortization, employee retention and other compensation, India costs and FDA compliance related expenses. 2. Defined as GAAP operating income plus (i) amortization, (ii) FDA compliance related expenses, (iii) impairment of fixed assets and other, (iv) legal and financial advisory fees, (v) Fres eni us transaction & Securities Class Action Litigation, (vi) non - cash stock compensation expense, (vii) employee retention and other compensation, (viii) India costs, (ix) litigation rulings, settlemen ts and contingencies, (x) gain on disposal of fixed assets, (xi) other settlements and fees, (xii) merger and acquisition - related expenses and (xii) impairment of goodwill. 3. Adjusted EBITDA as used in this presentation is defined as net (loss) income (minus) plus (i) depreciation expense, (ii) amor tiz ation expense, (iii) interest expense, net, (iv) income tax (benefit) provision, (v) impairment of goodwill, (vi) amortization of deferred financing costs, (vii) non - cash stock compensation expense, (viii) impairm ent of fixed assets, (ix) impairment of intangible assets, (x) loss (gain) on disposal of fixed assets, (xi) employee retention and other compensation, (xii) legal and financial advisory fees, (xiii) FDA compliance rel ated expenses, (xiv) other settlements and fees (xv) Fresenius transaction and Securities Class Action litigation, (xvi) other settlements and fees, (xvii) India costs, (xviii) data integrity investigatio ns and assessment, (xix) merger and acquisition - related expenses, and (xx) litigation rulings, settlements and contingencies. Reconciliation of GAAP Net (Loss) to non - GAAP EBITDA, and Adjusted EBITDA appears on page 20 of t he Appendix. 4. Reconciliations of Net Cash (Used In) Operating Activities to Unlevered Free Cash Flow from Operations and Unlevered Free Cas h F low appear on page 21 of the Appendix. Defined as Net Cash (Used In) Operating Activities plus interest expense, less capital expenditures, proceeds from disposal of assets, and effect of change in exchange rates, retention payments, increased insurance premiums, FDA remediation, restructuring professional fees, cure cost payments, wind down funding and India cost. 8 ACTUAL FORECAST FY Annualized ($ in millions) Q1 2020 Q2 2020 Q3 2020 Q4 2020 2020 Q4 2020 Net Revenue $205 $129 $170 $197 $701 $790 Gross Margin $95 $37 $65 $88 $284 Adjusted Gross Margin 1 102 42 69 91 305 366 % of Net Revenue 50% 33% 41% 46% 44% 46% Operating Income (Loss) ($247) ($41) ($44) $21 ($310) Adjusted Operating Income 2 51 (8) 18 40 101 160 % of Net Revenue 25% (6%) 10% 20% 14% 20% Net (Loss) Income ($257) ($75) ($72) $11 ($392) Adjusted EBITDA 3 59 (0) 26 49 133 194 % of Net Revenue 29% (0%) 16% 25% 19% 25% Net Cash (Used In) Operating Activities ($61) ($19) ($93) $27 ($147) Unlevered Free Cash Flow From Operations 4 ($11) $28 ($15) $36 $38

2020 Quarterly Adjusted EBITDA Bridge: LRP 1 v. Updated Forecast 1. “LRP” refers to the forecast prepared in January 2020 that was included in the Company’s Current Report on Form 8 - K, that was fi led with the SEC on April 22, 2020. 9 • COVID - 19 results in an estimated $36mm reduction of EBITDA relative to the long range plan. • Product demand and other forecast adjustments result in an estimated $18mm of additional contribution margin decline for 2020. • Updated product launch assumptions are estimated to contribute another $11mm to the decline in EBITDA. • Net plant spending, SG&A and R&D are favorable to LRP through April and generally in line with LRP in the forecast periods. ACTUAL FORECAST FY ($ in millions) Q1 2020 Q2 2020 Q3 2020 Q4 2020 2020 2020 LRP $50 $32 $50 $56 $188 COVID-19 Product Contribution Margin Impacts REDACTED 0 (5) (4) 0 (8) REDACTED 0 (4) (1) 0 (6) REDACTED 0 (2) (1) 0 (3) Other Products 1 (18) (3) 0 (20) Total COVID-19 CM Impact 1 (29) (9) 0 (36) Demand/Other Contribution Margin Impact REDACTED (4) (5) (4) (6) (19) REDACTED (2) (1) (1) (1) (5) REDACTED (1) (1) (1) (1) (4) REDACTED (3) (3) (2) (1) (9) REDACTED (0) (0) (1) (3) (4) REDACTED 13 0 0 0 13 FTS 2 2 1 1 6 Other 0 (2) (0) 6 4 Total Demand/Other CM Impact 5 (10) (8) (5) (18) Updated New Product Launch Assumptions CM Impact REDACTED 0 (1) (1) (2) (3) REDACTED 0 0 (6) (1) (7) Total New Product Launch Assumptions CM Impact 0 (1) (7) (3) (11) Total Product CM 6 (40) (24) (7) (65) Operating Expenses Net Plant Spending 1 3 0 0 5 Inventory Loss / Materials Costs (1) 1 (1) (1) (1) SG&A 1 1 0 0 2 R&D 1 1 0 0 2 Total Operating Expense Changes 3 7 (1) (1) 7 Methodology Adjustment Cash LTIP Expense Addback 0 1 1 1 3 Total Adjustments 9 (32) (24) (7) (55) UPDATED 2020 FORECAST $59 ($0) $26 $49 $133

2020 Adjusted EBITDA to Unlevered Free Cash Flow 1. Reconciliation of Net (Loss) Income to Adjusted EBITDA appears on page 20 of the Appendix. 2. Forecast excludes income tax payments and refunds. 3. Reconciliations of Net Cash (Used In) Operating Activities to Unlevered Free Cash Flow from Operations and Unlevered Free Cas h F low appear on page 21 of the Appendix. 4. Forecast does not include any net proceeds related to the sale of India facility. 10 • Akorn continues to generate positive unlevered free cash flow from operations in spite of COVID - 19 impact. • Use of cash primarily driven by non - recurring / restructuring costs as well as interest on prepetition debt. ACTUAL FORECAST FY ($ in millions) Q1 2020 Q2 2020 Q3 2020 Q4 2020 2020 Net (Loss) Income ($257) ($75) ($72) $11 ($392) Net Cash (Used In) Operating Activities ($61) ($19) ($93) $27 ($147) Adjusted EBITDA 1 $59 ($0) $26 $49 $133 Less: Capital Expenditures (12) (10) (11) (11) (44) Less: Cash Income Taxes 2 0 0 0 0 0 Less: Change in Working Capital / Other (59) 38 (30) (1) (52) Unlevered Free Cash Flow From Operations 3 (11) 28 (15) 36 38 Less: Retention Payments (14) (10) (6) (6) (36) Less: Increased Insurance Premiums (6) 0 0 0 (6) Less: FDA Remediation (5) (3) (3) (3) (14) Less: Restructuring Professional Fees (11) (12) (7) 0 (30) Less: Cure Cost Payments 0 0 (10) 0 (10) Less: Winddown Funding 0 0 (35) 0 (35) Less: India Costs 4 (1) (1) (0) 0 (2) Unlevered Free Cash Flow 3 (48) 3 (76) 27 (95)

Top 30 Product Groups – Quarterly Trends 1. Estimated product level revenue. 2. Increase in Q1 2020 Net Sales driven by approximately $36 million of net revenue from a sale of remaining inventory of an una ppr oved product that has since been discontinued. 11 Net Sales ($ in millions) 1 FY 2019A Q4 2019A Q1 2020A Q2 2020F Q3 2020F Q4 2020F FY 2020F Product Group Net Sales Net Sales (%) Net Sales ∆ Sales Net Sales 2 ∆ Sales Net Sales ∆ Sales Net Sales ∆ Sales Net Sales Net Sales Net Sales (%) By 2020 Product Rank Products 1 - 5 Total 186 27% 34 40 75 (45) 30 7 37 5 42 183 26% Products 6 - 10 Total 105 15% 30 (2) 28 (8) 21 10 31 3 34 114 16% Products 11 - 30 Total 177 26% 45 5 50 (13) 37 16 52 11 63 202 29% Top 30 Total 468 69% 110 43 153 (66) 87 33 120 19 139 499 71% All Others 214 31% 52 (1) 52 (10) 42 7 49 9 58 202 29% Grand Total 682 100% 162 42 205 (76) 129 41 170 28 197 701 100% By Dosage Form Ophthalmics 286 42% 78 4 82 (22) 60 26 86 18 104 332 47% Injectables 107 16% 22 32 55 (36) 18 4 23 2 25 120 17% Oral Solids 101 15% 20 3 23 (5) 18 3 21 1 21 82 12% Oral Liquids 79 12% 19 1 19 (7) 13 4 17 3 19 68 10% Topicals 77 11% 13 3 16 (3) 12 4 16 3 20 64 9% Nasal / Inhalation 32 5% 10 1 11 (3) 8 (0) 8 0 8 35 5% Grand Total 682 100% 162 42 205 (76) 129 41 170 28 197 701 100%

Tie out to 2021F presented in Jan 2020 LRP 1 Updated Forecast EBITDA Bridge: Q4 2020 Annualized to 2021 12 ($ in millions) 1. “LRP” refers to the forecast prepared in January 2020 that was included in the Company’s Current Report on Form 8 - K, that was fi led with the SEC on April 22, 2020. Note: Reconciliation of Net (Loss) Income to Adjusted EBITDA for each month in Q4 2020 appears on page 20 of the Appendix. Projections of GAAP measures are not provided for 2021 because such figures are not available on a forward - looking basis and reconciliations of projected non - GAAP measures to their closest respective GAAP mea sures for 2021 are not provided because they could not be derived without unreasonable effort. Assumes Q4 2020 delta vs. LRP ($8mm) persists throughout 2021
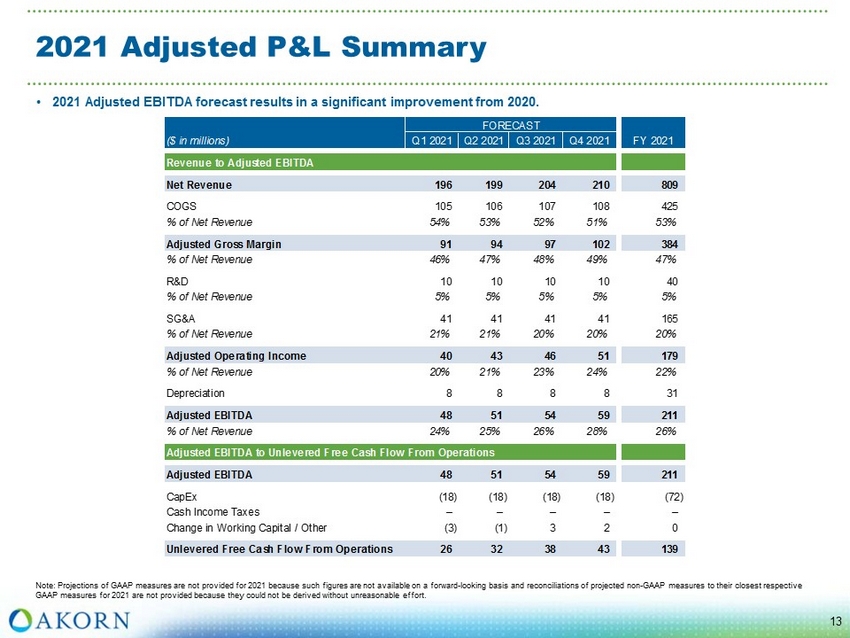
2021 Adjusted P&L Summary 13 • 2021 Adjusted EBITDA forecast results in a significant improvement from 2020. Note: Projections of GAAP measures are not provided for 2021 because such figures are not available on a forward - looking basis a nd reconciliations of projected non - GAAP measures to their closest respective GAAP measures for 2021 are not provided because they could not be derived without unreasonable effort. FORECAST ($ in millions) Q1 2021 Q2 2021 Q3 2021 Q4 2021 FY 2021 Revenue to Adjusted EBITDA Net Revenue 196 199 204 210 809 COGS 105 106 107 108 425 % of Net Revenue 54% 53% 52% 51% 53% Adjusted Gross Margin 91 94 97 102 384 % of Net Revenue 46% 47% 48% 49% 47% R&D 10 10 10 10 40 % of Net Revenue 5% 5% 5% 5% 5% SG&A 41 41 41 41 165 % of Net Revenue 21% 21% 20% 20% 20% Adjusted Operating Income 40 43 46 51 179 % of Net Revenue 20% 21% 23% 24% 22% Depreciation 8 8 8 8 31 Adjusted EBITDA 48 51 54 59 211 % of Net Revenue 24% 25% 26% 28% 26% Adjusted EBITDA to Unlevered Free Cash Flow From Operations Adjusted EBITDA 48 51 54 59 211 CapEx (18) (18) (18) (18) (72) Cash Income Taxes – – – – – Change in Working Capital / Other (3) (1) 3 2 0 Unlevered Free Cash Flow From Operations 26 32 38 43 139

Table of Contents • Updated 2020 Forecast • Appendix: Monthly Support Schedules • Appendix: GAAP to Adjusted Reconciliations 14

Updated 2020 Monthly Forecast 15 Note: Reconciliations of Gross Margin to Adjusted Gross Margin, SG&A to Adjusted SG&A, R&D to Adjusted R&D, Operating Income (Lo ss) to Adjusted Operating Income, Net (Loss) Income to Adjusted EBITDA, and Net Cash (Used In) Operating Activities to Unlevered Free Cash Flow From Operations appear on pages 18, 19, 20 and 21 of the Appendix. 1. Defined as GAAP SG&A less (i) legal and financial advisory fees, (ii) Fresenius transaction & Securities Class Action Litigat ion , (iii) data integrity investigations & assessment, (iv) non - cash stock compensation expense, (v) employee retention and other compensation, (vi) India costs, (vii) gain on disposal of fixed assets, (viii) othe r s ettlements and fees and (ix) merger and acquisition related expenses. 2. Defined as GAAP Research and Development (R&D) less employee retention and other compensation and non - cash stock compensation ex pense. UNAUDITED ACTUAL FORECAST FY ($ in millions) Jan-20 Feb-20 Mar-20 Apr-20 May-20 Jun-20 Jul-20 Aug-20 Sep-20 Oct-20 Nov-20 Dec-20 2020 Net Revenue $64 $75 $65 $41 $36 $52 $55 $56 $59 $65 $66 $67 $701 Gross Margin 28 43 23 11 7 20 20 21 24 29 29 30 284 Gross Margin (%) 43% 58% 36% 26% 18% 38% 37% 38% 40% 44% 44% 45% 41% Adjusted Gross Margin 30 46 26 13 8 21 22 22 25 30 30 31 305 Adj. Gross Margin (%) 47% 61% 40% 31% 22% 41% 40% 40% 43% 46% 46% 47% 44% SG&A 21 24 20 21 23 17 19 55 16 16 16 16 127 Adjusted SG&A 1 14 13 15 13 14 14 14 14 14 14 14 14 167 Research & Development 3 3 3 3 3 3 3 3 3 3 3 3 40 Adjusted R&D 2 3 3 3 2 3 3 3 3 3 3 3 3 38 Operating Income 2 14 (263) (15) (23) (3) (5) (40) 2 7 7 8 (172) Operating Income (%) 3% 18% (401%) (37%) (62%) (5%) (9%) (72%) 3% 10% 10% 12% (24%) Adjusted Operating Income 13 30 8 (3) (9) 4 4 5 8 13 13 14 101 Adj. Operating Income (%) 20% 40% 12% (7%) (25%) 7% 8% 10% 14% 20% 20% 21% 14% Net (Loss) Income (14) 4 (248) (26) (33) (16) (16) (52) (3) 4 4 3 (392) Net Income (%) (21%) 6% (379%) (64%) (91%) (31%) (29%) (93%) (6%) 6% 6% 4% (56%) Adjusted EBITDA $15 $33 $11 ($0) ($6) $7 $7 $8 $11 $16 $16 $17 $133 Adjusted EBITDA (%) 24% 44% 16% (1%) (17%) 13% 13% 15% 19% 24% 24% 25% 19% Net Cash (Used In) Operating Activities (34) (7) (21) (11) 17 (25) (29) (69) 5 7 15 4 (147) Unlevered Free Cash Flow From Operations ($25) $26 ($12) $8 $36 ($16) ($11) ($11) $8 $14 $15 $7 $38

2020 Monthly Adjusted EBITDA to Unlevered Free Cash Flow 16 1. Reconciliation of Net (Loss) Income to Adjusted EBITDA appears on page 20 of the Appendix. 2. Forecast excludes income tax payments and refunds. 3. Reconciliations of Net Cash (Used In) Operating Activities to Unlevered Free Cash Flow from Operations and Unlevered Free Cas h F low appear on 21 of the Appendix. 4. Forecast does not include any net proceeds related to the sale of India facility. UNAUDITED ACTUAL FORECAST FY ($ in millions) Jan-20 Feb-20 Mar-20 Apr-20 May-20 Jun-20 Jul-20 Aug-20 Sep-20 Oct-20 Nov-20 Dec-20 2020 Net (Loss) Income ($14) $4 ($248) ($26) ($33) ($16) ($16) ($52) ($3) $4 $4 $3 ($392) Net Cash (Used In) Operating Activities ($34) ($7) ($21) ($11) $17 ($25) ($29) ($69) $5 $7 $15 $4 ($147) Adjusted EBITDA 1 $15 $33 $11 ($0) ($6) $7 $7 $8 $11 $16 $16 $17 $133 Less: Capital Expenditures (5) (2) (4) (2) (4) (4) (4) (4) (4) (4) (4) (4) (44) Less: Cash Income Taxes 2 0 0 0 0 0 0 0 0 0 0 0 0 0 Less: Change in Working Capital / Other (35) (5) (19) 11 46 (19) (15) (15) 1 1 3 (6) (52) Unlevered Free Cash Flow From Operations 3 (25) 26 (12) 8 36 (16) (11) (11) 8 14 15 7 38 Less: Retention Payments 0 (14) 0 (6) (4) 0 (6) 0 0 (6) 0 0 (36) Less: Increased Insurance Premiums 0 (6) 0 0 0 0 0 0 0 0 0 0 (6) Less: FDA Remediation (2) (2) (1) (1) (1) (1) (1) (1) (1) (1) (1) (1) (14) Less: Restructuring Professional Fees (4) (6) (2) (5) (7) (0) (3) (4) 0 0 0 0 (30) Less: Cure Cost Payments 0 0 0 0 0 0 0 (10) 0 0 0 0 (10) Less: Winddown Funding 0 0 0 0 0 0 0 (35) 0 0 0 0 (35) Less: India Costs 4 (0) (0) (0) (0) (0) (0) (0) 0 0 0 0 0 (2) Unlevered Free Cash Flow 3 (31) (2) (16) (4) 24 (17) (22) (61) 7 7 14 6 (95)
Table of Contents • Updated 2020 Forecast • Appendix: Monthly Support Schedules • Appendix: GAAP to Adjusted Reconciliations 17

GAAP to Adjusted Reconciliations: Gross Margin and Operating Income 18 GAAP Gross Margin to Adjusted Gross Margin GAAP Operating Income to Adjusted Operating Income UNAUDITED ACTUAL FORECAST FY ACTUAL ($ in millions) Jan-20 Feb-20 Mar-20 Apr-20 May-20 Jun-20 Jul-20 Aug-20 Sep-20 Oct-20 Nov-20 Dec-20 2020 Q1 2020 GAAP Gross Margin $28 $43 $23 $11 $7 $20 $20 $21 $24 $29 $29 $30 $285 $95 Add: Amortization 0 0 0 0 – – – – – – – – 0 0 Add: FDA compliance related expenses 2 2 1 1 1 1 1 1 1 1 1 1 14 5 Add: Non-cash stock compensation expense 0 0 0 0 0 0 0 0 0 0 0 0 2 0 Add: Employee retention and other compensation 0 1 1 1 0 0 0 0 0 0 0 0 4 2 Add: India costs 0 0 0 0 – – – – – – – – 1 1 Total Adjustments 2 3 3 2 1 1 1 1 1 1 1 1 21 8 Adjusted Gross Margin $30 $46 $26 $13 $8 $21 $22 $22 $25 $30 $30 $31 $306 $102 UNAUDITED ACTUAL FORECAST FY ACTUAL ($ in millions) Jan-20 Feb-20 Mar-20 Apr-20 May-20 Jun-20 Jul-20 Aug-20 Sep-20 Oct-20 Nov-20 Dec-20 2020 Q1 2020 GAAP Operating Income $2 $14 ($263) ($15) ($22) ($3) ($5) ($40) $2 $7 $7 $8 ($310) ($247) Add: Amortization 2 2 2 2 3 3 3 3 3 3 3 3 29 6 Add: FDA compliance related expenses 2 2 1 1 1 1 1 1 1 1 1 1 14 5 Add: Impairment of fixed assets and other – – – – – – – – – – – – – 0 Add: Legal and financial advisory fees 3 5 2 4 7 0 3 39 – – – – 63 10 Add: Fresenius transaction & Securities Class Action Litigation 0 1 1 0 – – – – – – – – 1 1 Add: Data integrity investigations & assessment 0 0 (0) 0 – – – – – – – – 1 0 Add: Non-cash stock compensation expense 1 2 1 2 2 2 2 2 2 2 2 2 20 3 Add: Employee retention and other compensation 2 5 3 3 1 1 1 1 1 1 1 1 20 10 Add: India costs 0 0 0 0 – – – – – – – – 2 1 Add: Litigation rulings, settlements and contingencies – – (7) – – – – – – – – – (7) (7) Add: (Gain) on disposal of fixed assets 0 – 0 0 – – – – – – – – 0 0 Add: Other settlements and fees – 1 0 0 – – – – – – – – 1 1 Add: Merger and acquisition-related expenses 0 0 0 0 – – – – – – – – 0 0 Add: Impairment of Goodwill – – 268 – – – – – – – – – 268 268 Total Adjustments 11 17 271 12 13 7 9 46 6 6 6 6 410 298 Adjusted Operating Income $13 $30 $8 ($3) ($9) $4 $4 $5 $8 $13 $13 $14 $101 $51

GAAP to Adjusted Reconciliations: SG&A and R&D 19 GAAP SG&A to Adjusted SG&A GAAP R&D to Adjusted R&D UNAUDITED ACTUAL FORECAST FY ACTUAL ($ in millions) Jan-20 Feb-20 Mar-20 Apr-20 May-20 Jun-20 Jul-20 Aug-20 Sep-20 Oct-20 Nov-20 Dec-20 2020 Q1 2020 GAAP SG&A $21 $24 $20 $21 $23 $17 $19 $55 $16 $16 $16 $16 $265 $65 Less: Legal and financial advisory fees 3 5 2 4 7 0 3 39 – – – – 63 10 Less: Fresenius transaction & Securities Class Action Litigation 0 1 1 0 – – – – – – – – 1 1 Less: Data integrity investigations & assessment 0 0 (0) 0 – – – – – – – – 1 0 Less: Non-cash stock compensation expense 1 1 1 1 2 2 2 2 2 2 2 2 17 3 Less: Employee retention and other compensation 1 3 2 2 1 1 1 1 1 1 1 1 14 7 Less: India costs 0 (0) 0 0 – – – – – – – – 1 0 Less: (Gain) on disposal of fixed assets 0 – 0 0 – – – – – – – – 0 0 Less: Other settlements and fees – 1 0 0 – – – – – – – – 1 1 Less: Merger and acquisition-related expenses 0 0 0 0 – – – – – – – – 0 0 Total Adjustments 6 11 5 8 9 2 5 42 2 2 2 2 98 23 Adjusted SG&A $14 $13 $15 $13 $14 $14 $14 $14 $14 $14 $14 $14 $167 $42 UNAUDITED ACTUAL FORECAST FY ACTUAL ($ in millions) Jan-20 Feb-20 Mar-20 Apr-20 May-20 Jun-20 Jul-20 Aug-20 Sep-20 Oct-20 Nov-20 Dec-20 2020 Q1 2020 GAAP R&D $3 $3 $3 $3 $3 $3 $3 $3 $3 $3 $3 $3 $40 $10 Less: Employee retention and other compensation 0 0 0 0 – – – – – – – – 1 1 Less: Non-cash stock compensation expense (0) 0 0 0 0 0 0 0 0 0 0 0 1 0 Total Adjustments 0 1 0 0 0 0 0 0 0 0 0 0 2 1 Adjusted R&D $3 $3 $3 $2 $3 $3 $3 $3 $3 $3 $3 $3 $38 $9
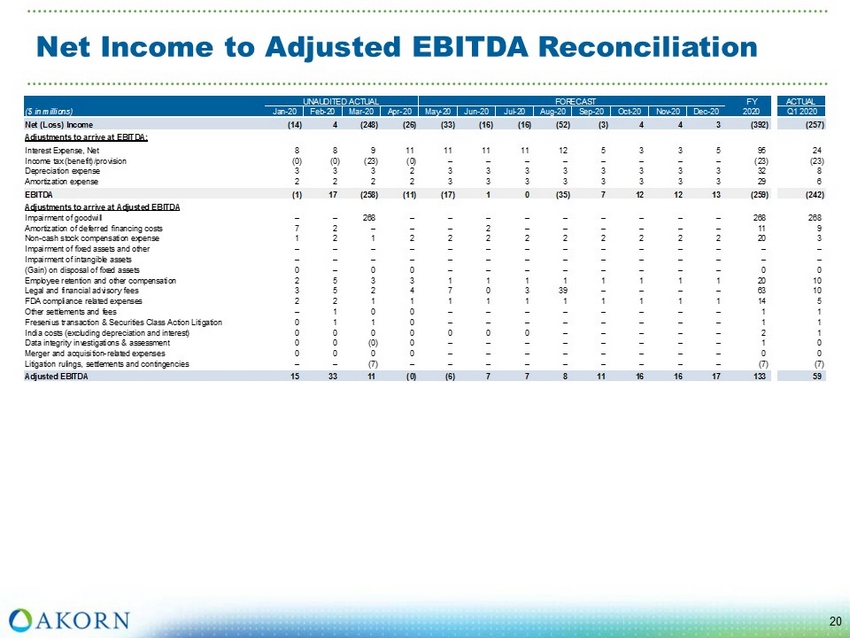
Net Income to Adjusted EBITDA Reconciliation 20 UNAUDITED ACTUAL FORECAST FY ACTUAL ($ in millions) Jan-20 Feb-20 Mar-20 Apr-20 May-20 Jun-20 Jul-20 Aug-20 Sep-20 Oct-20 Nov-20 Dec-20 2020 Q1 2020 Net (Loss) Income (14) 4 (248) (26) (33) (16) (16) (52) (3) 4 4 3 (392) (257) Adjustments to arrive at EBITDA: Interest Expense, Net 8 8 9 11 11 11 11 12 5 3 3 5 95 24 Income tax (benefit)/provision (0) (0) (23) (0) – – – – – – – – (23) (23) Depreciation expense 3 3 3 2 3 3 3 3 3 3 3 3 32 8 Amortization expense 2 2 2 2 3 3 3 3 3 3 3 3 29 6 EBITDA (1) 17 (258) (11) (17) 1 0 (35) 7 12 12 13 (259) (242) Adjustments to arrive at Adjusted EBITDA Impairment of goodwill – – 268 – – – – – – – – – 268 268 Amortization of deferred financing costs 7 2 – – – 2 – – – – – – 11 9 Non-cash stock compensation expense 1 2 1 2 2 2 2 2 2 2 2 2 20 3 Impairment of fixed assets and other – – – – – – – – – – – – – – Impairment of intangible assets – – – – – – – – – – – – – – (Gain) on disposal of fixed assets 0 – 0 0 – – – – – – – – 0 0 Employee retention and other compensation 2 5 3 3 1 1 1 1 1 1 1 1 20 10 Legal and financial advisory fees 3 5 2 4 7 0 3 39 – – – – 63 10 FDA compliance related expenses 2 2 1 1 1 1 1 1 1 1 1 1 14 5 Other settlements and fees – 1 0 0 – – – – – – – – 1 1 Fresenius transaction & Securities Class Action Litigation 0 1 1 0 – – – – – – – – 1 1 India costs (excluding depreciation and interest) 0 0 0 0 0 0 0 – – – – – 2 1 Data integrity investigations & assessment 0 0 (0) 0 – – – – – – – – 1 0 Merger and acquisition-related expenses 0 0 0 0 – – – – – – – – 0 0 Litigation rulings, settlements and contingencies – – (7) – – – – – – – – – (7) (7) Adjusted EBITDA 15 33 11 (0) (6) 7 7 8 11 16 16 17 133 59
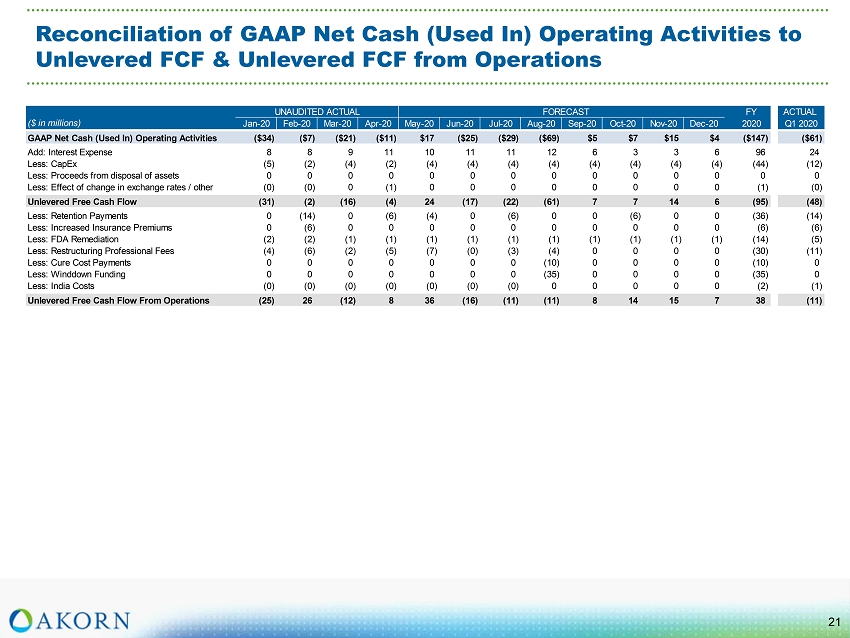
Reconciliation of GAAP Net Cash (Used In) Operating Activities to Unlevered FCF & Unlevered FCF from Operations 21 UNAUDITED ACTUAL FORECAST FY ACTUAL ($ in millions) Jan-20 Feb-20 Mar-20 Apr-20 May-20 Jun-20 Jul-20 Aug-20 Sep-20 Oct-20 Nov-20 Dec-20 2020 Q1 2020 GAAP Net Cash (Used In) Operating Activities ($34) ($7) ($21) ($11) $17 ($25) ($29) ($69) $5 $7 $15 $4 ($147) ($61) Add: Interest Expense 8 8 9 11 10 11 11 12 6 3 3 6 96 24 Less: CapEx (5) (2) (4) (2) (4) (4) (4) (4) (4) (4) (4) (4) (44) (12) Less: Proceeds from disposal of assets 0 0 0 0 0 0 0 0 0 0 0 0 0 0 Less: Effect of change in exchange rates / other (0) (0) 0 (1) 0 0 0 0 0 0 0 0 (1) (0) Unlevered Free Cash Flow (31) (2) (16) (4) 24 (17) (22) (61) 7 7 14 6 (95) (48) Less: Retention Payments 0 (14) 0 (6) (4) 0 (6) 0 0 (6) 0 0 (36) (14) Less: Increased Insurance Premiums 0 (6) 0 0 0 0 0 0 0 0 0 0 (6) (6) Less: FDA Remediation (2) (2) (1) (1) (1) (1) (1) (1) (1) (1) (1) (1) (14) (5) Less: Restructuring Professional Fees (4) (6) (2) (5) (7) (0) (3) (4) 0 0 0 0 (30) (11) Less: Cure Cost Payments 0 0 0 0 0 0 0 (10) 0 0 0 0 (10) 0 Less: Winddown Funding 0 0 0 0 0 0 0 (35) 0 0 0 0 (35) 0 Less: India Costs (0) (0) (0) (0) (0) (0) (0) 0 0 0 0 0 (2) (1) Unlevered Free Cash Flow From Operations (25) 26 (12) 8 36 (16) (11) (11) 8 14 15 7 38 (11)