Attached files
| file | filename |
|---|---|
| EX-99.1 - WEBINAR SCRIPT - FS KKR Capital Corp. II | ex99-1.htm |
| 8-K - CURRENT REPORT - FS KKR Capital Corp. II | fskr-8k_063020.htm |
Exhibit 99.2

1 Thank you for joining • Please submit your questions using the Q&A box. • Google Chrome is the optimal browser for viewing this webinar. • If you are experiencing difficulties viewing the slides please refresh your browser and ensure that you have enabled Adobe Flash Media Player. • If you are experiencing difficulties with audio, listen by phone using the dial - in number on the bottom left - hand side of the screen. To learn more Call 877 - 628 - 8575 visit www.fsinvestments.com

FS KKR Capital Corp. II NYSE: FSKR JULY 2020
3 1 Why list now? 2 How was the initial listing price determined? 3 Why did the shares trade below FSKR’s net asset value? 4 Will there be any secondary market support for FSKR’s stock? 5 What are my options? Frequently asked questions

4 Why list now?

FSKR is the result of a four - way BDC merger 1. As of March 31, 2020. • Four - way BDC merger completed on December 18, 2019 • FSIC II was the surviving entity and was renamed FS KKR Capital Corp. II • Combined entity (FSKR) is listed on the NYSE FSKR 1 FSIC IV CCT II FSIC III FSIC II Total AUM $8.2B Total equity $4.2B FS Investments KKR • The merger between FSIC and CCT was completed on December 19, 2018 • Combined entity (FSK) is listed on the NYSE FSIC FSK (publicly listed) 1 CCT Total AUM $7.4B Total equity $3.0B KKR FS Investments 5

6 Listing creates optionality for all stakeholders 1 List on NYSE • Provides full liquidity for shareholders outside of quarterly tenders • Received shareholder approval to increase regulatory leverage to 2:1 (debt - to - equity) • Provides middle market companies with capital to finance operations 2 Increase borrowing capacity • Ability to increase regulatory leverage helps unlocks over $1 billion in borrowing capacity • Provides sufficient liquidity to support our middle market portfolio companies ‒ Take advantage of investment opportunities created by current market dislocation 3 Strategically deploy capital • Stabilizes NAV by supporting portfolio companies • Goal to enhance long - term dividend yield • Potential to increase return on equity over long term Shareholder benefits extend beyond just liquidity Based on fair value. Only includes debt investments.
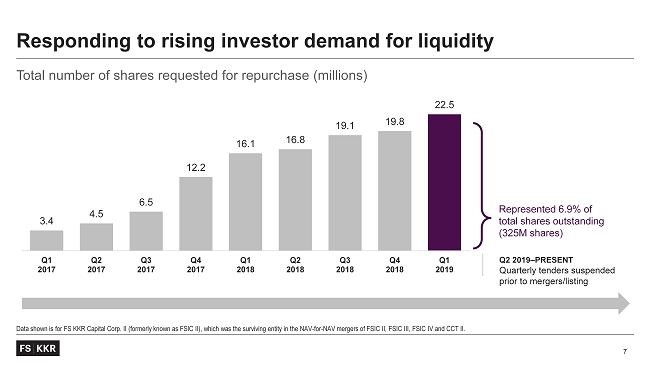
3.4 4.5 6.5 12.2 16.1 16.8 19.1 19.8 22.5 Q1 2017 Q2 2017 Q3 2017 Q4 2017 Q1 2018 Q2 2018 Q3 2018 Q4 2018 Q1 2019 7 Total number of shares requested for repurchase (millions) Data shown is for FS KKR Capital Corp. II (formerly known as FSIC II), which was the surviving entity in the NAV - for - NAV mergers of FSIC II, FSIC III, FSIC IV and CCT II. Responding to rising investor demand for liquidity Q2 2019 – PRESENT Quarterly tenders suspended prior to mergers/listing Represented 6.9% of total shares outstanding (325M shares)

8 How was the initial trading price determined?

9 Initial public offering (IPO) vs. Direct Listing Initial public offering Listing Issuance of newly issued shares Listing of existing shares Price range determined ahead of IPO Price determined by supply and demand for shares Conduct road show with prospective investors

10 Rationale The reverse stock split helped align FSKR’s net asset value (NAV ) per share with its peers. – Many public BDCs issued shares through an initial public offering (IPO) based on an initial share price of $25 per share – Most non - traded BDCs issued shares through a continuous offering based on an initial share price of $10 per share Since BDCs tend to trade in relation to NAV, the reverse split brought FSKR’s NAV per share and stock price closer in line with its peers. HYPOTHETICAL EXAMPLE 4:1 reverse stock split NAV per share Shares Total value Pre - split $6.17 1,000 $6,170 Post - split $24.68 250 $6,170 The full Q2 distribution of $0.60 per share (when adjusting for the reverse stock split) was paid on June 8.

11 For illustrative purposes only. Determining the initial share price Buyers Sellers $13.75 I nitial trading price

12 Why did the shares trade below FSKR’s net asset value?

13 Illustrative dividend yield (NAV) based on a range of valuations Based on net asset value as of March 31, 2020. 1. Implied loss rate refers to the decline in asset value necessary to equate to the assumed price - to - book value. Short - term technical pressure is not reflective of portfolio quality 9.7% 10.2% 10.8% 11.4% 12.2% 13.0% 13.9% 15.0% 16.2% 17.7% 19.4% Price/Book (NAV) 100% 95% 90% 85% 80% 75% 70% 65% 60% 55% 50% Implied loss rate 1 -- 2.6% 5.1% 7.7% 10.2% 12.7% 15.3% 17.9% 20.5% 23.1% 25.5% $24.68 $23.45 $22.21 $20.98 $19.74 $18.51 $17.28 $16.04 $14.81 $13.57 $12.34
14 Will there be any secondary market support for FSKR’s stock?

15 Significant secondary market support across FS/KKR platform $ 120 M+ C o - investment vehicle $100M Fund share repurchase program $ 350 M Co - investment vehicle

16 What are my options? Sell Hold Buy

17 Resources FSPROXY.COM FORMS / OPERATIONAL SUPPORT WEBINAR REPLAYS FAQs FSKKRADVISOR.COM

Questions?

19 Securities offered through FS Investment Solutions, LLC (member FINRA/SIPC). FS Investment Solutions, LLC is an affiliated br oke r - dealer that serves as the wholesaling distributor of non - traded funds sponsored by FS Investments. An investment in any fund sponsored by FS Investments involves a high degree of risk and may be con sidered speculative. Investors are advised to consider the investment objectives, risks, and charges and expenses of the applicable fund carefully before investing. The applicable fund’s prospect us contains this and other information. Investors may obtain a copy of the applicable fund’s prospectus free of charge at www.fsinvestments.com or by contacting FS Investments at 201 Rouse Blvd., Philadelphia, PA 19112 or by phone at 877 - 628 - 8575. Investors should read a nd carefully consider all information found in the applicable fund’s prospectus and other reports filed with the U.S. Securities and Excha nge Commission before investing. Forward - Looking Statements This presentation may contain certain forward - looking statements, including statements with regard to future events or the futur e performance or operations of FSKR. Words such as “believes,” “expects,” “projects,” “future” and “pro forma” or similar expressions are intended to identify forward - looking statements. These forward - l ooking statements are subject to the inherent uncertainties in predicting future results and conditions. Certain factors could cause actual results to differ materially from those projected in these forward - lo oking statements. Some factors that could cause actual results to differ materially include changes in the economy, risks associated with possible disruption in FSKR’s operations or the economy generally due t o t errorism, natural disasters or pandemics such as Covid - 19, future changes in laws or regulations and conditions in FSKR’s operating area, FSKR not being able to utilize the additional leverage capacity , the impact on access to capital due to changes in covenant levels under FSKR’s agreements and other factors, FSKR’s investment yield being less than 10 %, the price at which FSKR’s shares trade on the New York Stock Exchange, FSKR and the investment funds may not purchase FSKR’s shares as anticipated or at all, and cost saving opportunities not materializing in the amounts expected or at all. Other factors are enumerated in the filing s F SKR makes with the U.S. Securities and Exchange Commission. The inclusion of forward - looking statements should not be regarded as a representation that any plans, estimates or expectations will be achieved. FSKR undertakes no obligation to update or revise any forward - looking statements, whether as a result of new information, future events or otherwise. Disclosures