Attached files
| file | filename |
|---|---|
| EX-99.2 - EX-99.2 - Party City Holdco Inc. | d935417dex992.htm |
| EX-10.1 - EX-10.1 - Party City Holdco Inc. | d935417dex101.htm |
| 8-K - 8-K - Party City Holdco Inc. | d935417d8k.htm |
Exhibit 99.1
Excerpts from Offering Memorandum
SUMMARY CONSOLIDATED FINANCIAL AND OTHER DATA
Anagram
The summary unaudited consolidated financial data for the years ended December 31, 2019, 2018 and 2017 and as of December 31, 2019, 2018 and 2017, and summary unaudited consolidated financial data for quarters ended March 31, 2020 and 2019 and as of March 31, 2020 and 2019, has been derived from unaudited financial information that was prepared by our management. The historical results are not necessarily indicative of the results that should be expected in the future, and results for the quarter ended March 31, 2020 are not necessarily indicative of the results to be expected for the full year ending December 31, 2020 or any future period. In addition, such financial data does not necessarily reflect all adjustments required by GAAP for the business and assets related to Anagram. You should read this historical financial data together with the sections entitled “Management’s Discussion and Analysis of Financial Condition and Results of Operations of Anagram,” “Risk Factors,” including specifically “Risk Factors—Risks Related to the Refinancing Transactions—The financial data relating to Anagram presented in this offering memorandum has been prepared by our management and has not been audited. Full financial statements as of and for any of the periods presented are not available as of the date of this offering memorandum. There can be no assurance that Anagram’s results would not differ materially from the financial data included in this offering memorandum if full financial statements were available and, if applicable, audited,” and the corresponding historical financial information related to Party City of which Anagram is a part, which is contained or incorporated by reference in this offering memorandum.
| Three Months Ended March 31, |
Year Ended March 31, |
|||||||||||||||||||
| (in thousands) | 2020 | 2019 | 2019 | 2018 | 2017 | |||||||||||||||
| (unaudited) | ||||||||||||||||||||
| Revenues: |
||||||||||||||||||||
| Net Trade Sales |
$ | 18,812 | $ | 23,989 | $ | 95,810 | $ | 103,663 | $ | 101,171 | ||||||||||
| Net Sales to Affiliates |
20,716 | 20,152 | 56,770 | 86,201 | 68,375 | |||||||||||||||
|
|
|
|
|
|
|
|
|
|
|
|||||||||||
| Total Revenues(1) |
39,529 | 44,141 | 152,580 | 189,864 | 169,546 | |||||||||||||||
|
|
|
|
|
|
|
|
|
|
|
|||||||||||
| Cost of Sales |
28,075 | 30,674 | 112,339 | 126,318 | 107,435 | |||||||||||||||
| Gross Profit |
11,453 | 13,467 | 40,241 | 63,545 | 62,112 | |||||||||||||||
| Selling, General & Administrative expense |
5,924 | 5,360 | 22,223 | 21,781 | 21,235 | |||||||||||||||
|
|
|
|
|
|
|
|
|
|
|
|||||||||||
| Operating income |
5,529 | 8,107 | 18,018 | 41,764 | 40,876 | |||||||||||||||
| Interest expense, net |
— | 0 | 0 | 0 | 1 | |||||||||||||||
| Other (income) expense |
(89 | ) | (192 | ) | (5,873 | ) | (199 | ) | (780 | ) | ||||||||||
|
|
|
|
|
|
|
|
|
|
|
|||||||||||
| Pre-tax income |
5,618 | 8,299 | 23,891 | 41,963 | 41,655 | |||||||||||||||
| Interest income |
— | — | — | — | — | |||||||||||||||
| Depreciation and amortization |
1,630 | 1,736 | 6,842 | 7,251 | 7,977 | |||||||||||||||
| Other adjustments(2) |
350 | (238 | ) | (5,314 | ) | (472 | ) | (662 | ) | |||||||||||
|
|
|
|
|
|
|
|
|
|
|
|||||||||||
| Adjusted EBITDA |
7,598 | 9,796 | 25,420 | 48,742 | 48,971 | |||||||||||||||
|
|
|
|
|
|
|
|
|
|
|
|||||||||||
| Capital Expenditures |
1,395 | 1,026 | 9,168 | 5,625 | 6,888 | |||||||||||||||
| Selected Balance Sheet Information | March 31, | December 31, | ||||||||||||||||||
| 2020 | 2019 | 2019 | 2018 | 2017 | ||||||||||||||||
| Accounts Receivable, net |
18,408 | 20,254 | 22,544 | 22,836 | 21,106 | |||||||||||||||
| Inventory net |
36,488 | 41,267 | 38,462 | 39,155 | 27,901 | |||||||||||||||
| PP&E, net |
21,832 | 24,457 | 21,817 | 24,866 | 24,913 | |||||||||||||||
| Due from (to) affiliates, net(3) |
150,520 | 122,443 | 135,615 | 124,920 | 124,643 | |||||||||||||||
| Total Assets |
272,632 | 249,330 | 265,446 | 249,842 | 234,764 | |||||||||||||||
| Current Liabilities |
25,984 | 23,120 | 24,827 | 26,229 | 22,543 | |||||||||||||||
| Total Liabilities |
50,742 | 38,757 | 48,980 | 41,038 | 37,380 | |||||||||||||||
1
| (1) | Total Revenues takes into account promotional discounts and rebates that may be offered from time to time and such revenues are recorded net of promotions, discounts and rebates. |
| (2) | Other Adjustments to EBITDA in fiscal year 2018 included currency-related losses attributable to Anagram’s Mexican joint venture, which is accounted for using the equity method and other de minimis currency-related loses. Other Adjustments to EBITDA in fiscal year 2019 include the loss on the sale of Anagram’s property sale included in the 2019 sale-leaseback transaction and currency-related losses attributable to Anagram’s Mexican joint venture. |
| (3) | On the Settlement Date, a portion of the “Due from (to) Affiliates, net” balance in an amount equal to the greater of (1) actual purchases by affiliates (domestic and international) of Anagram from Anagram in the 60 days prior to the Settlement Date and (2) $7.9 million will be reallocated to the “Accounts Receivable, net” balance, payable within 60 days. The remaining portion of the “Due from (to) Affiliates, net” balance will be adjusted to zero. |
2
DESCRIPTION OF ANAGRAM’S BUSINESS
Except as otherwise indicated or unless the context otherwise requires, in this section “Description of Anagram’s Business,” the terms “we,” “us” and “our” refer to Anagram.
Anagram is the world innovator and leader in foil balloons and inflated décor, selling in over 80 countries worldwide. Founded in 1978, Anagram leads the industry in the design, manufacturing, licensing and merchandising of a broad range of product offerings and price points in the sector. For the year ended December 31, 2019, approximately 90%-95% of Anagram’s product offerings were concentrated in helium-filled foil balloons with the balance comprised of air-filled foil balloon products. Broad distribution channels provide Anagram strong diversification of revenues and end-use consumers. Anagram’s customer channels include party specialty stores, grocers, mass marketers, parks and value chains, serviced through wholesalers and key domestic and international distributors. With retail price points spanning a quality spectrum from $1 products at value chains to deluxe foil balloon products retailing for as much as $25, Anagram is able to deliver products across the consumer value chain.
Anagram is vertically integrated in terms of product design, engineering, manufacturing and merchandising, with key functions and operations co-located in Eden Prairie, MN. Anagram began manufacturing operations in 1980 and currently operates manufacturing and distribution center facilities encompassing over 250,000 sq. ft. with 340 employees. Anagram’s leading position in the marketplace is attributable to its vertically integrated business model allowing for competitiveness and efficiencies across the value chain including: (i) design and innovation; (ii) exclusive licensing arrangements; and (iii) end-customer focus.
Design and Innovation
Anagram has sustained and grown its leading market position organically through continued product innovation and production refinement as well as research and development as customer preferences continue to evolve. Apart from certain overseas supply agreements, the vast majority of Anagram’s products are manufactured in Eden Prairie. The centralized approach, combined with skilled and experienced long-term employees, foster early collaboration between disciplines that has contributed to significant efficiencies, and synergies, regarding new product design and development, factory automation, reduced manufacturing waste and sustainable manufacturing processes. Recent examples of in-house innovation developments include:
| • | advances in film surface technology extending the inflated life of helium filled foil balloon products, up to three times longer than standard film, contributing to reduced labor and helium costs for retailers; |
| • | increased variety of custom shapes in smaller sizes that use less helium based on feedback from retailers regarding the popularity of such products; and |
| • | non-conductive coatings to minimize the potential for interference with electric distribution and transmission lines, in response to pending regulatory challenges, which are showing promise for new product development in the coming years. |
The advancements in Anagram’s product development coupled with automation in its manufacturing process and a shorter domestic supply chain have contributed to Anagram maintaining a cost competitive position in the marketplace.
Exclusive License Agreements
Anagram enjoys a competitive advantage as the licensee of popular characters and novelty features, including Disney, Sesame Street, LEGO and Sing-a-Tune. Anagram’s creative team develops products to best enhance the unique attributes associated with the particular license, its engineering and manufacturing teams collaborate to optimally and efficiently produce the product and its merchandizing team develops displays and collateral to enhance marketing at the retail point of sale. Balloon sales associated with licenses owned by Anagram accounted for approximately $14.0 million, or 8%, of gross sales for the year ended December 31, 2019. Sales of licensed products, in which the licenses are owned by other Party City affiliates, comprised an additional $21.0, or 21%, million for a total of approximately $35.0 million of gross sales for the year ended December 31, 2019.
3
Balloon sales associated with the top 5 licenses accounted for no more than 15% of gross sales for the year ended December 31, 2019.
Holistic Consumer Focus
Anagram’s close relationships with its customers, through active retail merchandising support in the form of creative and effective product displays, as well as customer support, provides real-time insights contributing to major product innovations and creative inspiration to meet evolving consumer trends. Products to celebrate milestones, birthdays and holidays throughout the year for all ages are balanced with a keen focus on identifying and leveraging trends in the market. In addition to meeting customers at their point of purchase, Anagram is also active on social media and views a target core customer through this medium as the 25-35 millennial age range, female, married, college educated, employed, and someone that likes to decorate, celebrate, be inspired and live socially on Instagram and Pinterest. Examples of recent product launches in response to consumer preferences include: Marblez, metallic trimmed ultrashapes and inflatable pinatas. For the year ended December 31, 2019, approximately 25% to 30% of annual sales came from products introduced in the previous twelve months. Anagram’s ability to stay connected with its customers and understand their evolving preferences has allowed Anagram to maintain and grow its leading market position even as consumer preferences have continued to evolve over the decades.
Market Position
Based on currently available market information and discussions with Anagram’s management, it is estimated that the global foil balloon market was between $900—$1,200 million globally at retail, in 2017, with the United States and Canada representing the largest market with approximately 60-65% of the global market share. We believe that Anagram enjoys approximately 50% market share position in the global foil balloon marketplace, which is significantly more than its nearest competitor. The U.S. domestic market is more mature than the overall international market, representing approximately 70% of Anagram’s net revenue in 2019. Anagram identifies growth opportunities in Europe, which has historically been a very fragmented market. Anagram has benefited from key strategic alliances in targeted regions around the globe in achieving its market penetration, including a joint venture with Mexico’s dominant balloon manufacturer Convertidora. The joint venture’s success has resulted in market share in Mexico and Latin America estimated at between 50%-60%. Anagram has similarly benefited from a strategic supply agreement with a Chinese manufacturer for foil number balloons, a major product category for its distribution to customers globally and a platform for expanding business in China. While Anagram is always looking for strategic acquisitions and joint ventures to further advance its position in markets globally, by maintaining a vertically integrated business model, we believe that Anagram can continue to penetrate international markets organically by delivering market-specific products, at competitive prices, that meet the evolving preferences of customers.
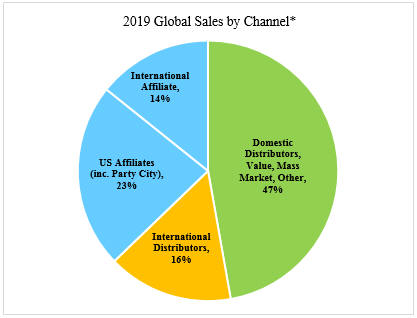
Market Channels
Throughout its 40-year history, Anagram has built important infrastructure to support its distribution network, with in-house customer service and merchandising experts to support field operations and promote the brand’s success. Retail channels served by domestic and international distributor and wholesaler networks, including mass market, domestic value and dollars stores, comprise our largest distribution channel with approximately 63% of our net revenue in fiscal year 2019. Anagram’s Party City affiliates are major customers, representing approximately 23% of net sales and 14% of net sales are associated with international affiliates.
4
| * | Estimates of market size and share reflect management’s reasonable estimates based on currently available market information and internal reports. |
Anagram’s distribution network, built over decades of delivering innovation and service, is a key competitive strength in its vertically integrated model. Anagram has maintained 20-plus year business relationships with a number of its top distributor customers who have come to rely on Anagram’s creativity, service and quality for their foil balloon product offerings. Anagram anticipates greater opportunities for growth in foil balloon product penetration in Europe and other global regions and incremental growth in domestic channels by expanding to retailers supplying consumers with products to engage in do-it-yourself projects and activities providing materials and inspiration related to celebrations.
Manufacturing and Properties
Anagram operates a 16,000 sq. ft. corporate headquarters office, 100,000 sq. ft. manufacturing facility, a 122,000 sq. ft. distribution facility and 29,000 sq. ft. warehouse in Eden Prairie, MN. Anagram manufactures over 90% of goods sold at wholesale (including sales to our U.S. affiliate retail operations). Anagram’s manufacturing facilities are highly automated and its products are produced at globally competitive costs. State-of-the-art printing, forming, folding and packaging equipment support most of these manufacturing operations. Average size and sales volume allow Anagram to operate its manufacturing equipment on a 24-7 basis, thus lowering production costs per unit. In select cases, Anagram uses available capacity to manufacture products for third parties, which allows Anagram to maintain a satisfactory level of equipment utilization. On average, Anagram operates its extrusive coating line at 100% capacity and has supply agreements in place to purchase coasted film to meet all of its current demands. Anagram also has non-disclosure agreements in place with these suppliers to protect intellectual property. In addition to extrusive coating, Anagram operates its printing and fabrication operations at 72% and 73% capacity on average, respectively. Anagram is also known for extremely robust product safety policies and procedures, its partnerships with third party labs and state of the art in-house safety testing program. Anagram’s in-house engineering team is dedicated to quality and safety that provides confidence to its distributors and downstream retail customers.
5
The table below summarizes our principal facilities:
| Anagram Facilities | ||||
| Building | Location | Square Feet | ||
| Distribution Center | Eden Prairie, MN | 122,000 | ||
| Main Facility (Manufacturing / Corporate) | Eden Prairie, MN | 116,000 | ||
| Warehouse | Eden Prairie, MN | 29,000 | ||
| Total Square Feet | 267,000 | |||
Anagram ships products directly to retailers and distributors throughout the world from its distribution center, as well as directly from its domestic and contracted international partners. Anagram uses electronic order entry and information systems allowing it to manage inventory with minimal obsolescence while maintaining strong fill rates and quick order turnaround time.
Our main distribution facility serving all domestic and international wholesalers and distributors is located in Eden Prairie, Minnesota, with nearly 122,000 sq. ft. under one roof. This state-of-the-art facility serves as the main point of distribution for our products and utilizes an inventory management system that allows turnaround times as short as 48 hours.
Anagram also utilizes a bypass system for some of its affiliate orders, which allows it to ship products directly from selected third-party suppliers to our company-owned warehouses, thus bypassing Anagram’s distribution facility. In addition to lowering our distribution costs, this bypass system enhances our warehouse capacity.
Intellectual Property
Anagram has developed proprietary technologies that we believe provide it an advantage in the balloon industry in which it operates. Anagram seeks to protect its intellectual property rights, including its intellectual property rights in these proprietary technologies, through patent, trademark, copyright and trade secret laws, as well as confidentiality agreements and other contractual provisions to restrict access to and disclosure of its intellectual property. Although many of Anagram’s patents, trademarks, copyrights and other intellectual property rights are not material to its business individually, we believe that, in the aggregate, Anagram’s intellectual property rights have significant value and are important to the marketing of its brand and the favorable perception of its products.
As of March 31, 2020, Anagram owned 13 issued U.S. utility patents and two pending U.S. patent applications. If the U.S. utility patents currently issued to Anagram are maintained, the expiry dates run from 2021 through 2031. Anagram owns four U.S. design patents. Assuming they are maintained, the U.S. design patents currently issued to Anagram will expire in 2020. Anagram also owns 13 U.S. trademark registrations, 44 foreign trademark registrations, 13 pending U.S. trademark applications and 13 pending foreign trademark applications. While trademark registrations in both the United States and foreign countries have terms of limited duration (which may vary from country to country), there is no limit on the number of times that the registrations may be renewed if they remain in use in commerce, and if all required filings and payments are made with the applicable trademark offices. Further, even if a federal registration of a trademark in the United States is not renewed, the owner of the trademark may retain its common law trademark rights thereafter, for as long as the marks remain in use in commerce in the applicable state(s). Additionally, we own 160 U.S. copyright registrations and 30 U.S. copyright applications in process.
6
Anagram Management
James Plutt is the President of Anagram. Mr. Plutt has overall responsibility for all activities of Anagram and has been in this role since 2000. Mr. Plutt joined Anagram in 1983 as the controller and was promoted to Vice President of Finance in 1987 overseeing all financial planning, accounting, treasury, legal and support activities. Prior to joining Anagram, Mr. Plutt was a Certified Public Accountant for Arthur Andersen & Co.
Cynthia Mark joined Anagram in 2015 and serves as Vice President of Operations, Supply Chain Management, and Information Technology. Ms. Mark is responsible for overall manufacturing; production forecasting, scheduling, and sourcing; and business information systems, data and reporting. Prior to joining Anagram, she served in multiple roles, including Vice President of Global Supply Chain Management and Information Technology, and Vice President of Operations for Vision-Ease Lens. Ms. Mark also held various supply chain management and consulting roles for companies including M4RK Solutions, Nuvolution, Mallinckrodt, Imation and Hoffman Engineering. Ms. Mark holds an M.B.A. from the University of St. Thomas, St. Paul, Minnesota, and a B.S. from the Carlson School of Management at the University of Minnesota.
Mark Sifferlin is the Vice President of Creative and Marketing. Mr. Sifferlin worked for Hallmark prior to joining Anagram in 1996. From Anagram’s headquarters in Minneapolis, Mr. Sifferlin directs the in-house art staff as well as artists and resources in New York, and coordinates the design of private label products for third parties.
Christopher Wiles serves as the Corporate Controller and has been in this role since 2016. Mr. Wiles is responsible for overseeing all financial planning, reporting and accounting. Mr. Wiles joined Anagram in 2002 as Assistant Controller. Prior to joining Anagram, Mr. Wiles held financial management positions for various companies within aerospace/Dept. of Defense, semiconductor and food processing industries. Mr. Wiles holds a Bachelor of Business Administration from St. Bonaventure University and is a Certified Management Accountant and a Certified Internal Auditor.
Molly Kuhl is the Director of North American Sales. Ms. Kuhl has been with Anagram for 26 years. Ms. Kuhl has been in the position since October of 2019. Prior to assuming this role, Ms. Kuhl was a Regional Sales Manager for Anagram. Before working for Anagram Ms. Kuhl was a balloon buyer for 120 stores of Mr. Bulky, which was a mall-based retailer.
Description of Related Party Transactions
Historically, Holdings and its affiliates, have provided certain services to Anagram. In connection with the consummation of the Refinancing Transactions, Anagram and Holdings and/or its affiliates intend to enter into certain agreements that will provide a framework for their ongoing relationship, including a services agreement, a product purchase agreement, and an intellectual property license agreement, as described in “Certain Relationships and Related Party Transactions—Intra-Company Agreements.”
Description of Anagram’s Indebtedness
As of March 31, 2020, Anagram had no long-term debt.
7
MANAGEMENT’S DISCUSSION AND ANALYSIS OF FINANCIAL CONDITION AND RESULTS OF OPERATIONS
OF ANAGRAM
The following management’s discussion and analysis should be read in conjunction with “Summary Consolidated Financial and Other Data—Anagram.” The following management’s discussion and analysis contains forward-looking statements that reflect Anagram’s future plans, estimates, beliefs and expected performance. The forward-looking statements are dependent upon events, risks and uncertainties that may be outside Anagram’s control. Anagram’s actual results may differ materially from those anticipated in these forward-looking statements as a result of various factors, including those set forth under “Risk Factors,” and in other parts of this offering memorandum. As a result of these risks, uncertainties and assumptions, the forward-looking events discussed may not occur.
Except as otherwise indicated or unless the context otherwise requires, in this section “Management’s Discussion and Analysis of Financial Condition and Results of Operations of Anagram,” the terms “we,” “us” and “our” refer to Anagram.
Basis of Presentation
Anagram is the world innovator and leader in foil balloons and inflated décor. Because the summary historical combined financial data that we have included in this offering memorandum is limited in scope and relates to the performance of Anagram prior to completion of the Refinancing Transactions, this management’s discussion and analysis is similarly limited. See the form of the Anagram Indentures that are attached as Exhibits A and B to this offering memorandum and specifically the covenant entitled “Reports” for a description of Anagram’s reporting requirements following the issuance of the Anagram Notes.
Factors Affecting Anagram’s Financial Condition and Results of Operations
In assessing the performance of Anagram, management considers a variety of performance and financial measures, including: revenues, cost of sales, gross profit, and Sales, General & Administrative expenses. Anagram management also reviews other metrics such as pre-tax income (loss) and Adjusted EBITDA.
Revenues
Revenue is recognized when product is shipped and ownership is transferred to the customer. For most wholesale sales, control transfers upon the shipment of the product as: (i) legal title transfers on such date and (ii) we have a present right to payment at such time. Wholesale sales returns are not significant as we generally only accept the return of goods that were shipped to the customer in error or that were damaged when received by the customer. Additionally, due to our extensive history operating as a leading balloon product wholesaler, we have sufficient history with which to estimate future sales returns and we use the expected value method to estimate such activity.
Cost of Sales
Cost of sales reflects the production costs (i.e., raw materials, labor and overhead) of our manufacturing facilities and processes, product development, royalties associated with sale of licensed goods, inbound freight to our manufacturing and distribution facilities and distribution costs related to our distribution center and outbound freight to get goods to our wholesale customers.
Anagram’s cost of sales increases in higher volume periods as the direct costs of manufactured and purchased goods and freight are generally tied to net sales. However, other costs are largely fixed, such as our facility costs, or vary based on other factors and do not necessarily increase as sales volume increases. Changes in the mix of our products may also impact our overall cost of sales. The direct costs of manufactured and purchased goods are influenced by raw material costs (inks, coated film, petroleum-based resins), domestic and international labor costs in the countries where our goods are manufactured or purchased and logistics costs associated with transporting our goods.
Cost of sales related to sales from our wholesale operations to our retail operations are eliminated in our consolidated financial statements.
8
Selling, General and Administrative Expenses
Selling, general and administrative expenses include all operating costs not included elsewhere in the statement of operations and comprehensive (loss) income. These expenses include payroll and other expenses related to operations at our corporate offices, including occupancy costs, related depreciation and amortization, art and development costs, marketing costs, including trade shows and samples, distributor expense, mass merchant expenses and computer hardware and software expenses. These expenses generally do not vary proportionally with net sales.
Adjusted EBITDA
Anagram defines EBITDA as net income (loss) before interest expense, net, income taxes, depreciation and amortization. We define Adjusted EBITDA as EBITDA, as further adjusted to eliminate the impact of certain items that we do not consider indicative of our core operating performance such as currency-related losses attributable to Anagram’s Mexican joint venture. We caution investors that amounts presented in accordance with our definition of Adjusted EBITDA may not be comparable to similar measures disclosed by other issuers, because not all issuers calculate Adjusted EBITDA in the same manner. We believe that Adjusted EBITDA is an appropriate measure of operating performance in addition to EBITDA because we believe it assists investors in comparing our performance across reporting periods on a consistent basis by eliminating the impact of items that we do not believe are indicative of our core operating performance.
Factors Affecting Anagram’s Results
Anagram’s growth is ultimately dependent on demand generated from retailers served by its wholesaler and distributor network as well as demand from Party City retail stores and other international affiliates. While the price points for Anagram’s products are affordable and allow customers to flex along a broad spectrum of price points, certain factors, such as store labor and helium costs, may impact demand by retailers. Anagram’s products require labor to inflate the balloons at the point of purchase. As store labor models change, dedicated staff to perform these functions may be impacted. Anagram has anticipated and responded to these pressures and worked to develop products that retain helium more efficiently, providing longer shelf-life and less frequent restocking of consumer accessible products.
Helium availability has also impacted demand for Anagram’s products over the years. Historically, a by-product of natural gas production, helium supplies are a global commodity controlled by a small number of producers. Most recently, in 2019, world helium supplies were impacted by geopolitical factors outside Anagram’s control. The increase in costs for helium tanks, a core component necessary for finished balloon products, led to reduced demand by end-user retailers. The impact can be seen in Anagram’s financial performance in 2019, with total revenues impacted by approximately 20%, impacting both third party and affiliate sales. Expansion of domestic helium production and availability has returned supplies and pricing to normalized levels and should provide stability to this product input.
Anagram’s performance for the quarter ended March 31, 2020, similar to many suppliers of consumer products, has been impacted by the COVID-19 pandemic. With the forced closure for a subset of a significant portion of retailers selling Anagram’s products due to state and local regulations during the quarter, Anagram saw sales declines of 10% on a year-over-year basis. Other components of the distribution network, grocers and mass market retailers, have remained opened and supported demand for Anagram products.
9
Results of Operations
Three Months Ended March 31, 2020 Compared to Three Months Ended March 31, 2019
The following table sets forth information comparing the components of operations and comprehensive income for the periods indicated.
| Three Months Ended March 31, |
||||||||
| (in thousands) | 2020 | 2019 | ||||||
| (unaudited) | ||||||||
| Revenues: |
||||||||
| Net Trade Sales |
$ | 18,812 | $ | 23,989 | ||||
| Net Sales to Affiliates |
20,716 | 20,152 | ||||||
|
|
|
|
|
|||||
| Total revenues |
39,529 | 44,141 | ||||||
| Cost of Sales |
28,075 | 30,674 | ||||||
|
|
|
|
|
|||||
| Gross Profit |
11,453 | 13,467 | ||||||
| Sales, General & Administrative expenses |
5,924 | 5,360 | ||||||
|
|
|
|
|
|||||
| Operating income |
5,529 | 8,107 | ||||||
| Interest expense, net |
— | 0 | ||||||
| Other (income) expense |
(89 | ) | (192 | ) | ||||
|
|
|
|
|
|||||
| Pre-tax income |
5,618 | 8,299 | ||||||
| Interest income |
— | — | ||||||
| Depreciation and amortization |
1,630 | 1,736 | ||||||
| Other adjustments(1) |
350 | (238 | ) | |||||
|
|
|
|
|
|||||
| Adjusted EBITDA |
7,598 | 9,796 | ||||||
|
|
|
|
|
|||||
| (1) | Other Adjustments to EBITDA in fiscal year 2018 included currency-related losses attributable to Anagram’s Mexican joint venture, which is accounted for using the equity method and other de minimis currency-related loses. Other Adjustments to EBITDA in fiscal year 2019 include the loss on the sale of Anagram’s property included in the 2019 sale-leaseback transaction and currency-related losses attributable to Anagram’s Mexican joint venture. |
Total Revenues
Total revenues were $39.5 million for the three months ended March 31, 2020, a decrease of $4.6 million, or 10%, compared to $44.1 million for the three months ended March 31, 2019. A decline in sales to Anagram’s third party wholesale and distributor customers (Net Trade Sales) drove the revenue declines, as the impact on consumer behavior from COVID-19 concerns had a greater impact on these channels than the Party City and international affiliate channels.
Gross Profit and Cost of Sales
Cost of Sales was $28.1 million for the three months ended March 31, 2020, a decrease of $2.6 million, or 8%, compared to $30.7 million for the three months ended March 31, 2019. Gross profit was $11.5 million for the three months ended March 31, 2020, a decrease of $2.0 million, or 15%, compared to $13.5 million for the three months ended March 31, 2019. Gross margin for the three months ended March 31, 2020 was 29% compared to 31% for the three months ended March 31, 2019. The decrease in gross margin was largely driven by lower sales, contributing to lower fixed cost leverage.
Selling, General and Administrative Expenses
Selling, general and administrative expenses were $5.9 million for three months ended March 31, 2020, an increase of $0.6 million, or 11%, compared to $5.4 million for the three months ended March 31, 2019. Selling, general and administrative expenses increased due to certain severance costs for departed employees that were recorded in this period related to cost management initiatives.
10
Year Ended December 31, 2019 Compared to Year Ended December 31, 2018
The following table sets forth information comparing the components of operations and comprehensive income for the periods indicated.
| Year Ended December 31, | ||||||||
| 2018 | 2019 | |||||||
| Revenues: |
||||||||
| Net Trade Sales |
$ | 103,663 | $ | 95,810 | ||||
| Net Sales to Affiliates |
86,201 | 56,770 | ||||||
|
|
|
|
|
|||||
| Total revenues |
189,864 | 152,580 | ||||||
| Cost of Sales |
126,318 | 112,339 | ||||||
|
|
|
|
|
|||||
| Gross Profit |
63,545 | 40,241 | ||||||
| Sales, General & Administrative expenses |
21,781 | 22,223 | ||||||
| Operating income |
41,764 | 18,018 | ||||||
| Interest expense, net |
0 | 0 | ||||||
| Other (income) expense |
(199 | ) | (5,873 | ) | ||||
|
|
|
|
|
|||||
| Pre-tax income |
41,963 | 23,891 | ||||||
| Interest income |
— | — | ||||||
| Depreciation and amortization |
7,251 | 6,842 | ||||||
| Other adjustments(1) |
(472 | ) | (5,314 | ) | ||||
|
|
|
|
|
|||||
| Adjusted EBITDA |
48,742 | 25,420 | ||||||
|
|
|
|
|
|||||
| (1) | Other Adjustments to EBITDA in fiscal year 2018 included currency-related losses attributable to Anagram’s Mexican joint venture, which is accounted for using the equity method and other de minimis currency-related loses. Other Adjustments to EBITDA in fiscal year 2019 include the loss on the sale of Anagram’s property sale included in the 2019 sale-leaseback transaction and currency-related losses attributable to Anagram’s Mexican joint venture. |
Total Revenue
Total revenue was $152.6 million for the year ended December 31, 2019, a decrease of $37.3 million, or 20%, compared to $189.9 million for the year ended December 31, 2018. Approximately $23.4 million of the decrease was attributable to the helium shortage that limited the availability of helium and raised costs for end-user retailers. The balance of the decrease was comprised of $19.4 million attributable to a one-time, negative inventory adjustment at the U.S. and international affiliates for excess product orders and inventory timing, offset by a $5.5 million benefit related to new product sales, market growth and price increases. Revenue in 2018, at $189.9 million, was considerably higher than previous years, and was driven by new product launches and assortment fulfillment for number and letter shaped balloon product in both affiliate and other retail channels.
Gross Profit and Cost of Sales
Cost of sales was $112.3 million for the year ended December 31, 2019, a decrease of $14.0 million, or 11%, compared to $126.3 million for the year ended December 31, 2018. Gross profit was $40.2 million for the year ended December 31, 2019, a decrease of $23 million, or 37%, compared to $63.5 million for the year ended December 31, 2018. Gross margin for the year ended December 31, 2019 was 26% compared to 33% for the year ended December 31, 2018. The decrease in gross margin was largely driven by lower sales impacted by helium shortages, product mix with lower margin and lower fixed cost leverage in manufacturing and distribution overhead.
Selling, General and Administrative Expenses
Selling, general and administrative expenses were $22.2 million for year ended December 31, 2019, an increase of 2% from $21.8 million for the year ended December 31, 2018. As sales declined due to the helium impact, management put in place cost management measures. Overall, cost increases of 2% from the year ended December 31, 2018 to the year ended December 31, 2019, were in line with average inflation.
11
USE OF PROCEEDS
We will not receive any cash proceeds from tendering eligible holders in the Exchange Offers. Any Existing Notes that are validly tendered by eligible holders and exchanged pursuant to the Exchange Offers will be retired and cancelled.
We anticipate that the Rights Offering and the Private Placement will result in cash gross proceeds of $100.0 million to Anagram. Anagram expects to distribute $90.0 million of such proceeds to Party City, with the remaining $10.0 million to be used by Anagram for working capital and general corporate purposes. Party City expects to use the $90.0 million distribution for working capital and general corporate purposes, including to pay fees and expenses related to the Refinancing Transactions. See “Summary—Sources and Uses of Cash Proceeds.”
12
CAPITALIZATION
The following table sets forth our unaudited consolidated cash and cash equivalents and capitalization as of March 31, 2020 on an actual basis and on an as adjusted basis after giving pro forma effect to the Refinancing Transactions as if they had occurred on March 31, 2020. The following table should be read in conjunction with (i) “Management’s Discussion and Analysis of Financial Condition and Results of Operations” and the audited consolidated financial statements and the related notes thereto for and as of the year ended December 31, 2019 included in our 2019 Annual Report, each of which is incorporated herein by reference; (ii) “Management’s Discussion and Analysis of Financial Condition and Results of Operations” and the unaudited consolidated financial statements and the related notes thereto for and as of the three months ended March 31, 2020 included in our Quarterly Report, each of which is incorporated herein by reference; and (iii) the sections entitled “Summary Consolidated Financial and Other Data” and “Use of Proceeds” which appear elsewhere in this offering memorandum.
The as adjusted amounts relating to the Exchange Offers assume the issuance of 18,825,875 shares of Common Stock, the entire outstanding principal amounts of the Existing Notes are validly tendered and accepted at or prior to the Early Participation Time and that the Refinancing Transactions are consummated on the terms described herein. The as adjusted amounts may vary depending upon the principal amounts of Existing Notes validly tendered and accepted in the Exchange Offers, which will additionally affect the amount of First Lien Party City Notes and Second Lien Anagram Notes issued in the Exchange Offers.
| As of March 31, 2020 | ||||||||
| (in millions) | Actual | As Adjusted | ||||||
| (unaudited) | ||||||||
| Cash and cash equivalents(1) |
$ | 194.4 | $ | 284.4 | ||||
|
|
|
|
|
|||||
| Long-term debt (including current portion): |
||||||||
| Senior Credit Facilities: |
||||||||
| ABL Credit Facility(2) |
381.4 | 381.4 | ||||||
| Term Loan Facility(2) |
716.2 | 716.2 | ||||||
| 2023 Notes(2) |
347.2 | — | ||||||
| 2026 Notes(2) |
495.1 | — | ||||||
| First Lien Party City Notes |
— | 190.0 | ||||||
| First Lien Anagram Notes |
— | 110.0 | ||||||
| Second Lien Anagram Notes |
— | 100.0 | ||||||
| Other debt(3) |
14.9 | 14.9 | ||||||
|
|
|
|
|
|||||
| Total debt |
1,954.9 | 1,512.5 | ||||||
| Stockholders’ equity: |
||||||||
| Common stock (94,491,352 shares outstanding and 121,708,422 shares issued at March 31, 2020) |
1.2 | 1.4 | ||||||
| Additional paid-in capital |
933.2 | 933.2 | ||||||
| Retained (deficit) earnings |
(578.7 | ) | (36.6 | ) | ||||
| Accumulated other comprehensive loss |
(47.9 | ) | (47.9 | ) | ||||
| Total stockholders’ equity before common stock held in treasury |
307.7 | 850.0 | ||||||
|
|
|
|
|
|||||
| Less: Common stock held in treasury, at cost (27,217,070 shares at March 31, 2020) |
(327.2 | ) | (327.2 | ) | ||||
|
|
|
|
|
|||||
| Total stockholders’ equity |
(19.5 | ) | 522.9 | |||||
|
|
|
|
|
|||||
| Total capitalization |
$ | 1,935.4 | $ | 2,035.4 | ||||
|
|
|
|
|
|||||
| (1) | Reflects our actual cash and cash equivalents as of March 31, 2020 as reported in our Quarterly Report. |
| (2) | Includes the impact of any original issue discount and deferred financing cost. |
| (3) | Consists of $14.9 million of finance lease obligations and no amounts outstanding under foreign credit facilities. |
13