Attached files
| file | filename |
|---|---|
| 8-K - 8-K - BUNGELTD | bg-20200624.htm |

2020 A New Bunge June 24, 2020

Forward-Looking Statements • Today’s presentation includes forward-looking statements that reflect Bunge’s current views with respect to future events, financial performance and industry conditions. • These forward-looking statements are subject to various risks and uncertainties. Bunge has provided additional information in its reports on file with the Securities and Exchange Commission concerning factors that could cause actual results to differ materially from those contained in this presentation and encourages you to review these factors. • Today’s presentation also includes non-GAAP financial information, for more information, see Appendix. 2

Industry Veterans with Track Record of Creating Value Greg Heckman John Neppl Chief Executive Officer Chief Financial Officer Bunge Limited Bunge Limited 35+ years of 25+ years of industry experience industry experience Bunge Bunge Gavilon Group Green Plains Conagra Foods Gavilon Group Conagra Foods

Agenda 01 02 03 CEO Risk Q&A Update Management and CFO Update 4

Why Bunge is Uniquely Compelling New, world-class leadership team: experienced, focused, energized Driving value through leading global franchise w/ Oilseeds at the core Strong, consistent cash flows and disciplined capital allocation Foundation to earn $5+/share EPS at long term average crush margins Multiple opportunities to further expand earnings power 5

Essential Role in Feeding a Growing World Purpose Vision We connect farmers to consumers To be the #1 global integrated Oilseeds processor to deliver essential food, feed and fuel to the world and the preferred sustainable solutions partner for oilseeds, related commodities and ingredients 6

New, World-Class Leadership Team Changes made in 2019 augment institutional knowledge with deep industry expertise Greg Heckman Chief Executive Officer • Gavilon Group, ConAgra Foods John Neppl Raul Padilla Brian Zachman Christos Aaron Buettner Chief Financial Officer President Global President Global Risk Dimopoulos President Bunge • Green Plains, Operations Management President Global Supply Loders Croklaan Gavilon Group, • La Plata Cereal • Millennium, SAC Chains • Cargill ConAgra Foods Capital, Cargill, • Tradigrain, Intrade ConAgra Pierre Mauger Deborah Borg Robert Coviello Joe Podwika Robert Wagner Chief Transformation Chief HR and SVP of Sustainability General Counsel Chief Risk Officer Officer Communications Officer and Government Affairs • Nutrien, • Tricon, COFCO, • McKinsey, Nestlé, • Dow Chemical, • Cargill PotashCorp, Gavilon, ConAgra KPMG General Motors International Paper Foods Joined Bunge in 2019 New to Role in 2019 7
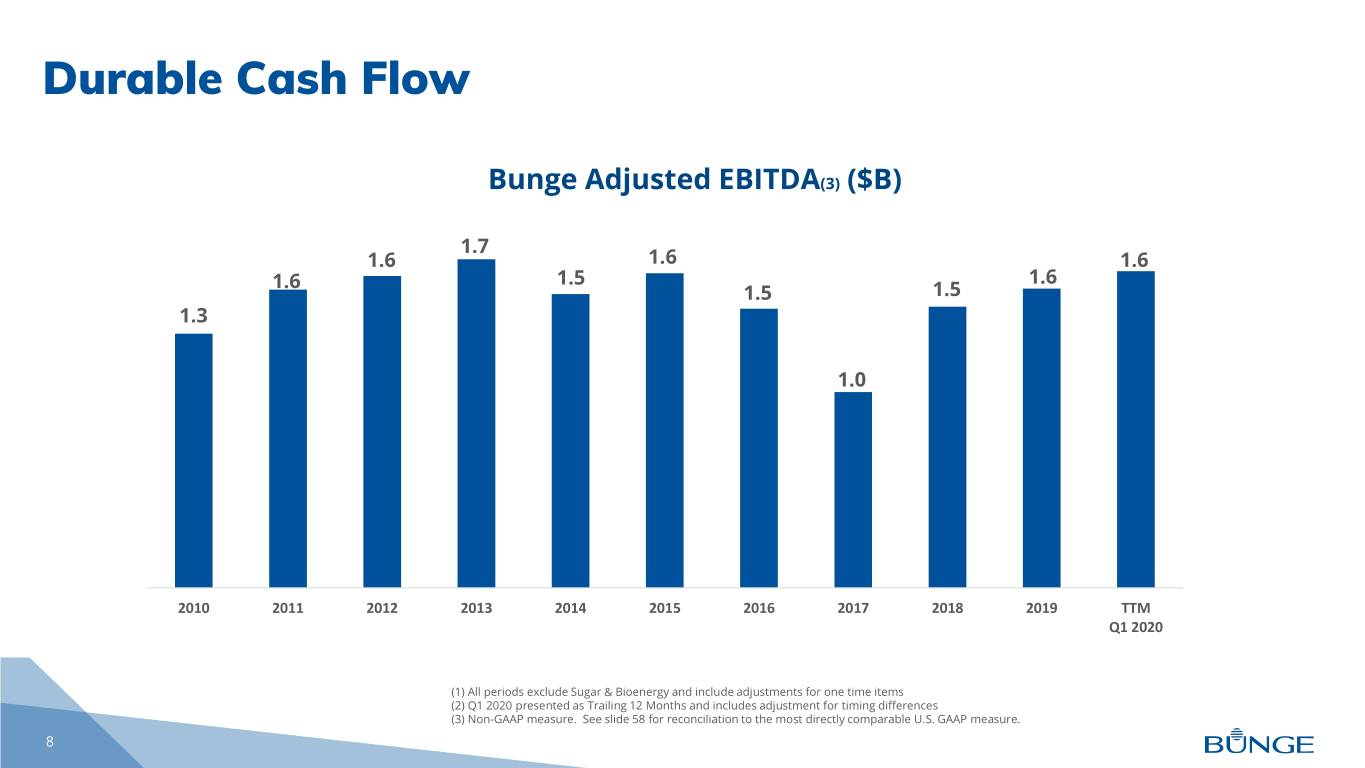
Durable Cash Flow Bunge Adjusted EBITDA(3) ($B) 1.7 1.6 1.6 1.6 1.6 1.5 1.6 1.5 1.5 1.3 1.0 2010 2011 2012 2013 2014 2015 2016 2017 2018 2019 TTM Q1 2020 (1) All periods exclude Sugar & Bioenergy and include adjustments for one time items (2) Q1 2020 presented as Trailing 12 Months and includes adjustment for timing differences (3) Non-GAAP measure. See slide 58 for reconciliation to the most directly comparable U.S. GAAP measure. 8

Differentiated Risk Management Navigating challenging and complex trade environment to capture opportunities as presented, while reducing downside exposures Strong Link Core Global Strengthening to Physical Organizational Management, Controls Assets Competency Local Expertise 9

Disciplined Capital Allocation Strategy Maintain dividend policy & sustaining capex through the cycle Top Bottom • Build strong balance • Step up focus on • Acquire select strategic sheet identifying acquisition assets below • Where strategically targets replacement costs sensible, monetize • Repurchase shares with • Repurchase shares if assets surplus liquidity if valuation is attractive valuation is attractive with surplus liquidity and investment grade and investment grade rating is secure rating is secure 10

Building a Focused and Profitable Portfolio Actions to date • Completed sugar & bioenergy JV with BP $1.1B • Announced sale of Brazilian margarine Expected proceeds from transactions and mayonnaise assets • Sold stake in U.S. ethanol producer • Divested idled grain facilities in Eastern $1.5B Europe Reduction in invested capital • Optimized S.A. grain footprint to improve capacity utilization • Announced sale of 35 U.S. grain elevators ~$0.40 EPS accretion 11

Monetizing Non-Core Assets High thresholds for target returns and strategic benefit to Oilseeds U.S. Grain Brazil Margarine & Elevators Mayonnaise Assets • Agreement to divest 35 U.S. interior elevators • Agreement to divest Brazilian margarine and to Zen-Noh Grain Corp. mayonnaise businesses to JBS • Bunge retains 8 strategic grain facilities • Simplifies business model, allowing focus on areas with clear competitive advantage • Supports global value chain model • Gross proceeds: ~R$700M(1) • Gross proceeds: ~$300M(1) • Expected closing: 2H 2020 • Expected closing: late 2020/early 2021 12 (1) Excludes any adjustments for working capital

New, Agile Operating Model Old: Regional Model New: Value Chain Model P&L P&L P&L P&L Farmer Customer Destination Customer Farmer Crush P&L P&L INEFFICIENT, REGIONAL MODEL: STREAMLINED, GLOBAL VALUE CHAIN MODEL: Global reach and scale hindered by internal transaction Focused on market facing activities, ability to operate as complexity of local business units one in real time globally 13
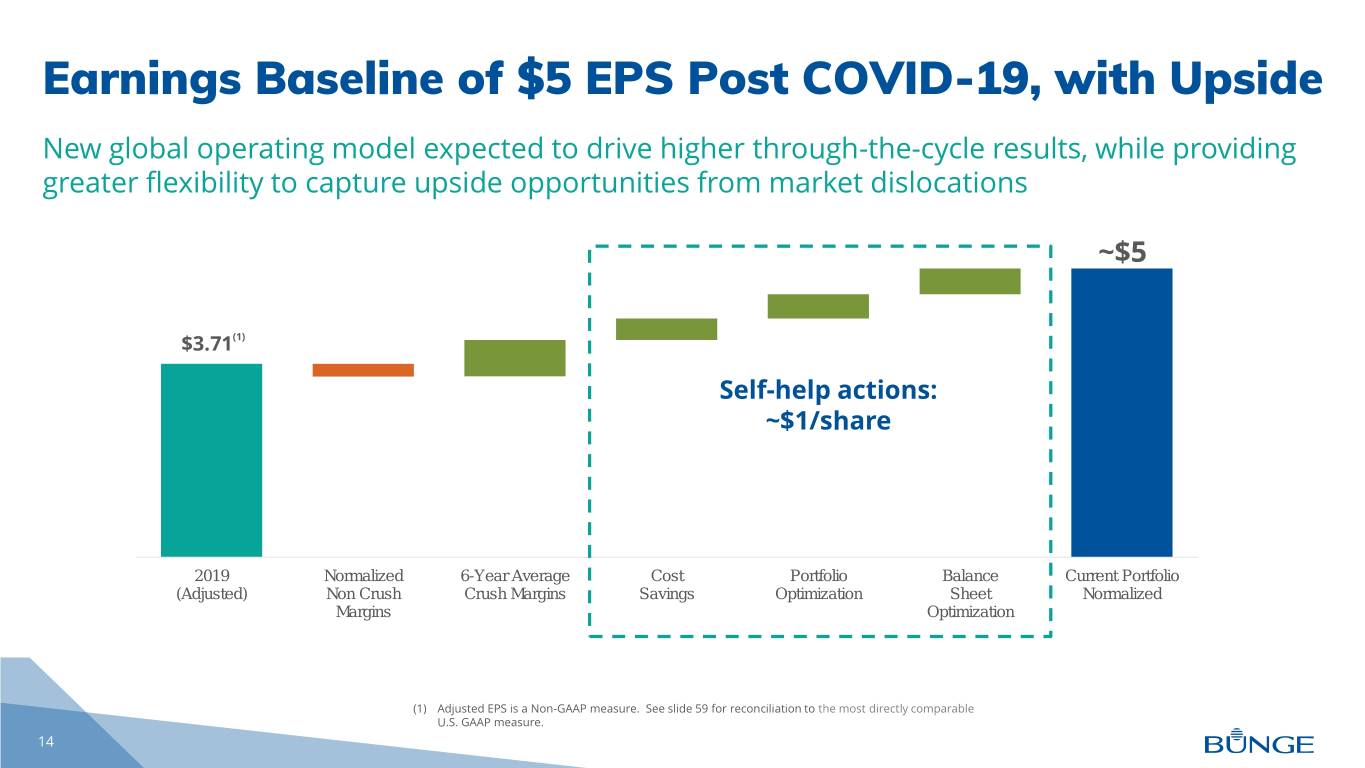
Earnings Baseline of $5 EPS Post COVID-19, with Upside New global operating model expected to drive higher through-the-cycle results, while providing greater flexibility to capture upside opportunities from market dislocations ~$5 $3.71(1) Self-help actions: ~$1/share 2019 Normalized 6-Year Average Cost Portfolio Balance Current Portfolio (Adjusted) Non Crush Crush Margins Savings Optimization Sheet Normalized Margins Optimization (1) Adjusted EPS is a Non-GAAP measure. See slide 59 for reconciliation to the most directly comparable U.S. GAAP measure. 14

Multiple Opportunities to Expand Earnings Power Strengthen Oilseeds platform/ target consolidation opportunities (e.g., Imcopa) Execute Bunge Loders Croklaan (BLC) opportunity: differentiated products and services, geography $5 EPS and solutions Earnings Baseline + Increase participation in biofuels, plant-based proteins and logistics Leverage digital technology to drive efficiency and create competitive advantage 15

Focused Strategy with Oilseeds at the Core Purpose Vision To be the #1 global integrated Oilseeds processor We connect farmers to consumers and the preferred sustainable solutions partner for to deliver essential food, feed and fuel to the world oilseeds, related commodities and ingredients Areas of Focus Strengthen Oilseeds Leverage footprint in connected Grow value added oils and leadership businesses oilseeds based ingredients How We Win Agile - talent Customer and Excellence Sustainable Efficient and safe and technology farmer in risk and transparent operations enabled partnership management supply chains 16

Capturing the Oilseeds Opportunity Favorable Unmatched assets macro trends and capabilities Global footprint Deep farmer and customer relationships 17

Oilseeds Poised for Continued Strong Growth Global Soymeal Global Veg-oil Demand Demand (MMT) (MMT) • Long term underlying soymeal and vegetable oil 250 326 demand growth supported 287 by population and per 200 capita income growth 240 • Carbon focus and biofuel 212 150 policy expected to 170 accelerate veg-oil demand 142 100 growth trend 50 • Recovery to baseline expected after near-term impact from COVID-19 and 0 2005 2010 2015 2020 2025P 2030P ASF 2005 2010 2015 2020 2025P 2030P Palm oil Soy oil Sunflower oil Rapeseed oil Source: OIL WORLD June 2020 www.oilworld.biz 18
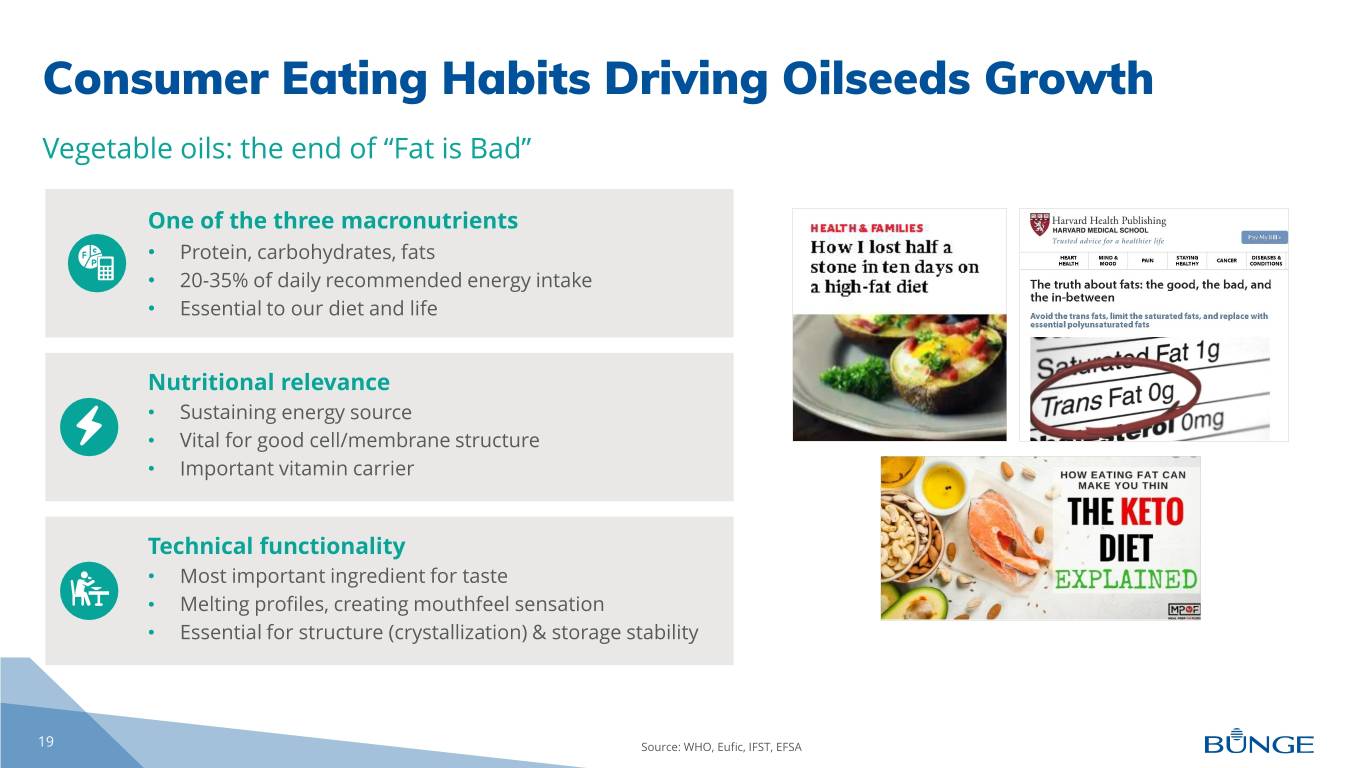
Consumer Eating Habits Driving Oilseeds Growth Vegetable oils: the end of “Fat is Bad” One of the three macronutrients • Protein, carbohydrates, fats • 20-35% of daily recommended energy intake • Essential to our diet and life Nutritional relevance • Sustaining energy source • Vital for good cell/membrane structure • Important vitamin carrier Technical functionality • Most important ingredient for taste • Melting profiles, creating mouthfeel sensation • Essential for structure (crystallization) & storage stability 19 Source: WHO, Eufic, IFST, EFSA

Consumer Eating Habits Driving Oilseeds Growth (Continued) Accelerating demand for plant-based proteins • Critical components of meat alternatives 2030 Retail Market Size Projections (typically >90% dry contents): for Meat Alternatives ($B) 140 − Plant proteins (soy, pea and other pulse and oilseed proteins) − Vegetable oils and fats (for texture and taste) 65 • Rapid growth also expected for plant- 57 proteins in sports, infant and adult 32 nutritional products 18 2018 Euromonitor Rabobank Bernstein Barclays 20 Sources:: Barclays, Bernstein, Euromonitor, Rabobank

Environmental Concerns Driving Oilseeds Growth California Renewable Standard Scores scaled vs. ultra low sulfur diesel emissions = 100) Biodiesel and Renewable Diesels Other Fuels 120 100 100 e/MJ) 02 80 73 60 55 40 21 Carbon Intensity (CI) score for for score (CI) Intensity Carbon various feedstocks (gC feedstocks various 20 0 Used Cooking Soy Renewable Corn Ultra Low Sulfur Oil Renewable Diesel Ethanol Diesel Diesel 21 Sources: REGI, as of January 2019

Bunge’s Unmatched Global Oilseeds Footprint Global (#1) Soy 129/Soft 31 Asia Soy 22/Soft 3 North America (#2) Soy 35/Soft 7 Soy crush Europe (#1) Soy 21/Soft 21 Soft crush South America (#1) Multi crush Soy 51/Soft 1 Crush capacity Palm refinery Capacities KMT/day Global Leader 32 100+ 51 30 28 port grain oilseed processing oils packaging terminals elevators plants refineries sites 22 *Annual crush capacity based on 330 days/year
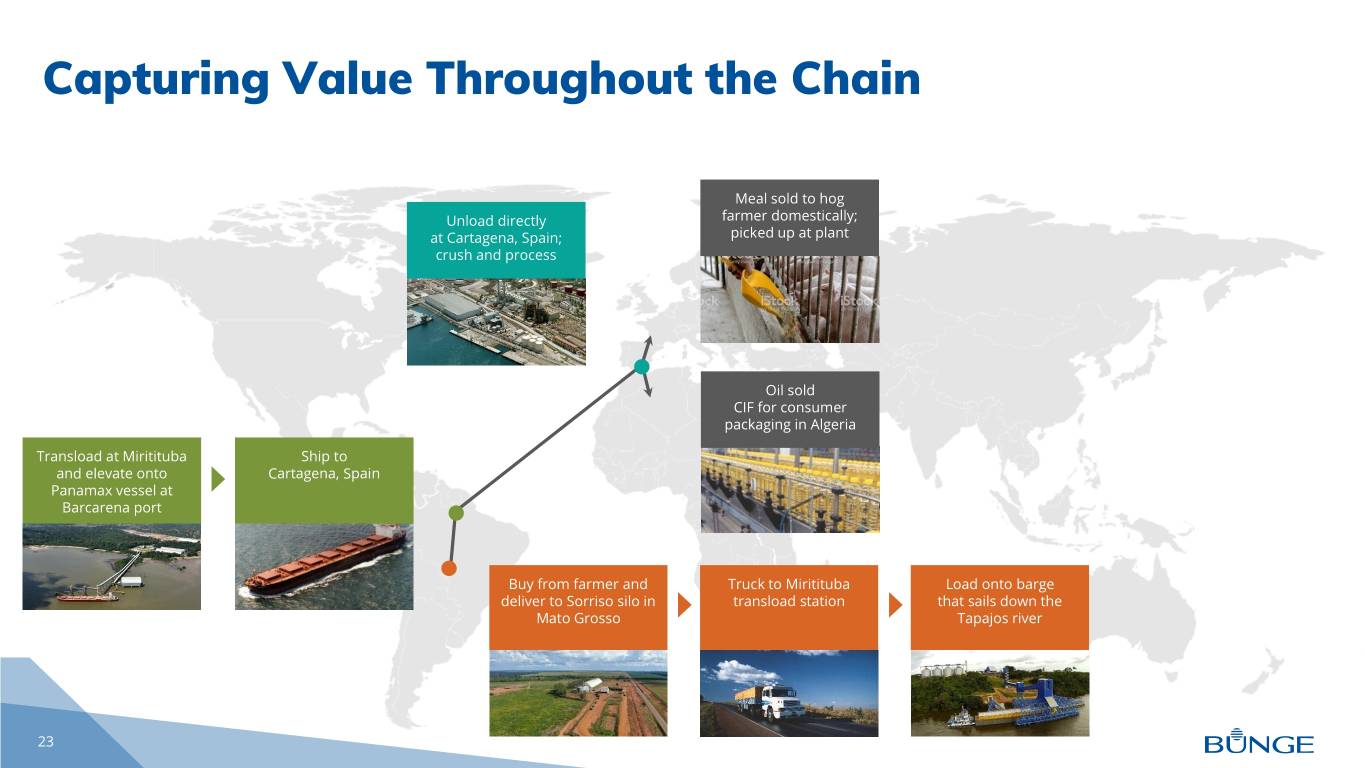
Capturing Value Throughout the Chain Meal sold to hog Unload directly farmer domestically; at Cartagena, Spain; picked up at plant crush and process Oil sold CIF for consumer packaging in Algeria Transload at Miritituba Ship to and elevate onto Cartagena, Spain Panamax vessel at Barcarena port Buy from farmer and Truck to Miritituba Load onto barge deliver to Sorriso silo in transload station that sails down the Mato Grosso Tapajos river 23

Strengthening Oilseeds Focused on capital efficient consolidation 1 2 Imcopa • One of the largest regional, integrated soy processing/refining/packaging players in Brazil (2 plants with total 1 2 crush capacity of ~1.75MMT) Cambé’s plant Araucária’s plant Processes GM soybean to Dedicated to supply the European • Facilities have easy access to ports, domestic market market with products derived from leveraging our existing logistics NGMO soybeans infrastructure • One of the largest originators of non- GM beans in Brazil • Offers ingredients opportunity through soy protein concentrate capability 24

Growth Potential in Connected Businesses Global Ag Export by Global Ag Imports by • Bunge’s footprint aligns Region (MMT) Region (MMT) with key regions driving 800 800 grains and oilseeds 700 700 export and import 600 600 growth 500 500 • Bunge well positioned to 400 400 capture upside from 300 300 growth of agricultural 200 200 products 100 100 0 0 2005/06 2010/11 2015/16 2020/21 2025/26P 2029/30P 2005/06 2010/11 2015/16 2020/21 2025/26P 2029/30P Asia MENA North America South America Black Sea Europe Mexico & Latin Europe Others Others Source: USDA 2020 Baseline 25

Uniquely Positioned to Win in Ingredients Growth Differentiation Specialty players • Competitive advantage from Bunge’s scale combined with BLC’s increasingly differentiated and high valued-added products and services Niche • Top specialty niche players only ~5% Scale of the global market Commodity/ scale players Commoditization 26

BLC is an Innovation Engine Bunge B2B Edible Oils, Adjusted EBITDA • Broad and scaled product set − Sun, canola, soy, palm & shea • Leading technical and formulation capabilities − Solutions partner across food categories − 300+ patents • Global reach − Presence across continents • Sustainable & transparent supply chains (1) (2) 2017 2018 2019 − Integrated value chain (1) Acquisition of Loders Croklaan closed in Mar 2018; BLC shown pro forma for 12 months of Loders Croklaan (2) Adjusted for timing differences 27
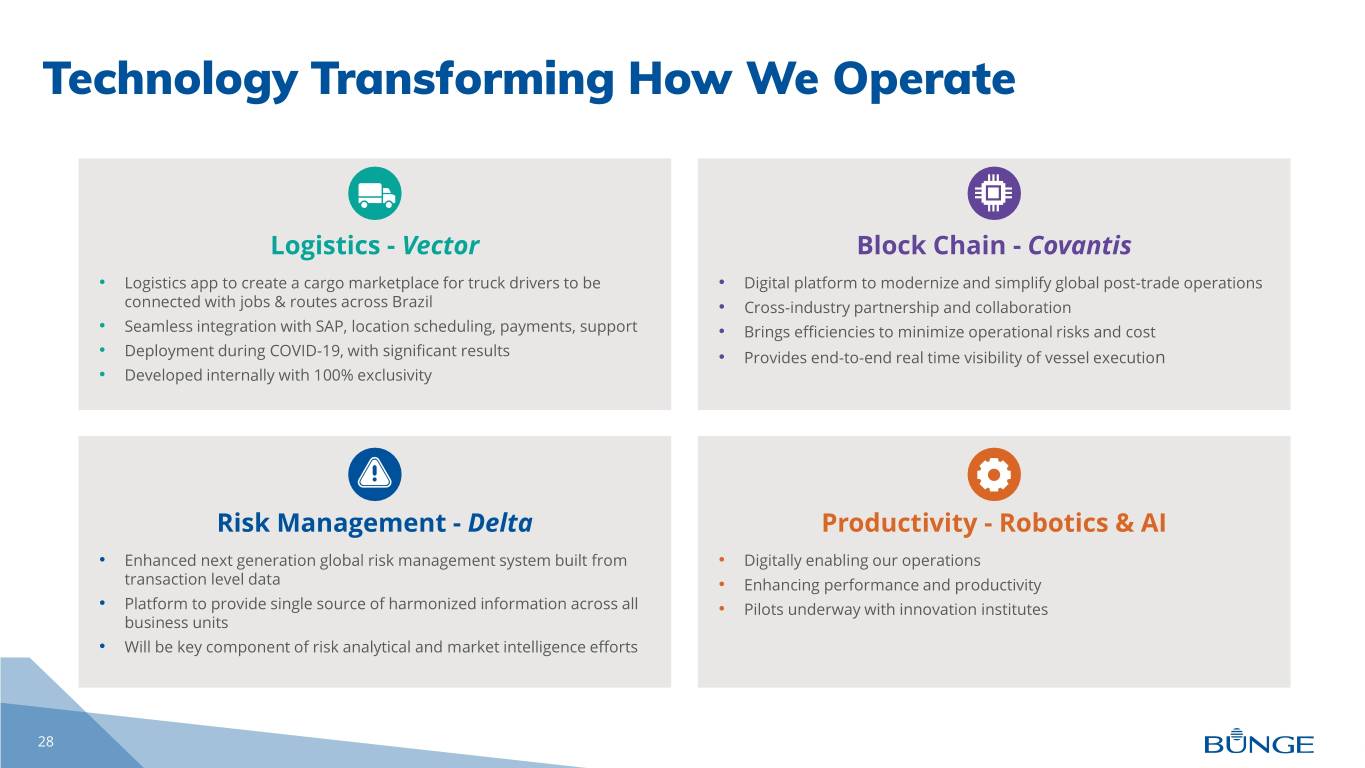
Technology Transforming How We Operate Logistics - Vector Block Chain - Covantis • Logistics app to create a cargo marketplace for truck drivers to be • Digital platform to modernize and simplify global post-trade operations connected with jobs & routes across Brazil • Cross-industry partnership and collaboration • Seamless integration with SAP, location scheduling, payments, support • Brings efficiencies to minimize operational risks and cost • Deployment during COVID-19, with significant results • Provides end-to-end real time visibility of vessel execution • Developed internally with 100% exclusivity Risk Management - Delta Productivity - Robotics & AI • Enhanced next generation global risk management system built from • Digitally enabling our operations transaction level data • Enhancing performance and productivity • Platform to provide single source of harmonized information across all • Pilots underway with innovation institutes business units • Will be key component of risk analytical and market intelligence efforts 28
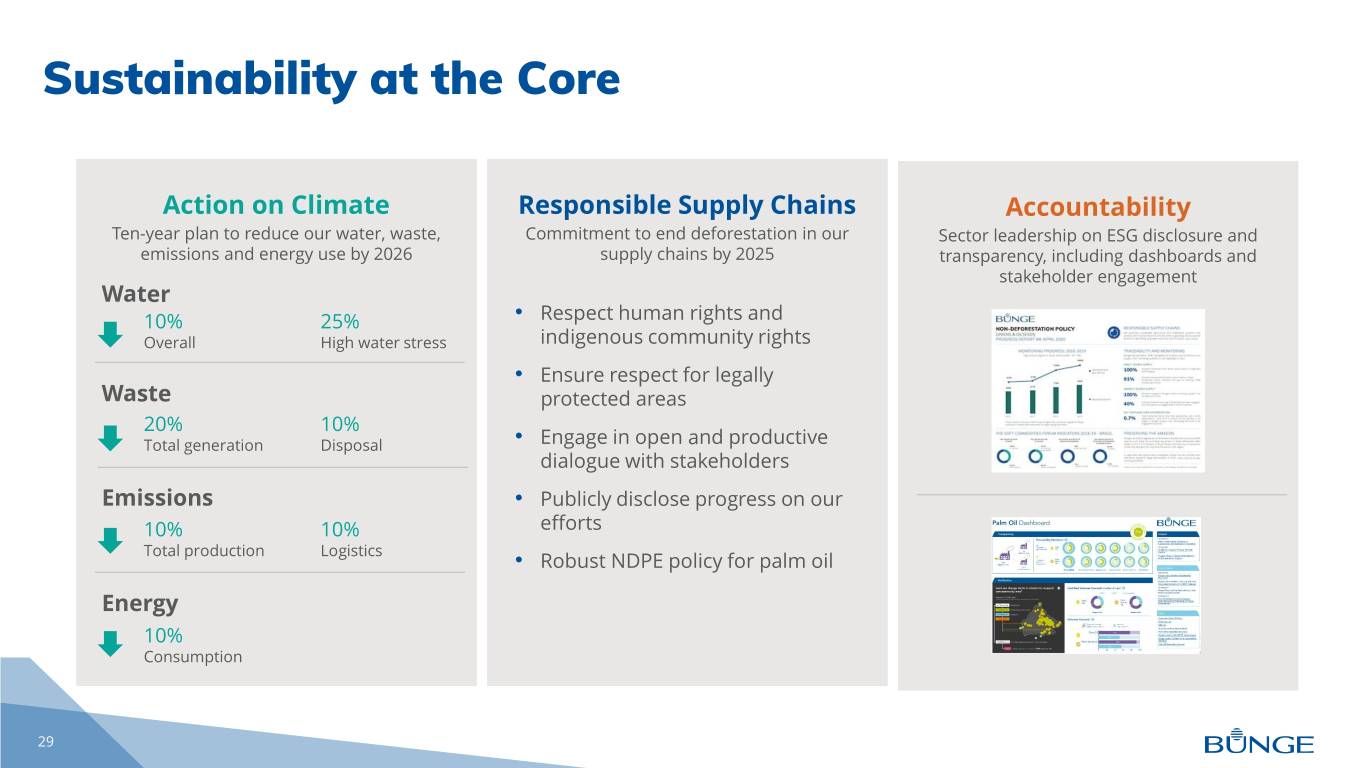
Sustainability at the Core Action on Climate Responsible Supply Chains Accountability Ten-year plan to reduce our water, waste, Commitment to end deforestation in our Sector leadership on ESG disclosure and emissions and energy use by 2026 supply chains by 2025 transparency, including dashboards and stakeholder engagement Water 10% 25% • Respect human rights and Overall High water stress indigenous community rights • Ensure respect for legally Waste protected areas 20% 10% Total generation Disposal • Engage in open and productive dialogue with stakeholders Emissions • Publicly disclose progress on our 10% 10% efforts Total production Logistics • Robust NDPE policy for palm oil Energy 10% Consumption 29
Risk Management Update Brian Zachman

Risk is Inherent in Our Business Enables Bunge to maximize our asset base, trade flows and market opportunities Price volatility of inputs and outputs Margin volatility and unpredictable market outcomes Risk as an opportunity and competitive advantage 31

Risk Management Linked to Physical Assets and Flows Earnings at Risk (E@R) is the largest risk Bunge faces Managing margins and optimizing assets Timing mis-matches between farmer and customer transactions Advantaged scale and geographic diversity in asset footprint 32

A Culture of Risk Management Hedging economic exposure Exceptions to hedged positions measured as V@R Risks appropriate to market environment and earnings power Risk management at Bunge is a collaborative team approach 33

CFO Update John Neppl
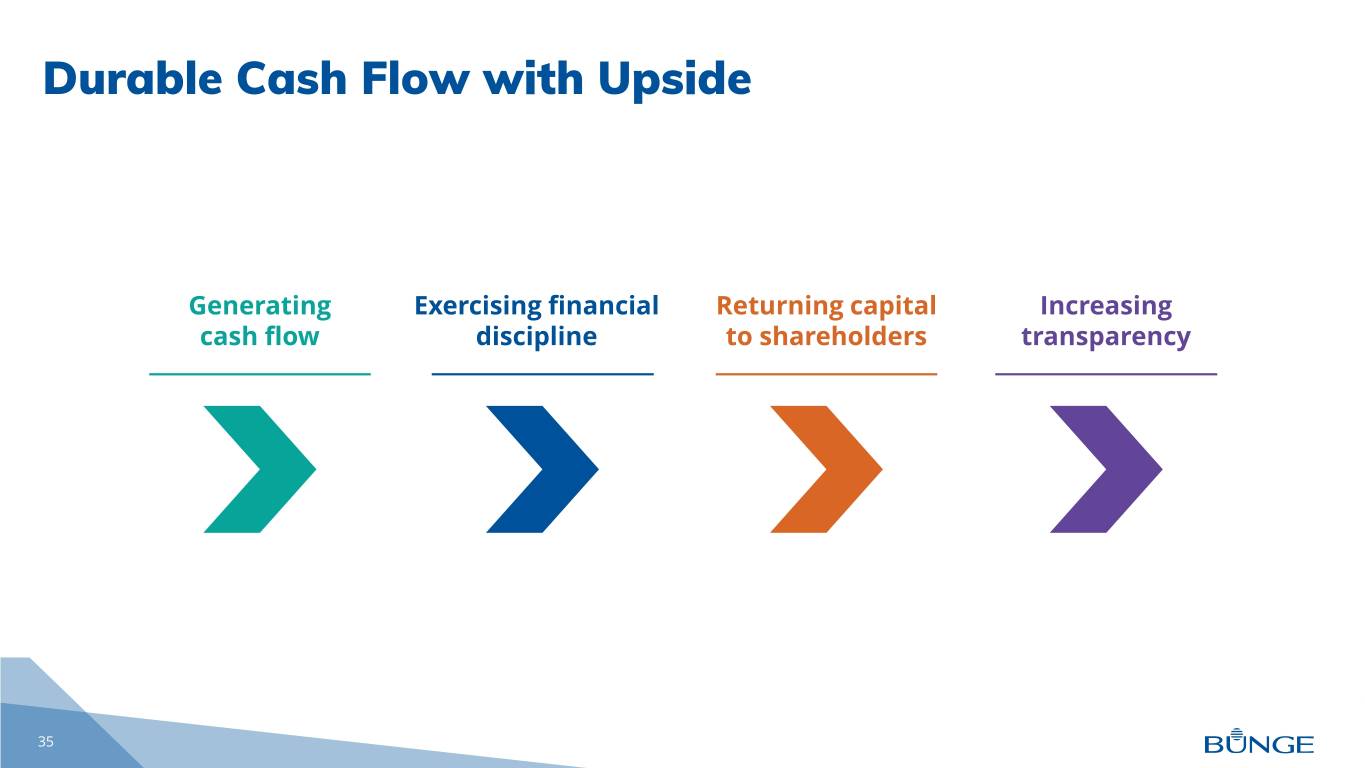
Durable Cash Flow with Upside Generating Exercising financial Returning capital Increasing cash flow discipline to shareholders transparency 35

Earnings Baseline of $5 EPS Post COVID-19, with Upside New global operating model expected to drive higher through-the-cycle results, while providing greater flexibility to capture upside opportunities from market dislocations ~$5 $3.71(1) Self-help actions: ~$1/share 2019 Normalized 6-Year Average Cost Portfolio Balance Current Portfolio (Adjusted) Non Crush Crush Margins Savings Optimization Sheet Normalized Margins Optimization (1) Adjusted EPS is a Non-GAAP measure. See slide 59 for reconciliation to the most directly comparable U.S. GAAP measure. 36

Earnings Baseline of $5 EPS - Drivers Agribusiness Food & Ingredients Productivity & Cost • Soy crush margins based on past • Demand back to pre-COVID-19 Efficiencies 6-year average of $33-35/MT levels $50-60M by end of BG Soy Crush Margins • Edible Oil and Milling EBIT 2021 vs 2019 Histogram comparable to 2020 original outlook Fertilizer Portfolio Actions • Comparable to 2020 outlook ~$400M expected cash proceeds Sugar & Bioenergy JV Effective Tax Rate • Ethanol demand and price recovery 18-22% • Softseed crush margins based on in Brazil past 6-year average of $38-$42/MT • Comparable to 2020 original • Grain origination margins based outlook Net Interest on past 4-year average ~$100M reduction due to debt retirements from proceeds and lower interest rates 37
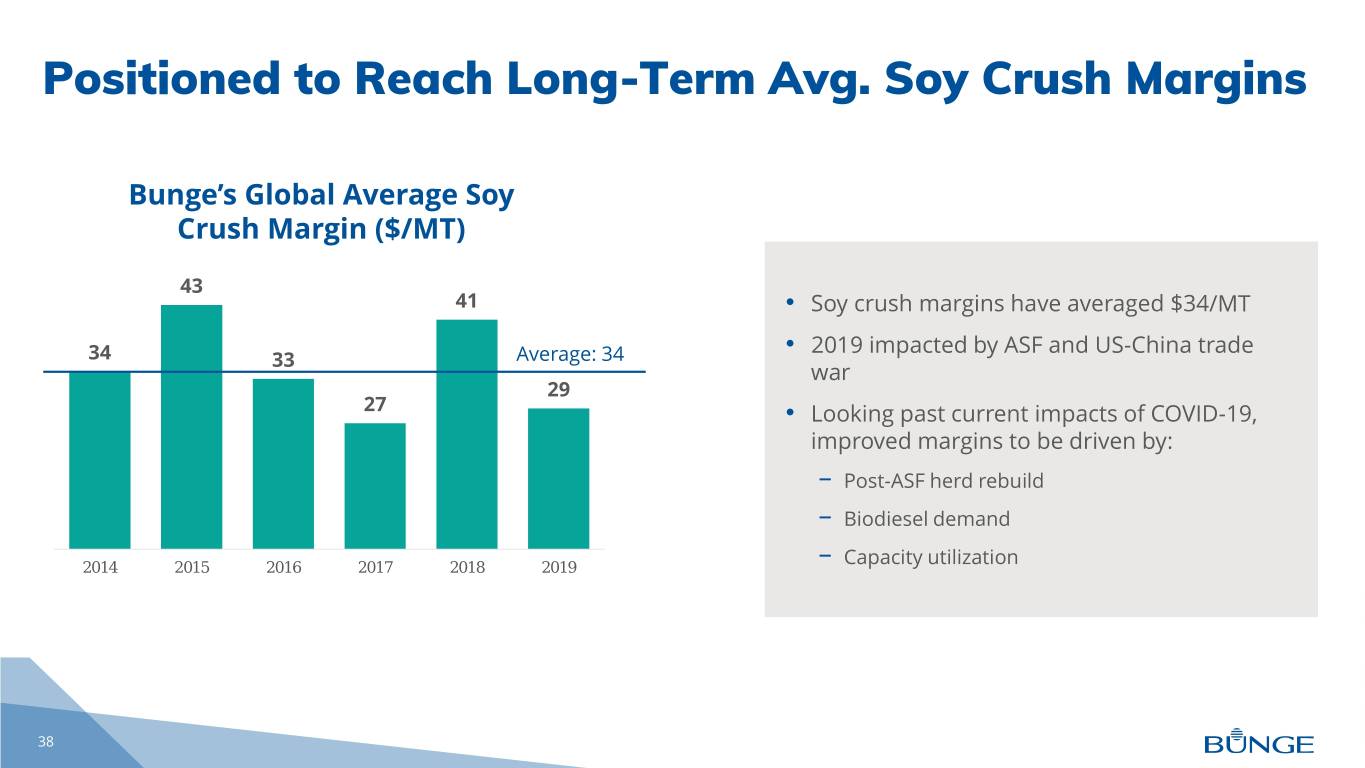
Positioned to Reach Long-Term Avg. Soy Crush Margins Bunge’s Global Average Soy Crush Margin ($/MT) 43 41 • Soy crush margins have averaged $34/MT • 2019 impacted by ASF and US-China trade 34 33 Average: 34 war 29 27 • Looking past current impacts of COVID-19, improved margins to be driven by: − Post-ASF herd rebuild − Biodiesel demand 2014 2015 2016 2017 2018 2019 − Capacity utilization 38

Continued Focus on Cost Management Cost restructuring (portfolio actions/new model) $50-60M Category expense management by end of 2021 (vs 2019) Headquarter move to St. Louis $20-25M per year thereafter Bunge Shared Services 39
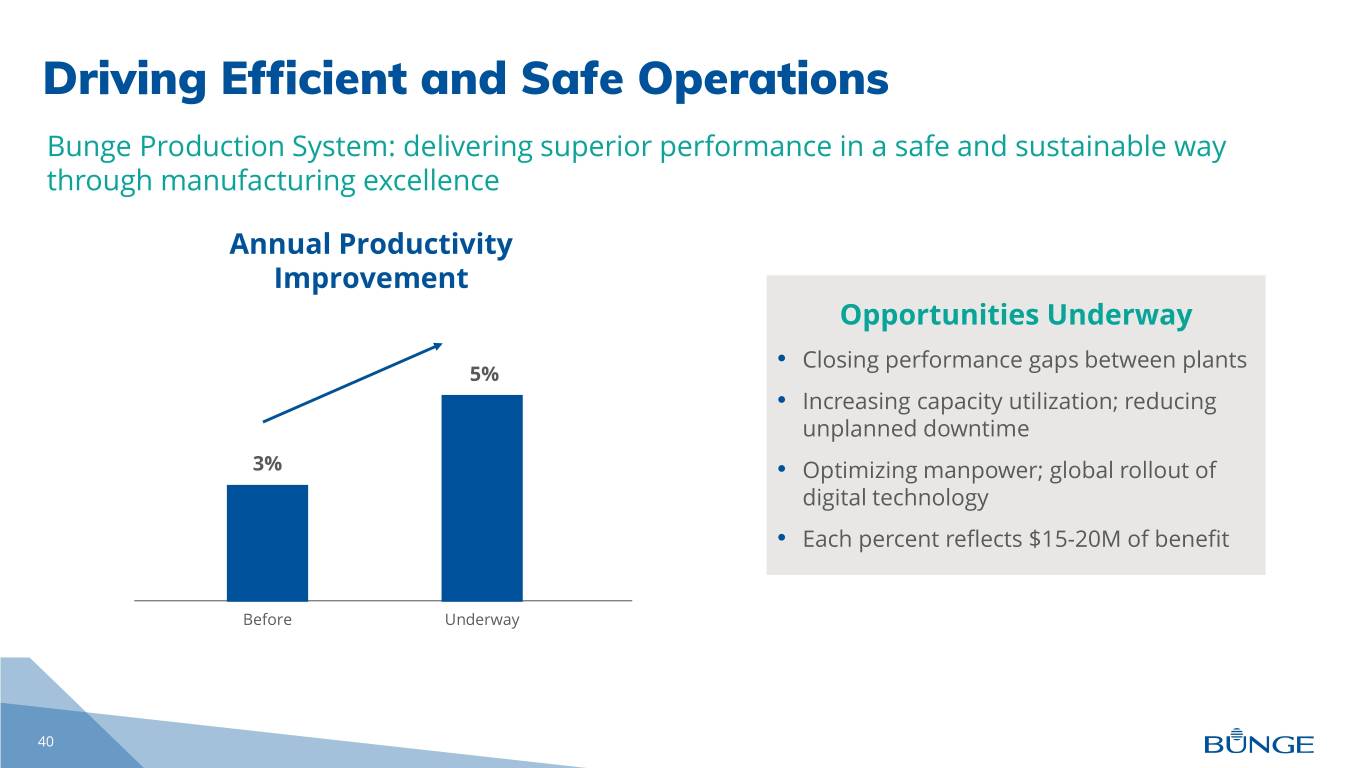
Driving Efficient and Safe Operations Bunge Production System: delivering superior performance in a safe and sustainable way through manufacturing excellence Annual Productivity Improvement Opportunities Underway • Closing performance gaps between plants 5% • Increasing capacity utilization; reducing unplanned downtime 3% • Optimizing manpower; global rollout of digital technology • Each percent reflects $15-20M of benefit Before Underway 40

Generating Cash Flow to Drive Shareholder Value Baseline Adjusted Funds From Operations (Adjusted FFO)(1,2) ~$1.2B Strong credit metrics ~$600M Shareholder dividend Reinvestment opportunities Adj. FFO Sustaining Preferred Dividend to Cashflow Baseline Capital Dividend Common Availability Share buybacks Shareholders (1) Adjusted Funds From Operations is a non U.S. GAAP measure. Reconciliation to the most directly comparable U.S. GAAP measure is provided on slide 60 in the appendix. (2) Excludes Sugar & Bioenergy segment. 41

Rigorous Capex Evaluation Process Target Annual Capex Spend ($M) ~450 • After Sustaining projects, investments in Growth/Productivity Productivity are prioritized ~40% • Growth projects evaluated on strategic rationale and investment return vs. hurdle rate − Assumptions stress tested under a variety Sustaining of scenarios • Safety • Hurdle rate = ~1.5x WACC, but risk-adjusted by ~60% • Environmental region and business unit • Maintenance 42
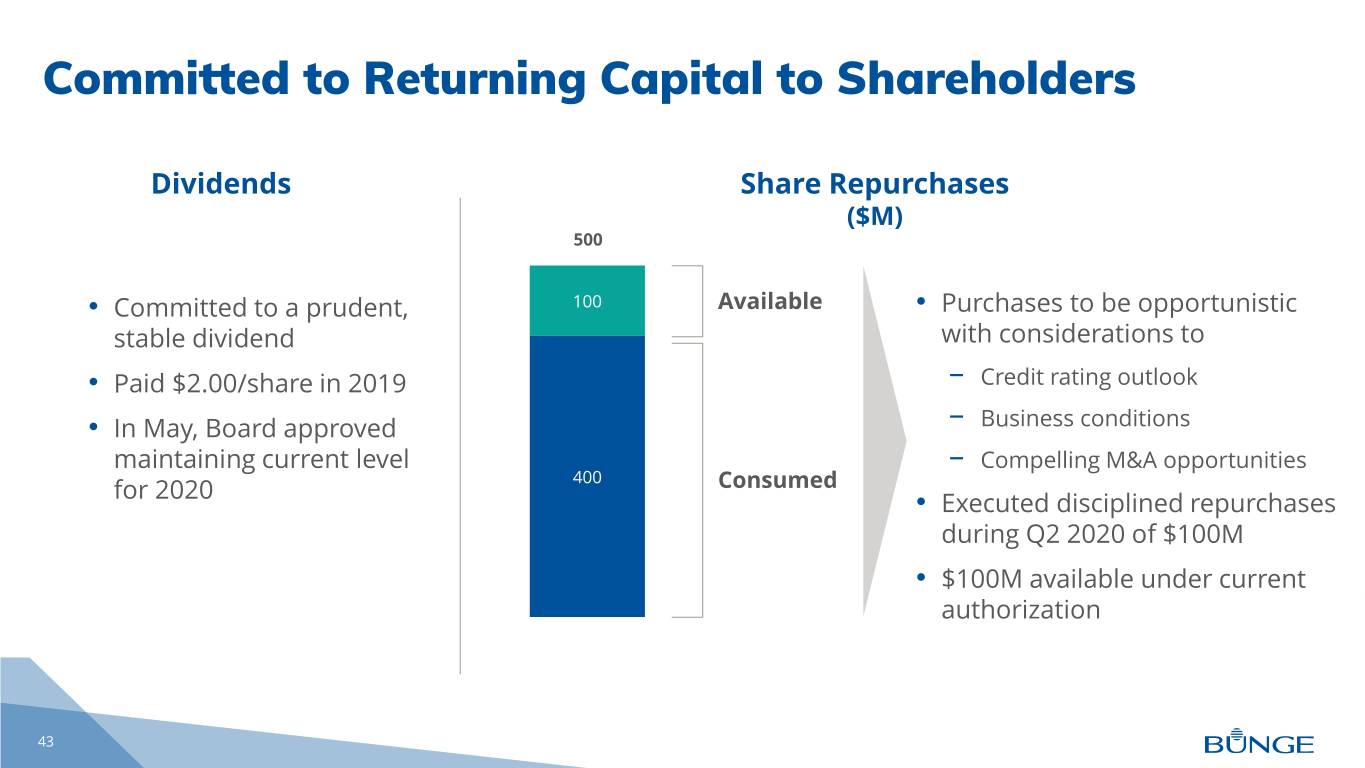
Committed to Returning Capital to Shareholders Dividends Share Repurchases ($M) 500 • Committed to a prudent, 100 Available • Purchases to be opportunistic stable dividend with considerations to • Paid $2.00/share in 2019 − Credit rating outlook • In May, Board approved − Business conditions maintaining current level − Compelling M&A opportunities 400 for 2020 Consumed • Executed disciplined repurchases during Q2 2020 of $100M • $100M available under current authorization 43

Maintaining 9% ROIC Target while Truing-up WACC • Adjusting Company-reported WACC to 6% (from 7%) better aligns with market realities • Risk free rates and Bunge’s beta have remained low on a sustained basis for several years • Implied cost of equity is 7% • Bunge’s ROIC target of 9% remains unchanged (1) (2) 6.00 10 Year US Treasury Yield Bunge Stock Beta 1.40 5.00 1.20 4.00 1.00 3.00 0.80 2.00 1.00 0.60 0.00 0.40 Jan-04 Jul-06 Jan-09 Jul-11 Jan-14 Jul-16 Jan-19 May-20 Jan-04 Jul-06 Jan-09 Jul-11 Jan-14 Jul-16 Jan-19 May-20 Yield 12-Mo Average Overall Average Beta 12-Mo. Average Overall Average (1) 10-year US Treasury Yield data sourced from Bloomberg 44 (2) Predicted Barra Beta
Using RMI to Capture Margin • We manage timing mismatches between farmer selling and customer purchases − We have one chance to purchase crops when a farmer wants to sell − “Just in Time” inventory is not the model for our industry • Purchasing at harvest and carrying readily marketable inventories (RMI) can provide additional optionality and margin opportunities • The liquidity of a dollar invested in RMI is different than a dollar invested in a plant 45

Working Capital Balances Out Through the Cycle (1) (2) Cash Flow from (for) Working Capital 2 ($B) 1.2 1.2 1.0 0.7 0.9 1 0.6 0.5 0.1 1.2 1.1 0.4 0.3 (0.2) 0 (0.3) (0.6) (0.6) (0.7) (1) (1.6) (2) 2011 2012 2013 2014 2015 2016 2017 2018 2019 Cash flow (for) from working capital Cumulative cash flow (for) from working capital (1) Cash flow from working capital represents cash flow from operating assets/liabilities excluding short term investments and beneficial interest in securitized trade receivables. (2) Cash Flow from (for) Working Capital is a Non-GAAP measure. See slide 61 for reconciliation to the most directly comparable GAAP 46 measure. Confidential and Not for Distribution

Increasing Transparency: Adjusted ROIC Adjusted ROIC (AROIC) provides investors another tool to asses Bunge’s performance ROIC Shortfalls Complementary Metric: AROIC • Does not differentiate investment • Recognizes RMI as a tool for generating in RMI from plant assets additional profit • RMI expands/contracts based on • Merchandising RMI is excluded from market cycle and opportunity invested capital and RMI funding cost is • Limiting RMI to maximize ROIC deducted from OPAT can be detrimental to future EPS − Aligns metric to maximize value for shareholders 47

AROIC Provides a More Accurate View of Performance Adjusting for impacts of FX on book equity value to better measure performance Bunge Limited (ex Sugar) 11.5% ROIC 10.4% AROIC 9.7% 9.5% 9.1% 7.9% 8.2% 8.3% 8.2% 6.5% 6.6% 8.0% 5.9% 8.1% 6.0% 6.6% 2015 2016 2017 2018 2019 Q1-20 2015 2016 2017 2018 2019 Q1-20 ROIC (CTA adj.) WACC ROIC (TD adj.) AROIC AWACC (1) Q1 2020 presented as Trailing 4 Quarters (2) ROIC (TD adj.) includes adjustments for timing differences (3) ROIC (CTA adj.) Includes adjustments for timing differences and CTA (4) AROIC includes adjustments for timing differences, CTA, and RMI (5) CTA Adjustments were made for 2019 and Q1 2020 TTM. CTA adjustment is the difference between March 31, 2020 balance of Cumulative Foreign Exchange Translation Adjustment and December 31, 2018 balance 48 (6) Q1 2020 ETR adjusted to weighted average of 2019 actual and 2020 projected ETR (7) ROIC and AROIC are Non-GAAP measures. See slides 62 through 65 for reconciliation to the most directly comparable U.S. GAAP measure.

Increasing Transparency: Cash Flow Yield Cash flow yield emphasizes cash generation and complements earnings and returns metrics Discretionary Cash Flow as a ratio of Book Equity Adjusted for CTA Adjusted (1) (3) Sustainable Hybrid Discretionary (3) Book Equity (1) CTA Book Equity (3) FFO Capex Dividends Cash Flow Adjustment Adjusted for CTA (2) (from 2018) (1) Adding back after-tax timing differences. Adjusted FFO excludes minorities; (2) CTA Adjustment is the difference between March 31, 2020 balance of Cumulative Foreign Exchange Translation Adjustment and December 31, 2018 balance. (3) Adjusted FFO, Discretionary Cash Flow, and Book Equity adjusted for CTA are Non-GAAP measures. See slides 60 and 66 for 49 reconciliations to the most directly comparable GAAP measure.

Cash Flow Yield Demonstrates Bunge’s Durability Bunge Performance 2015 Onwards Discretionary Cash Flow(1) ($M) 981 1,000 973 20.0% 900 18.0% 779 800 17.2% 749 721 16.0% 700 15.3% 14.0% 14.3% 600 569 13.7% 13.4% 12.0% 500 8.7% 10.0% 400 7.0% 8.0% 300 6.0% 200 4.0% 100 2.0% 0 0.0% 2015 2016 2017 2018 2019 TTM Q1-20 Discretionary Cash Flow Cash Flow Yield Cost of Equity Note: to reduce the impact of foreign currency on book value of equity, CTA was held constant at 12/31/2018 level for 2019 and TTM Q1-20 (1) Discretionary cash flow and Cash Flow Yield are Non-GAAP measure. See slides 60 and 66 for reconciliations to the most directly comparable 50 U.S. GAAP measure.

In Summary: Baseline Earnings ~8.5% ROIC (1) ~$5 ~10.5% AROIC (1) ~$1.2B EPS Adjusted FFO ~15.0% CFY (1) For future periods, we are unable to provide a reconciliation of forward-looking non-GAAP measures to the most comparable GAAP financial measures because the information needed to reconcile these measures is dependent on future events, many of which are outside management’s control. Additionally, estimating such GAAP measures and providing a meaningful reconciliation consistent with our accounting policies for future periods is extremely difficult and requires a level of precision that is unavailable for these future periods and cannot be accomplished without unreasonable effort. Forward-looking non-GAAP measures are estimated in a manner consistent with the relevant definitions and assumptions noted elsewhere. (1) Reflects CTA held constant as of 12/31/2018 51
CEO Wrap Up Greg Heckman

Bunge is Uniquely Compelling New, world-class leadership team: experienced, focused, energized Driving value through leading global franchise w/ Oilseeds at the core Strong, consistent cash flows and disciplined capital allocation Foundation to earn $5+/share EPS at long term average crush margins Multiple opportunities to further expand earnings power 53

Q&A Greg Heckman, John Neppl, Brian Zachman
Non-GAAP reconciliations This presentation contains certain "non-GAAP financial measures" as defined in Regulation G of the Securities Exchange Act of 1934. Bunge has reconciled these non-GAAP financial measures to the most directly comparable U.S. GAAP measures in the following slides. These measures may not be comparable to similarly titled measures used by other companies. Operating results To facilitate a comparison of Bunge’s historical operating results and related trends, Bunge uses the accompanying non-GAAP financial measures: • Adjusted EBITDA • Return before income tax, adjusted • Net income (loss) per common share – diluted, adjusted (excluding certain gains & charges and mark-to-market timing differences). Adjusted EBITDA, Return before income tax, adjusted, and Net income (loss) per common share – diluted, adjusted (excluding certain gains & charges and mark-to-market timing differences) are calculated by excluding from EBITDA, Income (loss) from continuing operations before income tax, and Net income (loss) per common share-diluted certain gains and charges and the mark-to-market impact of derivative contracts on certain agricultural commodities and transportation, which is recognized in GAAP earnings immediately for derivative contracts that do not qualify for hedge accounting. Bunge’s management believes presentation of these measures allows investors to view its performance using the same measures that management uses in evaluating financial and business performance and trends without regard to certain gains and charges and the mark-to-market timing impacts of derivative contracts. These non-GAAP measures are not a measure of consolidated operating results under U.S. GAAP and should not be considered as an alternative to net income (loss), Income (loss) from continuing operations before income tax, net income (loss) per common share, or any other measure of consolidated operating results under U.S. GAAP. 55

Non-GAAP reconciliations, continued Cash Flows To facilitate a comparison of Bunge’s historical cash flow generation and related trends, Bunge uses the following non-GAAP financial measures: • Adjusted Funds from Operations (Adjusted FFO) • Discretionary Cash Flow • Cash Flow Yield Adjusted FFO is calculated by excluding from Cash provided by (used for) operating activities, foreign exchange gain (loss) on net debt and working capital changes. Discretionary Cash Flow is, in turn, calculated by further deducting (or adding, as applicable) after-tax mark-to-market timing differences, sustaining Capex, (income) loss attributable to non-controlling interest, and dividends on Convertible perpetual preference shares from Adjusted FFO. Cash Flow Yield is calculated by dividing Discretionary Cash Flow by Book equity, which itself is calculated by deducting (or adding, as applicable) after-tax mark-to-market timing differences, amount of Convertible perpetual preference shares and Non-controlling interests, and for periods presented since December 31, 2018, adding cumulative translation gains and losses since December 31, 2018. Adjusted FFO, Discretionary Cash Flow, and Cash Flow Yield are non-GAAP financial measures and are not intended to replace Cash provided by (used for) operating activities, the most directly comparable U.S. GAAP financial measures. Bunge’s management believes presentation of these measures allows investors to view its cash generating performance using the same measures that management uses in evaluating financial and business performance and trends without regard to foreign exchange gains and losses and the mark- to-market timing impacts of derivative contracts. These non-GAAP measures are not a measure of consolidated cash flow under U.S. GAAP and should not be considered as an alternative to Cash provided by (used for) operating activities, Net increase (decrease) in cash and cash equivalents and restricted cash, or any other measure of consolidated cash flow under U.S. GAAP. Book equity is a non-GAAP financial measure and is not intended to replace Equity, the most directly comparable U.S. GAAP financial measure. This non-GAAP measure is not a measure of consolidated equity under U.S. GAAP and should not be considered as an alternative to Total equity, Total Bunge shareholders’ equity, or any other measure of consolidated cash flow under U.S. GAAP. 56
Non-GAAP reconciliations, continued Returns on Capital To facilitate a comparison of Bunge’s historical returns on capital and related trends, Bunge uses the following non-GAAP financial measures: • Return on Invested Capital (ROIC) • Adjusted Return on Invested Capital (AROIC) Bunge calculates ROIC by dividing return after income tax, adjusted by the quarter ended average total capital for the trailing four quarters preceding the reporting date. Return after income tax, adjusted is calculated as income from continuing operations before income tax, including non controlling interest, for each of the trailing four quarters plus the related interest expense and excluding certain gains & charges, times the effective tax rates for those periods. Average total capital is calculated by averaging the totals of the ending balances of shareholders equity, noncontrolling interest and total debt for each quarterly period, and for periods presented since December 31, 2018, adding cumulative translation gains and losses since December 31, 2018. Bunge believes that ROIC provides investors with a measure of the return the company generates on the capital invested in its business. ROIC is not a measure of financial performance under US GAAP and should not be considered in isolation or as an alternative to net income as an indicator of company performance or as an alternative to cash flows from operating activities as a measure of liquidity. Bunge calculates AROIC by dividing return after income tax, adjusted, excluding the funding cost of readily marketable inventories available for merchandizing activities (RMI), by the quarter ended average total capital, excluding RMI, for the trailing four quarters preceding the reporting date. Return after income tax, adjusted, excluding RMI, is calculated as income from continuing operations before income tax, including non controlling interest, for each of the trailing four quarters plus the related interest expense and excluding certain gains & charges and the cost of debt used to finance RMI, times the effective tax rates for those periods. Average total capital adjusted is calculated by averaging the totals of the ending balances of shareholders equity, noncontrolling interest and total debt less RMI available for merchandizing activities for each quarterly period, and for periods presented since December 31, 2018, adding cumulative translation gains and losses since December 31, 2018. Bunge believes that AROIC provides investors with a measure of the return the company generates on the capital invested in its operating assets excluding RMI, which expands or contracts based on seasonality, commodity price cycles and market opportunities. AROIC is not a measure of financial performance under US GAAP and should not be considered in isolation or as an alternative to net income as an indicator of company performance 57 or as an alternative to cash flows from operating activities as a measure of liquidity.

Non-GAAP reconciliation Below is a reconciliation of Net income (loss) attributable to Bunge to Adjusted EBITDA: (US$ in millions) Year Ended December 31, 2020 Q1 TTM (1) 2019 2018 2017 2016 2015 2014 2013 2012 2011 2010 Net income (loss) attributable to Bunge $(1,509) $(1,280) $267 $160 $745 $791 $515 $306 $64 $972 $2,354 Interest income (31) (31) (31) (38) (51) (43) (87) (76) (53) (96) (67) Interest expense 342 339 339 263 234 258 347 363 294 295 294 Income tax expense (benefit) (7) 86 179 56 220 296 249 904 (6) 55 699 Noncontrolling interest share of interest and tax (6) (5) (7) (5) (14) (19) (36) (71) (13) (32) (44) Depreciation and Amortization 522 548 622 609 547 545 607 568 570 526 443 EBITDA $(689) $(343) $1,369 $1,045 $1,681 $1,828 $1,595 $1,994 $856 $1,720 $3,679 Income (loss) from discontinued operations - - 10 - (9) 35 32 97 (342) (25) 38 Sugar & Bioenergy Segment EBIT (1,648) (1,623) (135) (12) (4) (27) (169) (60) (637) (20) (13) Sugar & Bioenergy Segment depreciation and amortization 54 74 146 164 143 160 208 183 175 171 116 Certain (gains) and charges, excluding Sugar & Bioenergy 345 350 114 126 (98) (24) 5 (64) (38) (43) (2,216) Mark to Market timing difference 397 Adjusted EBITDA $1,647 $1,556 $1,462 $1,019 $1,452 $1,636 $1,528 $1,709 $1,622 $1,551 $1,322 (1) TTM = Trailing Twelve Months 58

Non-GAAP reconciliation notes Below is a reconciliation of Net income (loss) per common share – diluted to Net income (loss) per common share – diluted, adjusted for certain gains and charges and mark-to-market timing differences Year Ended December 31, 2019 Continuing operations: Net income (loss) per common share - diluted $ (9.34) Certain gains & charges 13.10 Adjustment of redeemable noncontrolling interest (1) 0.06 Dilutive share basis difference – GAAP vs Adjusted (2) 0.76 Beyond Meat investment (0.46) Sugar & Bioenergy segment depreciation and amortization (0.41) Net income per common share – diluted adjusted (excluding certain gains & charges) $ 3.71 (1) Adjustment of redeemable noncontrolling interest represents the impact on GAAP EPS of a charge to retained earnings associated with an adjustment to the carrying amount of the redeemable noncontrolling interest recorded in respect of our 70% ownership interest in Loders. The carrying amount of redeemable noncontrolling interests is the greater of: (i) the initial carrying amount, increased or decreased for the noncontrolling interests’ share of net income or loss, equity capital contributions and distributions or (ii) the redemption value. Any resulting increases in the redemption amount, in excess of the initial carrying amount, increased or decreased for the noncontrolling interests’ share of net income or loss, equity capital contributions and distributions, are affected by corresponding charges against retained earnings. Additionally, any such charges to retained earnings will affect net income (loss) available to Bunge common shareholders as part of Bunge's calculation of GAAP EPS. Bunge's management excludes the “Adjustment of redeemable noncontrolling interest" from its calculation of Adjusted EPS, on the basis that they are non-recurring to the Company's operations. However, such charges will reverse in the future only to the extent that Loders' net income levels result in the carrying amount of redeemable noncontrolling interests, calculated as described above, exceeding the redemption value. (2) Dilutive share basis difference - GAAP vs. Adjusted represents the impact of using different weighted-average common shares outstanding in the denominators of the respective EPS calculations. The use of different denominators is necessary as, on a GAAP basis, the company was in a net loss position, and as such no additional dilutive shares were used in the GAAP EPS calculation, as such impact would be antidilutive. However, on an adjusted basis, after excluding certain gains and charges, the company is in an adjusted net income position, which necessitates the use of additional dilutive shares associated with stock options, restricted stock units, and shares issuable upon the conversion of the convertible preference shares in the Adjusted EPS calculation. 59

Non-GAAP reconciliation Cash provided by (used for) operating activities to Adjusted FFO and Discretionary Cash Flow US$ in millions 2020 Q1 TTM (1) 2019 2018 2017 2016 2015 Cash provided by (used for) operating activities ($845) ($808) ($1,264) ($1,975) $1,904 $610 Foreign exchange (loss) gain on net debt ($16) ($139) ($139) ($21) ($80) $213 Working capital changes $1,624 $2,003 $2,492 $2,880 ($347) $593 Adjusted FFO $763 $1,056 $1,089 $884 $1,477 $1,416 Net (income) loss attributable to noncontrolling interests and redeemable noncontrolling interests $25 $11 ($20) ($14) ($22) $1 Mark-to-Market timing difference, after tax $326 $30 $(3) $83 ($36) ($95) Maintenance CAPEX ($301) ($342) ($283) ($350) ($404) ($315) Dividends paid to preference shareholders ($34) ($34) ($34) ($34) ($34) ($34) Discretionary Cash Flow $779 $721 $749 $569 $981 $973 (1) TTM = Trailing Twelve Months 60

Non-GAAP reconciliation Cash provided by (used for) operating activities to Cash flow from (for) working capital US$ in millions 2019 2018 2017 2016 2015 2014 2013 2012 2011 Cash provided by (used for) operating $(808) $(1,264) $ (1,975) $1,904 $610 $1,399 $2,225 $(457) $2,614 activities Net (income) loss 1,291 (287) (174) (767) (790) (517) (207) (36) (940) Impairment charges (1,825) (18) (52) (87) (57) (130) (35) (574) (3) Foreign exchange gain (loss) on net debt (139) (139) (21) (80) 213 215 48 74 (113) Gain (loss), net on disposal of affilitiate (55) (26) 9 122 47 - 3 121 37 investments Bad debt expense (9) (64) (28) (13) (35) (30) (26) (115) (40) Depreciation, depletion and amortization (548) (622) (609) (547) (545) (607) (568) (570) (526) Share-based compensation expense (39) (46) (29) (44) (46) (49) (53) (44) (49) Deferred income tax (expense) benefit 24 (6) 23 (126) (16) 90 (460) 35 217 Gain (loss) on sale of investments and 93 1 12 - - - 177 36 17 property, plant and equipment Other, net 12 (21) (36) (15) 26 76 (29) (38) 5 Proceeds from Beneficial interest in 1,289 1,909 3,001 - - - - - - securitized trade receivables (1) Cash flow from (for) working capital $(714) $(583) $121 $347 $(593) $447 $1,075 $(1,568) $1,219 Cumulative cash flow from (for) working $(249) $465 $1,048 $927 $580 $1,173 $726 $(349) $1,219 capital (1) Proceeds from beneficial interest in securitized trade receivables only applicable to certain periods based on adoption of ASU 2016- 15, Statement of Cash Flows (Topic 230), Classification of Certain Cash Receipts and Cash Payments. 61

RMI Adjusted Metric • Given the nature of Bunge’s agribusiness operations, return metrics should take into consideration cash “in commodities form” available for liquidation (RMI) − The RMI adjustment is defined as the total USD amount of RMI attributable to merchandising, excluding minimum required inventory to run Bunge facilities − Historically RMI attributable to merchandising represents ~ 75% of total RMI, ranging from $3-4 billion • Cost of borrowing charge should be applied to reflect expected return on cash usage AROIC = (Adjusted EBIT – RMI*Cost of debt) x (1-ETR) IC – RMI *Adjusted EBIT excludes timing differences 62

Non-GAAP reconciliation notes Return on Invested Capital excluding certain gains and charges, and Sugar & Bioenergy Segment Trailing 4 Trailing 4 Trailing 4 Trailing 4 Trailing 4 Trailing 4 Quarters Quarters Quarters Quarters Quarters Quarters March 31, December 31, December 31, December 31, December 31, December 31, (US$ in millions) 2020 2019 2018 2017 2016 2015 EBIT, excluding Sugar & Bioenergy $442 $732 $872 $448 $1,147 $1,275 EBIT attributable to noncontrolling interest (19) (6) 27 19 36 18 Interest income 31 31 31 38 51 43 Certain gains & charges (1) 314 350 114 126 (98) (24) Mark-to-Market timing difference 397 35 (4) 94 (48) (131) Return before income tax, adjusted $1,165 $1,142 $1040 $725 $1,088 $1,181 Effective tax rate 18% 17% 22% 13% 23% 26% Return after income tax, adjusted $958 $950 $811 $632 $835 $878 Trailing 4 Quarters Average total capital $11,285 $11,597 $12,467 $10,654 $10,131 $9,794 Mark-to-Market timing difference 397 35 (4) 94 (48) (131) Average total capital, adjusted (TD adj.) $11,682 $11,632 $12,463 $10,748 $10,083 $9,663 ROIC (TD adj.) 8.2% 8.2% 6.5% 5.9% 8.3% 9.1% Trailing 4 Quarters Average total capital, adjusted $11,682 $11,632 $12,463 $10,748 $10,083 $9,663 CTA Adjustments 319 85 - - - - Average total capital, adjusted (CTA adj.) $12,001 $11,717 $12,467 $10,654 $10,131 $9,794 ROIC (CTA adj.) 8.0% 8.1% 6.5% 5.9% 8.3% 9.1% (1) Certain gains & charges excludes certain gains and charges related to the Sugar & Bioenergy segment for all years presented. (2) Bunge calculates return on invested capital (ROIC) by dividing return after income tax, adjusted by the quarter ended average total capital, adjusted, for the trailing four quarters preceding the reporting date. Return after income tax, adjusted is calculated as income from continuing operations before income tax, including non controlling interest, for each of the trailing four quarters plus the related interest expense and excluding certain gains & charges and mark-to- market timing differences (TD adj.), times the effective tax rates for those periods. Average total capital, adjusted is calculated by averaging the totals of the ending balances of shareholders equity, noncontrolling interest and total debt for each quarterly period, excluding mark-to-market timing differences and cumulative translation adjustments (CTA adj.). Bunge believes that ROIC provides investors with a measure of the return the company generates on the capital invested in its business. ROIC is not a measure of financial performance under generally accepted accounting principles and should not be considered in isolation or as an alternative to net income as an indicator of company performance or as an alternative to cash flows from operating activities as a measure of liquidity. 63

Non-GAAP reconciliation notes Return on Invested Capital excluding certain gains and charges, RMI attributable to merchandising, and Sugar & Bioenergy Segment Trailing 4 Trailing 4 Trailing 4 Trailing 4 Trailing 4 Trailing 4 Quarters Quarters Quarters Quarters Quarters Quarters March 31, December 31, December 31, December 31, December 31, December 31, (US$ in millions) 2020 2019 2018 2017 2016 2015 EBIT, excluding Sugar & Bioenergy $442 $732 $872 $448 $1,147 $1,275 EBIT attributable to noncontrolling interest (19) (6) 27 19 36 18 Interest income 31 31 31 38 51 43 Certain gains & charges (1) 314 350 114 126 (98) (24) Mark-to-Market timing difference 397 35 (4) 94 (48) (131) Return before income tax, adjusted $1,165 $1,142 $1,040 $725 $1,088 $1,181 RMI attributable to merchandising (3) (3,071) (3,140) (4,039) (3,013) (3,050) (2,880) Cost of Debt 4.5% 4.5% 4.5% 4.5% 4.5% 4.5% RMI Adjustment (138) (141) (182) (136) (137) (130) Return before income tax, adjusted, excluding RMI related to merchandising $1,027 $1,001 $858 $589 $951 $1,050 Effective tax rate 18% 17% 22% 13% 23% 26% Return after income tax, adjusted $845 $833 $669 $514 $730 $781 Trailing 4 Quarters Average total capital $11,285 $11,597 $12,467 $10,654 $10,131 $9,794 Mark-to-Market timing difference 397 35 (4) 94 (48) (131) CTA Adjustments 319 85 - - - - RMI attributable to merchandising (3) (3,071) (3,140) (4,039) (3,013) (3,050) (2,880) Average total capital, adjusted $8,930 $8,577 $8,424 $7,735 $7,033 $6,783 AROIC 9.5% 9.7% 7.9% 6.6% 10.4% 11.5% (1) Certain gains & charges excludes certain gains and charges related to the Sugar & Bioenergy segment for all years presented. (2) Bunge calculates return on invested capital (ROIC) by dividing return after income tax, adjusted by the quarter ended average total capital for the trailing four quarters preceding the reporting date. Return after income tax, adjusted is calculated as income from continuing operations before income tax, including non controlling interest, for each of the trailing four quarters plus the related interest expense and excluding certain gains & charges, times the effective tax rates for those periods. Average total capital is calculated by averaging the totals of the ending balances of shareholders equity, noncontrolling interest and total debt for each quarterly period. Bunge believes that ROIC provides investors with a measure of the return the company generates on the capital invested in its business. ROIC is not a measure of financial performance under generally accepted accounting principles and should not be considered in isolation or as an alternative to net income as an indicator of company performance or as an alternative to cash flows from operating activities as a measure of liquidity. (3) Readily Marketable Inventory attributable to merchandising is calculated as average account balance over of the trailing four quarter preceding the reporting date, excluding the Sugar and Bioenergy segment. 64

Non-GAAP reconciliation Below is a reconciliation of Income (loss) from continuing operations before income tax to Return before income tax, adjusted, as utilized to calculate ROIC and AROIC in the preceding slides: Trailing 4 Trailing 4 Trailing Trailing 4 Trailing 4 Trailing 4 Quarters Quarters Quarters Quarters Quarters Quarters March 31, December 31, December 31, December 31, December 31, December 31, (US$ in millions) 2020 2019 2018 2017 2016 2015 Income (loss) from continuing operations before income tax $(1,541) $(1,205) $456 $230 $996 $1,051 Interest expense 341 339 339 263 234 258 Certain gains & charges, excluding Sugar & Bioenergy 314 350 114 126 (98) (24) Mark-to-market timing difference 397 35 (4) 94 (48) (131) Sugar & Bioenergy Segment EBIT 1,654 1,623 135 12 4 27 Return before income tax, adjusted $1,165 $1,142 $1,040 $725 $1,088 $1,181 65

Non-GAAP reconciliation Book Equity Below is a reconciliation of Total equity to Common Equity: March 31, December 31, December 31, December 31, December 31, December 31, (US$ in millions) 2020 2019 2018 2017 2016 2015 Total equity $4,971 $6,031 $6,377 $7,357 $7,343 $6,652 Convertible preference (690) (690) (690) (690) (690) (690) Noncontrolling Interest (110) (117) (205) (209) (199) (210) Mark-to-market timing difference 326 30 (3) 83 (36) (95) Cumulative Translation Adjustment(1) 954 119 - - - - Book Equity $5,451 $5,373 $5,479 $6,541 $6,418 $5,657 (1) CTA Adjustment applied to 2019 and 2020 only and comprises the difference between Bunge’s March 31, 2020 and December 31, 2018 Cumulative Foreign Exchange Translation Adjustment balances. 66

Thank you
