Attached files
| file | filename |
|---|---|
| 8-K - 8-K - Performance Food Group Co | d920923d8k.htm |

Exhibit 99.1 Performance Food Group June 2020 ‹# ‹# ‹#››› © © © PFG PFG PFG / CAGNY 2020Exhibit 99.1 Performance Food Group June 2020 ‹# ‹# ‹#››› © © © PFG PFG PFG / CAGNY 2020

Disclaimer This presentation has been prepared by Performance Food Group Company (“us” or the “Company”) solely for information purposes. This presentation contains forward-looking statements within the meaning of Section 27A of the Securities Act of 1933, as amended (the “Securities Act”) and Section 21E of the Securities Exchange Act of 1934. These statements include, but are not limited to, statements related to our expectations regarding the performance of our business, our financial results, our liquidity and capital resources, the effects of the COVID-19 pandemic, integration of our acquisition (the “Reinhart Transaction”) of Reinhart Foodservice, L.L.C. ( “Reinhart”) and other non- historical statements. You can identify these forward-looking statements by the use of words such as “outlook,” “believes,” “expects,” “potential,” “continues,” “may,” “might,” “will,” “should,” “could,” “seeks,” “projects,” “targets,” “predicts,” “intends,” “plans,” “estimates,” “anticipates,” “future,” “budget,” “goals,” or the negative version of these words or other comparable words. The forward-looking statements are not historical facts, and are based upon the Company’s current expectations, beliefs, estimates, and projections, and various assumptions, many of which, by their nature, are inherently uncertain and beyond the Company’s control. The Company’s expectations, beliefs and projections are expressed in good faith and the Company believes there is a reasonable basis for them. However, there can be no assurance that management’s expectations, beliefs, estimates, and projections will result or be achieved and actual results may vary materially from what is expressed in or indicated by the forward-looking statements. Such forward-looking statements are subject to various risks and uncertainties. The following factors, in addition to those discussed under the sections entitled Item 1A Risk Factors in the Company’s Annual Report on Form 10-K for the fiscal year ended June 29, 2019 filed with the Securities and Exchange Commission (the “SEC”) on August 16, 2019 and the company’s Quarterly Report on Form 10Q for the quarter ended March 28, 2020 filed with the SEC on May 5, 2020, as such factors may be further updated from time to time in our filings with the SEC, which are accessible on the SEC’s website at www.sec.gov, could cause actual future results to differ materially from those expressed in any forward-looking statements: the effects and duration of the COVID-19 pandemic; competition in our industry is intense, and we may not be able to compete successfully; we operate in a low margin industry, which could increase the volatility of our results of operations; we may not realize anticipated benefits from our operating cost reduction and productivity improvement efforts; our profitability is directly affected by cost inflation and deflation and other factors; we do not have long-term contracts with certain of our customers; group purchasing organizations may become more active in our industry and increase their efforts to add our customers as members of these organizations; changes in eating habits of consumers; extreme weather conditions; our reliance on third-party suppliers; labor relations and cost risks and availability of qualified labor; volatility of fuel and other transportation costs; inability to adjust cost structure where one or more of our competitors successfully implement lower costs; we may be unable to increase our sales in the highest margin portion of our business; changes in pricing practices of our suppliers; our growth strategy may not achieve the anticipated results; risks relating to acquisitions, including the risks that we are not able to realize benefits of acquisitions or successfully integrate the businesses we acquire; environmental, health, and safety costs; the risk that we fail to comply with requirements imposed by applicable law or government regulations; our reliance on technology and risks associated with disruption or delay in implementation of new technology; costs and risks associated with a potential cybersecurity incident or other technology disruption; product liability claims relating to the products we distribute and other litigation; adverse judgments or settlements; negative media exposure and other events that damage our reputation; anticipated multiemployer pension related liabilities and contributions to our multiemployer pension plan; decreases in earnings from amortization charges associated with acquisitions; impact of uncollectability of accounts receivable, including on our ability to borrow under our ABL facility; difficult economic conditions affecting consumer confidence, including as a result to the COVID-19 pandemic; departure of key members of senior management; risks relating to federal, state, and local tax rules; the cost and adequacy of insurance coverage; risks relating to our outstanding indebtedness; our ability to raise additional capital; our ability to maintain an effective system of disclosure controls and internal control over financial reporting; the possibility that the expected synergies and value creation from the acquisition of Reinhart will not be realized or will not be realized within the expected time period; and the risk that as a result of the recent Reinhart acquisition the combined company may not be able to effectively manage its expanded operations. Accordingly, there are or will be important factors that could cause actual outcomes or results to differ materially from those indicated in these statements. These factors should not be construed as exhaustive and should be read in conjunction with the other cautionary statements that are included in this presentation and in our filings with the SEC. Any forward-looking statement, including any contained herein, speaks only as of the time of this presentation and we do not undertake any obligation to update or revise them as more information becomes available or to disclose any facts, events, or circumstances after the date of this presentation that may affect the accuracy of any forward- looking statement, except as required by law. This presentation includes certain non-GAAP financial measures, including Adjusted EBITDA. These metrics have important limitations and should not be considered in isolation or as a substitute for measures of the Company’s financial performance or liquidity prepared in accordance with GAAP. In addition, these metrics, as presented by the Company, may not be comparable to similarly titled measures of other companies due to varying methods of calculations. Please refer to the Appendix of this presentation for a reconciliation of the non-GAAP financial measures included in this presentation to the most directly comparable financial measures prepared in accordance with GAAP. The Company owns or has rights to use a number of registered and common law trademarks, service marks and trade names in connection with its business, including Performance Foodservice, PFG Customized, Vistar, West Creek, Silver Source, Braveheart 100% Black Angus, Empire’s Treasure, Brilliance, Heritage Ovens, Village Garden, Guest House, Piancone, Luigi’s, Ultimo, Corazo, and Assoluti. Solely for convenience, the trademarks, service marks and trade names referred to in this presentation are without the ® and ™ symbols, but such references are not intended to indicate, in any way, that the Company will not assert, to the fullest extent under applicable law, its rights or the rights of the applicable licensors to these trademarks, service marks, and trade names. This presentation contains additional trademarks, service marks, and trade names of others, which are the property of their respective owners. All trademarks, service marks, and trade names appearing in this presentation are, to our knowledge, the property of their respective owners. ‹# ‹# ‹# 2››› © © © © PFG PFG PFG PFG / CAGNY 2020Disclaimer This presentation has been prepared by Performance Food Group Company (“us” or the “Company”) solely for information purposes. This presentation contains forward-looking statements within the meaning of Section 27A of the Securities Act of 1933, as amended (the “Securities Act”) and Section 21E of the Securities Exchange Act of 1934. These statements include, but are not limited to, statements related to our expectations regarding the performance of our business, our financial results, our liquidity and capital resources, the effects of the COVID-19 pandemic, integration of our acquisition (the “Reinhart Transaction”) of Reinhart Foodservice, L.L.C. ( “Reinhart”) and other non- historical statements. You can identify these forward-looking statements by the use of words such as “outlook,” “believes,” “expects,” “potential,” “continues,” “may,” “might,” “will,” “should,” “could,” “seeks,” “projects,” “targets,” “predicts,” “intends,” “plans,” “estimates,” “anticipates,” “future,” “budget,” “goals,” or the negative version of these words or other comparable words. The forward-looking statements are not historical facts, and are based upon the Company’s current expectations, beliefs, estimates, and projections, and various assumptions, many of which, by their nature, are inherently uncertain and beyond the Company’s control. The Company’s expectations, beliefs and projections are expressed in good faith and the Company believes there is a reasonable basis for them. However, there can be no assurance that management’s expectations, beliefs, estimates, and projections will result or be achieved and actual results may vary materially from what is expressed in or indicated by the forward-looking statements. Such forward-looking statements are subject to various risks and uncertainties. The following factors, in addition to those discussed under the sections entitled Item 1A Risk Factors in the Company’s Annual Report on Form 10-K for the fiscal year ended June 29, 2019 filed with the Securities and Exchange Commission (the “SEC”) on August 16, 2019 and the company’s Quarterly Report on Form 10Q for the quarter ended March 28, 2020 filed with the SEC on May 5, 2020, as such factors may be further updated from time to time in our filings with the SEC, which are accessible on the SEC’s website at www.sec.gov, could cause actual future results to differ materially from those expressed in any forward-looking statements: the effects and duration of the COVID-19 pandemic; competition in our industry is intense, and we may not be able to compete successfully; we operate in a low margin industry, which could increase the volatility of our results of operations; we may not realize anticipated benefits from our operating cost reduction and productivity improvement efforts; our profitability is directly affected by cost inflation and deflation and other factors; we do not have long-term contracts with certain of our customers; group purchasing organizations may become more active in our industry and increase their efforts to add our customers as members of these organizations; changes in eating habits of consumers; extreme weather conditions; our reliance on third-party suppliers; labor relations and cost risks and availability of qualified labor; volatility of fuel and other transportation costs; inability to adjust cost structure where one or more of our competitors successfully implement lower costs; we may be unable to increase our sales in the highest margin portion of our business; changes in pricing practices of our suppliers; our growth strategy may not achieve the anticipated results; risks relating to acquisitions, including the risks that we are not able to realize benefits of acquisitions or successfully integrate the businesses we acquire; environmental, health, and safety costs; the risk that we fail to comply with requirements imposed by applicable law or government regulations; our reliance on technology and risks associated with disruption or delay in implementation of new technology; costs and risks associated with a potential cybersecurity incident or other technology disruption; product liability claims relating to the products we distribute and other litigation; adverse judgments or settlements; negative media exposure and other events that damage our reputation; anticipated multiemployer pension related liabilities and contributions to our multiemployer pension plan; decreases in earnings from amortization charges associated with acquisitions; impact of uncollectability of accounts receivable, including on our ability to borrow under our ABL facility; difficult economic conditions affecting consumer confidence, including as a result to the COVID-19 pandemic; departure of key members of senior management; risks relating to federal, state, and local tax rules; the cost and adequacy of insurance coverage; risks relating to our outstanding indebtedness; our ability to raise additional capital; our ability to maintain an effective system of disclosure controls and internal control over financial reporting; the possibility that the expected synergies and value creation from the acquisition of Reinhart will not be realized or will not be realized within the expected time period; and the risk that as a result of the recent Reinhart acquisition the combined company may not be able to effectively manage its expanded operations. Accordingly, there are or will be important factors that could cause actual outcomes or results to differ materially from those indicated in these statements. These factors should not be construed as exhaustive and should be read in conjunction with the other cautionary statements that are included in this presentation and in our filings with the SEC. Any forward-looking statement, including any contained herein, speaks only as of the time of this presentation and we do not undertake any obligation to update or revise them as more information becomes available or to disclose any facts, events, or circumstances after the date of this presentation that may affect the accuracy of any forward- looking statement, except as required by law. This presentation includes certain non-GAAP financial measures, including Adjusted EBITDA. These metrics have important limitations and should not be considered in isolation or as a substitute for measures of the Company’s financial performance or liquidity prepared in accordance with GAAP. In addition, these metrics, as presented by the Company, may not be comparable to similarly titled measures of other companies due to varying methods of calculations. Please refer to the Appendix of this presentation for a reconciliation of the non-GAAP financial measures included in this presentation to the most directly comparable financial measures prepared in accordance with GAAP. The Company owns or has rights to use a number of registered and common law trademarks, service marks and trade names in connection with its business, including Performance Foodservice, PFG Customized, Vistar, West Creek, Silver Source, Braveheart 100% Black Angus, Empire’s Treasure, Brilliance, Heritage Ovens, Village Garden, Guest House, Piancone, Luigi’s, Ultimo, Corazo, and Assoluti. Solely for convenience, the trademarks, service marks and trade names referred to in this presentation are without the ® and ™ symbols, but such references are not intended to indicate, in any way, that the Company will not assert, to the fullest extent under applicable law, its rights or the rights of the applicable licensors to these trademarks, service marks, and trade names. This presentation contains additional trademarks, service marks, and trade names of others, which are the property of their respective owners. All trademarks, service marks, and trade names appearing in this presentation are, to our knowledge, the property of their respective owners. ‹# ‹# ‹# 2››› © © © © PFG PFG PFG PFG / CAGNY 2020

Delivering Success Our Mission To be a leader in the foodservice distribution industry by delivering world-class innovative products and value-added services that enable our customers’ success and support enduring supplier relationships. 3 ‹# ‹#›› © PFG © © PFG PFG / CAGNY 2020Delivering Success Our Mission To be a leader in the foodservice distribution industry by delivering world-class innovative products and value-added services that enable our customers’ success and support enduring supplier relationships. 3 ‹# ‹#›› © PFG © © PFG PFG / CAGNY 2020

Track Record of Net Sales Growth ($ in billions) Consistent Growth (1) $26 $20 $18 $17 $16 $15 $14 $13 $12 +12.1% § Category leader in an attractive industry Y/Y 2012 2013 2014 2015 2016 2017 2018 2019 2019PF PFG Reinhart § Customer-centric business model with local decision making (2) Strong Adj. EBITDA Growth § Driving consistent market share gains, new and Consistent Margin Profile ($ in millions) customer wins and further channel expansion (1) $640 $476 § Operational excellence and size enable strong $427 $391 $367 profit growth $329 +11.4% $286 $271 $241 Y/Y 2.4% 2.4% 2.5% 2.3% 2.3% 2.1% 2.2% 2.1% 2.1% § Substantial runway to sustain strong organic 2012 2013 2014 2015 2016 2017 2018 2019 2019PF growth PFG Reinhart (1) Based on FY2019 pro forma financials. (2) For reconciliation of net income to Adjusted EBITDA, please refer to the Appendix. 4 ‹# ‹#›› © PFG © © PFG PFG / CAGNY 2020Track Record of Net Sales Growth ($ in billions) Consistent Growth (1) $26 $20 $18 $17 $16 $15 $14 $13 $12 +12.1% § Category leader in an attractive industry Y/Y 2012 2013 2014 2015 2016 2017 2018 2019 2019PF PFG Reinhart § Customer-centric business model with local decision making (2) Strong Adj. EBITDA Growth § Driving consistent market share gains, new and Consistent Margin Profile ($ in millions) customer wins and further channel expansion (1) $640 $476 § Operational excellence and size enable strong $427 $391 $367 profit growth $329 +11.4% $286 $271 $241 Y/Y 2.4% 2.4% 2.5% 2.3% 2.3% 2.1% 2.2% 2.1% 2.1% § Substantial runway to sustain strong organic 2012 2013 2014 2015 2016 2017 2018 2019 2019PF growth PFG Reinhart (1) Based on FY2019 pro forma financials. (2) For reconciliation of net income to Adjusted EBITDA, please refer to the Appendix. 4 ‹# ‹#›› © PFG © © PFG PFG / CAGNY 2020

Business Mix PFG Segment Overview (1) Vistar Net Sales PFG Operating Segments 34% § One of the largest broadline distributors by net sales in the U.S. Foodservice 66% § A leading distributor to independent pizzerias in the U.S. § Around $3 billion sales of proprietary Performance Brands Vistar 32% (1) EBITDA § A leading distributor with ~30,000 SKUs of candy, snacks, beverages and other items selling to: ― Vending distributors─ Hospitality Foodservice 68% ― Office coffee service distributors ─ College bookstores ― Theaters, stadium and arenas ─ Convenience stores ― Retail impulse ─ Corrections (1) Represents FY2020 YTD 3Q and excludes Corporate & All Other and Intersegment Eliminations. This period includes one quarter of Reinhart results. 5 ‹# ‹#›› © PFG © © PFG PFG / CAGNY 2020Business Mix PFG Segment Overview (1) Vistar Net Sales PFG Operating Segments 34% § One of the largest broadline distributors by net sales in the U.S. Foodservice 66% § A leading distributor to independent pizzerias in the U.S. § Around $3 billion sales of proprietary Performance Brands Vistar 32% (1) EBITDA § A leading distributor with ~30,000 SKUs of candy, snacks, beverages and other items selling to: ― Vending distributors─ Hospitality Foodservice 68% ― Office coffee service distributors ─ College bookstores ― Theaters, stadium and arenas ─ Convenience stores ― Retail impulse ─ Corrections (1) Represents FY2020 YTD 3Q and excludes Corporate & All Other and Intersegment Eliminations. This period includes one quarter of Reinhart results. 5 ‹# ‹#›› © PFG © © PFG PFG / CAGNY 2020
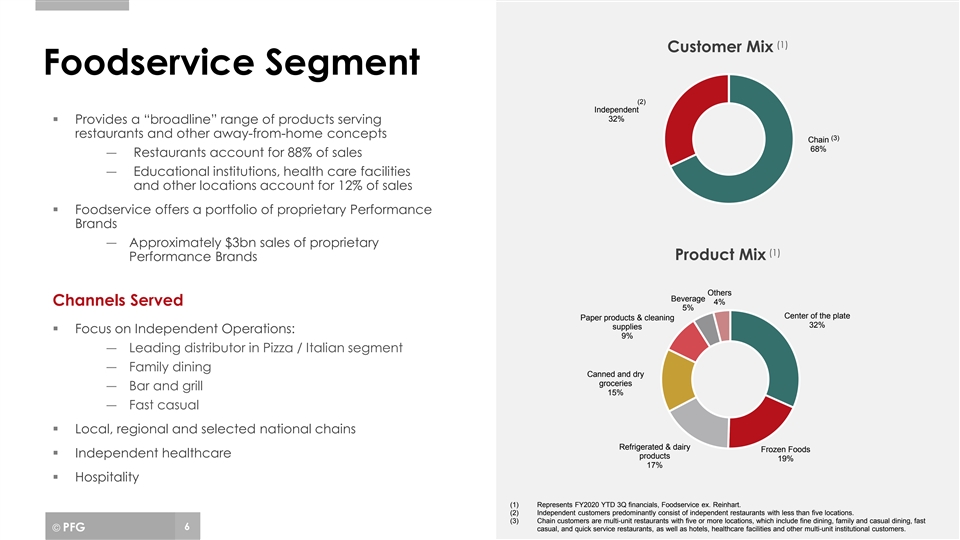
(1) Customer Mix Foodservice Segment (2) Independent 32% § Provides a “broadline” range of products serving restaurants and other away-from-home concepts (3) Chain 68% ― Restaurants account for 88% of sales ― Educational institutions, health care facilities and other locations account for 12% of sales § Foodservice offers a portfolio of proprietary Performance Brands ― Approximately $3bn sales of proprietary (1) Product Mix Performance Brands Others Beverage 4% Channels Served 5% Center of the plate Paper products & cleaning 32% supplies § Focus on Independent Operations: 9% ― Leading distributor in Pizza / Italian segment ― Family dining Canned and dry groceries ― Bar and grill 15% ― Fast casual § Local, regional and selected national chains Refrigerated & dairy Frozen Foods § Independent healthcare products 19% 17% § Hospitality (1) Represents FY2020 YTD 3Q financials, Foodservice ex. Reinhart. (2) Independent customers predominantly consist of independent restaurants with less than five locations. (3) Chain customers are multi-unit restaurants with five or more locations, which include fine dining, family and casual dining, fast 6 ‹# ‹#›› © PFG casual, and quick service restaurants, as well as hotels, healthcare facilities © © and ot PFG PFG her / m C ulti-A uniG t insN titut Yional 2020 customers.(1) Customer Mix Foodservice Segment (2) Independent 32% § Provides a “broadline” range of products serving restaurants and other away-from-home concepts (3) Chain 68% ― Restaurants account for 88% of sales ― Educational institutions, health care facilities and other locations account for 12% of sales § Foodservice offers a portfolio of proprietary Performance Brands ― Approximately $3bn sales of proprietary (1) Product Mix Performance Brands Others Beverage 4% Channels Served 5% Center of the plate Paper products & cleaning 32% supplies § Focus on Independent Operations: 9% ― Leading distributor in Pizza / Italian segment ― Family dining Canned and dry groceries ― Bar and grill 15% ― Fast casual § Local, regional and selected national chains Refrigerated & dairy Frozen Foods § Independent healthcare products 19% 17% § Hospitality (1) Represents FY2020 YTD 3Q financials, Foodservice ex. Reinhart. (2) Independent customers predominantly consist of independent restaurants with less than five locations. (3) Chain customers are multi-unit restaurants with five or more locations, which include fine dining, family and casual dining, fast 6 ‹# ‹#›› © PFG casual, and quick service restaurants, as well as hotels, healthcare facilities © © and ot PFG PFG her / m C ulti-A uniG t insN titut Yional 2020 customers.

(1) Customer Mix Vistar Segment Hospitality/Travel 2% All Other 3% Office Supply 3% Value 4% Retail 5% § A leading distributor to vending and office coffee service Convenience OCS 5% distributors, theaters, retail impulse, and other channels store 53% Theater 7% § Broad ~30,000 SKUs in candy, snacks, beverages, and other items Vending 18% § Proven ability to build upon national platform to expand into new customer channels § Versatile national distribution network capable of tailored truck load deliveries to customer locations (1) Product Mix § Acquired Eby-Brown in April 2019 to strategically expand into the convenience channel Beverage 13% Others 15% Refrigerated & Dairy products 2% Candy 13% Theater/Concession 2% Strategic SKU growth continues to evolve as consumers evolve: More Snacks 13% Customers Cigarettes 36% Frozen Foods 6% More More SKUs Channels (1) Represents FY2020 YTD Q3 financials. Total sales includes $3.0 billion for Eby-Brown, excludes $815.9 million in Eby- Brown excise taxes in depiction of channel volume distribution. 7 ‹# ‹#›› © PFG © © PFG PFG / CAGNY 2020(1) Customer Mix Vistar Segment Hospitality/Travel 2% All Other 3% Office Supply 3% Value 4% Retail 5% § A leading distributor to vending and office coffee service Convenience OCS 5% distributors, theaters, retail impulse, and other channels store 53% Theater 7% § Broad ~30,000 SKUs in candy, snacks, beverages, and other items Vending 18% § Proven ability to build upon national platform to expand into new customer channels § Versatile national distribution network capable of tailored truck load deliveries to customer locations (1) Product Mix § Acquired Eby-Brown in April 2019 to strategically expand into the convenience channel Beverage 13% Others 15% Refrigerated & Dairy products 2% Candy 13% Theater/Concession 2% Strategic SKU growth continues to evolve as consumers evolve: More Snacks 13% Customers Cigarettes 36% Frozen Foods 6% More More SKUs Channels (1) Represents FY2020 YTD Q3 financials. Total sales includes $3.0 billion for Eby-Brown, excludes $815.9 million in Eby- Brown excise taxes in depiction of channel volume distribution. 7 ‹# ‹#›› © PFG © © PFG PFG / CAGNY 2020

Recent Acquisitions § Reinhart Foodservice acquisition closed in December § Eby-Brown acquisition closed in April 2019 2019 § Business is performing in line with § Integration is on track management expectations § Business was performing in line with management § Eby-Brown has demonstrated relative expectations through mid-March resilience through COVID-19 crisis ‹# ‹# ‹# 8››› © © © © PFG PFG PFG PFG / CAGNY 2020Recent Acquisitions § Reinhart Foodservice acquisition closed in December § Eby-Brown acquisition closed in April 2019 2019 § Business is performing in line with § Integration is on track management expectations § Business was performing in line with management § Eby-Brown has demonstrated relative expectations through mid-March resilience through COVID-19 crisis ‹# ‹# ‹# 8››› © © © © PFG PFG PFG PFG / CAGNY 2020

The COVID-19 crisis has evolved rapidly and impacted our industry th § The World Health Organization declared COVID-19 a pandemic on March 11 th (1) § On March 15 , the CDC recommended no gatherings of 50 people or more in the U.S. and States started issuing orders to close bars and restaurants th § Through March 13 , PFG had not experienced any meaningful declines in sales (2) § As result of the COVID-19 crisis, PFG experienced a sales decline of approximately 50% in the last two weeks of (3) March , trends have improved sequentially through mid-June § The company has taken substantial actions to mitigate the impact of COVID-19 and defend the financial performance of the business § Food Away From Home industry has proven to be resilient through historical cycles § Despite near-term headwinds, PFG remains confident in the attractiveness of the long-term fundamentals of the industry (1) CDC stands for Centers of Disease Control and Prevention. (2) Derived from weekly revenue data that is preliminary, unaudited and subject to month and quarter end adjustments. (3) Relative to prior year comparative period (pro forma for Reinhart acquisition). ‹# ‹# ‹# 9››› © © © © PFG PFG PFG PFG / CAGNY 2020The COVID-19 crisis has evolved rapidly and impacted our industry th § The World Health Organization declared COVID-19 a pandemic on March 11 th (1) § On March 15 , the CDC recommended no gatherings of 50 people or more in the U.S. and States started issuing orders to close bars and restaurants th § Through March 13 , PFG had not experienced any meaningful declines in sales (2) § As result of the COVID-19 crisis, PFG experienced a sales decline of approximately 50% in the last two weeks of (3) March , trends have improved sequentially through mid-June § The company has taken substantial actions to mitigate the impact of COVID-19 and defend the financial performance of the business § Food Away From Home industry has proven to be resilient through historical cycles § Despite near-term headwinds, PFG remains confident in the attractiveness of the long-term fundamentals of the industry (1) CDC stands for Centers of Disease Control and Prevention. (2) Derived from weekly revenue data that is preliminary, unaudited and subject to month and quarter end adjustments. (3) Relative to prior year comparative period (pro forma for Reinhart acquisition). ‹# ‹# ‹# 9››› © © © © PFG PFG PFG PFG / CAGNY 2020

(1) Weekly Dollar Sales Data (1) Total PFG Weekly Dollar Sales (2019 figures include pro forma sales for Reinhart & Eby-Brown) ($ in millions) % y-o-y (49.6%) (49.1%) (46.0%) (42.7%) (32.0%) (32.0%) (27.4%) (24.9%) (22.5%) (19.9%) (19.2%) (14.7%) (10.1%) change Week 3/28/20 4/4/20 4/11/20 4/18/20 4/25/20 5/2/2020 5/9/2020 5/16/2020 5/23/2020 5/30/2020 6/6/2020 6/13/2020 6/20/2020 ending FY2019 FY2020 0% 0% -10% -10% -20% -20% -30% -40% -30% -50% -40% -60% 3/28 4/11 4/25 5/9 5/23 6/6 6/20 3/28 4/11 4/25 5/9 5/23 6/6 6/20 Foodservice Segment $ Sales % Change vs. YAGO Vistar Segment $ Sales % Change vs. YAGO 10 ‹# ‹# ‹#››› © © © © PFG PFG PFG PFG / CAGNY 2020 (1) All FY2019 sales data pro forma to include acquisition of Reinhart and Eby-Brown. Derived from weekly revenue data that is preliminary, unaudited and subject to month and quarter end adjustments.(1) Weekly Dollar Sales Data (1) Total PFG Weekly Dollar Sales (2019 figures include pro forma sales for Reinhart & Eby-Brown) ($ in millions) % y-o-y (49.6%) (49.1%) (46.0%) (42.7%) (32.0%) (32.0%) (27.4%) (24.9%) (22.5%) (19.9%) (19.2%) (14.7%) (10.1%) change Week 3/28/20 4/4/20 4/11/20 4/18/20 4/25/20 5/2/2020 5/9/2020 5/16/2020 5/23/2020 5/30/2020 6/6/2020 6/13/2020 6/20/2020 ending FY2019 FY2020 0% 0% -10% -10% -20% -20% -30% -40% -30% -50% -40% -60% 3/28 4/11 4/25 5/9 5/23 6/6 6/20 3/28 4/11 4/25 5/9 5/23 6/6 6/20 Foodservice Segment $ Sales % Change vs. YAGO Vistar Segment $ Sales % Change vs. YAGO 10 ‹# ‹# ‹#››› © © © © PFG PFG PFG PFG / CAGNY 2020 (1) All FY2019 sales data pro forma to include acquisition of Reinhart and Eby-Brown. Derived from weekly revenue data that is preliminary, unaudited and subject to month and quarter end adjustments.

Long-Term Recovery Vision § PFG is well positioned in the industry to continue to gain market share organically − We are a market leader with scale and extensive geographic coverage − We have a customer-centric business model that underpins sustainable growth − We have successfully expanded into new customers and channels diversifying our business − Our proprietary brands are a key competitive advantage § PFG is also a disciplined and proven acquirer with a track record of successful integration. We believe there is significant further opportunity to continue consolidation in core categories and adjacent channels 11 ‹# ‹# ‹#››› © © © © PFG PFG PFG PFG / CAGNY 2020Long-Term Recovery Vision § PFG is well positioned in the industry to continue to gain market share organically − We are a market leader with scale and extensive geographic coverage − We have a customer-centric business model that underpins sustainable growth − We have successfully expanded into new customers and channels diversifying our business − Our proprietary brands are a key competitive advantage § PFG is also a disciplined and proven acquirer with a track record of successful integration. We believe there is significant further opportunity to continue consolidation in core categories and adjacent channels 11 ‹# ‹# ‹#››› © © © © PFG PFG PFG PFG / CAGNY 2020

Key takeaways ü PFG has a long standing track record of delivering consistent growth ü PFG has taken swift and decisive actions to mitigate the impact of COVID-19 on the business and fortify the balance sheet ü PFG remains confident in the long-term growth potential of the Food Away From Home industry ü Company positioning has created opportunity for market share gains 12 ‹# ‹# ‹#››› © © © © PFG PFG PFG PFG / CAGNY 2020Key takeaways ü PFG has a long standing track record of delivering consistent growth ü PFG has taken swift and decisive actions to mitigate the impact of COVID-19 on the business and fortify the balance sheet ü PFG remains confident in the long-term growth potential of the Food Away From Home industry ü Company positioning has created opportunity for market share gains 12 ‹# ‹# ‹#››› © © © © PFG PFG PFG PFG / CAGNY 2020

Appendix ‹# ‹# ‹#››› 13 © © © PFG PFG PFG / CAGNY 2020Appendix ‹# ‹# ‹#››› 13 © © © PFG PFG PFG / CAGNY 2020

Non-GAAP financial measures Adjusted EBITDA reconciliation Pro Forma As Adjusted Historical Fiscal year Fiscal year ended ended June 30, June 29, June 28, June 27, July 2, July 1, June 30, June 29, June 29, ($ in millions) 2012 2013 2014 2015 2016 2017 2018 2019 2019 Net income (GAAP) $ 21.0 $ 8.4 $ 15.5 $ 56.5 $ 68.3 $ 96.3 $ 198.7 $ 166.8 $ 152.4 Interest expense, net 76.3 93.9 86.1 85.7 83.9 54.9 60.4 65.4 145.8 Income tax (benefit) expense 12.9 11.1 14.7 40.1 46.2 61.4 (5.1) 51.5 19.7 Depreciation and amortization of intangible assets 102.3 120.1 132.7 121.3 118.6 126.1 130.1 155.0 285.4 Amortization of intangible assets 55.9 61.3 59.2 45.0 38.1 34.6 29.8 38.8 - EBITDA (Non-GAAP) 212.5 233.4 249.0 303.6 317.0 338.7 384.1 438.7 603.3 A Non-cash items 3.8 1.8 4.8 2.5 18.2 18.8 23.2 19.8 19.2 B Acquisition, integration and reorganization 13.0 22.9 11.3 0.4 9.4 17.3 5.0 11.8 10.4 C Productivity initiatives and other adjustment items 11.7 13.2 21.0 22.1 22.0 15.9 14.4 5.2 7.4 D Adjusted EBITDA (Non-GAAP) $ 240.9 $ 271.3 $ 286.1 $ 328.6 $ 366.6 $ 390.7 $ 426.7 $ 475.5 $ 640.3 A n Includes adjustments for non-cash charges arising from stock-based compensation, interest rate swap hedge ineffectiveness, changes in the last-in, first-out (“LIFO”) reserves and gain/loss on disposal of assets. Stock-based compensation cost was $15.7 million, $21.6 million, $17.3 million, $17.2 million, $1.2 million, $0.7 million, $1.1 million, and $1.1 million for fiscal 2019, fiscal 2018, fiscal 2017, fiscal 2016, fiscal 2015, fiscal 2014, fiscal 2013, and fiscal 2012, respectively. n Includes professional fees and other costs related to completed and abandoned acquisitions; in fiscal 2015, these fees are net of a $25.0 million termination fee B related to the terminated agreement to acquire 11 US Foods facilities from Sysco and US Foods, costs of integrating certain of our facilities, facility closing costs, advisory fees paid to Blackstone and Wellspring, and offering fees. For fiscal 2013, this also includes $11.2 million for the impact of the initial fair value of inventory that was acquired as part of acquisitions. n C Consists primarily of professional fees and related expenses associated with productivity initiatives, amounts related to fuel collar derivatives, certain financing transactions, lease amendments, legal settlements and franchise tax expense, and other adjustments permitted by our credit agreement. Fiscal 2018 includes $8.0 million of development costs related to certain productivity initiatives the Company is no longer pursuing. D n Includes impact of $(0.6) million of non-cash items, $0.6 million of acquisition, integration and reorganization costs and $2.2 million of productivity initiatives attributable to Reinhart for the twelve-month period ended June 30, 2019. 14 ‹# ‹# ‹#››› © © © © PFG PFG PFG PFG / CAGNY 2020Non-GAAP financial measures Adjusted EBITDA reconciliation Pro Forma As Adjusted Historical Fiscal year Fiscal year ended ended June 30, June 29, June 28, June 27, July 2, July 1, June 30, June 29, June 29, ($ in millions) 2012 2013 2014 2015 2016 2017 2018 2019 2019 Net income (GAAP) $ 21.0 $ 8.4 $ 15.5 $ 56.5 $ 68.3 $ 96.3 $ 198.7 $ 166.8 $ 152.4 Interest expense, net 76.3 93.9 86.1 85.7 83.9 54.9 60.4 65.4 145.8 Income tax (benefit) expense 12.9 11.1 14.7 40.1 46.2 61.4 (5.1) 51.5 19.7 Depreciation and amortization of intangible assets 102.3 120.1 132.7 121.3 118.6 126.1 130.1 155.0 285.4 Amortization of intangible assets 55.9 61.3 59.2 45.0 38.1 34.6 29.8 38.8 - EBITDA (Non-GAAP) 212.5 233.4 249.0 303.6 317.0 338.7 384.1 438.7 603.3 A Non-cash items 3.8 1.8 4.8 2.5 18.2 18.8 23.2 19.8 19.2 B Acquisition, integration and reorganization 13.0 22.9 11.3 0.4 9.4 17.3 5.0 11.8 10.4 C Productivity initiatives and other adjustment items 11.7 13.2 21.0 22.1 22.0 15.9 14.4 5.2 7.4 D Adjusted EBITDA (Non-GAAP) $ 240.9 $ 271.3 $ 286.1 $ 328.6 $ 366.6 $ 390.7 $ 426.7 $ 475.5 $ 640.3 A n Includes adjustments for non-cash charges arising from stock-based compensation, interest rate swap hedge ineffectiveness, changes in the last-in, first-out (“LIFO”) reserves and gain/loss on disposal of assets. Stock-based compensation cost was $15.7 million, $21.6 million, $17.3 million, $17.2 million, $1.2 million, $0.7 million, $1.1 million, and $1.1 million for fiscal 2019, fiscal 2018, fiscal 2017, fiscal 2016, fiscal 2015, fiscal 2014, fiscal 2013, and fiscal 2012, respectively. n Includes professional fees and other costs related to completed and abandoned acquisitions; in fiscal 2015, these fees are net of a $25.0 million termination fee B related to the terminated agreement to acquire 11 US Foods facilities from Sysco and US Foods, costs of integrating certain of our facilities, facility closing costs, advisory fees paid to Blackstone and Wellspring, and offering fees. For fiscal 2013, this also includes $11.2 million for the impact of the initial fair value of inventory that was acquired as part of acquisitions. n C Consists primarily of professional fees and related expenses associated with productivity initiatives, amounts related to fuel collar derivatives, certain financing transactions, lease amendments, legal settlements and franchise tax expense, and other adjustments permitted by our credit agreement. Fiscal 2018 includes $8.0 million of development costs related to certain productivity initiatives the Company is no longer pursuing. D n Includes impact of $(0.6) million of non-cash items, $0.6 million of acquisition, integration and reorganization costs and $2.2 million of productivity initiatives attributable to Reinhart for the twelve-month period ended June 30, 2019. 14 ‹# ‹# ‹#››› © © © © PFG PFG PFG PFG / CAGNY 2020

‹# ‹# ‹#››› 15 © © © PFG PFG PFG / CAGNY 2020‹# ‹# ‹#››› 15 © © © PFG PFG PFG / CAGNY 2020