Attached files
| file | filename |
|---|---|
| EX-2.2 - EXHIBIT 2.2 - Enviva Partners, LP | tm2022882d1_ex2-2.htm |
| EX-99.2 - EXHIBIT 99.2 - Enviva Partners, LP | tm2022882d1_ex99-2.htm |
| EX-99.1 - EXHIBIT 99.1 - Enviva Partners, LP | tm2022882d1_ex99-1.htm |
| EX-10.1 - EXHIBIT 10.1 - Enviva Partners, LP | tm2022882d1_ex10-1.htm |
| EX-2.1 - EXHIBIT 2.1 - Enviva Partners, LP | tm2022882d1_ex2-1.htm |
| 8-K - FORM 8-K - Enviva Partners, LP | tm2022882d1_8k.htm |
Exhibit 99.3

Enviva Partners, LP Investor Presentation June 2020 (NYSE: EVA)
2 FORWARD - LOOKING AND CAUTIONARY STATEMENTS Forward - looking statements This presentation contains “forward - looking statements” within the meaning of the securities laws . All statements, other than statements of historical fact, included in this presentation that address activities, events or developments that Enviva Partners, LP (NYSE : EVA) (“ Enviva ,” the “Partnership,” “we,” or “us”) expects, believes or anticipates will or may occur in the future are forward - looking statements . The words “believe,” “expect,” “may,” “estimates,” “will,” “anticipate,” “plan,” “intend,” “foresee,” “should,” “would,” “could,” or other similar expressions are intended to identify forward - looking statements, which are generally not historical in nature . However, the absence of these words does not mean that the statements are not forward - looking . These statements are based on certain assumptions made by Enviva based on management’s expectations and perception of historical trends, current conditions, anticipated future developments, and other factors believed to be appropriate . Although Enviva believes that these assumptions were reasonable when made, because assumptions are inherently subject to significant uncertainties and contingencies that are difficult or impossible to predict and are beyond its control, Enviva cannot give assurance that it will achieve or accomplish these expectations, beliefs or intentions . A number of the assumptions on which these forward - looking statements are based are subject to risks and uncertainties, many of which are beyond the control of Enviva , and may cause actual results to differ materially from those implied or expressed by the forward - looking statements . These risks and uncertainties include the factors discussed or referenced in our filings with the Securities and Exchange Commission (the “SEC”), including the Annual Report on Form 10 - K and the Quarterly Report on Form 10 - Q most recently filed with the SEC, including those risks relating to financial performance and results, economic conditions and resulting capital restraints, availability of sufficient capital to execute Enviva’s business plan, the ability of Enviva to complete acquisitions and realize the anticipated benefits of such acquisitions, impact of compliance with legislation and regulations, the continued impact of COVID - 19 , and other important factors that could cause actual results to differ materially from those projected . When considering the forward - looking statements, you should keep in mind the risk factors and other cautionary statements in such filings . You are cautioned not to place undue reliance on forward - looking statements, which speak only as of the date on which such statement is made, and Enviva undertakes no obligation to correct or update any forward - looking statement, whether as a result of new information, future events or otherwise, except as required by applicable law . All forward - looking statements attributable to Enviva are qualified in their entirety by this cautionary statement . Risk factors related to the acquisitions References to the “Greenwood Acquisition” refer to our acquisition of 100 % of the limited liability company interests in Enviva Pellets Greenwood Holdings II, LLC, which owns a wood pellet production plant in Greenwood, South Carolina, from Enviva Development Holdings (“ DevCo ”) pursuant to a contribution agreement that is expected to be executed on June 18 , 2020 (the “Greenwood Contribution Agreement”) . References to the “Waycross Acquisition” refer to the acquisition of Georgia Biomass Holding LLC (“Georgia Biomass”), which owns a wood pellet production plant in Waycross, Georgia (the “Waycross plant”), from Innogy SE and Innogy Renewables Beteilingungs GMBH pursuant to a Membership Interest Purchase Agreement that is expected to be executed on June 18 , 2020 (the “GB MIPSA”) . References to the “Acquisitions” refer to the Greenwood Acquisition and Waycross Acquisition, collectively . Our completion of these acquisitions and integration and expansion activities as described in this slide deck are subject to various risks, including : we may not consummate the Greenwood Acquisition or the Waycross Acquisition, and the sale of common units in this transaction is not conditioned on the consummation of the Acquisitions ; failure to complete the Acquisitions on a timely basis could negatively impact our future business and financial results ; there is no assurance that the Greenwood plant will be able to expand its production capacity to 600 , 000 metric tons per year or operate consistently at that level in the future ; if the Acquisitions are consummated, we may be unable to realize the anticipated cost savings, revenues or other benefits ; if the Waycross Acquisition is consummated, we may be unable to successfully integrate the assets’ operations ; we will incur significant transaction and acquisition - related costs in connection with the Acquisitions . Industry and market data This presentation has been prepared by Enviva and includes market data and other statistical information from third - party sources, including independent industry publications, government publications or other published independent sources . Although Enviva believes these third - party sources are reliable as of their respective dates, Enviva has not independently verified the accuracy or completeness of this information . Some data is also based on Enviva’s good faith estimates, which are derived from its review of internal sources as well as the third - party sources described above . Not an offer This presentation does not constitute an offer to sell or a solicitation to buy securities of Enviva Partners, LP .


3 3+ million MTPY Sponsor development pipeline Visible Drop - Down Inventory Fully Contracted ENVIVA: HIGH GROWTH AND DURABLE LONG - TERM CASH FLOWS 1 ) The Partnership’s expected production capacity after the Acquisitions, including nameplate capacity of approximately 800 , 000 metric tons per year (“MTPY”) for the Waycross plant, approximately 600 , 000 MTPY for the Greenwood plant once fully operational and after completion of expansion projects, approximately 600 , 000 MTPY at the Hamlet plant and increased production capacity pursuant to ongoing expansion projects at the Northampton and Southampton plants . We expect the Hamlet plant to reach its nameplate production capacity of approximately 600 , 000 MTPY by the end of 2020 and the Greenwood plant to reach its nameplate production capacity of approximately 600 , 000 MTPY by the end of 2021 ; 2 ) As of April 1 , 2020 and pro forma for the Acquisitions, excluding volumes under the contracts between long - term off - take customers and Enviva Holdings, LP (our “Sponsor”) and Enviva JV Development Company, LLC (the “Sponsor JV”) ; 3 ) The Partnership targets a 50 / 50 equity/debt capital structure for drop - downs, acquisitions, and major expansions, a total ratio of net debt to adjusted EBITDA (the “Leverage Ratio”) of 3 . 5 - 4 times, and a distribution coverage ratio of 1 . 20 times, on a forward - looking annual basis . The Partnership’s Leverage Ratio is calculated pursuant to the Partnership’s credit agreement and may reflect the pro forma impact of drop - downs, acquisitions, and major expansions ; 4 ) The Acquisitions support the increase of distributions to at least $ 3 . 00 per unit in 2020 , subject to board approval ; 5 ) 2015 - 2020 E Compound Average Growth Rate (“CAGR”) utilizes $ 1 . 65 minimum quarterly distribution per unit for 2015 and $ 3 . 00 distribution per unit for 2020 E . Per unit distributions for full - year 2020 are subject to board approval . The annualized total return for the Partnership’s common units since the Partnership’s IPO is per Bloomberg data, as of June 12 , 2020 ; 6 ) As of April 1 , 2020 and pro forma for the Acquisitions, includes all volumes under the firm and contingent off - take contracts held by the Partnership, the Sponsor, and the Sponsor JV . Although the Partnership expects to have the opportunity to acquire these contracts from our Sponsor and the Sponsor JV, there can be no guarantee that the Partnership will acquire all or any of such contracts $15.5 billion revenue backlog / 12.7 year weighted - average remaining contract term 2 ~5.4 Million MTPY World’s largest utility - grade wood pellet producer $19.6 Billion / 13.6 Years Backlog held by the Partnership, our Sponsor and Sponsor JV 6 Distribution per Unit of $3.00+ 13% compound annual growth rate 5 and 21% annualized total return 5 since IPO Conservative Financial Policy 50/50 equity/debt structure, 3.5x – 4.0x leverage ratio 1.20x forward - looking annual distribution coverage 3 4 1
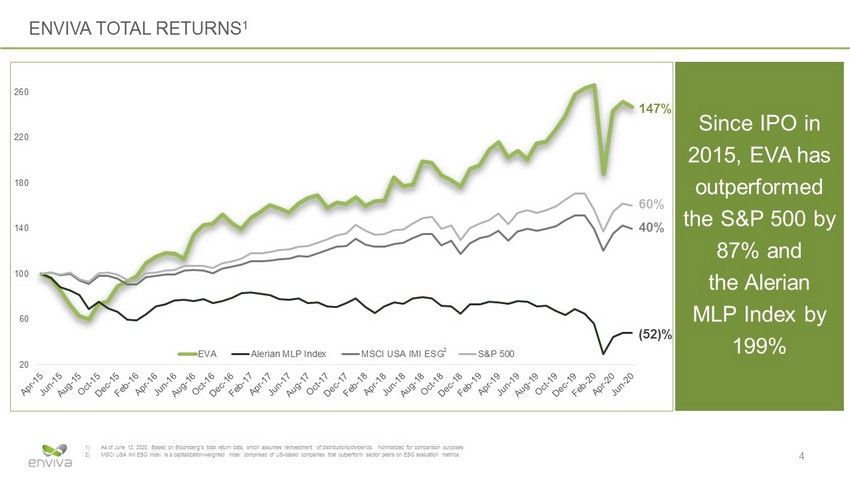
4 ENVIVA TOTAL RETURNS 1 1) As of June 12 , 2020 . Based on Bloomberg’s total return data, which assumes reinvestment of distributions/dividends . Normalized for comparison purposes 2) MSCI USA IMI ESG Index is a capitalization - weighted index comprised of US - based companies that outperform sector peers on ESG evaluation metrics Since IPO in 2015, EVA has outperformed the S&P 500 by 87% and the Alerian MLP Index by 199% 20 60 100 140 180 220 260 EVA Alerian MLP Index MSCI USA IMI ESG S&P 500 147% 60% 40% (52)% 2

Executive Summary Night Shift at Enviva Pellets Northampton
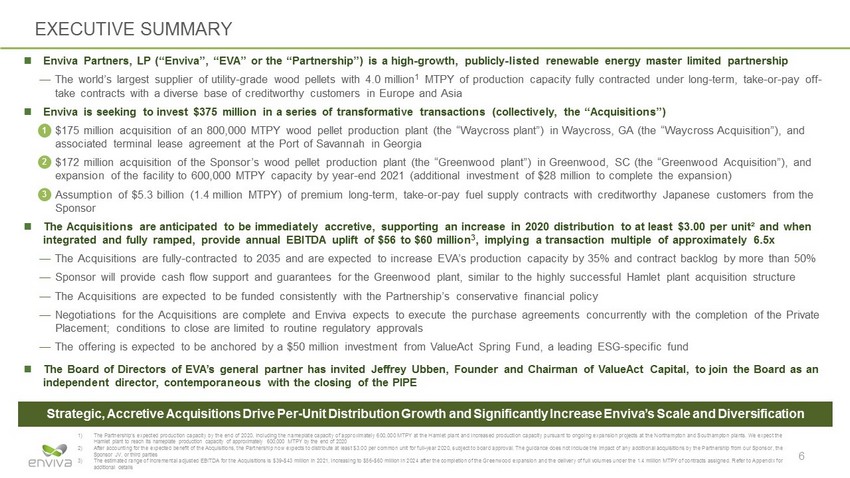
6 EXECUTIVE SUMMARY Enviva Partners, LP (“Enviva”, “EVA” or the “Partnership”) is a high - growth, publicly - listed renewable energy master limited partnersh ip — The world’s largest supplier of utility - grade wood pellets with 4.0 million 1 MTPY of production capacity fully contracted under long - term, take - or - pay off - take contracts with a diverse base of creditworthy customers in Europe and Asia Enviva is seeking to invest $375 million in a series of transformative transactions (collectively, the “Acquisitions”) — $175 million acquisition of an 800,000 MTPY wood pellet production plant (the “Waycross plant”) in Waycross, GA (the “Waycros s A cquisition”), and associated terminal lease agreement at the Port of Savannah in Georgia — $172 million acquisition of the Sponsor’s wood pellet production plant (the “Greenwood plant”) in Greenwood, SC (the “Greenwo od Acquisition”), and expansion of the facility to 600,000 MTPY capacity by year - end 2021 (additional investment of $28 million to complete the expans ion) — Assumption of $5.3 billion (1.4 million MTPY) of premium long - term, take - or - pay fuel supply contracts with creditworthy Japanese customers from the Sponsor The Acquisitions are anticipated to be immediately accretive, supporting an increase in 2020 distribution to at least $3.00 p er unit² and when integrated and fully ramped, provide annual EBITDA uplift of $56 to $60 million 3 , implying a transaction multiple of approximately 6.5x — The Acquisitions are fully - contracted to 2035 and are expected to increase EVA’s production capacity by 35% and contract backlog by more than 50% — Sponsor will provide cash flow support and guarantees for the Greenwood plant, similar to the highly successful Hamlet plant acq uisition structure — The Acquisitions are expected to be funded consistently with the Partnership’s conservative financial policy — Negotiations for the Acquisitions are complete and Enviva expects to execute the purchase agreements concurrently with the co mpl etion of the Private Placement; conditions to close are limited to routine regulatory approvals — The offering is expected to be anchored by a $50 million investment from ValueAct Spring Fund, a leading ESG - specific fund The Board of Directors of EVA’s general partner has invited Jeffrey Ubben , Founder and Chairman of ValueAct Capital, to join the Board as an independent director, contemporaneous with the closing of the PIPE Strategic, Accretive Acquisitions Drive Per - Unit Distribution Growth and Significantly Increase Enviva’s Scale and Diversificati on 1) The Partnership’s expected production capacity by the end of 2020 , including the nameplate capacity of approximately 600 , 000 MTPY at the Hamlet plant and increased production capacity pursuant to ongoing expansion projects at the Northampton and Southampton plants . We expect the Hamlet plant to reach its nameplate production capacity of approximately 600 , 000 MTPY by the end of 2020 2) After accounting for the expected benefit of the Acquisitions, the Partnership now expects to distribute at least $ 3 . 00 per common unit for full - year 2020 , subject to board approval . The guidance does not include the impact of any additional acquisitions by the Partnership from our Sponsor, the Sponsor JV, or third parties 3) The estimated range of incremental adjusted EBITDA for the Acquisitions is $ 39 - $ 43 million in 2021 , increasing to $ 56 - $ 60 million in 2024 after the completion of the Greenwood expansion and the delivery of full volumes under the 1 . 4 million MTPY of contracts assigned . Refer to Appendix for additional details 1 2 3

7 EXECUTIVE SUMMARY (CONT’D) EVA at IPO EVA Today EVA Post - Acquisitions Adjusted EBITDA $ 77 mm¹ $ 165 - $ 175 mm 4 $ 185 - $ 195 mm 6 At run rate, adds $ 56 - $ 60 million contribution 7 Distribution per Unit $ 1.65 2 $ 2.87 - $ 2.97 4 $ 3.00 + 6 13% over 2019 and 13% CAGR since IPO 8 # Plants and Production Capacity 4 Plants 1.7 mm MTPY 7 Plants 4.0 mm MTPY 9 Plants 5.4 mm MTPY + 35 % capacity increase # of Terminals and Throughput Capacity 2 Terminals 2.7 mm MTPY 4 Terminals 6.4 mm MTPY 5 Terminals 7.9 mm MTPY Potential for a new cluster Weighted - Average Remaining Contract Life 5.7 years 3 11.4 years 5 12.7 years 9 Additional long - term agreements maturing between 2031 and 2041 Contracted Revenue Backlog $ 1.9 billion 3 $ 10.2 billion 5 $ 15.5 billion 9 1 ) Reflects full - year 2015 results ; 2 ) Represents the annualized minimum quarterly distribution per unit per EVA’s partnership agreement ; 3 ) Weighted average remaining contract life is as of January 1 , 2015 and revenue backlog is as of December 31 , 2014 ; 4 ) As of April 29 , 2020 , the Partnership expected full - year 2020 net income to be in the range of $ 52 . 2 million to $ 62 . 2 million, adjusted EBITDA to be in the range of $ 165 . 0 million to $ 175 . 0 million, and expected to distribute between $ 2 . 87 and $ 2 . 97 per common unit for full - year 2020 . The guidance did not include the impact of any acquisitions by the Partnership from our Sponsor, the Sponsor JV, or third parties ; 5 ) As of April 1 , 2020 , excluding volumes under the contracts between long - term off - take customers and our Sponsor and the Sponsor JV ; 6 ) After accounting for the expected benefit of the Acquisitions, the Partnership now expects full - year 2020 net income to be in the range of $ 33 . 9 million to $ 43 . 9 million, adjusted EBITDA to be in the range of $ 185 . 0 million to $ 195 . 0 million, and expects to distribute at least $ 3 . 00 per common unit for full - year 2020 , subject to board approval . The guidance does not include the impact of any additional acquisitions by the Partnership from our Sponsor, the Sponsor JV, or third parties . Refer to Appendix for additional details ; 7 ) The estimated range of incremental adjusted EBITDA for the Acquisitions is $ 56 - $ 60 million in 2024 after the completion of the Greenwood expansion and the delivery of full volumes under the 1 . 4 million MTPY of contracts assigned . Refer to Appendix for additional details ; 8 ) 2015 - 2020 E CAGR utilizes $ 1 . 65 minimum quarterly distribution per unit for 2015 and $ 3 . 00 distribution per unit for 2020 E . Per unit distributions for full - year 2020 are subject to board approval, 9 ) As of April 1 , 2020 and pro forma for the Acquisitions, excluding volumes under the contracts between long - term off - take customers, the Sponsor, and the Sponsor JV
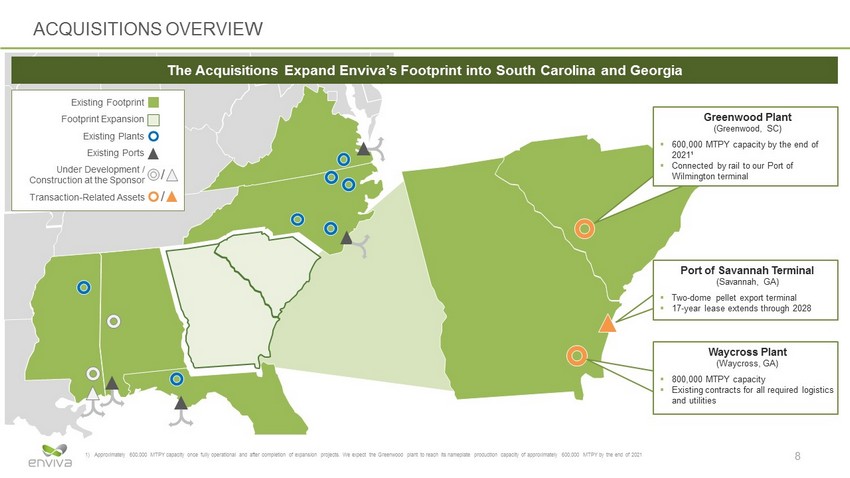
ACQUISITIONS OVERVIEW 8 Existing Plants Existing Ports Transaction - Related Assets Footprint Expansion Existing Footprint Under Development / Construction at the Sponsor / / Waycross Plant (Waycross, GA) ▪ 800,000 MTPY capacity ▪ Existing contracts for all required logistics and utilities Greenwood Plant (Greenwood, SC) ▪ 600,000 MTPY capacity by the end of 2021¹ ▪ Connected by rail to our Port of Wilmington terminal Port of Savannah Terminal (Savannah, GA) ▪ Two - dome pellet export terminal ▪ 17 - year lease extends through 2028 The Acquisitions Expand Enviva’s Footprint into South Carolina and Georgia 1 ) Approximately 600 , 000 MTPY capacity once fully operational and after completion of expansion projects . We expect the Greenwood plant to reach its nameplate production capacity of approximately 600 , 000 MTPY by the end of 2021

9 POST - ACQUISITIONS IMPACT Expected to Generate $56 - $60 million of Run - Rate Adj. EBITDA² and Increase in 2020 Distribution per Unit to $3.00+³ 4.0 MTPY 5.4 MTPY Current Pro Forma ~35% Increase in Production Capacity $10.3bn $15.5bn Current Pro Forma ~50% Increase in Fully - Contracted Backlog Increases Weighted Average Contract Life 11.4 yrs 12.7 yrs Current Pro Forma $375 Million Increase in Enterprise Value¹ $1.9bn $2.2bn Current Pro Forma 1) Enterprise Value is calculated as Market Value of Equity as of June 12, 2020, plus Net Debt and Non - controlling Interest as disc losed in Q1 2020 10 - Q filing. Excludes any value of GP stake / IDRs. Pro forma increase of $375 million increase includes $28mm of expansion capital expenditures to expand the Greenwood plant 2) The estimated range of incremental adjusted EBITDA for the Acquisitions is $39 - $43 million in 2021, increasing to $56 - $60 millio n in 2024 after the completion of the Greenwood expansions and the delivery of full volumes under the 1.4 million MTPY of con tra cts assigned. Refer to Appendix for additional details 3) Distribution per unit subject to board approval

10 INCREASINGLY DIVERSE CUSTOMER BASE FURTHER ENHANCES STABILITY 1) Represents the Partnership’s sales in 2019 2) Represents the Partnership’s pro forma contract mix including the Acquisitions 3) Includes all volumes held by the Partnership, the Sponsor, and the Sponsor JV EVA 2019 Off - Take Contract Mix 1 ~ 3.6 million MTPY Enterprise 2025 Off - Take Contract Mix 3 Balanced Portfolio Between Europe and Japan by 2025 Growing Diversification: Volumes from Largest Customer Reduced to ~15% by 2025 ~ 6 .4 million MTPY EVA 2024 Off - Take Contract Mix 2 Ichihara/ Equis aa aa Drax Engie Lynemouth Orsted Other aa ~ 6.7 million MTPY 3 Drax Lynemouth MGT Engie Orsted Other Creditworthy Japanese Customers Toyota Tsusho Sumitomo Mitsubishi Marubeni Suzukawa Sumitomo Forestry MGT Ichihara Other Sumitomo Suzukawa Mitsubishi Drax Lynemouth Orsted Sumitomo Forestry Marubeni RWEST Ichihara Toyota Tsusho

11 THREE PILLARS OF GROWTH ▪ Pricing increases and escalators under existing contracted position ▪ 400,000 MTPY aggregate production capacity expansion underway at Northampton and Southampton ▪ ~$130 million expected investment and ~$28 - $32 million in expected incremental adjusted EBITDA annually 1 ▪ Evaluating expansion opportunities at our other production plants ▪ Plan to expand Greenwood to 600,000 MTPY by the end of 2021 2 ▪ Anticipated annual organic growth driven by contract price escalations, cost reductions and productivity improvements 1 ) The estimated incremental adjusted EBITDA that can be expected from the expansions is based on an internal financial analysis of the anticipated benefit from the incremental production capacity at the Northampton and Southampton production plants ; 2 ) Assumes the completion of the Greenwood Acquisition ; 3 ) The Sponsor and the Sponsor JV are progressing development of wood pellet production plants and marine terminals, including constructing the Pascagoula terminal and the Lucedale plant, developing the Epes plant, and evaluating additional sites . Although we expect to have the opportunity to acquire assets or completed development projects and associated contracts from our Sponsor or the Sponsor JV in the future, we cannot assure you that our Sponsor or the Sponsor JV will be successful in completing their development projects or that we will successfully negotiate an agreement with our Sponsor or the Sponsor JV to acquire such assets, projects, or associated contracts ; 4 ) Assumes the completion of the Waycross Acquisitions ▪ Five drop - downs 2 since IPO, including 2.3 million MTPY of production capacity and 3.0 million MTPY of terminaling capacity ▪ 3+ million MTPY development pipeline at our Sponsor, including: ▪ The Pascagoula terminal 3 ▪ The Lucedale plant 3 ▪ The Epes plant 3 ▪ Additional sites for pellet production plants in Alabama and Mississippi, which would export wood pellets through Pascagoula terminal ▪ Locations near the Partnership’s existing terminals in the Port of Chesapeake, the Port of Wilmington, and the leased terminal at the Port of Savannah 4 ▪ Proven, successful and selective acquirer ▪ Acquisitions must compare favorably to Sponsor development pipeline and drop - down economics ▪ Target opportunities must be core to the business and bring new customer set, strategic capability and / or geographic diversification Organic Growth within the Partnership Accretive Drop - Downs from Sponsor Third - Party Acquisition Opportunities

12 Targeting annual organic growth in underlying base business in addition to drop - down acquisitions and plant expansions PROSPECTIVE GROWTH UNDERPINNED BY EXECUTED CONTRACTS AND POTENTIAL DROP - DOWNS 1 ) This chart is for illustrative purposes and consists of estimates based on numerous assumptions made by us that are inherently uncertain and are subject to significant risks and uncertainties, which are difficult to predict and many of which are beyond our control . There can be no assurance that any of the estimates may prove to be correct . Actual results may differ materially ; 2 ) As reported on February 26 , 2020 ; 3 ) As of April 29 , 2020 , the Partnership expected full - year 2020 net income to be in the range of $ 52 . 2 million to $ 62 . 2 million, and adjusted EBITDA to be in the range of $ 165 . 0 million to $ 175 . 0 million . The guidance did not include the impact of any acquisitions by the Partnership from our Sponsor, the Sponsor JV, or third parties ; 4 ) For an explanation of why we are unable to reconcile the estimated adjusted EBITDA for the Southampton / Northampton expansions to the most directly comparable GAAP financial measures, see Appendix ; 5 ) The estimated range of incremental adjusted EBITDA for the Acquisitions is $ 56 - $ 60 million in 2024 after the completion of the Greenwood expansion and the delivery of full volumes under the 1 . 4 million MTPY of contracts assigned . Refer to Appendix for additional details ; 6 ) The estimated incremental adjusted EBITDA from a drop - down of a wood pellet production plant or a marine terminal represents the run - rate adjusted EBITDA that can be expected from such a facility, based on estimated production or terminaling capacity of such a facility upon achieving full run - rate and our Sponsor or the Sponsor JV’s existing contracts that may be associated with such a facility . The sequence of the drop - down transactions is for illustrative purposes only and subject to change . Although we expect to have the opportunity to acquire assets or completed development projects, including the Lucedale plant, the Epes plant, and the Pascagoula terminal, from our Sponsor or the Sponsor JV in the future, we cannot assure you that our Sponsor or the Sponsor JV will be successful in completing their development projects or that we will successfully negotiate an agreement with our Sponsor or the Sponsor JV to acquire such assets or projects Illustrative Adjusted EBITDA Growth 1 $60 $80 $100 $120 $140 $160 $180 $200 $220 $240 $260 $280 $300 $320 $340 $360 $380 $400 $420 1st bar 2nd bar 3rd bar 4th bar 5th bar 6th bar 7th bar 8th bar ~$10 - $15+ $141.3 2 Lucedale Plant 6 ~$56 - $60 ~$30 - $35 Southampton / Northampton Expansions 4 ~$28 - $32 Potential to More Than Double 2019 Fully - Contracted Adjusted EBITDA Sponsor contracts underwrite several additional production plants Pascagoula Terminal 6 Pascagoula Cluster Plant 3 6 ~$25 - $35 Fully - contracted production facility and terminal under construction / expansion Prior 2020 Guidance 2019 Epes Plant 6 ~$25 - $35 Run - Rate EBITDA Contribution from the Acquisitions 5 ~$165 - $175 3
Additional Information Enviva’s Port of Chesapeake Marine terminal
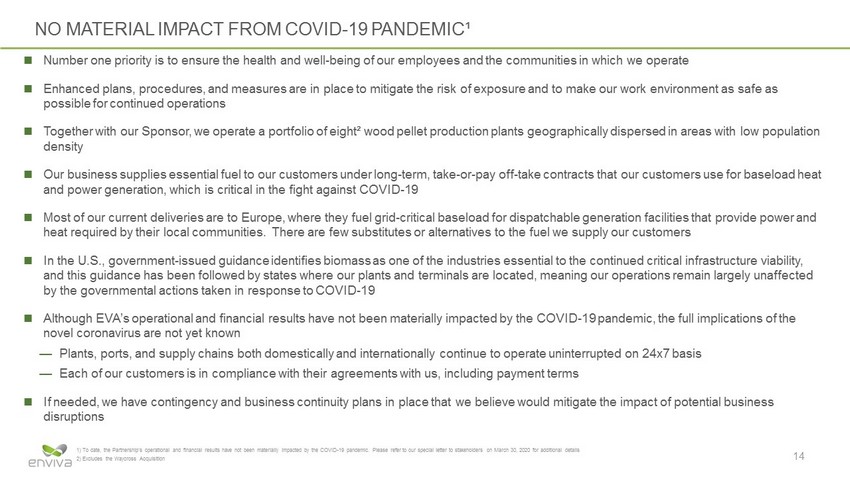
14 NO MATERIAL IMPACT FROM COVID - 19 PANDEMIC¹ Number one priority is to ensure the health and well - being of our employees and the communities in which we operate Enhanced plans, procedures, and measures are in place to mitigate the risk of exposure and to make our work environment as sa fe as possible for continued operations Together with our Sponsor, we operate a portfolio of eight² wood pellet production plants geographically dispersed in areas w ith low population density Our business supplies essential fuel to our customers under long - term, take - or - pay off - take contracts that our customers use for baseload heat and power generation, which is critical in the fight against COVID - 19 Most of our current deliveries are to Europe, where they fuel grid - critical baseload for dispatchable generation facilities that provide power and heat required by their local communities. There are few substitutes or alternatives to the fuel we supply our customers In the U.S., government - issued guidance identifies biomass as one of the industries essential to the continued critical infrastr ucture viability, and this guidance has been followed by states where our plants and terminals are located, meaning our operations remain large ly unaffected by the governmental actions taken in response to COVID - 19 Although EVA’s operational and financial results have not been materially impacted by the COVID - 19 pandemic, the full implicatio ns of the novel coronavirus are not yet known — Plants, ports, and supply chains both domestically and internationally continue to operate uninterrupted on 24x7 basis — Each of our customers is in compliance with their agreements with us, including payment terms If needed, we have contingency and business continuity plans in place that we believe would mitigate the impact of potential bus iness disruptions 1 ) To date, the Partnership’s operational and financial results have not been materially impacted by the COVID - 19 pandemic . Please refer to our special letter to stakeholders on March 30 , 2020 for additional details 2 ) Excludes the Waycross Acquisition

Location & Layout Georgia Biomass Overview GEORGIA BIOMASS PLANT 15 Georgia Biomass is a wholly - owned subsidiary of Innogy — Waycross Plant: Located in Waycross, GA; produced more than 800,000 metric tons (“MT”) of pellets in 2019; existing contracts in place for all required logistics and utilities — Port of Savannah Terminal: 50,000 MT of storage capacity; 17 - year lease extends through 2028 First shipments began in Q2 2011 (initial capacity estimated at 750,000 MTPY) 80+ employees Georgia Biomass leases a two - dome pellet export terminal in Savannah, GA, with total storage capacity of 50,000 MT, similar to EVA’s existing terminal assets in Chesapeake and Wilmington The Waycross plant’s 800,000 MTPY production capacity is fully contracted with creditworthy customers — ~500,000 MTPY contract with an existing EVA customer extends through 2024 — Customers from contracts assigned by the Sponsor include Sumitomo Corporation and Sumitomo Forestry Corporation Port of Savannah Terminal Waycross Plant Savannah Terminal Waycross Plant

Location & Layout Greenwood Plant Overview GREENWOOD PLANT 16 Located in Greenwood, SC Initially constructed in 2016/2017 by the Navigator Company Acquired in 2018 by the Sponsor, who re - permitted and reconstructed critical aspects of the plant. Currently expected to expand to 600,000 MTPY by the end of 2021, subject to receiving the necessary permits 89 employees With contracts assigned from our Sponsor, the Greenwood plant’s production capacity is fully contracted to creditworthy customers including Sumitomo Corporation, Mitsubishi Corporation, and Suzakawa Energy Center, Ltd Rail service agreement and railcar lease, both through September 2026 (original terms of 10+ years) Long - term terminal services agreement with Enviva Port of Wilmington Post drop - down, the Sponsor will support the capital expansion budget of $28 million¹ and provide cash flow support through 2021 in addition to contingent support thereafter should production fails to meet expected run - rate levels Port of Wilmington Greenwood 1 ) $ 28 million of capital expenditures expected to be spent by year - end 2021 to increase the Greenwood plant’s production capacity to 600 , 000 metric tons per year
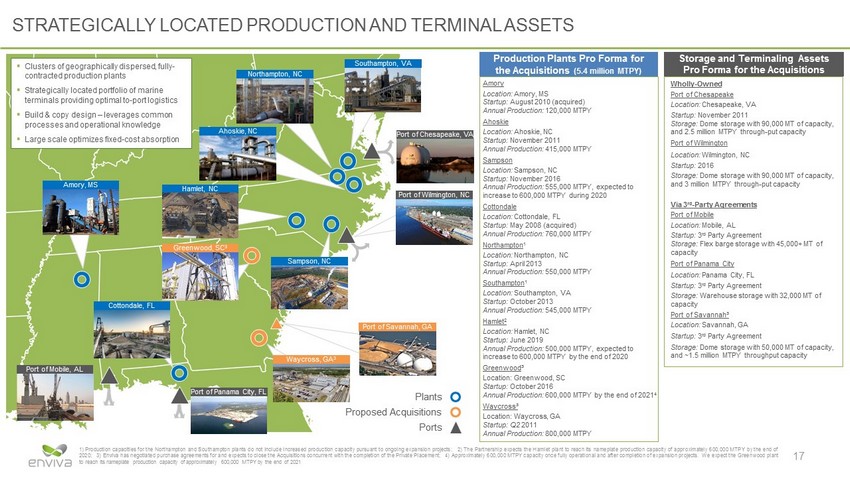
17 STRATEGICALLY LOCATED PRODUCTION AND TERMINAL ASSETS Plants Port of Mobile, AL Port of Chesapeake, VA Port of Panama City, FL Ports Ahoskie, NC Northampton, NC Southampton, VA Sampson, NC 1 ) Production capacities for the Northampton and Southampton plants do not include increased production capacity pursuant to ongoing expansion projects ; 2 ) The Partnership expects the Hamlet plant to reach its nameplate production capacity of approximately 600 , 000 MTPY by the end of 2020 ; 3 ) Enviva has negotiated purchase agreements for and expects to close the Acquisitions concurrent with the completion of the Private Placement ; 4 ) Approximately 600 , 000 MTPY capacity once fully operational and after completion of expansion projects . We expect the Greenwood plant to reach its nameplate production capacity of approximately 600 , 000 MTPY by the end of 2021 Amory, MS Cottondale, FL Hamlet, NC Amory Location: Amory, MS Startup: August 2010 (acquired) Annual Production: 120,000 MTPY Ahoskie Location: Ahoskie, NC Startup: November 2011 Annual Production: 415,000 MTPY Sampson Location: Sampson, NC Startup: November 2016 Annual Production: 555,000 MTPY, expected to increase to 600,000 MTPY during 2020 Cottondale Location: Cottondale, FL Startup: May 2008 (acquired) Annual Production: 760,000 MTPY Northampton 1 Location: Northampton, NC Startup: April 2013 Annual Production: 550,000 MTPY Southampton 1 Location: Southampton, VA Startup: October 2013 Annual Production: 545,000 MTPY Hamlet 2 Location: Hamlet, NC Startup: June 2019 Annual Production: 500,000 MTPY, expected to increase to 600,000 MTPY by the end of 2020 Greenwood ³ Location: Greenwood, SC Startup: October 2016 Annual Production: 600,000 MTPY by the end of 2021 4 Waycross³ Location: Waycross, GA Startup: Q2 2011 Annual Production: 800,000 MTPY Production Plants Pro Forma for the Acquisitions (5.4 million MTPY) Wholly - Owned Port of Chesapeake Location: Chesapeake, VA Startup: November 2011 Storage: Dome storage with 90,000 MT of capacity, and 2.5 million MTPY through - put capacity Port of Wilmington Location: Wilmington, NC Startup: 2016 Storage: Dome storage with 90,000 MT of capacity, and 3 million MTPY through - put capacity Via 3 rd - Party Agreements Port of Mobile Location: Mobile, AL Startup: 3 rd Party Agreement Storage: Flex barge storage with 45,000+ MT of capacity Port of Panama City Location: Panama City, FL Startup: 3 rd Party Agreement Storage: Warehouse storage with 32,000 MT of capacity Port of Savannah³ Location: Savannah, GA Startup: 3 rd Party Agreement Storage: Dome storage with 50,000 MT of capacity, and ~1.5 million MTPY throughput capacity Storage and Terminaling Assets Pro Forma for the Acquisitions ▪ Clusters of geographically dispersed, fully - contracted production plants ▪ Strategically located portfolio of marine terminals providing optimal to - port logistics ▪ Build & copy design – leverages common processes and operational knowledge ▪ Large scale optimizes fixed - cost absorption Proposed Acquisitions Greenwood, SC 3 Port of Wilmington, NC Port of Savannah, GA Waycross, GA 3

18 ▪ A “build and copy” approach allows for highly efficient, large - scale production facilities and creates operating leverage ▪ Multi - plant profile and global scale translate into superior reliability and opportunities for optimization ▪ Access to robust fiber baskets allows for reliable raw material supply and a flat marginal cost curve for incremental production UNMATCHED GLOBAL SCALE PROVIDES DURABLE COMPETITIVE ADVANTAGES Enviva is the world’s supplier of utility - grade wood pellets in a highly fragmented industry with numerous small, single - plant operators GLOBAL ENTERPRISE SUPPLIERS VERTICALLY - INTEGRATED SUPPLIERS SMALL & REGIONAL SUPPLIERS 12 9 3 1 1 3 1 3 Enviva U.S. Baltics / U.S. Canada / U.S. U.S. U.S. Vietnam U.S. U.S. Brazil Production Capacity 1 (Thousand MTPY) Location # of Plants 1 1 Canada Graanul Invest Pinnacle Renewable Energy Drax Biomass Georgia Biomass An Viet Phat FRAM Renewable Fuels Highland Pellets Pacific Bioenergy Tanac SA As the world’s largest supplier of industrial wood pellets, Enviva is frequently the sole - source supplier for our customers 11 1) Enviva’s total production capacity and number of plants are based on nameplate capacities of our existing operating plants, p lan ned capacity expansions at our Southampton and Northampton plants, the estimated capacity of the Greenwood plant, the Lucedal e p lant, and the Epes plant and the acquisition of the Waycross plant. We expect to have the opportunity to acquire assets or completed development projects fr om our Sponsor or the Sponsor JV in the future. Production capacity and number of plants for other pellet producers are base d o n Hawkins Wright: The Outlook for Wood Pellets – Demand, Supply, Costs and Prices; 1st Quarter 2020 0 500 1,000 1,500 2,000 2,500 3,000 3,500 4,000 4,500 5,000 5,500 6,000 6,500 Current Capacity Greenwood Plant Waycross plant Under Development / Construction or Financed for Completion b y 2 021 `

19 BIOMASS IS INCREASINGLY INTEGRAL TO EUROPEAN CLIMATE STRATEGY UN and various NGOs continue to emphasize role of biomass and bioenergy in climate change efforts … … and many countries with existing and potential customers have announced concrete coal phase - out and GHG emissions reduction plans UN IPCC : recently reiterated long - standing view that biomass must play a key role under every single pathway to achieve the goal of limiting climate change to 1 . 5 - degrees ƒ C . “In the long term, a sustainable forest management strategy aimed at maintaining or increasing forest carbon stocks, while producing an annual sustained yield of timber, fiber, or energy from the forest, will generate the largest sustained mitigation benefit . ” IRENA : reiterated IPCC’s view on the critical role of biomass, but also called for a tripling of the amount of modern biomass used for energy production from 5 percent today to 16 percent by 2050 , as it laid out its own proposed global pathway to a carbon - neutral and renewable future by 2050 United Nations Climate Action Summit 2019 : 65 countries and major sub - national economies committed to cut greenhouse gas (“GHG”) emissions to “net - zero” by 2050 Renewable Energy Directive II (“RED II”) : dictates that, by 2030 , the share of energy from renewable sources must account for at least 32 percent of the European Union’s (“EU”) gross consumption . Furthermore, the European Commission is required to re - evaluate and potentially increase the 32 percent target by 2023 European Commission : presented European Green Deal and proposed European Climate Law that calls for a legally binding target of net zero GHG emissions by 2050 and addresses the pathway to achieve this target . Recently formed European alliance for a Green Recovery calls for the acceleration of the transition towards climate neutrality and healthy ecosystems as Europe prepares to rebuild its economy after COVID - 19 Netherlands Environmental Assessment Agency (“PBL”) : concluded that without biomass as an essential fuel/feedstock, a climate neutral circular economy is theoretically impossible, and that that due to its climate targets, the Netherlands will need a disproportionally higher share of biomass available internationally for energy . Wood products store carbon for their lifecycle Innovation unlocks potential new uses of wood Biomass substitutes for fossil fuels C CARBON Wood substitutes for non - renewable and energy intensive materials ATMOSPHERE Source of image: EUSTAFOR: “European State Forecasts Boost the Bioeconomy ” “The European Commission adopted a proposal for a European “climate law” to make the bloc’s 2050 net zero emissions target legally binding, a top official said… The regulation, which requires approval from parliament and member states, would commit the EU to reduce its net greenhouse gas emissions to zero by 2050.” Reuters, 4 March 2020 “At the initiative of European Parliament’s Environment Committee Chairman Pascal Canfin , 180 political decision - makers, business leaders, trade unions, NGOs, and think tanks have come together to form a European alliance for a Green Recovery on April 14. This represents the first pan - European call for mobilisation on post - crisis green investment packages that will work to build the recovery and transformation plans, and will enshrine the fight against clime change as a key pillar of the economic strategy.” NewEurope , 16 April 2020 “There is agreement on the conclusion (in the PBL report) that climate policy without the use of biomass is hardly possible o r affordable…due to its climate plans, the Netherlands will need at least 0.6 to 6.5 percent of the available biomass in 2050” NRC, 7 May 2020
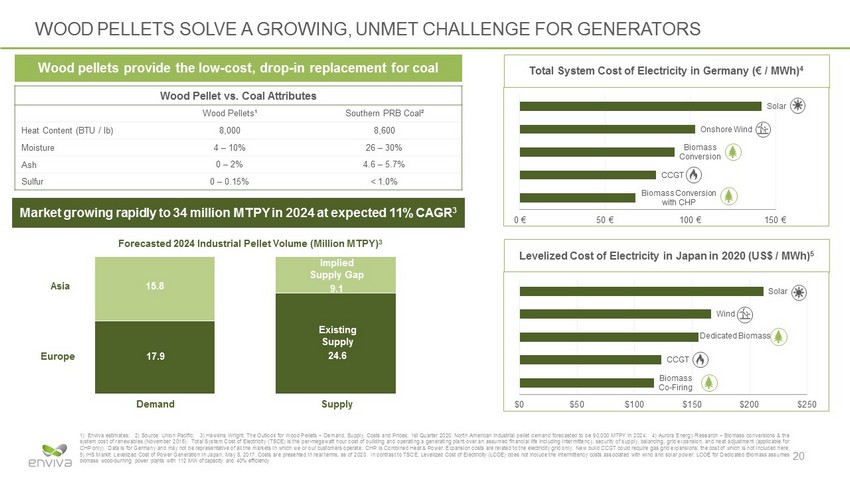
20 Levelized Cost of Electricity in Japan in 2020 (US$ / MWh) 5 WOOD PELLETS SOLVE A GROWING, UNMET CHALLENGE FOR GENERATORS 1 ) Enviva estimates ; 2 ) Source : Union Pacific ; 3 ) Hawkins Wright : The Outlook for Wood Pellets – Demand, Supply, Costs and Prices ; 1 st Quarter 2020 . North American industrial pellet demand forecasted to be 90 , 000 MTPY in 2024 ; 4 ) Aurora Energy Research – Biomass conversions & the system cost of renewables (November 2016 ) . Total System Cost of Electricity (TSCE) is the per - megawatt hour cost of building and operating a generating plant over an assumed financial life including intermittency, security of supply, balancing, grid expansion, and heat adjustment (applicable for CHP only) . Data is for Germany and may not be representative of all the markets in which we or our customers operate . CHP is Combined Heat & Power . Expansion costs are related to the electricity grid only . New build CCGT could require gas grid expansions, the cost of which is not included here ; 5 ) IHS Markit : Levelized Cost of Power Generation in Japan, May 8 , 2017 . Costs are presented in real terms, as of 2020 . In contrast to TSCE, Levelized Cost of Electricity (LCOE) does not include the intermittency costs associated with wind and solar power . LCOE for Dedicated Biomass assumes biomass wood - burning power plants with 112 MW of capacity and 40 % efficiency Implied Supply Gap 9.1 Forecasted 2024 Industrial Pellet Volume (Million MTPY) 3 Wood Pellet vs. Coal Attributes Wood Pellets¹ Southern PRB Coal² Heat Content (BTU / lb) 8,000 8,600 Moisture 4 – 10% 26 – 30% Ash 0 – 2% 4.6 – 5.7% Sulfur 0 – 0.15% < 1.0% Wood pellets provide the low - cost, drop - in replacement for coal Demand Supply Europe Asia Existing Supply 24.6 15.8 17.9 Total System Cost of Electricity in Germany (€ / MWh) 4 Biomass Conversion with CHP CCGT Biomass Conversion Onshore Wind Solar 0 € 50 € 100 € 150 € Biomass Co - Firing CCGT Dedicated Biomass Wind Solar $0 $50 $100 $150 $200 $250 Market growing rapidly to 34 million MTPY in 2024 at expected 11% CAGR 3

21 ENVIVA IMPROVES THE ENVIRONMENT BY DISPLACING COAL 1 AND GROWING MORE TREES 2 1) Increasing the share of biomass on the global grid system is critical to the global energy transition . International Renewable Energy Agency’s Global Energy Transformation : A Roadmap to 2050 ( 2019 Edition) report calls for the share of modern biomass for energy generation to increase from 5 % in 2016 to 16 % in 2050 , and the share of coal for energy generation to decrease from 14 % to 3 % over the same period 2) Landowners in the US South respond to strong markets for forest products by making investments in their forests and there is a clear positive relationship between rates of forest harvest and forest acreage, growth, and inventory . Based on FIA data for the US South covering the 70 - year period since 1953 , Forest 2 Market concluded that “Increased demand for wood … encouraged landowners to invest in productivity improvements that dramatically increased the amount of wood fiber, and therefore the amount of carbon, contained in the South’s forests . ” Source : Forest 2 Market report, Historical Perspective on the Relationship between Demand and Forest Productivity in the US South, July 2017 3) Eurostat . Inland coal consumption in key European countries that Enviva serves 4) Industrial wood pellet demand for Belgium, Denmark, Netherlands and United Kingdom . Hawkins Wright : The Outlook for Wood Pellets – Demand, Supply, Costs and Prices ; 4 th Quarter 2019 5) FIA Data . Enviva’s primary sourcing regions consist of the Chesapeake (NC, VA) ; Sampson (NC) ; Greenwood (SC, GA) ; and Gulf (AL, FL and GA) regions 0 2 4 6 8 10 12 2012 2013 2014 2015 2016 2017 2018 Million MT 1,950 2,000 2,050 2,100 2,150 2,200 2,250 2,300 2,350 2,400 2012 2013 2014 2015 2016 2017 2018 Million MT Coal Consumption Declined by More than Half 3 Wood Pellet Consumption More Than Doubled 4 Strong Forest Inventory Growth in Enviva’s Sourcing Regions 5 Through 2019, wood pellets supplied by the Partnership and our Sponsor have effectively displaced 15 million MT of coal. Wit h existing contracts running through 2044, the Partnership and our Sponsor are on track to displace another 86 million MT of co al 0 20 40 60 80 100 120 2012 2013 2014 2015 2016 2017 2018 Million MT Belgium Denmark Netherlands UK

22 ENVIVA’S ACTIVITIES SUSTAIN THRIVING, HEALTHY FORESTS 1) USDA - http : //blogs . usda . gov/ 2015 / 06 / 08 /study - finds - increasing - wood - pellet - demand - boosts - forest - growth - reduces - greenhouse - gas - emissions - creates - jobs/ 2015 2) The information in this panel is based on wood supplied to the Partnership and our Sponsor’s production plants from July through December 2019 3) This wood consists of undersized or “understory” wood that was removed as part of a larger harvest ; tops and limbs ; brush and “thinnings” that were removed to make additional room for planted pines to grow 4) We can identify the individual production facilities that provided these materials Certifications with Annual Audits by Independent Certification Bodies: Sponsor’s Track & Trace ® Program, a first - of - its - kind system, is an important element of our responsible wood supply program and provides unprecedented transparency into our procurement activities Between 2011, when Enviva opened its first U.S. mill, and 2018, forest inventory in our supply base increased by more than 300 million metric tons “An industry that can reduce greenhouse gas emissions, increase forest growth, and create jobs sounds too good to be true. But that is the reality of the emerging wood pellet market in the Southern U.S.”¹ - USDA Chief Economist Robert Johansson Forest data analytics demonstrate increased harvests and healthy markets increase growth in forest acreage, timber inventory, and carbon stored in the landscape 17% Mill & industry residues 4 4% Bottomland hardwood forests 26% Pine forests with hardwood understory 3 <1% Arboricultural sources 31% Mixed pine & hardwood forests Our Wood Came from These Sources: 2 18% Pine forests 4% Other hardwood forests PEFC / 29 - 31 - 238 SFI - 01203

23 STABLE FIBER COSTS AND STRUCTURAL FEEDSTOCK ADVANTAGE 1 ) Source : All data except data for Brazil are from RISI World Timber Price Quarterly – April 2020 for the fourth quarter of 2019 . The wood chip price for Latvia is based on CIF Sweden . Data for Brazil is from Forest 2 Market - the cost of delivered wood chips in Brazil is approximately US $ 41 - $ 43 per green metric ton . The primary in - country market for these chips is the food production and crop industries, which use chips for heat and drying purposes . However, the average minimum FOB price in Brazil is around US $ 148 per dry metric ton due to the logistical and administrative costs related to exporting these chips 2 ) Timber Mart South – North Carolina Q 1 2020 3 ) FIA Data (EVALIDator ; 2019 ) : in the last year where state forest inventory data is available, total wood fiber within the fiber sourcing area for the Partnership’s Northampton plant grew by approximately 30 . 4 million tons and total harvest removals were approximately 16 . 7 million tons, resulting in 13 . 7 million tons of excess fiber 4 ) FIA Data ▪ 65,000+ private landowners ▪ 860 million + tons of fiber ▪ ~14 million tons net annual fiber excess 3 ▪ 1 million tons annual facility demand ▪ Only a few buyers of low - grade fiber, which only cost - effectively travels ~75 miles Net Fiber Growth After All Uses 4 Fragmented, Natural Resource Supply Base Structural Cost of Goods Sold Advantage 1 Long - term, Stable Delivered Cost of Fiber 2 US$ / green ton Wood chip US$ / dry ton Southern US Germany Latvia Japan $148 $136 $145 $145 $61 Brazil Hardwood Roundwood Pine Roundwood Open / Farmland 75 mi. Northampton 380 390 400 410 420 430 2010 2012 2014 2016 2018 Million MT of Wood Inventory 9% 510 530 550 570 590 610 2010 2012 2014 2016 2018 Million MT of Wood Inventory 14% 800 850 900 950 1,000 1,050 2010 2012 2014 2016 2018 Million MT of Wood Inventory 20% 540 560 580 600 620 640 2010 2012 2014 2016 2018 Million MT of Wood Inventory 15% GREENWOOD SOURCING REGION GULF SOURCING REGION CHESAPEAKE SOURCING REGION WILMINGTON SOURCING REGION $0 $10 $20 $30 $40 $50 '00 '01 '02 '03 '04 '05 '06 '07 '08 '09 '10 '11 '12 '13 '14 '15 '16 '17 '18 '19 '20 2000 – 2020 North Carolina Pulpwood

24 LONG - TERM, TAKE - OR - PAY OFF - TAKE CONTRACTS WITH PASSTHROUGH PROVISIONS RESULT IN PREDICTABLE CASH FLOWS Typical Contract Provisions 1 Counterparty Major utilities and investment grade - rated trading houses Term Up to 20 years Take - or - Pay Yes Termination Make - Whole Yes Margin Protection 1 Price escalators Yes Fiber / diesel passthroughs Yes, in some contracts Shipping costs Fixed with matching long - term shipping contracts Bunker fuel passthrough Yes Changes in Law / Government Regulations Provisions designed to protect against changes in law / government regulations 1) Off - take contract terms are examples of various provisions within our portfolio of contracts. No single contract in our portfoli o contains every provision listed above 2) Not representative of all contracts with regard to stumpage and diesel passthroughs 3) Additional details are available as part of our press release as of April 29, 2020 Illustrative Passthroughs and Escalators 2 1 $0 $40 $80 $120 $160 $200 Traditional Pulpwood Stumpage 1 Base Price Diesel 1 Shipping Price escalators protect against erosion of underlying cost position and provides opportunity for margin expansion Indexed diesel pricing component mitigates fuel exposure from harvesting, inland transport, and processing activities Indexed stumpage pricing matches underlying raw material commodity cost to regional indices Fixed, back to back shipping component with bunker fuel passthrough Fiber (“stumpage”) cost ~10% of sales price, driven by strong fiber basket in Southeast U.S. All customers remain in compliance with take - or - pay obligations despite the COVID - 19 pandemic 3
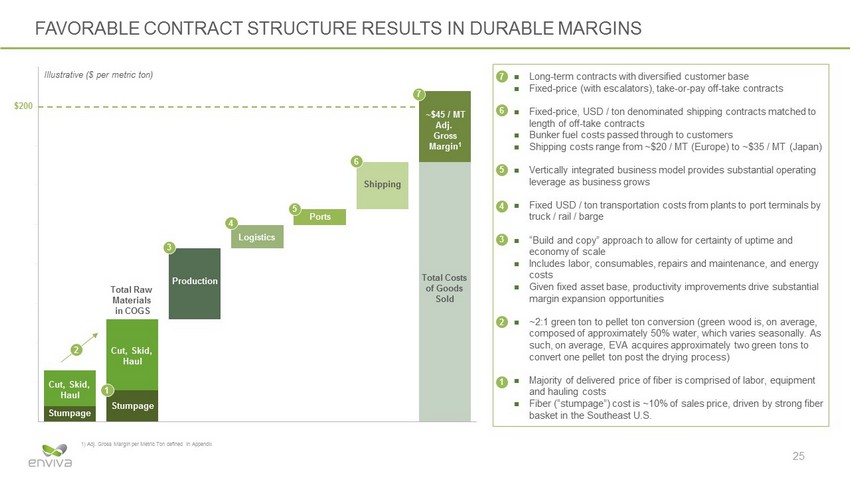
25 FAVORABLE CONTRACT STRUCTURE RESULTS IN DURABLE MARGINS Illustrative ($ per metric ton) $0 $25 $50 $75 $100 $125 $150 $175 $200 $225 1 2 3 4 5 6 7 Cut, Skid, Haul Stumpage ~$45 / MT Adj. Gross Margin 1 Shipping Production Total Raw Materials in COGS Ports Logistics $200 Total Costs of Goods Sold Cut, Skid, Haul Stumpage Long - term contracts with diversified customer base Fixed - price (with escalators), take - or - pay off - take contracts Fixed - price, USD / ton denominated shipping contracts matched to length of off - take contracts Bunker fuel costs passed through to customers Shipping costs range from ~$20 / MT (Europe) to ~$35 / MT (Japan) Vertically integrated business model provides substantial operating leverage as business grows Fixed USD / ton transportation costs from plants to port terminals by truck / rail / barge “Build and copy” approach to allow for certainty of uptime and economy of scale Includes labor, consumables, repairs and maintenance, and energy costs Given fixed asset base, productivity improvements drive substantial margin expansion opportunities ~2:1 green ton to pellet ton conversion (green wood is, on average, composed of approximately 50% water, which varies seasonally. As such, on average, EVA acquires approximately two green tons to convert one pellet ton post the drying process) Majority of delivered price of fiber is comprised of labor, equipment and hauling costs Fiber (“stumpage”) cost is ~10% of sales price, driven by strong fiber basket in the Southeast U.S. 7 6 5 4 3 2 1 1) Adj. Gross Margin per Metric Ton defined in Appendix

26 CONSERVATIVE FINANCIAL POLICY Maintain a conservative capital structure and healthy liquidity — Continue to target 50 / 50 equity / debt ratio for third - party acquisitions, drop - downs and expansions — Target long - term leverage ratio of 3.5x to 4.0x Sales strategy is to fully contract our production capacity under long - term, take - or - pay off - take contracts — Include terms and provisions that mitigate cash flow risk — Continue customer and geographic diversification — Match off - take contracts with fixed - rate shipping contracts — Leverage market position to capitalize on short - term purchase / sale opportunities Stable cash flow generation backed by fleet of assets and global optimization capabilities — Internal continuous improvement focus results in annual productivity increases — Maintain industry - leading position and competitive advantage, leveraging fleet of production and logistics assets and optimizing within portfolio of off - take contracts — Diverse supply base Minimize cash flow risk and continue to generate durable distributable cash flow — No material exposure to crude or natural gas prices — Interest rate and currency exposures programmatically hedged — Shield the Partnership from construction and ramp risk for new plants — Continue to target long - term distributable cash flow coverage target of 1.20x on a forward - looking annual basis

27 FINANCIAL OVERVIEW Distribution per Unit $1.65 ³ $2.03 $2.28 $2.51 $2.65 $3.00 + 4 $0.00 $1.00 $2.00 $3.00 $4.00 2015 2016 2017 2018 2019 2020E Distributable Cash Flow Net Income and Adjusted EBITDA $18 $13 $14 $7 - $3 $34 - $44 $72 $79 $102 $103 $141 $185 - $195 -$10 $20 $50 $80 $110 $140 $170 $200 2015 2016 2017 2018 2019 2020E² $57 $60 $68 $64 $98 $134 - $144 $0 $20 $40 $60 $80 $100 $120 $140 $160 2015 2016 2017 2018 2019 2020E² Note : Historic financials are based on EVA’s public filings . 2020 E pro forma financials are inclusive of the Acquisitions . Refer to Appendix for additional details on non - GAAP reconciliations 1) Adj . EBITDA CAGR is calculated based on estimated 2020 Adj . EBITDA . 2) After accounting for the expected benefit of the Acquisitions, the Partnership now expects full - year 2020 net income to be in the range of $ 33 . 9 million to $ 43 . 9 million, adjusted EBITDA to be in the range of $ 185 . 0 million to $ 195 . 0 million, and distributable cash flow to be in the range of $ 134 . 0 million to $ 144 . 0 million, prior to any distributions attributable to incentive distribution rights paid to our general partner . Refer to Appendix for additional details 3) Represents the annualized minimum quarterly distribution per unit per EVA’s partnership agreement 4) 2020 full year distribution per unit is subject to board approval ($ in millions) ($ in millions) ($ per unit) Net Income Adjusted EBITDA

Appendix

29 2020 GUIDANCE 1 ) Includes $ 3 . 2 million of MSA Fee Waivers during the first quarter of 2020 , expected $ 1 . 0 million of MSA Fee Waivers during the second quarter of 2020 , and expected $ 18 . 0 million of MSA Fee Waivers associated with the Greenwood Acquisition Prior 2020E Guidance Revised 2020 Guidance ESTIMATED NET INCOME $ 52.2 - 62.2 $ 33.9 - 43.9 ADD: DEPRECIATION AND AMORTIZATION 65.8 75.0 INTEREST EXPENSE 40.8 45.4 INCOME TAX EXPENSE - 0.3 NON-CASH UNIT COMPENSATION EXPENSE 8.4 8.6 ASSET IMPAIRMENTS AND DISPOSALS 3.0 3.0 CHANGES IN THE FAIR VALUE OF DERIVATIVE INSTRUMENTS (6.8) (6.8) MSA FEE WAIVERS 1 4.2 22.2 ACQUISITION AND INTEGRATION COSTS - 6.1 COMMERCIAL SERVICES (4.1) (4.1) OTHER NON-CASH EXPENSES 1.5 1.5 ESTIMATED ADJUSTED EBITDA $ 165.0 - 175.0 $ 185.0 - 195.0 LESS: INTEREST EXPENSE NET OF AMORTIZATION OF DEBT ISSUANCE COSTS, DEBT PREMIUM, ORIGINAL ISSUE DISCOUNT AND IMPACT FROM INCREMENTAL BORROWINGS RELATED TO CHESAPEAKE INCIDENT AND HURRICANE EVENTS 39.1 42.6 INCOME TAX EXPENSE - 0.3 MAINTENANCE CAPITAL EXPENDITURES 6.9 8.2 ESTIMATED DISTRIBUTABLE CASH FLOW $ 119.0 - 129.0 $ 134.0 - 144.0 Twelve Months Ending December 31, 2020

30 2021 AND 2024 GUIDANCE FOR THE ACQUISITIONS 1 ) Includes expected $ 19 . 0 million of MSA Fee Waivers associated with the Greenwood Acquisition in 2021 Twelve Months Ending December 31, 2021 Twelve Months Ending December 31, 2024 ESTIMATED NET INCOME $ (17.7) - (13.7) $ 18.7 - 22.7 ADD: DEPRECIATION AND AMORTIZATION 23.1 24.0 INTEREST EXPENSE 10.8 10.0 INCOME TAX EXPENSE 0.8 0.8 NON-CASH UNIT COMPENSATION EXPENSE 0.6 1.4 ASSET IMPAIRMENTS AND DISPOSALS 1.0 1.0 INTEGRATION COSTS 1.4 - MSA FEE WAIVERS¹ 19.0 - ESTIMATED ADJUSTED EBITDA $ 39.0 - 43.0 $ 56.0 - 60.0

31 This presentation contains certain financial measures that are not presented in accordance with GAAP . Although they should not be considered alternatives to the GAAP presentation of the financial results of the Partnership, management views such non - GAAP measures as important to reflect the Partnership’s actual performance during the periods presented . Non - GAAP Financial Measures We use Adjusted Gross Margin per Metric ton, Adjusted EBITDA, and Distributable Cash Flow to measure our financial performance . Adjusted Gross Margin per Metric Ton We define adjusted gross margin per metric ton as gross margin per metric ton excluding asset disposals, depreciation and amo rti zation, changes in unrealized derivative instruments related to hedged items included in gross margin, certain non - cash waivers of fees for management services provided to us by our Sponsor (collecti vely, the “MSA Fee Waivers”), non - cash unit compensation expense, certain items of income or loss that we characterize as unrepresentative of our ongoing operations, including certain expense s i ncurred related to a fire that occurred at our Chesapeake terminal on February 27, 2018 (the “Chesapeake Incident”) and Hurricanes Florence and Michael (the “Hurricane Events”), consisting of eme rge ncy response expenses, expenses related to the disposal of inventory, and asset disposal and repair costs, offset by insurance recoveries received, as well as employee compensation and ot her related costs allocated to us in respect of the Chesapeake Incident and the Hurricane Events pursuant to our management services agreement with an affiliate of our Sponsor for services that cou ld otherwise have been dedicated to our ongoing operations, and acquisition and integration costs, and the effect of certain sales and marketing, scheduling, sustainability, consultation, s hip ping and risk management services (collectively, the “Commercial Services”). We believe adjusted gross margin per metric ton is a meaningful measure because it compares our revenue - generating activities to our operating costs for a view of profitability and performance on a per metric ton basis. Adjusted gross margin per metric ton will primarily be affected by our ability to meet targeted product ion volumes and to control direct and indirect costs associated with procurement and delivery of wood fiber to our production plants and the production and distribution of wood pellets. Adjusted EBITDA We define adjusted EBITDA as net income or loss excluding depreciation and amortization, interest expense, income tax expense, early retirement of debt obligations, MSA Fee Waivers, and unit compensation expense, asset impairments and disposals, changes in unrealized derivative instruments related to hedged items included in gross margin and other income and expense, certain items of income or loss that we characterize as unrepresentative of our ongoing operations, including certain expenses incurred related to the Chesapeake Incident and Hurricane Events, consisting of emergency response expenses, expenses related to the disposal of inventory, and asset disposal and repair costs, offset by insurance recoveries received, and acquisition and integration costs . Adjusted EBITDA is a supplemental measure used by our management and other users of our financial statements, such as investors, commercial banks, and research analysts, to assess the financial performance of our assets without regard to financing methods or capital structure . NON - GAAP FINANCIAL MEASURES
32 Distributable Cash Flow We define distributable cash flow as adjusted EBITDA less maintenance capital expenditures, income tax expense, and interest exp ense net of amortization of debt issuance costs, debt premium, original issue discounts, and the impact from incremental borrowings related to the Chesapeake Incident and Hurricane Events. We use distributable cash flow as a performance metric to compare the cash - generating performance of the Partnership from period to period and to compare the cash - generating performance for specific periods to the cash distributions (if any) that are expected to be paid to our unitholders. We do not rely on distributable cash flow as a liquidity measure. Limitations of Non - GAAP Measures Adjusted Gross Margin per Ton, Adjusted EBITDA, and Distributable Cash Flow are not financial measures presented in accordance with GAAP . We believe that the presentation of these non - GAAP financial measures provide useful information to investors in assessing our financial condition and results of operations . Our non - GAAP financial measures should not be considered as alternatives to the most directly comparable GAAP financial measures . Adjusted Gross Margin per Ton, Adjusted EBITDA, and Distributable Cash Flow have important limitations as analytical tools because they excludes some, but not all, items that affect the most directly comparable GAAP financial measure, net income . You should not consider Adjusted Gross Margin per Ton, Adjusted EBITDA or Distributable Cash Flow in isolation or as substitutes for analysis of our results as reported under GAAP . Our definitions of Adjusted Gross Margin per Ton, Adjusted EBITDA and Distributable Cash Flow may not be comparable to similarly titled measures of other companies, thereby diminishing their utility . NON - GAAP FINANCIAL MEASURES
33 NON - GAAP FINANCIAL MEASURES RECONCILIATION This presentation contains an estimate of (i) the net income and adjusted EBITDA the Acquisitions will generate, and (ii) the incremental adjusted EBITDA our Sponsor and the Sponsor JV’s wood pellet production plants and marine terminal currently under development will generate on a run - rate basis, incremental adjusted EBITDA that our Southampton and Northampton plants will generate from the planned expansions at Southampton and Northampton production plants (the “Mid - Atlantic Expansions”) . Presentation of estimated net income and reconciliations of estimated incremental adjusted EBITDA for potential drop - downs of any wood pellet production plant or marine terminal from our Sponsor or the Sponsor JV to the closest GAAP financial measure, net income, are not provided because the estimate of net income to be generated by the potential drop - downs of such wood pellet production plants or marine terminal is not available without unreasonable effort, in part because the amount of estimated incremental interest expense related to the financing of such assets is not available at this time . In addition, a presentation of estimated net income and a reconciliation of the estimated incremental adjusted EBITDA expected to be generated by the Mid - Atlantic Expansions to the closest GAAP financial measure, net income, are not provided because estimate of net income expected to be generated by the expansions is not available without unreasonable effort, in part because the amount of estimated incremental interest expense related to the financing of the expansions and depreciation are not available at this time . Our estimates of net income and / or adjusted EBITDA for such assets and project are based on numerous assumptions are inherently uncertain and subject to significant business, economic, financial, regulatory, and competitive risks and uncertainties that could cause actual results and amounts to differ materially from those estimates . For more information about such significant risks and uncertainties, please see the risk factors discussed or referenced in our filings with the Securities and Exchange Commission (the “SEC”), including the Annual Report on Form 10 - K and the Quarterly Reports on Form 10 - Q most recently filed with the SEC .