Attached files
| file | filename |
|---|---|
| 8-K - 8-K - Frontier Communications Parent, Inc. | form8k.htm |

Disclosure Statement Supplemental Materials:Updated Base Case and Reinvestment Case Overview June
17th, 2020 Exhibit 99.1
Safe Harbor StatementForward-looking Language This presentation contains "forward-looking statements,"
related to future events. Forward-looking statements address Frontier’s expected future business, financial performance, and financial condition, and contain words such as "expect," "anticipate," "intend," "plan," "believe," "seek," "see,"
"may," "will," "would," or "target." Forward-looking statements by their nature address matters that are, to different degrees, uncertain. For Frontier, particular uncertainties that could cause actual results to be materially different than
those expressed in such forward-looking statements include: our ability to continue as a going concern; our ability to successfully consummate a financial restructuring of our existing debt, existing equity interests, and certain other
obligations (the Restructuring), and emerge from cases commenced under chapter 11 (the Chapter 11 Cases) of the United States Bankruptcy Code, including by satisfying the conditions and milestones in the restructuring support agreement; our
ability to improve our liquidity and long-term capital structure and to address our debt service obligations through the Restructuring and the potential adverse effects of the Chapter 11 Cases on our liquidity and results of operations; our
ability to maintain relationships with suppliers, customers, employees and other third parties as a result of the Restructuring and the Chapter 11 Cases; the effects of the Restructuring and the Chapter 11 Cases on the Company and the
interests of various constituents; risks and uncertainties associated with the Restructuring, including our ability to receive approvals for debtor-in-possession financing, obtain confirmation of the Plan under the Chapter 11 Cases and
successfully consummate the Restructuring; our ability to comply with the restrictions expected to be imposed by covenants in debtor-in-possession and exit financing; the length of time that the Company will operate under Chapter 11
protection and the continued availability of operating capital during the pendency of the Chapter 11 Cases; risks associated with third party motions in the Chapter 11 Cases, which may interfere with the Company’s ability to consummate the
Restructuring; increased administrative and legal costs related to the Chapter 11 process; declines in revenue from our voice services, switched and nonswitched access and video and data services that we cannot stabilize or offset with
increases in revenue from other products and services; our ability to successfully implement strategic initiatives, including opportunities to enhance revenue and realize productivity improvements; our ability to effectively manage our
operations, operating expenses, capital expenditures, debt service requirement and cash paid for income taxes and liquidity; competition from cable, wireless and wireline carriers, satellite, and OTT companies, and the risk that we will not
respond on a timely or profitable basis; our ability to successfully adjust to changes in the communications industry, including the effects of technological changes and competition on our capital expenditures, products and service offerings;
risks related to disruption in our networks, infrastructure and information technology that result in customer loss and/or incurrence of additional expenses; the impact of potential information technology or data security breaches or other
cyber-attacks or other disruptions; our ability to retain or attract new customers and to maintain relationships with customers, employees or suppliers; our ability to secure, continue to use or renew intellectual property and other licenses
used in our business; our ability to hire or retain key personnel; our ability to dispose of certain assets or asset groups on terms that are attractive to us, or at all; the effects of changes in the availability of federal and state
universal service funding or other subsidies to us and our competitors and our ability to obtain future subsidies, including participation in the proposed RDOF program; our ability to meet our CAF II obligations and the risk of penalties or
obligations to return certain CAF II funds; our ability to defend against litigation and potentially unfavorable results from current pending and future litigation; our ability to comply with applicable federal and state consumer protection
requirements; the effects of state regulatory requirements that could limit our ability to transfer cash among our subsidiaries or dividend funds up to the parent company; the effects of governmental legislation and regulation on our
business, including costs, disruptions, possible limitations on operating flexibility and changes to the competitive landscape resulting from such legislation or regulation; the impact of regulatory, investigative and legal proceedings and
legal compliance risks; government infrastructure projects (such as highway construction) that impact our capital expenditures; continued reductions in switched access revenues as a result of regulation, competition or technology
substitutions; our ability to effectively manage service quality in the states in which we operate and meet mandated service quality metrics; the effects of changes in income tax rates, tax laws, regulations or rulings, or federal or state
tax assessments, including the risk that such changes may benefit our competitors more than us, as well as potential future decreases in the value of our deferred tax assets; the effects of changes in accounting policies or practices,
including potential future impairment charges with respect to our intangible assets or additional losses on assets held for sale; the effects of increased medical expenses and pension and postemployment expenses; our ability to successfully
renegotiate union contracts; changes in pension plan assumptions, interest rates, discount rates, regulatory rules and/or the value of our pension plan assets, which could require us to make increased contributions to the pension plan in 2020
and beyond; the effects of weak economic conditions and market disruptions, including the impact of the ongoing COVID-19 pandemic; risks arising from the delisting of our common stock from the Nasdaq Global Select Market; and the risks and
other factors contained in Frontier’s filings with the U.S. Securities and Exchange Commission, including our most recent report on Form 10-K and our Form 10-Q for the quarter ended March 31, 2020. These risks and uncertainties may cause
actual future results to be materially different than those expressed in such forward-looking statements. Frontier has no obligation to update or revise these forward-looking statements and does not undertake to do so.
Non-GAAP Financial Measures Frontier uses certain non-GAAP financial measures in evaluating its
performance, including EBITDA, Adjusted EBITDA, Adjusted EBITDA margin, Adjusted Operating Expenses, unlevered free cash flow and operating cash flow, each of which is described below. Management uses these non-GAAP financial measures
internally to (i) assist in analyzing Frontier's underlying financial performance from period to period, (ii) analyze and evaluate strategic and operational decisions, (iii) establish criteria for compensation decisions, and (iv) assist in
the understanding of Frontier's ability to generate cash flow and, as a result, to plan for future capital and operational decisions. Management believes that the presentation of these non-GAAP financial measures provides useful information
to investors regarding Frontier’s financial condition and results of operations because these measures, when used in conjunction with related GAAP financial measures (i) provide a more comprehensive view of Frontier’s core operations and
ability to generate cash flow, (ii) provide investors with the financial analytical framework upon which management bases financial, operational, compensation, and planning decisions and (iii) present measurements that investors and rating
agencies have indicated to management are useful to them in assessing Frontier and its results of operations. Reconciliations of historical non-GAAP measures to the most comparable financial measures calculated and presented in accordance
with GAAP are included in the tables in the Appendix. These non-GAAP financial measures are not measures of financial performance or liquidity under GAAP, nor are they alternatives to GAAP measures and they may not be comparable to similarly
titled measures of other companies. EBITDA is defined as net income (loss) less income tax expense (benefit), interest expense, investment and other income (loss), pension settlement costs, gains/losses on extinguishment of debt, and
depreciation and amortization. Adjusted EBITDA is defined as EBITDA, as described above, adjusted to exclude, certain pension/OPEB expenses, restructuring costs and other charges, stock-based compensation expense, goodwill impairment charges,
and certain other non-recurring items. Adjusted EBITDA margin is calculated by dividing Adjusted EBITDA by total revenue. Management uses EBITDA, Adjusted EBITDA and Adjusted EBITDA margin to assist it in comparing performance from period to
period and as measures of operational performance. Management believes that these non-GAAP measures provide useful information for investors in evaluating Frontier’s operational performance from period to period because they exclude
depreciation and amortization expenses related to investments made in prior periods and are determined without regard to capital structure or investment activities. By excluding capital expenditures, debt repayments and dividends, among other
factors, these non-GAAP financial measures have certain shortcomings. Management compensates for these shortcomings by utilizing these non-GAAP financial measures in conjunction with the comparable GAAP financial measures. Adjusted Operating
Expenses is defined as operating expenses adjusted to exclude depreciation and amortization, restructuring and other charges, goodwill impairment charges, certain pension/OPEB expenses, stock-based compensation expense, and certain other
non-recurring items. Investors have indicated that this non-GAAP measure is useful in evaluating Frontier’s performance.Management defines operating cash flow, a non-GAAP measure, as Adjusted EBITDA, described above, adjusted to exclude
capital expenditures. Unlevered free cash flow is defined as operating cash flow, described above, adjusted to exclude cash taxes paid, pension/OPEB contribution to net capital, changes in working capital, restructuring and other costs and
capital costs and to include investment income, net sale proceeds, transformation costs and other adjustments. Management uses operating cash flow and unlevered free cash flow to assist it in comparing liquidity from period to period and to
obtain a more comprehensive view of Frontier’s core operations and ability to generate cash flow. Management believes that this non-GAAP measure is useful to investors in evaluating cash available to service debt. Certain financial measures
have been presented on a pro forma basis for the sale of Frontier’s Northwest Operations. Certain projected GAAP financial measures are not provided herein because such figures are not available on a forward-looking basis and reconciliations
of projected non-GAAP financial measures are not provided because they could not be derived without unreasonable effort.The information in this presentation should be read in conjunction with the financial statements and footnotes contained
in Frontier’s documents filed with the U.S. Securities and Exchange Commission.

Updated (6/1) Base Case
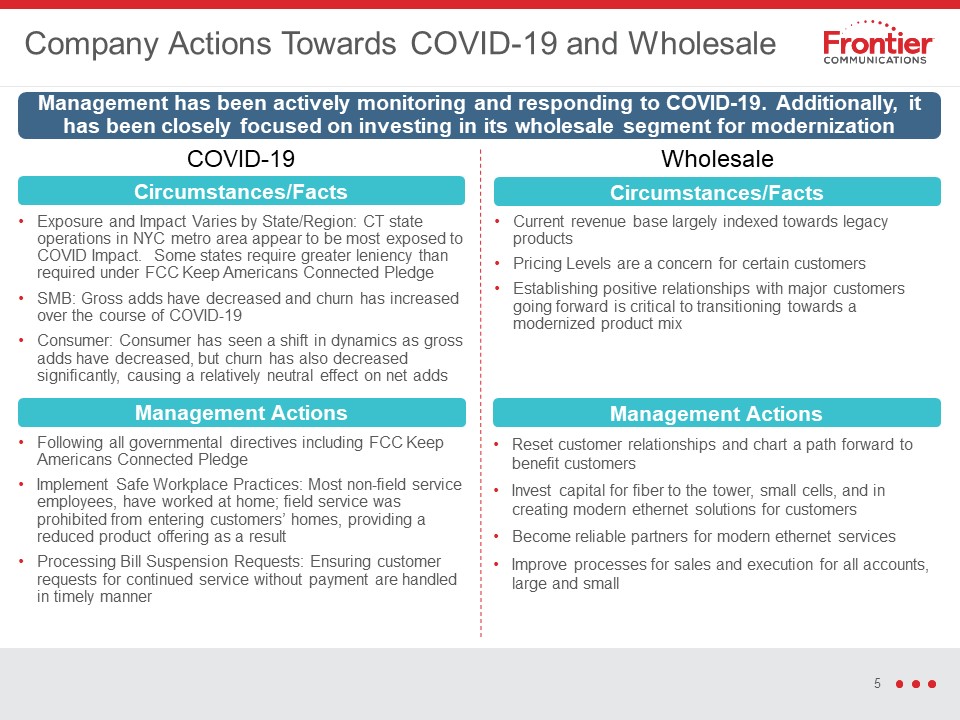
Company Actions Towards COVID-19 and Wholesale Management has been actively monitoring and responding
to COVID-19. Additionally, it has been closely focused on investing in its wholesale segment for modernization Circumstances/Facts Exposure and Impact Varies by State/Region: CT state operations in NYC metro area appear to be most exposed
to COVID Impact. Some states require greater leniency than required under FCC Keep Americans Connected PledgeSMB: Gross adds have decreased and churn has increased over the course of COVID-19Consumer: Consumer has seen a shift in dynamics as
gross adds have decreased, but churn has also decreased significantly, causing a relatively neutral effect on net adds Management Actions Following all governmental directives including FCC Keep Americans Connected PledgeImplement Safe
Workplace Practices: Most non-field service employees, have worked at home; field service was prohibited from entering customers’ homes, providing a reduced product offering as a resultProcessing Bill Suspension Requests: Ensuring customer
requests for continued service without payment are handled in timely manner Circumstances/Facts Current revenue base largely indexed towards legacy productsPricing Levels are a concern for certain customersEstablishing positive
relationships with major customers going forward is critical to transitioning towards a modernized product mix Management Actions Reset customer relationships and chart a path forward to benefit customersInvest capital for fiber to the
tower, small cells, and in creating modern ethernet solutions for customersBecome reliable partners for modern ethernet servicesImprove processes for sales and execution for all accounts, large and small COVID-19 Wholesale
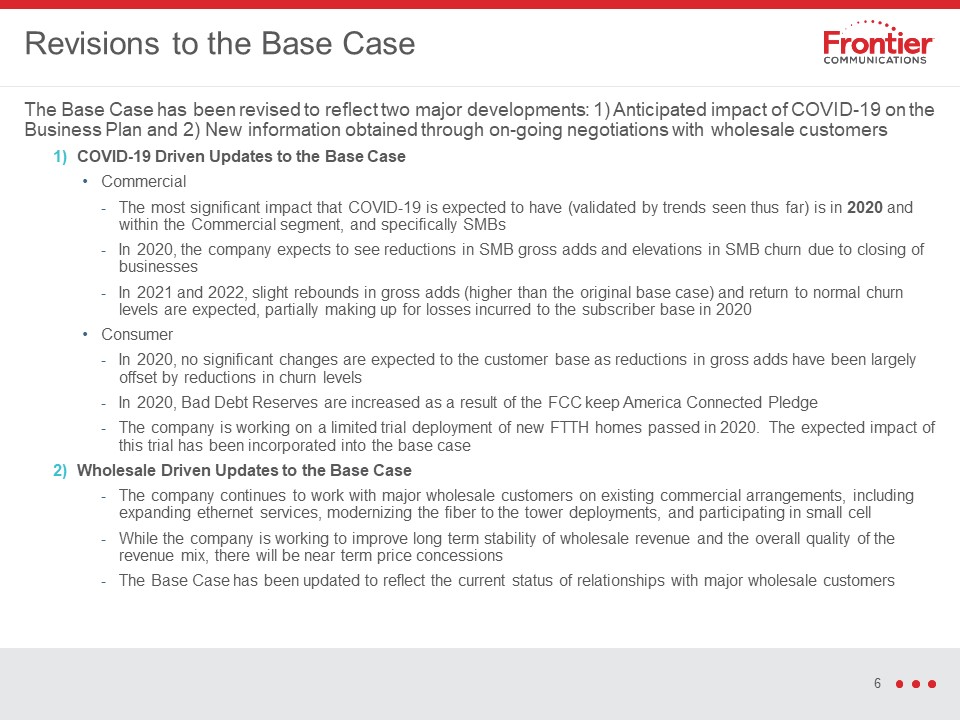
Revisions to the Base Case The Base Case has been revised to reflect two major developments: 1)
Anticipated impact of COVID-19 on the Business Plan and 2) New information obtained through on-going negotiations with wholesale customersCOVID-19 Driven Updates to the Base CaseCommercialThe most significant impact that COVID-19 is expected
to have (validated by trends seen thus far) is in 2020 and within the Commercial segment, and specifically SMBsIn 2020, the company expects to see reductions in SMB gross adds and elevations in SMB churn due to closing of businessesIn 2021
and 2022, slight rebounds in gross adds (higher than the original base case) and return to normal churn levels are expected, partially making up for losses incurred to the subscriber base in 2020ConsumerIn 2020, no significant changes are
expected to the customer base as reductions in gross adds have been largely offset by reductions in churn levelsIn 2020, Bad Debt Reserves are increased as a result of the FCC keep America Connected PledgeThe company is working on a limited
trial deployment of new FTTH homes passed in 2020. The expected impact of this trial has been incorporated into the base caseWholesale Driven Updates to the Base CaseThe company continues to work with major wholesale customers on existing
commercial arrangements, including expanding ethernet services, modernizing the fiber to the tower deployments, and participating in small cellWhile the company is working to improve long term stability of wholesale revenue and the overall
quality of the revenue mix, there will be near term price concessionsThe Base Case has been updated to reflect the current status of relationships with major wholesale customers
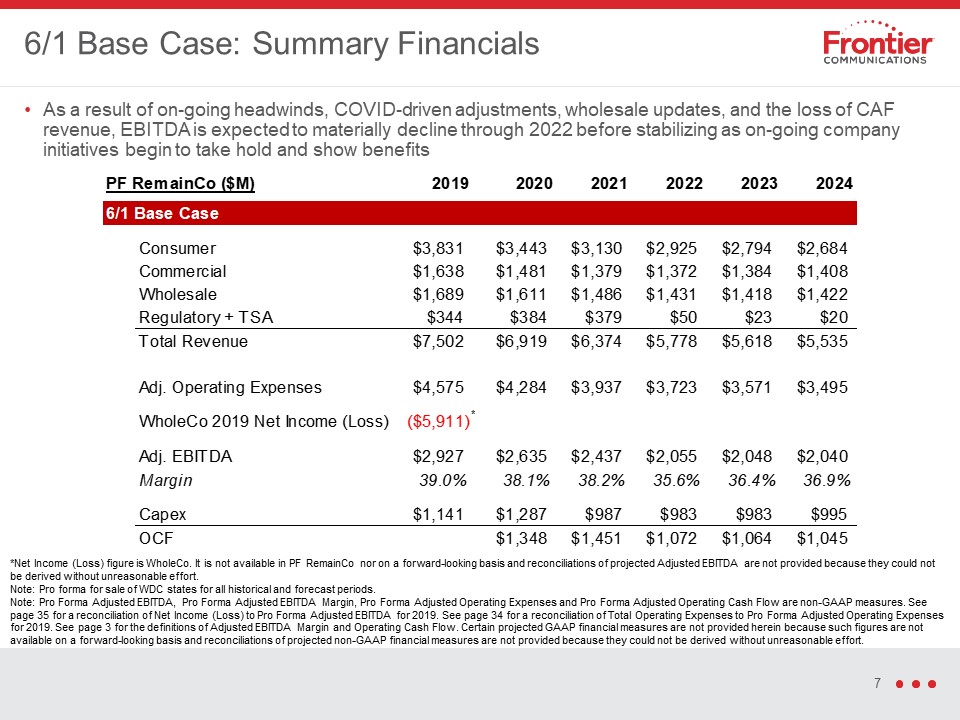
As a result of on-going headwinds, COVID-driven adjustments, wholesale updates, and the loss of CAF
revenue, EBITDA is expected to materially decline through 2022 before stabilizing as on-going company initiatives begin to take hold and show benefits 6/1 Base Case: Summary Financials * *Net Income (Loss) figure is WholeCo. It is not
available in PF RemainCo nor on a forward-looking basis and reconciliations of projected Adjusted EBITDA are not provided because they could not be derived without unreasonable effort. Note: Pro forma for sale of WDC states for all historical
and forecast periods.Note: Pro Forma Adjusted EBITDA, Pro Forma Adjusted EBITDA Margin, Pro Forma Adjusted Operating Expenses and Pro Forma Adjusted Operating Cash Flow are non-GAAP measures. See page 35 for a reconciliation of Net Income
(Loss) to Pro Forma Adjusted EBITDA for 2019. See page 34 for a reconciliation of Total Operating Expenses to Pro Forma Adjusted Operating Expenses for 2019. See page 3 for the definitions of Adjusted EBITDA Margin and Operating Cash Flow.
Certain projected GAAP financial measures are not provided herein because such figures are not available on a forward-looking basis and reconciliations of projected non-GAAP financial measures are not provided because they could not be
derived without unreasonable effort.
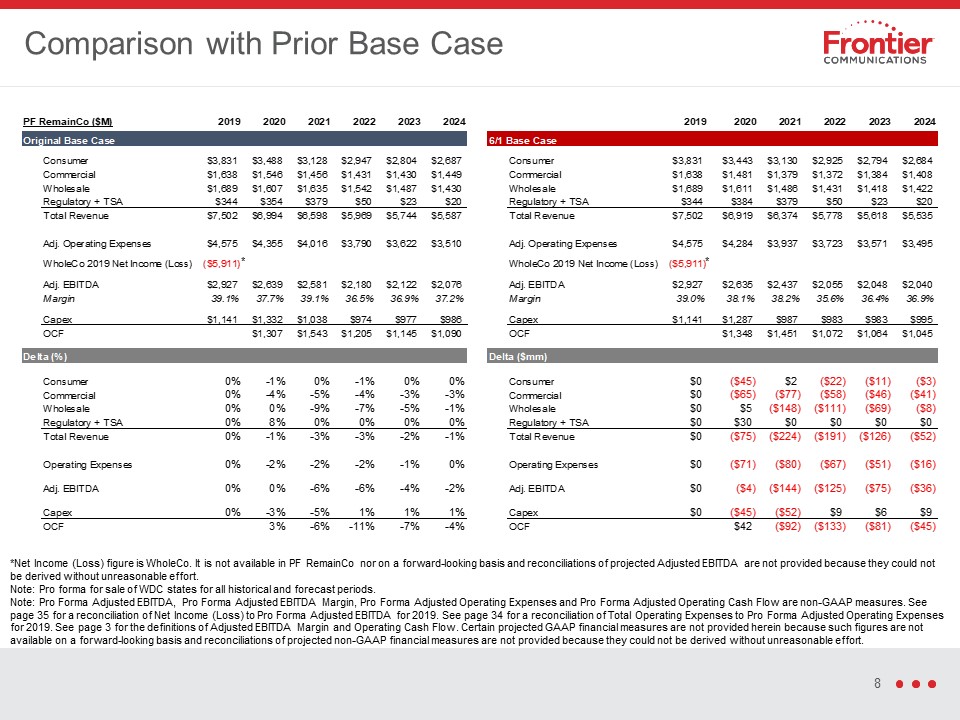
Comparison with Prior Base Case *Net Income (Loss) figure is WholeCo. It is not available in PF
RemainCo nor on a forward-looking basis and reconciliations of projected Adjusted EBITDA are not provided because they could not be derived without unreasonable effort. Note: Pro forma for sale of WDC states for all historical and forecast
periods.Note: Pro Forma Adjusted EBITDA, Pro Forma Adjusted EBITDA Margin, Pro Forma Adjusted Operating Expenses and Pro Forma Adjusted Operating Cash Flow are non-GAAP measures. See page 35 for a reconciliation of Net Income (Loss) to Pro
Forma Adjusted EBITDA for 2019. See page 34 for a reconciliation of Total Operating Expenses to Pro Forma Adjusted Operating Expenses for 2019. See page 3 for the definitions of Adjusted EBITDA Margin and Operating Cash Flow. Certain
projected GAAP financial measures are not provided herein because such figures are not available on a forward-looking basis and reconciliations of projected non-GAAP financial measures are not provided because they could not be derived
without unreasonable effort. * *
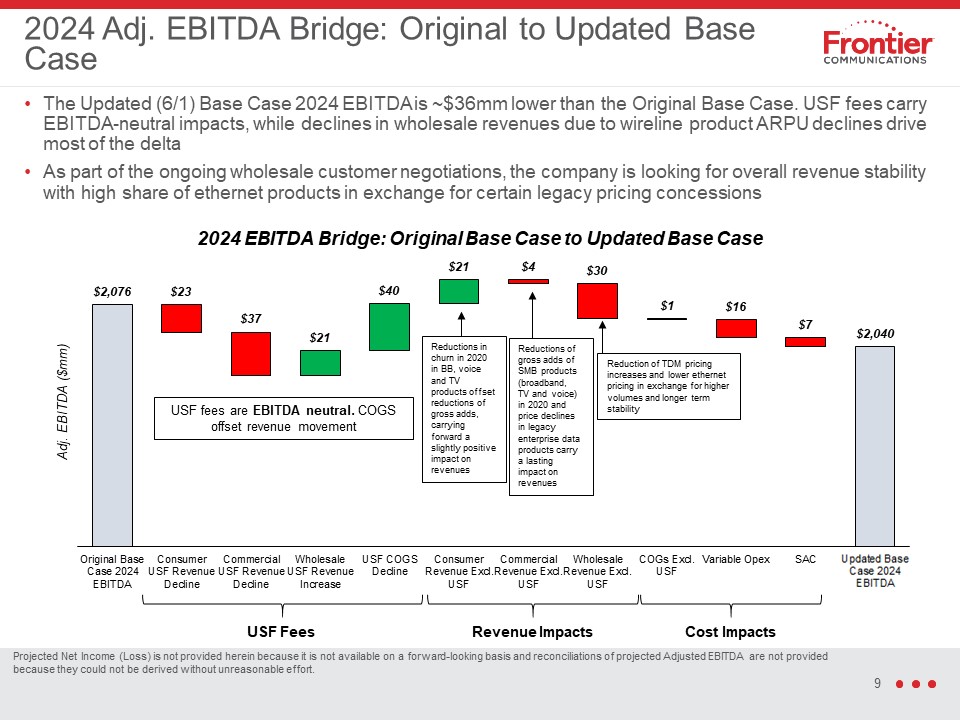
2024 Adj. EBITDA Bridge: Original to Updated Base Case The Updated (6/1) Base Case 2024 EBITDA is
~$36mm lower than the Original Base Case. USF fees carry EBITDA-neutral impacts, while declines in wholesale revenues due to wireline product ARPU declines drive most of the deltaAs part of the ongoing wholesale customer negotiations, the
company is looking for overall revenue stability with high share of ethernet products in exchange for certain legacy pricing concessions USF fees are EBITDA neutral. COGS offset revenue movement USF Fees Revenue Impacts Cost
Impacts Reductions of gross adds of SMB products (broadband, TV and voice) in 2020 and price declines in legacy enterprise data products carry a lasting impact on revenues Reductions in churn in 2020 in BB, voice and TV products offset
reductions of gross adds, carrying forward a slightly positive impact on revenues Reduction of TDM pricing increases and lower ethernet pricing in exchange for higher volumes and longer term stability Projected Net Income (Loss) is not
provided herein because it is not available on a forward-looking basis and reconciliations of projected Adjusted EBITDA are not provided because they could not be derived without unreasonable effort.
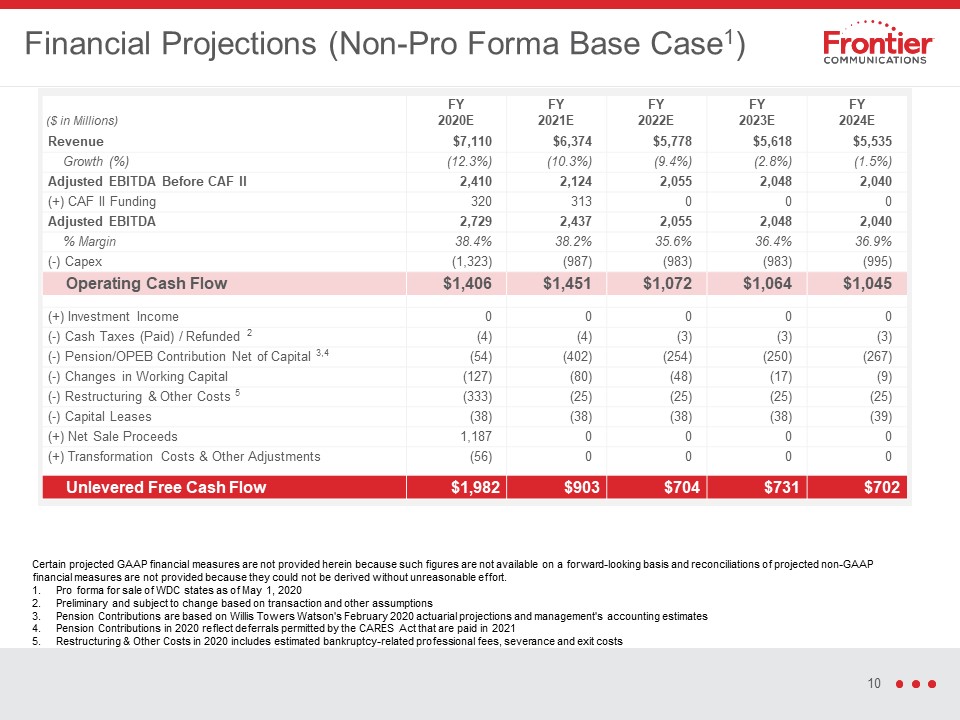
($ in
Millions) FY2020E FY2021E FY2022E FY2023E FY2024E Revenue $7,110 $6,374 $5,778 $5,618 $5,535 Growth (%) (12.3%) (10.3%) (9.4%) (2.8%) (1.5%) Adjusted EBITDA Before CAF II 2,410 2,124 2,055 2,048 2,040 (+) CAF II
Funding 320 313 0 0 0 Adjusted EBITDA 2,729 2,437 2,055 2,048 2,040 % Margin 38.4% 38.2% 35.6% 36.4% 36.9% (-) Capex (1,323) (987) (983) (983) (995) Operating Cash
Flow $1,406 $1,451 $1,072 $1,064 $1,045 (+) Investment Income 0 0 0 0 0 (-) Cash Taxes (Paid) / Refunded 2 (4) (4) (3) (3) (3) (-) Pension/OPEB Contribution Net of Capital
3,4 (54) (402) (254) (250) (267) (-) Changes in Working Capital (127) (80) (48) (17) (9) (-) Restructuring & Other Costs 5 (333) (25) (25) (25) (25) (-) Capital Leases (38) (38) (38) (38) (39) (+) Net Sale
Proceeds 1,187 0 0 0 0 (+) Transformation Costs & Other Adjustments (56) 0 0 0 0 Unlevered Free Cash Flow $1,982 $903 $704 $731 $702 Financial Projections (Non-Pro Forma Base Case1) Certain projected GAAP
financial measures are not provided herein because such figures are not available on a forward-looking basis and reconciliations of projected non-GAAP financial measures are not provided because they could not be derived without unreasonable
effort. Pro forma for sale of WDC states as of May 1, 2020Preliminary and subject to change based on transaction and other assumptionsPension Contributions are based on Willis Towers Watson's February 2020 actuarial projections and
management's accounting estimatesPension Contributions in 2020 reflect deferrals permitted by the CARES Act that are paid in 2021Restructuring & Other Costs in 2020 includes estimated bankruptcy-related professional fees, severance and
exit costs
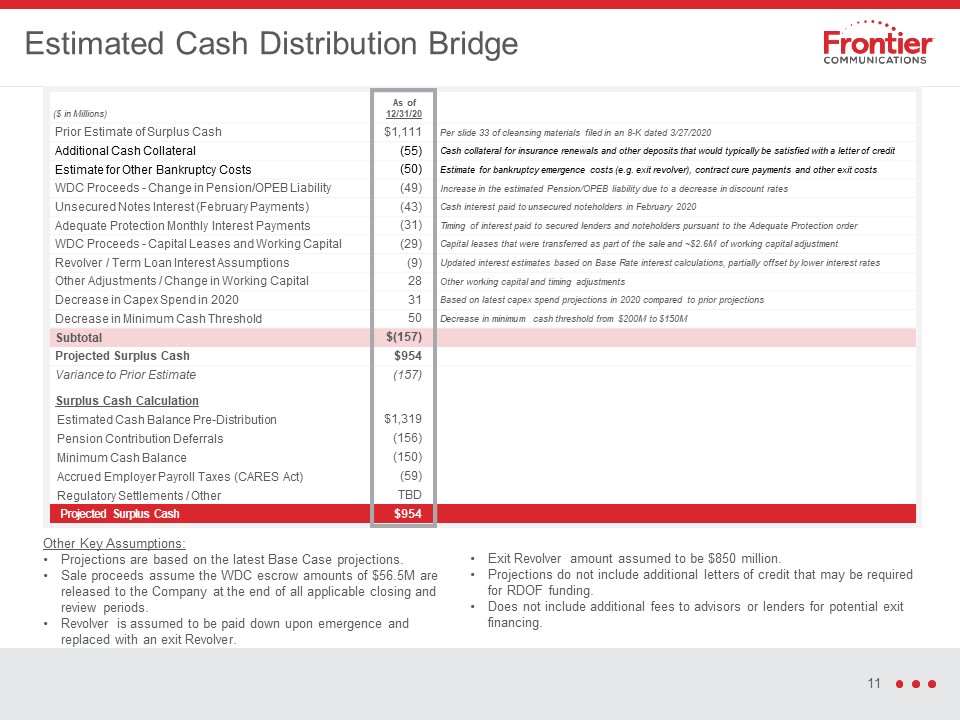
($ in Millions) As of12/31/20 Prior Estimate of Surplus Cash $1,111 Per slide 33 of cleansing
materials filed in an 8-K dated 3/27/2020 Additional Cash Collateral (55) Cash collateral for insurance renewals and other deposits that would typically be satisfied with a letter of credit Estimate for Other Bankruptcy
Costs (50) Estimate for bankruptcy emergence costs (e.g. exit revolver), contract cure payments and other exit costs WDC Proceeds - Change in Pension/OPEB Liability (49) Increase in the estimated Pension/OPEB liability due to a decrease
in discount rates Unsecured Notes Interest (February Payments) (43) Cash interest paid to unsecured noteholders in February 2020 Adequate Protection Monthly Interest Payments (31) Timing of interest paid to secured lenders and
noteholders pursuant to the Adequate Protection order WDC Proceeds - Capital Leases and Working Capital (29) Capital leases that were transferred as part of the sale and ~$2.6M of working capital adjustment Revolver / Term Loan Interest
Assumptions (9) Updated interest estimates based on Base Rate interest calculations, partially offset by lower interest rates Other Adjustments / Change in Working Capital 28 Other working capital and timing adjustments Decrease in
Capex Spend in 2020 31 Based on latest capex spend projections in 2020 compared to prior projections Decrease in Minimum Cash Threshold 50 Decrease in minimum cash threshold from $200M to $150M Subtotal $(157) Projected Surplus
Cash $954 Variance to Prior Estimate (157) Surplus Cash Calculation Estimated Cash Balance Pre-Distribution $1,319 Pension Contribution Deferrals (156) Minimum Cash Balance (150) Accrued Employer Payroll
Taxes (CARES Act) (59) Regulatory Settlements / Other TBD Projected Surplus Cash $954 Estimated Cash Distribution Bridge Other Key Assumptions:Projections are based on the latest Base Case projections.Sale proceeds assume the
WDC escrow amounts of $56.5M are released to the Company at the end of all applicable closing and review periods.Revolver is assumed to be paid down upon emergence and replaced with an exit Revolver. Exit Revolver amount assumed to be
$850 million.Projections do not include additional letters of credit that may be required for RDOF funding.Does not include additional fees to advisors or lenders for potential exit financing.
Updated Reinvestment Case
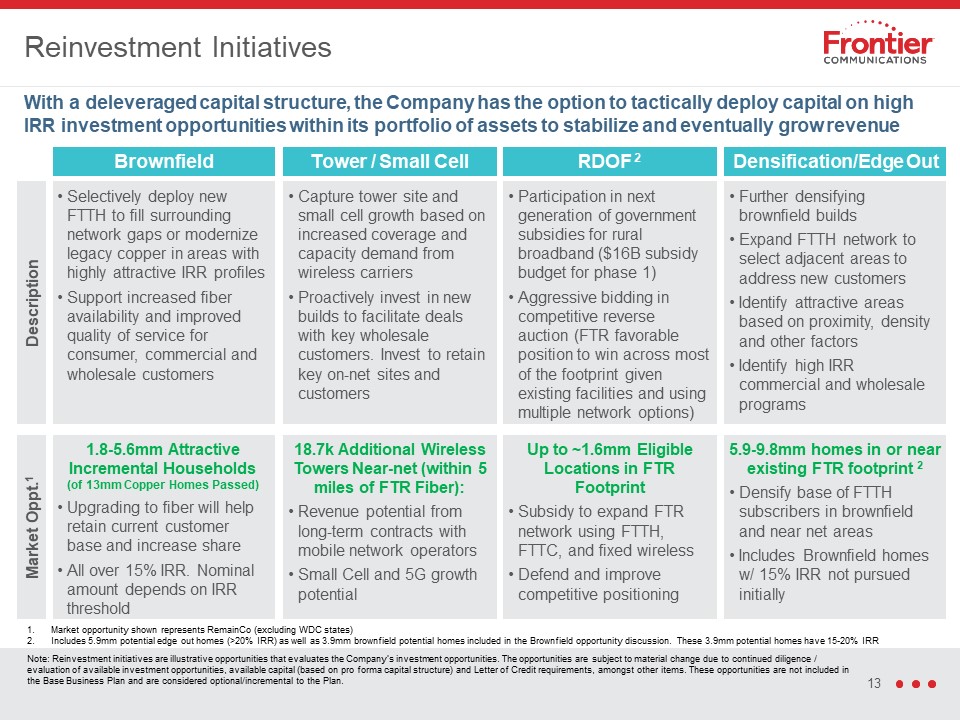
With a deleveraged capital structure, the Company has the option to tactically deploy capital on high
IRR investment opportunities within its portfolio of assets to stabilize and eventually grow revenue Market opportunity shown represents RemainCo (excluding WDC states)Includes 5.9mm potential edge out homes (>20% IRR) as well as 3.9mm
brownfield potential homes included in the Brownfield opportunity discussion. These 3.9mm potential homes have 15-20% IRR Reinvestment Initiatives Brownfield Densification/Edge Out Tower / Small Cell RDOF 2 Description Selectively
deploy new FTTH to fill surrounding network gaps or modernize legacy copper in areas with highly attractive IRR profilesSupport increased fiber availability and improved quality of service for consumer, commercial and wholesale
customers Further densifying brownfield buildsExpand FTTH network to select adjacent areas to address new customersIdentify attractive areas based on proximity, density and other factorsIdentify high IRR commercial and wholesale
programs Capture tower site and small cell growth based on increased coverage and capacity demand from wireless carriersProactively invest in new builds to facilitate deals with key wholesale customers. Invest to retain key on-net sites and
customers Participation in next generation of government subsidies for rural broadband ($16B subsidy budget for phase 1)Aggressive bidding in competitive reverse auction (FTR favorable position to win across most of the footprint given
existing facilities and using multiple network options) Market Oppt.1 1.8-5.6mm Attractive Incremental Households(of 13mm Copper Homes Passed)Upgrading to fiber will help retain current customer base and increase shareAll over 15% IRR.
Nominal amount depends on IRR threshold 5.9-9.8mm homes in or near existing FTR footprint 2Densify base of FTTH subscribers in brownfield and near net areasIncludes Brownfield homes w/ 15% IRR not pursued initially 18.7k Additional Wireless
Towers Near-net (within 5 miles of FTR Fiber):Revenue potential from long-term contracts with mobile network operatorsSmall Cell and 5G growth potential Up to ~1.6mm Eligible Locations in FTR FootprintSubsidy to expand FTR network using
FTTH, FTTC, and fixed wirelessDefend and improve competitive positioning Note: Reinvestment initiatives are illustrative opportunities that evaluates the Company’s investment opportunities. The opportunities are subject to material change
due to continued diligence / evaluation of available investment opportunities, available capital (based on pro forma capital structure) and Letter of Credit requirements, amongst other items. These opportunities are not included in the Base
Business Plan and are considered optional/incremental to the Plan.
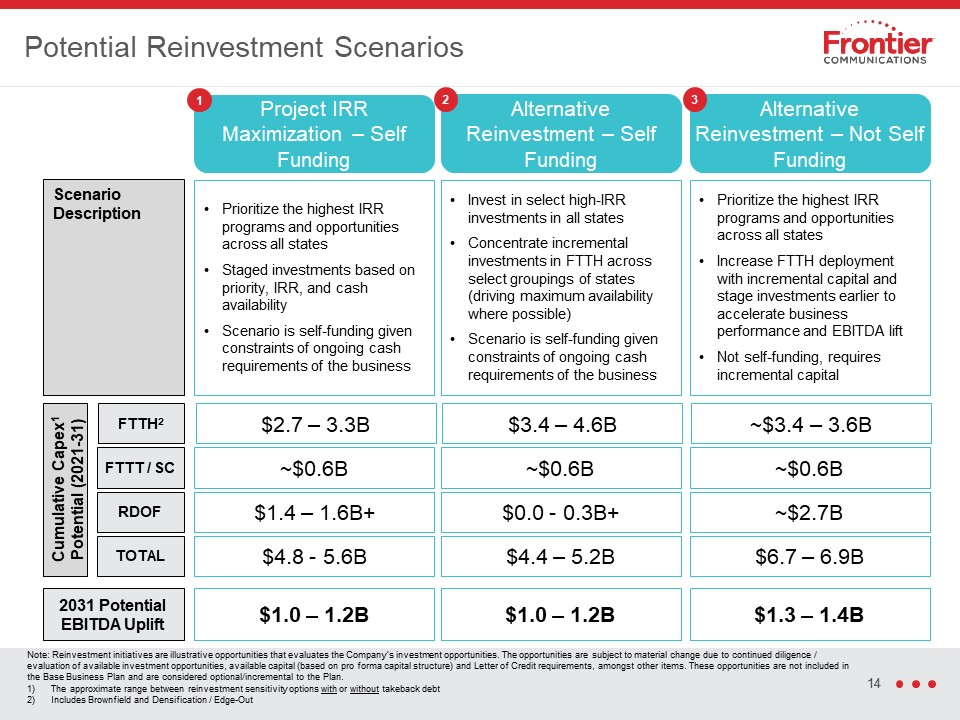
Potential Reinvestment Scenarios Prioritize the highest IRR programs and opportunities across all
statesIncrease FTTH deployment with incremental capital and stage investments earlier to accelerate business performance and EBITDA liftNot self-funding, requires incremental capital Project IRR Maximization – Self Funding Alternative
Reinvestment – Self Funding Invest in select high-IRR investments in all states Concentrate incremental investments in FTTH across select groupings of states (driving maximum availability where possible)Scenario is self-funding given
constraints of ongoing cash requirements of the business Prioritize the highest IRR programs and opportunities across all statesStaged investments based on priority, IRR, and cash availabilityScenario is self-funding given constraints of
ongoing cash requirements of the business Scenario Description Cumulative Capex1 Potential (2021-31) FTTH2 FTTT / SC RDOF TOTAL ~$3.4 – 3.6B $3.4 – 4.6B $2.7 – 3.3B ~$0.6B ~$0.6B ~$0.6B ~$2.7B $0.0 - 0.3B+ $1.4 – 1.6B+ $6.7 –
6.9B $4.4 – 5.2B $4.8 - 5.6B Note: Reinvestment initiatives are illustrative opportunities that evaluates the Company’s investment opportunities. The opportunities are subject to material change due to continued diligence / evaluation of
available investment opportunities, available capital (based on pro forma capital structure) and Letter of Credit requirements, amongst other items. These opportunities are not included in the Base Business Plan and are considered
optional/incremental to the Plan.The approximate range between reinvestment sensitivity options with or without takeback debtIncludes Brownfield and Densification / Edge-Out 1 2 Alternative Reinvestment – Not Self Funding 3 2031
Potential EBITDA Uplift $1.3 – 1.4B $1.0 – 1.2B $1.0 – 1.2B
Brownfield(~30% IRR) Concentrated RDOF (~25% IRR) Concentrated RDOF (~30% IRR) Densification /
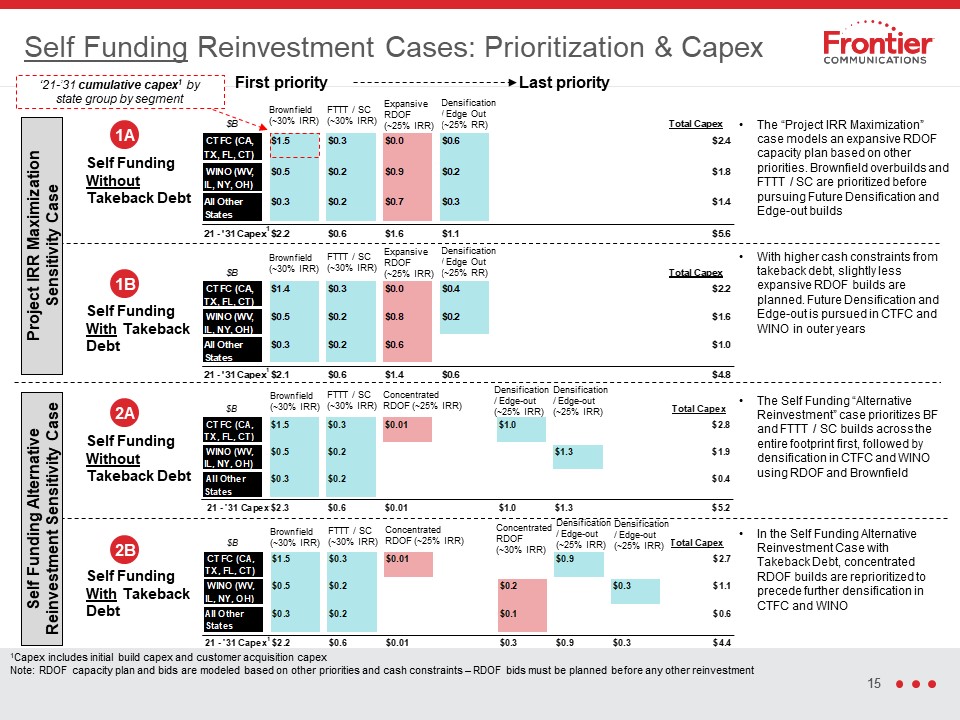
Edge-out(~25% IRR) Densification / Edge-out(~25% IRR) FTTT / SC(~30% IRR) Densification / Edge Out (~25% RR) Brownfield(~30% IRR) Expansive RDOF (~25% IRR) FTTT / SC (~30% IRR) Self Funding Reinvestment Cases: Prioritization &
Capex First priority Last priority Self Funding Without Takeback Debt The Self Funding “Alternative Reinvestment” case prioritizes BF and FTTT / SC builds across the entire footprint first, followed by densification in CTFC and WINO using
RDOF and Brownfield In the Self Funding Alternative Reinvestment Case with Takeback Debt, concentrated RDOF builds are reprioritized to precede further densification in CTFC and WINO Self Funding With Takeback Debt 1Capex includes initial
build capex and customer acquisition capexNote: RDOF capacity plan and bids are modeled based on other priorities and cash constraints – RDOF bids must be planned before any other reinvestment Self Funding Alternative Reinvestment
Sensitivity Case Self Funding With Takeback Debt Self Funding Without Takeback Debt Project IRR Maximization Sensitivity Case ‘21-’31 cumulative capex1 by state group by segment The “Project IRR Maximization” case models an expansive
RDOF capacity plan based on other priorities. Brownfield overbuilds and FTTT / SC are prioritized before pursuing Future Densification and Edge-out builds With higher cash constraints from takeback debt, slightly less expansive RDOF builds
are planned. Future Densification and Edge-out is pursued in CTFC and WINO in outer years 1A 1B 2A 2B Brownfield(~30% IRR) Concentrated RDOF (~25% IRR) Densification / Edge-out(~25% IRR) Densification / Edge-out(~25% IRR) FTTT /
SC(~30% IRR) Densification / Edge Out (~25% RR) Brownfield(~30% IRR) Expansive RDOF (~25% IRR) FTTT / SC (~30% IRR)
Densification / Edge Out(~25% IRR) Brownfield(~30% IRR) Expansive RDOF (~25% IRR) FTTT / SC(~30%
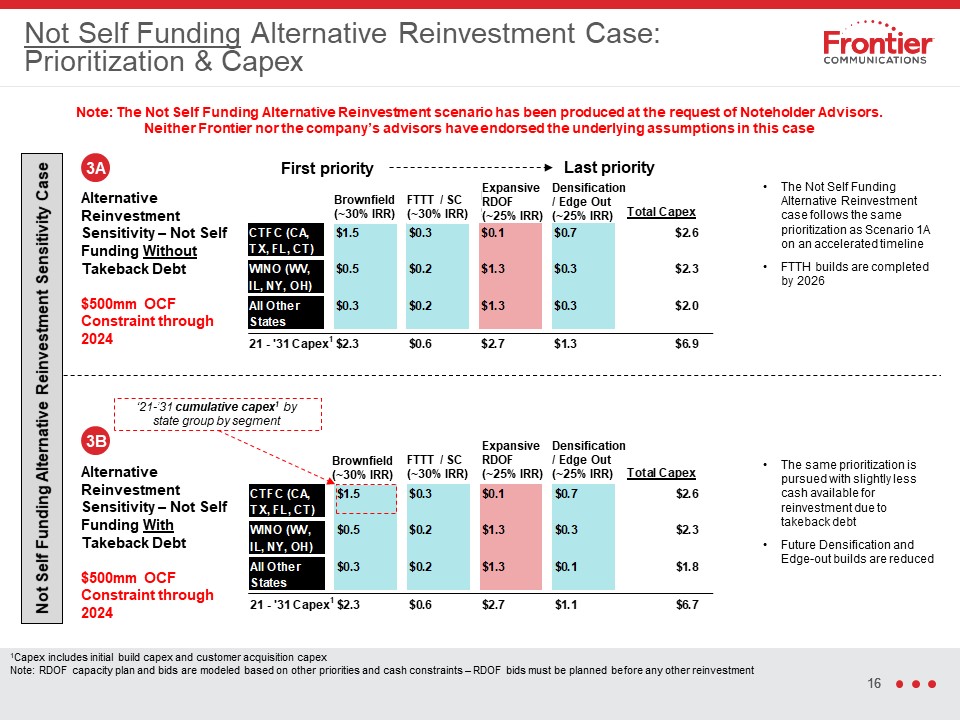
IRR) Not Self Funding Alternative Reinvestment Case: Prioritization & Capex Alternative Reinvestment Sensitivity – Not Self Funding With Takeback Debt$500mm OCF Constraint through 2024 The same prioritization is pursued with slightly
less cash available for reinvestment due to takeback debtFuture Densification and Edge-out builds are reduced ‘21-’31 cumulative capex1 by state group by segment First priority Last priority Alternative Reinvestment Sensitivity – Not Self
Funding Without Takeback Debt$500mm OCF Constraint through 2024 The Not Self Funding Alternative Reinvestment case follows the same prioritization as Scenario 1A on an accelerated timelineFTTH builds are completed by 2026 Note: The Not Self
Funding Alternative Reinvestment scenario has been produced at the request of Noteholder Advisors. Neither Frontier nor the company’s advisors have endorsed the underlying assumptions in this case 3A 3B Not Self Funding Alternative
Reinvestment Sensitivity Case Densification / Edge Out(~25% IRR) Brownfield(~30% IRR) Expansive RDOF (~25% IRR) FTTT / SC(~30% IRR) 1Capex includes initial build capex and customer acquisition capexNote: RDOF capacity plan and bids are
modeled based on other priorities and cash constraints – RDOF bids must be planned before any other reinvestment
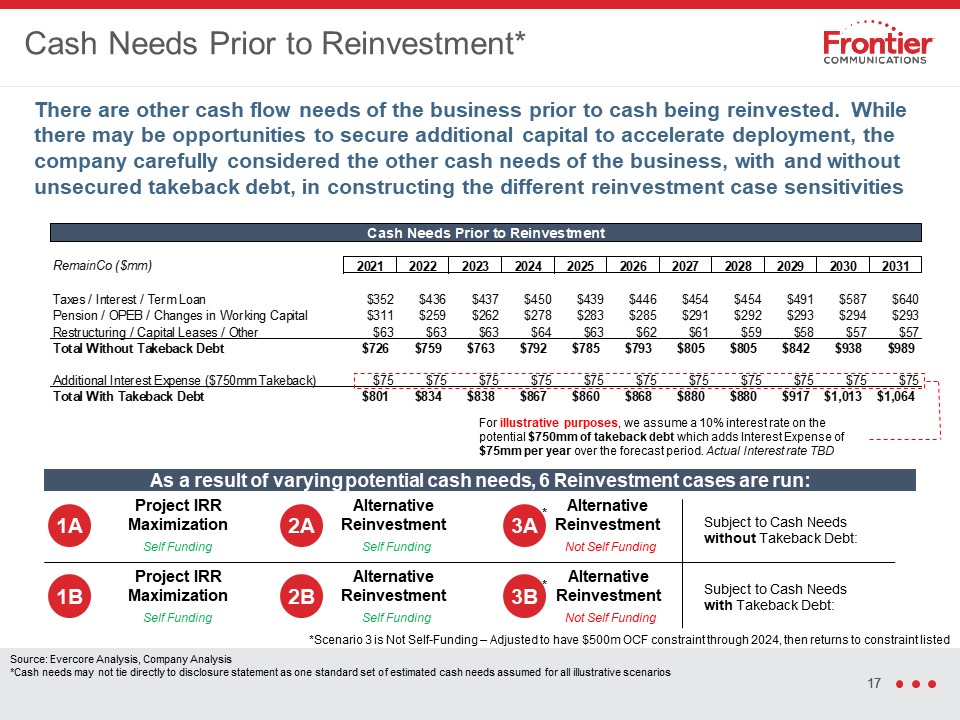
There are other cash flow needs of the business prior to cash being reinvested. While there may be
opportunities to secure additional capital to accelerate deployment, the company carefully considered the other cash needs of the business, with and without unsecured takeback debt, in constructing the different reinvestment case
sensitivities Cash Needs Prior to Reinvestment* For illustrative purposes, we assume a 10% interest rate on the potential $750mm of takeback debt which adds Interest Expense of $75mm per year over the forecast period. Actual Interest rate
TBD Source: Evercore Analysis, Company Analysis*Cash needs may not tie directly to disclosure statement as one standard set of estimated cash needs assumed for all illustrative scenarios 1A 2A 3A 1B 2B 3B Subject to Cash Needs with
Takeback Debt: Subject to Cash Needs without Takeback Debt: *Scenario 3 is Not Self-Funding – Adjusted to have $500m OCF constraint through 2024, then returns to constraint listed * * As a result of varying potential cash needs, 6
Reinvestment cases are run: Project IRR Maximization Self Funding Alternative Reinvestment Self Funding Alternative Reinvestment Not Self Funding Project IRR Maximization Self Funding Alternative Reinvestment Self
Funding Alternative Reinvestment Not Self Funding
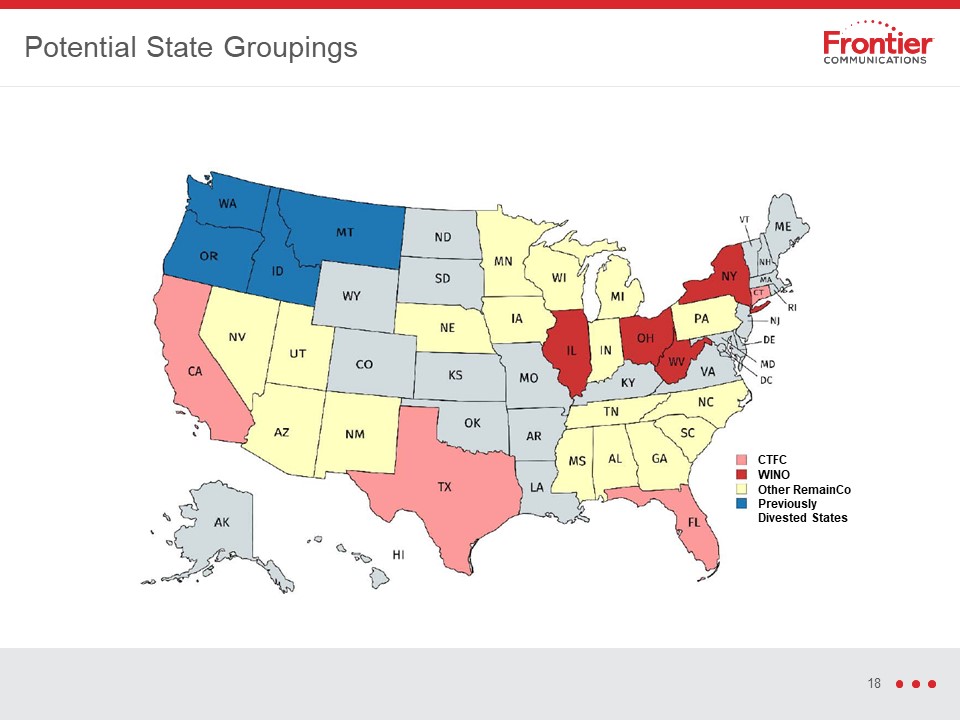
Potential State Groupings CTFC WINO Other RemainCo Previously Divested States
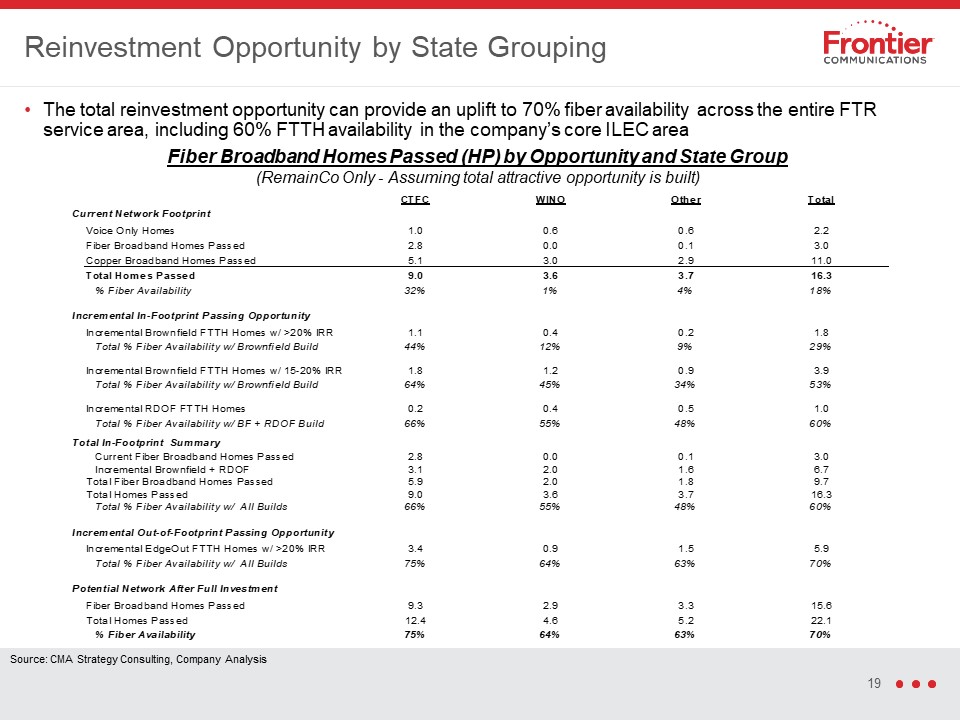
Reinvestment Opportunity by State Grouping The total reinvestment opportunity can provide an uplift to
70% fiber availability across the entire FTR service area, including 60% FTTH availability in the company’s core ILEC area Fiber Broadband Homes Passed (HP) by Opportunity and State Group(RemainCo Only - Assuming total attractive opportunity
is built) Source: CMA Strategy Consulting, Company Analysis
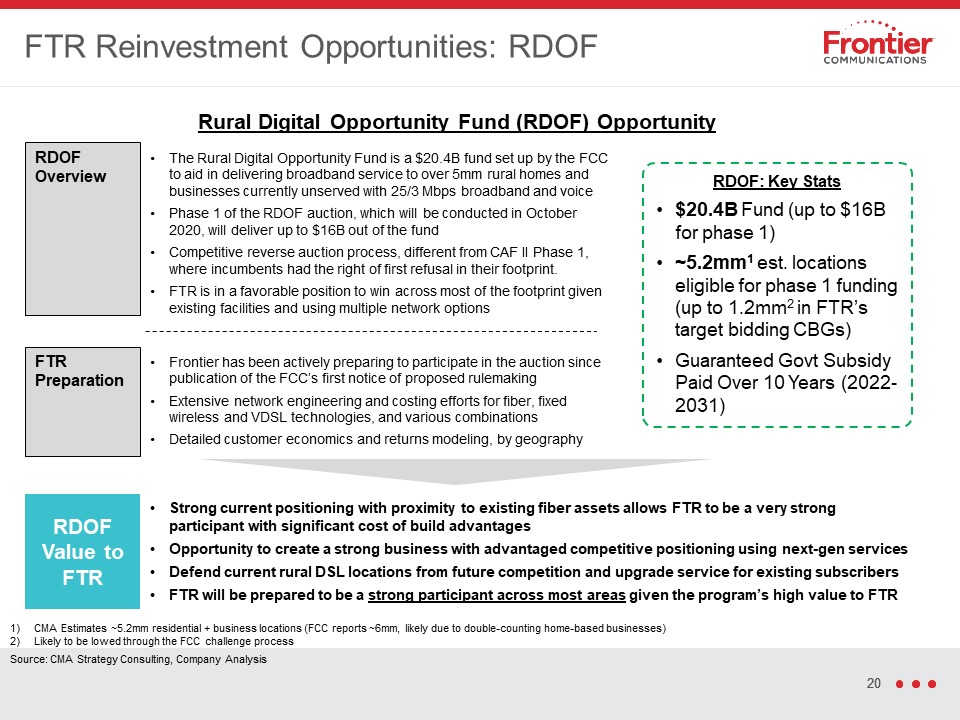
FTR Reinvestment Opportunities: RDOF Strong current positioning with proximity to existing fiber
assets allows FTR to be a very strong participant with significant cost of build advantagesOpportunity to create a strong business with advantaged competitive positioning using next-gen servicesDefend current rural DSL locations from future
competition and upgrade service for existing subscribers FTR will be prepared to be a strong participant across most areas given the program’s high value to FTR The Rural Digital Opportunity Fund is a $20.4B fund set up by the FCC to aid in
delivering broadband service to over 5mm rural homes and businesses currently unserved with 25/3 Mbps broadband and voicePhase 1 of the RDOF auction, which will be conducted in October 2020, will deliver up to $16B out of the fundCompetitive
reverse auction process, different from CAF II Phase 1, where incumbents had the right of first refusal in their footprint. FTR is in a favorable position to win across most of the footprint given existing facilities and using multiple
network options RDOF Value to FTR Frontier has been actively preparing to participate in the auction since publication of the FCC’s first notice of proposed rulemakingExtensive network engineering and costing efforts for fiber, fixed
wireless and VDSL technologies, and various combinations Detailed customer economics and returns modeling, by geography FTR Preparation RDOF: Key Stats$20.4B Fund (up to $16B for phase 1)~5.2mm1 est. locations eligible for phase 1 funding
(up to 1.2mm2 in FTR’s target bidding CBGs)Guaranteed Govt Subsidy Paid Over 10 Years (2022-2031) Rural Digital Opportunity Fund (RDOF) Opportunity RDOF Overview CMA Estimates ~5.2mm residential + business locations (FCC reports ~6mm,
likely due to double-counting home-based businesses)Likely to be lowed through the FCC challenge process Source: CMA Strategy Consulting, Company Analysis
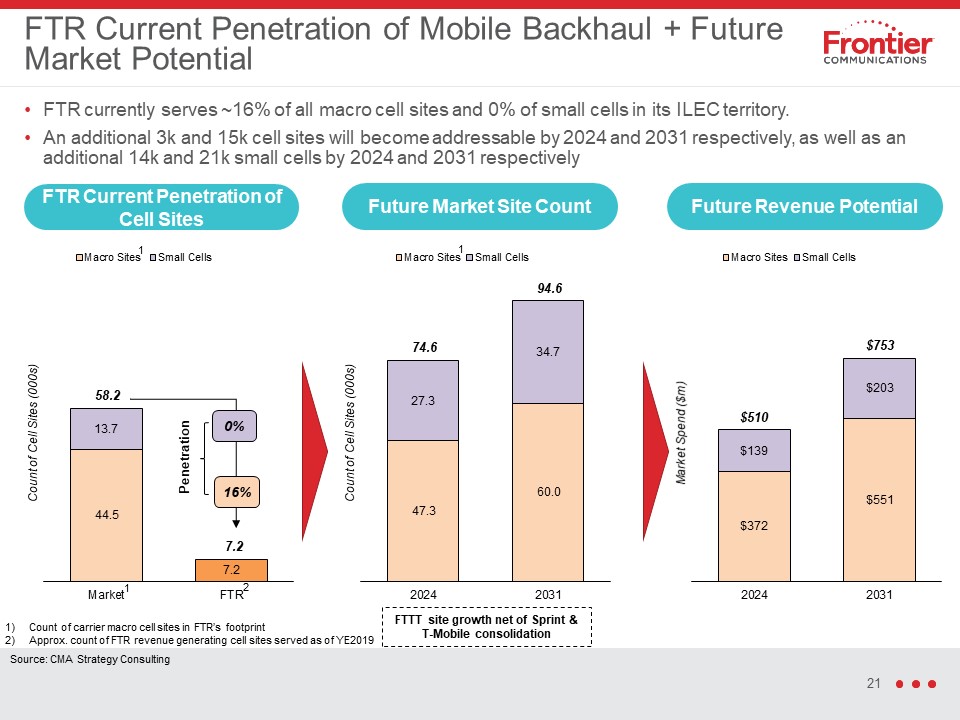
FTR currently serves ~16% of all macro cell sites and 0% of small cells in its ILEC territory.An
additional 3k and 15k cell sites will become addressable by 2024 and 2031 respectively, as well as an additional 14k and 21k small cells by 2024 and 2031 respectively FTR Current Penetration of Mobile Backhaul + Future Market
Potential FTR Current Penetration of Cell Sites 0% 16% Penetration Future Market Site Count Future Revenue Potential 2 1 1 1 FTTT site growth net of Sprint & T-Mobile consolidation Count of carrier macro cell sites in
FTR’s footprintApprox. count of FTR revenue generating cell sites served as of YE2019 Source: CMA Strategy Consulting
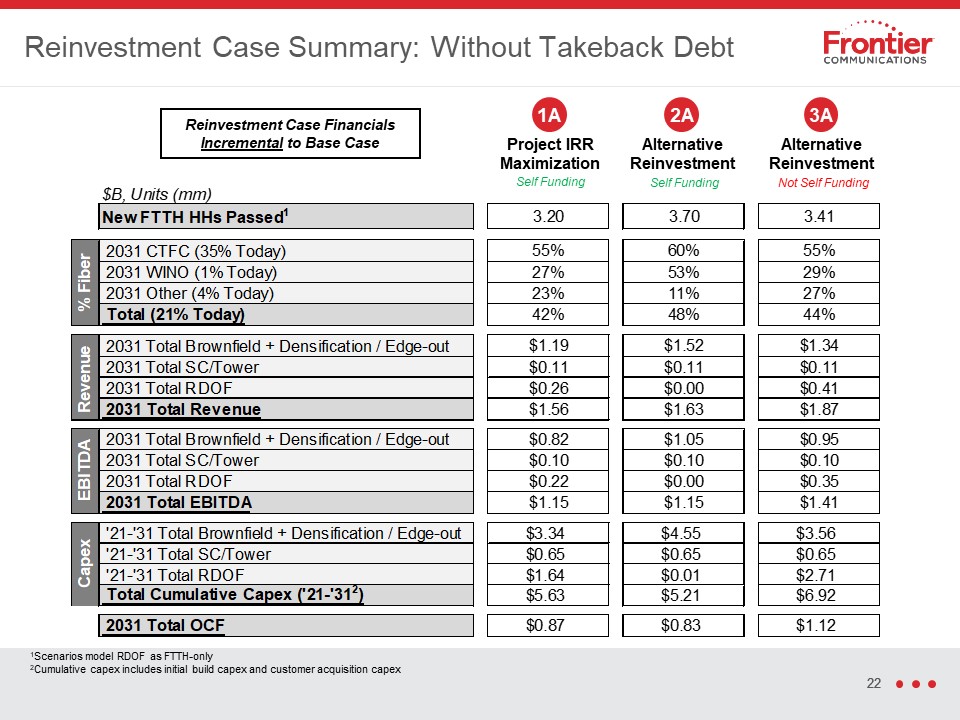
Reinvestment Case Summary: Without Takeback Debt 1Scenarios model RDOF as FTTH-only2Cumulative capex
includes initial build capex and customer acquisition capex Project IRR Maximization Self Funding Alternative Reinvestment Self Funding 1A 2A Alternative Reinvestment Not Self Funding 3A Reinvestment Case Financials Incremental to
Base Case
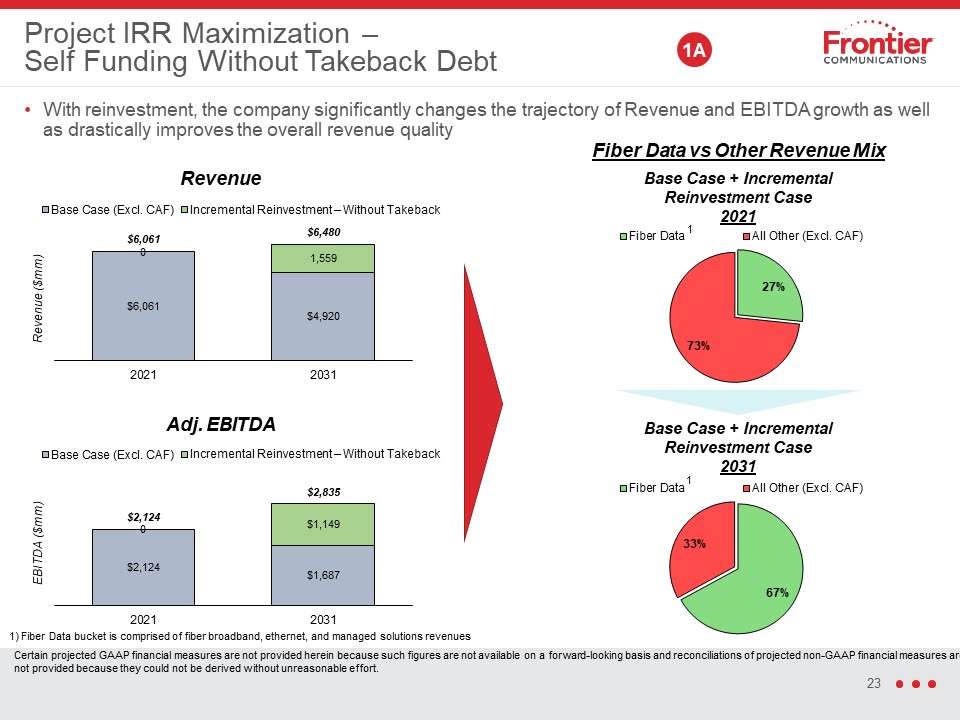
Project IRR Maximization – Self Funding Without Takeback Debt With reinvestment, the company
significantly changes the trajectory of Revenue and EBITDA growth as well as drastically improves the overall revenue quality Fiber Data vs Other Revenue Mix 1A Base Case + Incremental Reinvestment Case2021 1 1) Fiber Data bucket is
comprised of fiber broadband, ethernet, and managed solutions revenues Base Case + Incremental Reinvestment Case2031 1 Incremental Reinvestment – Without Takeback Incremental Reinvestment – Without Takeback Certain projected GAAP
financial measures are not provided herein because such figures are not available on a forward-looking basis and reconciliations of projected non-GAAP financial measures are not provided because they could not be derived without unreasonable
effort.
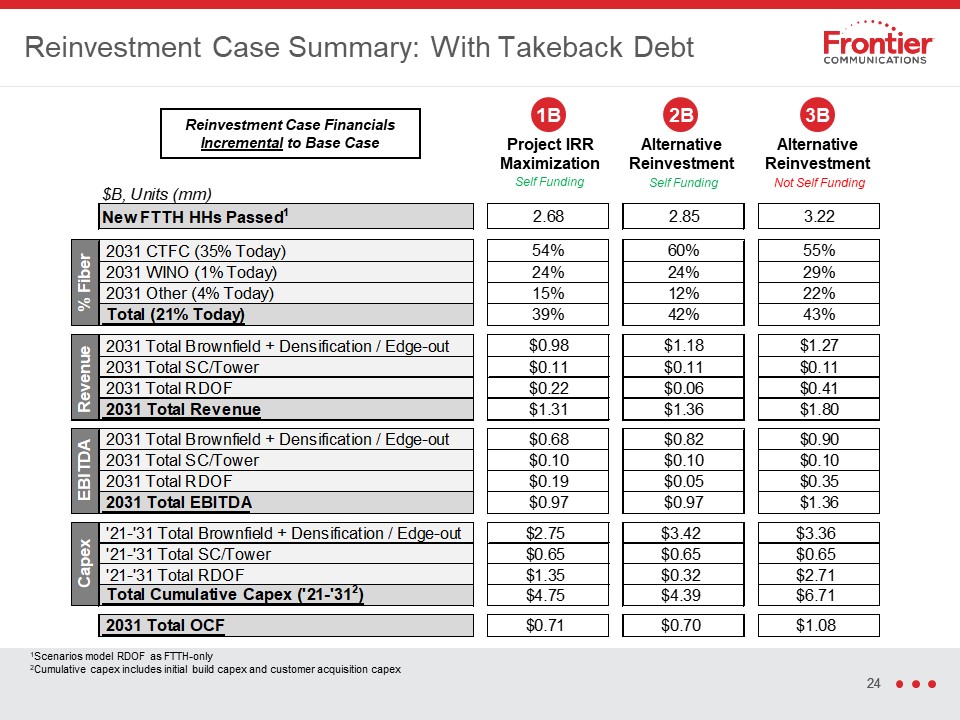
Reinvestment Case Summary: With Takeback Debt Project IRR Maximization Self Funding Alternative
Reinvestment Self Funding 1B 2B Alternative Reinvestment Not Self Funding 3B Reinvestment Case Financials Incremental to Base Case 1Scenarios model RDOF as FTTH-only2Cumulative capex includes initial build capex and customer
acquisition capex
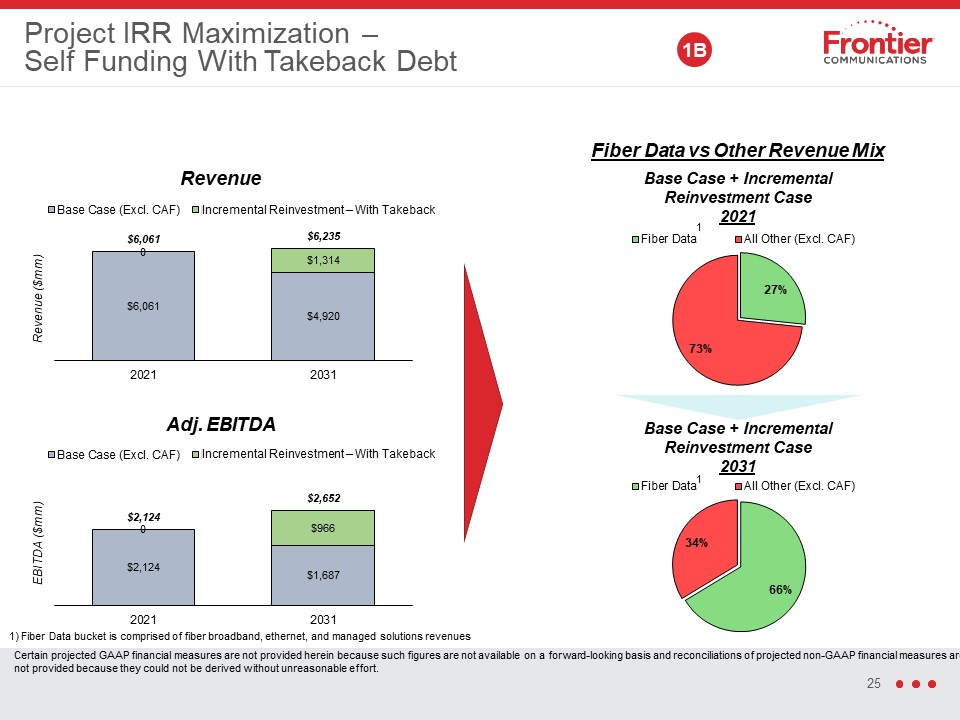
Project IRR Maximization – Self Funding With Takeback Debt 1B 1) Fiber Data bucket is comprised
of fiber broadband, ethernet, and managed solutions revenues Base Case + Incremental Reinvestment Case2021 1 Base Case + Incremental Reinvestment Case2031 1 Fiber Data vs Other Revenue Mix Incremental Reinvestment – With
Takeback Incremental Reinvestment – With Takeback Certain projected GAAP financial measures are not provided herein because such figures are not available on a forward-looking basis and reconciliations of projected non-GAAP financial
measures are not provided because they could not be derived without unreasonable effort.
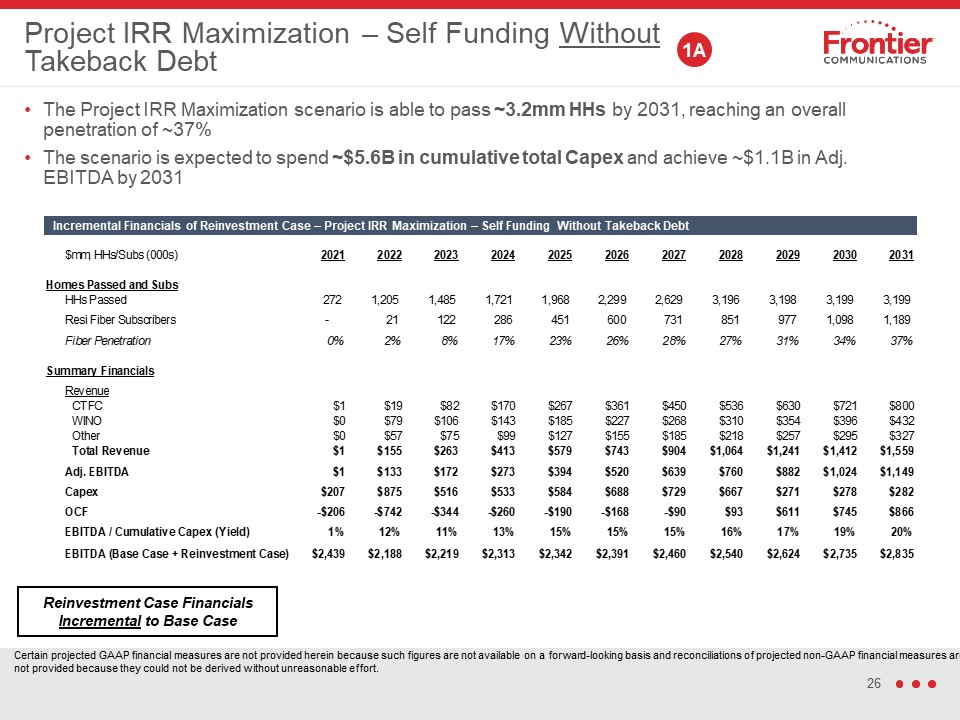
Project IRR Maximization – Self Funding Without Takeback Debt The Project IRR Maximization scenario is
able to pass ~3.2mm HHs by 2031, reaching an overall penetration of ~37%The scenario is expected to spend ~$5.6B in cumulative total Capex and achieve ~$1.1B in Adj. EBITDA by 2031 1A Incremental Financials of Reinvestment Case – Project
IRR Maximization – Self Funding Without Takeback Debt Reinvestment Case Financials Incremental to Base Case Certain projected GAAP financial measures are not provided herein because such figures are not available on a forward-looking basis
and reconciliations of projected non-GAAP financial measures are not provided because they could not be derived without unreasonable effort.
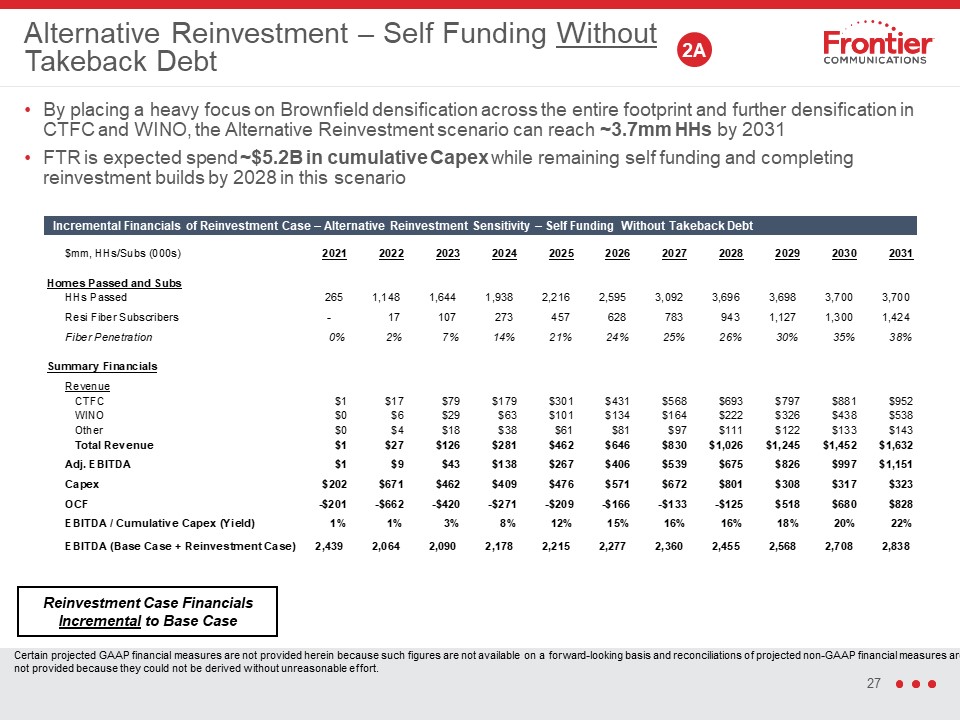
Alternative Reinvestment – Self Funding Without Takeback Debt By placing a heavy focus on Brownfield
densification across the entire footprint and further densification in CTFC and WINO, the Alternative Reinvestment scenario can reach ~3.7mm HHs by 2031FTR is expected spend ~$5.2B in cumulative Capex while remaining self funding and
completing reinvestment builds by 2028 in this scenario 2A Incremental Financials of Reinvestment Case – Alternative Reinvestment Sensitivity – Self Funding Without Takeback Debt Reinvestment Case Financials Incremental to Base
Case Certain projected GAAP financial measures are not provided herein because such figures are not available on a forward-looking basis and reconciliations of projected non-GAAP financial measures are not provided because they could not be
derived without unreasonable effort.
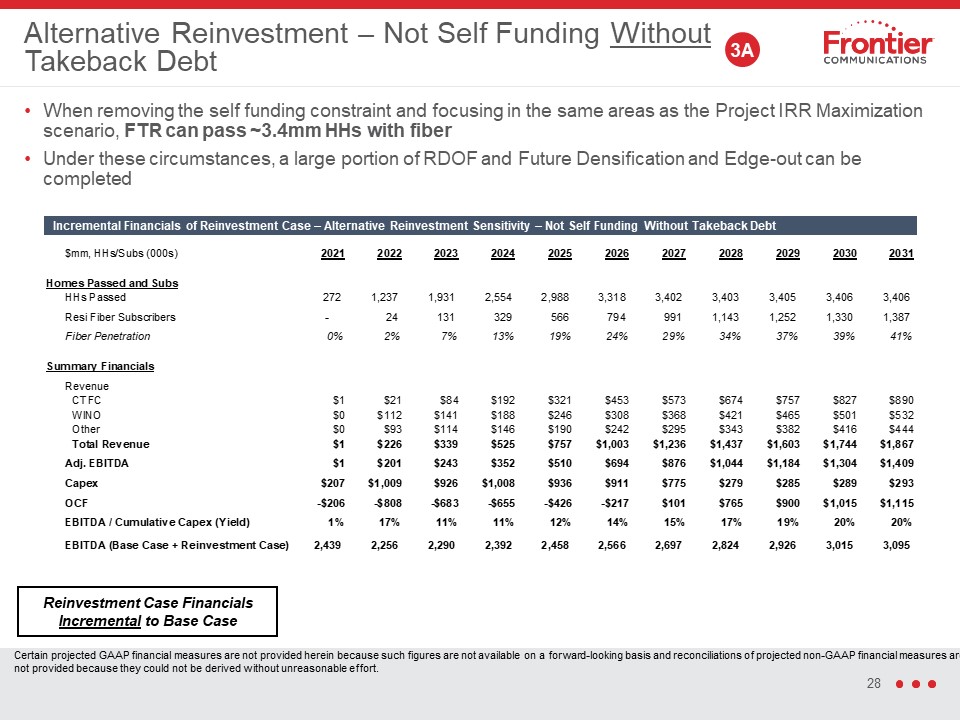
Alternative Reinvestment – Not Self Funding Without Takeback Debt When removing the self funding
constraint and focusing in the same areas as the Project IRR Maximization scenario, FTR can pass ~3.4mm HHs with fiberUnder these circumstances, a large portion of RDOF and Future Densification and Edge-out can be completed 3A Reinvestment
Case Financials Incremental to Base Case Certain projected GAAP financial measures are not provided herein because such figures are not available on a forward-looking basis and reconciliations of projected non-GAAP financial measures are not
provided because they could not be derived without unreasonable effort. Incremental Financials of Reinvestment Case – Alternative Reinvestment Sensitivity – Not Self Funding Without Takeback Debt
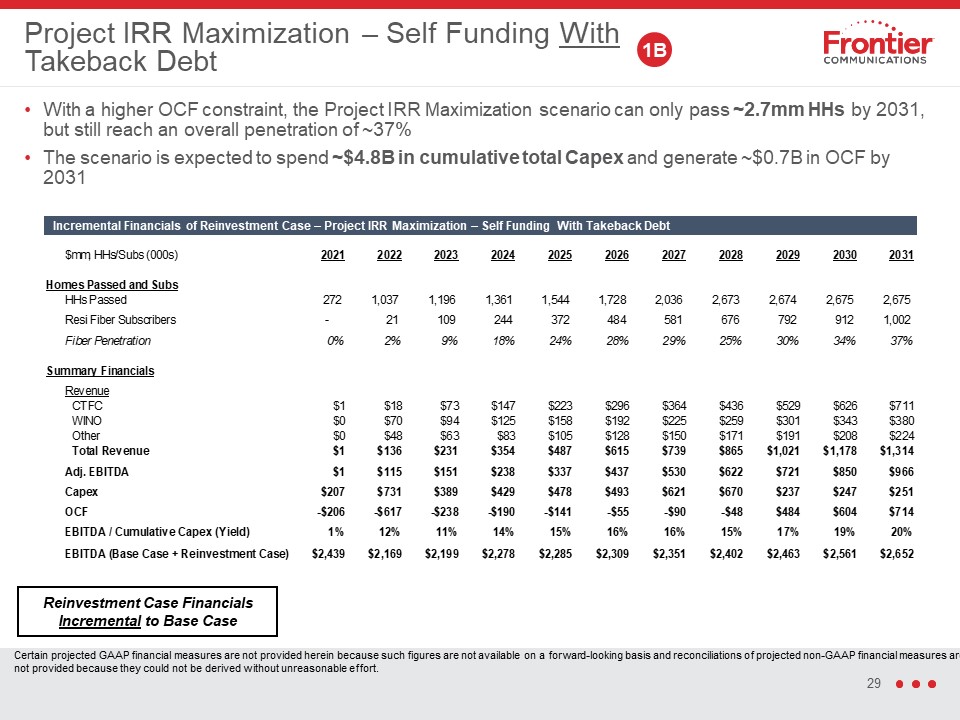
Project IRR Maximization – Self Funding With Takeback Debt With a higher OCF constraint, the Project
IRR Maximization scenario can only pass ~2.7mm HHs by 2031, but still reach an overall penetration of ~37%The scenario is expected to spend ~$4.8B in cumulative total Capex and generate ~$0.7B in OCF by 2031 1B Reinvestment Case Financials
Incremental to Base Case Certain projected GAAP financial measures are not provided herein because such figures are not available on a forward-looking basis and reconciliations of projected non-GAAP financial measures are not provided
because they could not be derived without unreasonable effort. Incremental Financials of Reinvestment Case – Project IRR Maximization – Self Funding With Takeback Debt
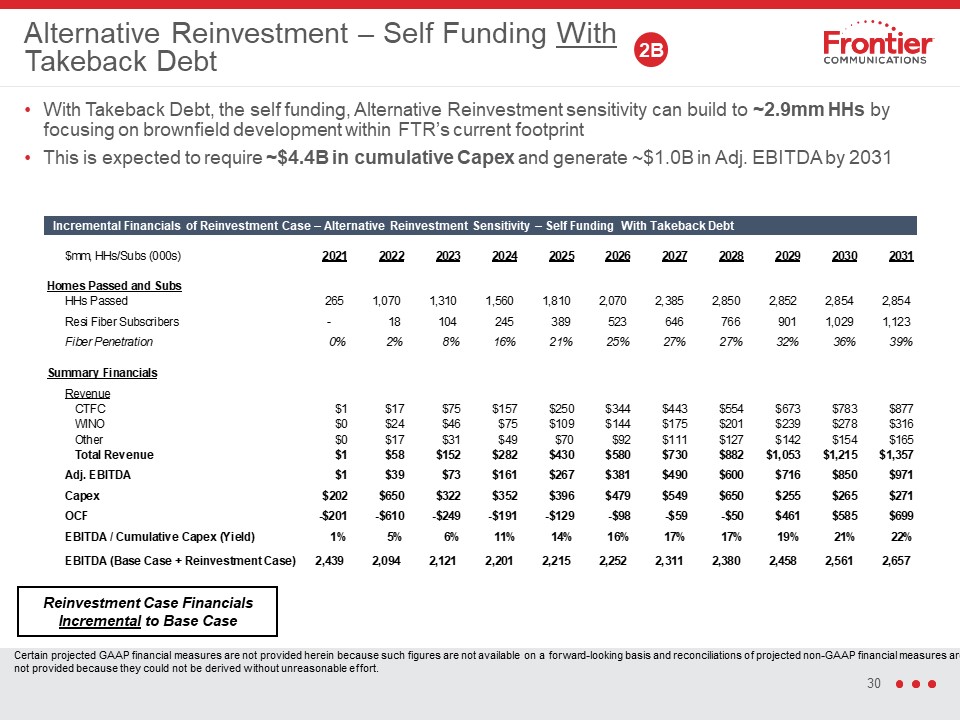
With Takeback Debt, the self funding, Alternative Reinvestment sensitivity can build to ~2.9mm HHs by
focusing on brownfield development within FTR’s current footprintThis is expected to require ~$4.4B in cumulative Capex and generate ~$1.0B in Adj. EBITDA by 2031 Alternative Reinvestment – Self Funding With Takeback Debt 2B Incremental
Financials of Reinvestment Case – Alternative Reinvestment Sensitivity – Self Funding With Takeback Debt Reinvestment Case Financials Incremental to Base Case Certain projected GAAP financial measures are not provided herein because such
figures are not available on a forward-looking basis and reconciliations of projected non-GAAP financial measures are not provided because they could not be derived without unreasonable effort.
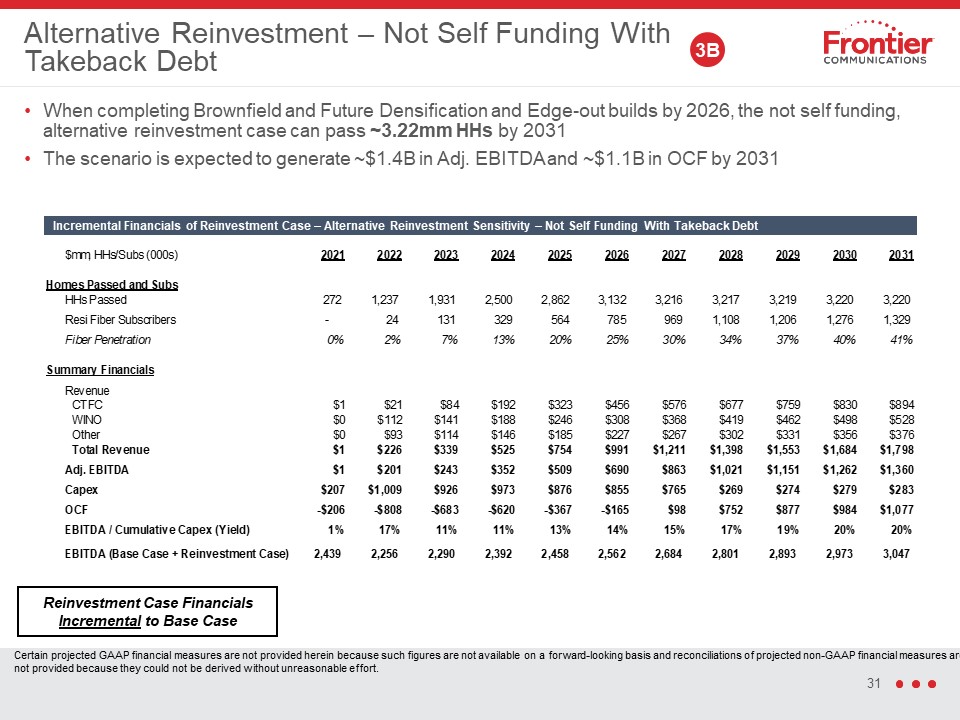
Alternative Reinvestment – Not Self Funding With Takeback Debt When completing Brownfield and Future
Densification and Edge-out builds by 2026, the not self funding, alternative reinvestment case can pass ~3.22mm HHs by 2031The scenario is expected to generate ~$1.4B in Adj. EBITDA and ~$1.1B in OCF by 2031 3B Reinvestment Case Financials
Incremental to Base Case Certain projected GAAP financial measures are not provided herein because such figures are not available on a forward-looking basis and reconciliations of projected non-GAAP financial measures are not provided
because they could not be derived without unreasonable effort. Incremental Financials of Reinvestment Case – Alternative Reinvestment Sensitivity – Not Self Funding With Takeback Debt
Appendix: Non-GAAP Financial Measures
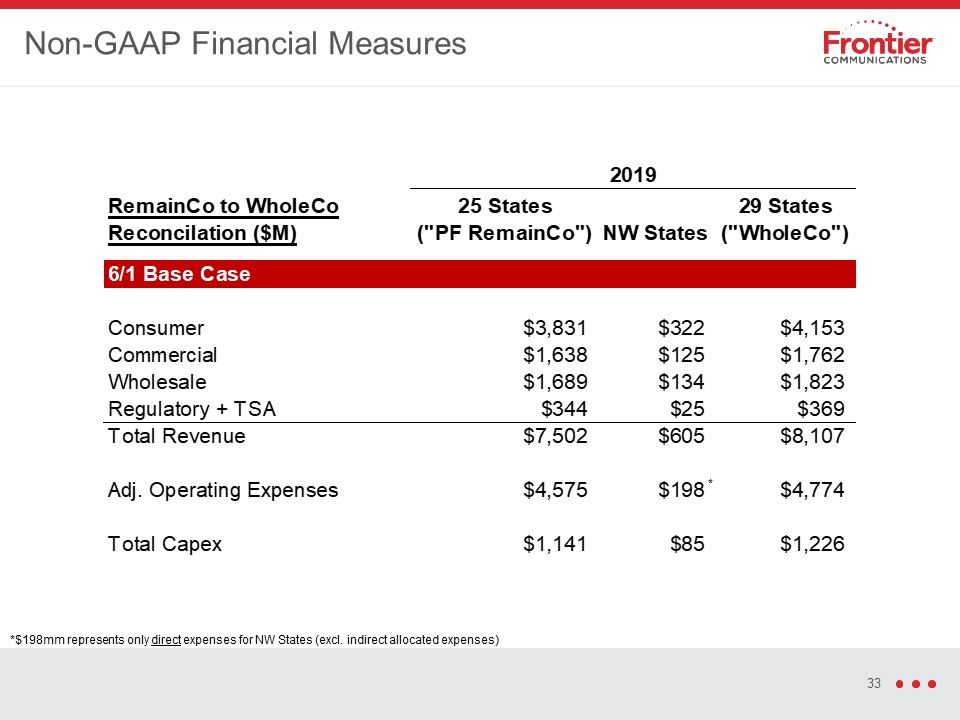
Non-GAAP Financial Measures * *$198mm represents only direct expenses for NW States (excl. indirect
allocated expenses)
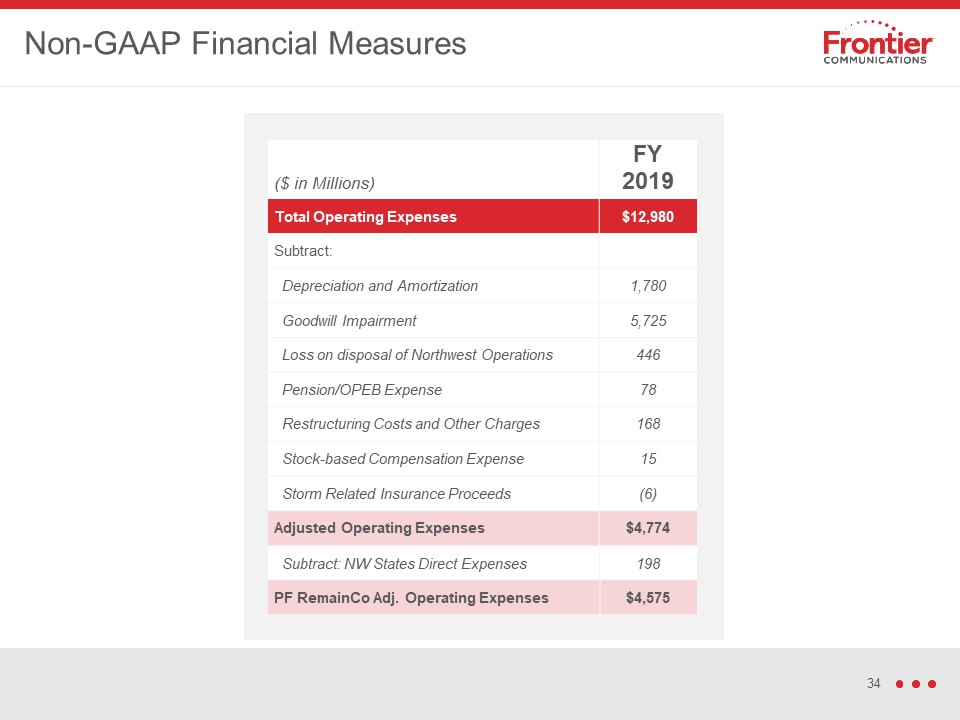
Non-GAAP Financial Measures ($ in Millions) FY2019 Total Operating
Expenses $12,980 Subtract: Depreciation and Amortization 1,780 Goodwill Impairment 5,725 Loss on disposal of Northwest Operations 446 Pension/OPEB Expense 78 Restructuring Costs and Other Charges 168 Stock-based
Compensation Expense 15 Storm Related Insurance Proceeds (6) Adjusted Operating Expenses $4,774 Subtract: NW States Direct Expenses 198 PF RemainCo Adj. Operating Expenses $4,575
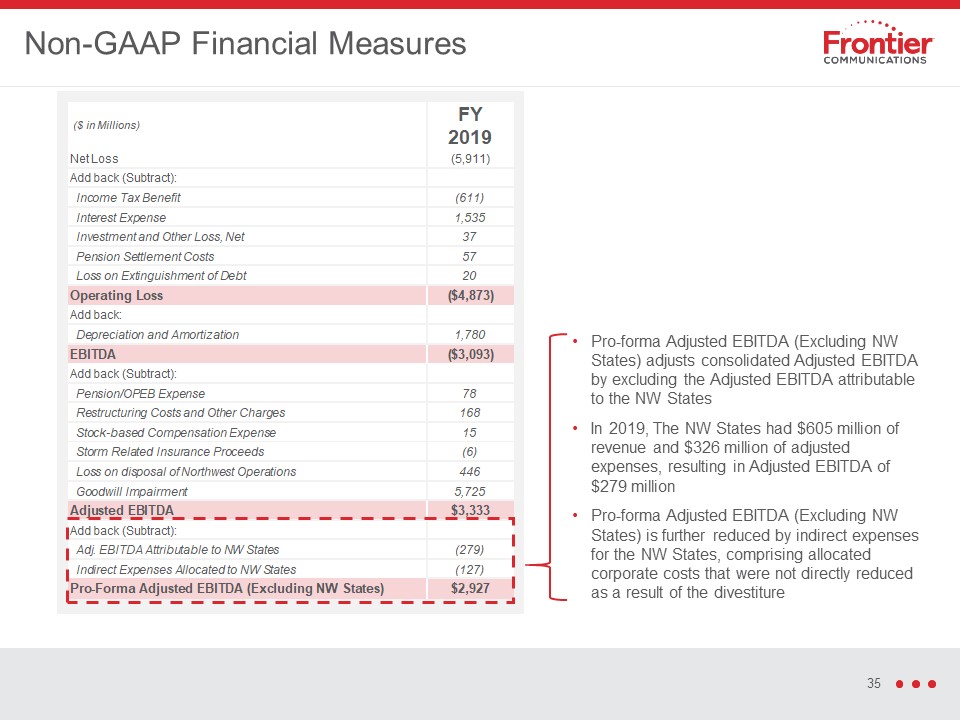
Non-GAAP Financial Measures Pro-forma Adjusted EBITDA (Excluding NW States) adjusts consolidated
Adjusted EBITDA by excluding the Adjusted EBITDA attributable to the NW StatesIn 2019, The NW States had $605 million of revenue and $326 million of adjusted expenses, resulting in Adjusted EBITDA of $279 millionPro-forma Adjusted EBITDA
(Excluding NW States) is further reduced by indirect expenses for the NW States, comprising allocated corporate costs that were not directly reduced as a result of the divestiture

Appendix: Additional COVID-19 Outlook Detail
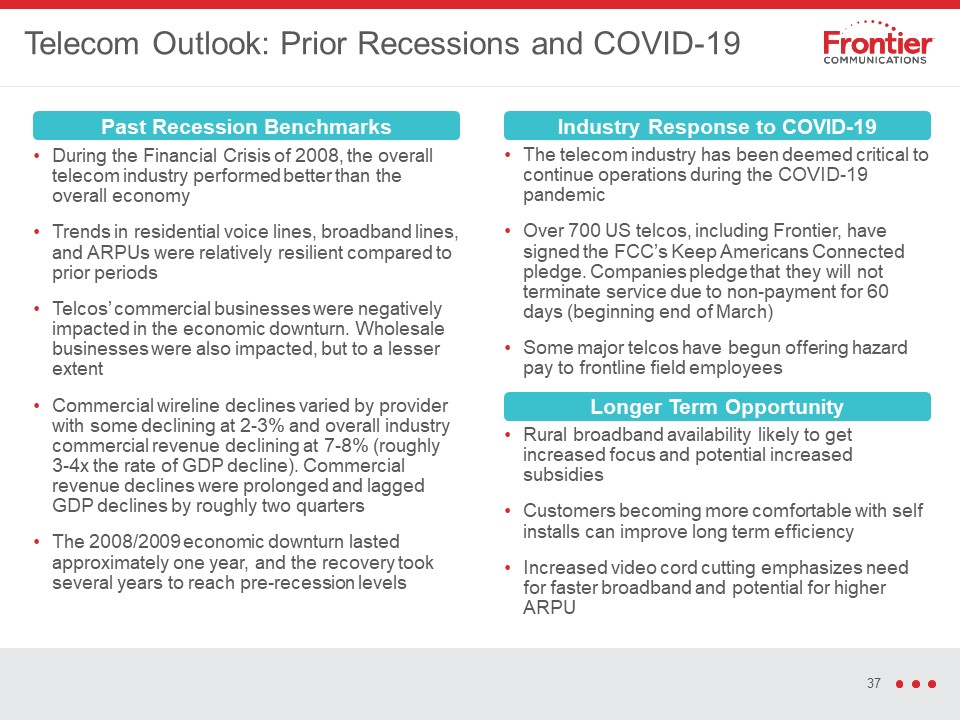
Telecom Outlook: Prior Recessions and COVID-19 During the Financial Crisis of 2008, the overall
telecom industry performed better than the overall economyTrends in residential voice lines, broadband lines, and ARPUs were relatively resilient compared to prior periodsTelcos’ commercial businesses were negatively impacted in the economic
downturn. Wholesale businesses were also impacted, but to a lesser extentCommercial wireline declines varied by provider with some declining at 2-3% and overall industry commercial revenue declining at 7-8% (roughly 3-4x the rate of GDP
decline). Commercial revenue declines were prolonged and lagged GDP declines by roughly two quartersThe 2008/2009 economic downturn lasted approximately one year, and the recovery took several years to reach pre-recession levels Past
Recession Benchmarks The telecom industry has been deemed critical to continue operations during the COVID-19 pandemicOver 700 US telcos, including Frontier, have signed the FCC’s Keep Americans Connected pledge. Companies pledge that they
will not terminate service due to non-payment for 60 days (beginning end of March)Some major telcos have begun offering hazard pay to frontline field employees Industry Response to COVID-19 Rural broadband availability likely to get
increased focus and potential increased subsidiesCustomers becoming more comfortable with self installs can improve long term efficiencyIncreased video cord cutting emphasizes need for faster broadband and potential for higher ARPU Longer
Term Opportunity
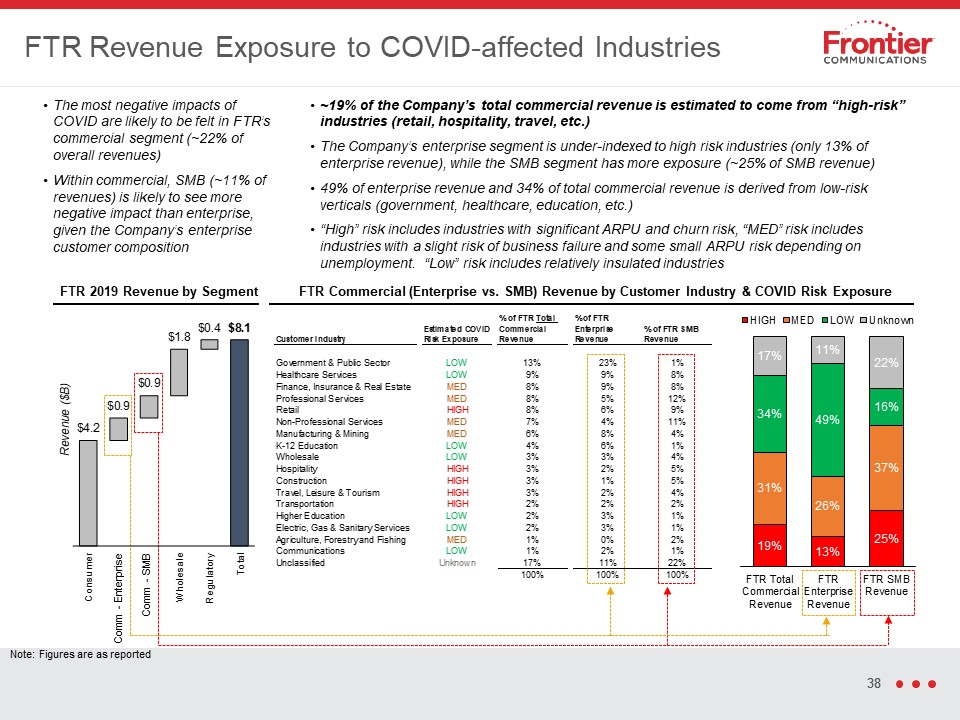
FTR Revenue Exposure to COVID-affected Industries The most negative impacts of COVID are likely to be
felt in FTR’s commercial segment (~22% of overall revenues)Within commercial, SMB (~11% of revenues) is likely to see more negative impact than enterprise, given the Company’s enterprise customer composition ~19% of the Company’s total
commercial revenue is estimated to come from “high-risk” industries (retail, hospitality, travel, etc.)The Company’s enterprise segment is under-indexed to high risk industries (only 13% of enterprise revenue), while the SMB segment has more
exposure (~25% of SMB revenue)49% of enterprise revenue and 34% of total commercial revenue is derived from low-risk verticals (government, healthcare, education, etc.)“High” risk includes industries with significant ARPU and churn risk,
“MED” risk includes industries with a slight risk of business failure and some small ARPU risk depending on unemployment. “Low” risk includes relatively insulated industries FTR 2019 Revenue by Segment FTR Commercial (Enterprise
vs. SMB) Revenue by Customer Industry & COVID Risk Exposure Comm - Enterprise Comm - SMB Note: Figures are as reported