Attached files
| file | filename |
|---|---|
| 8-K - 8-K - ESSENTIAL PROPERTIES REALTY TRUST, INC. | d945992d8k.htm |
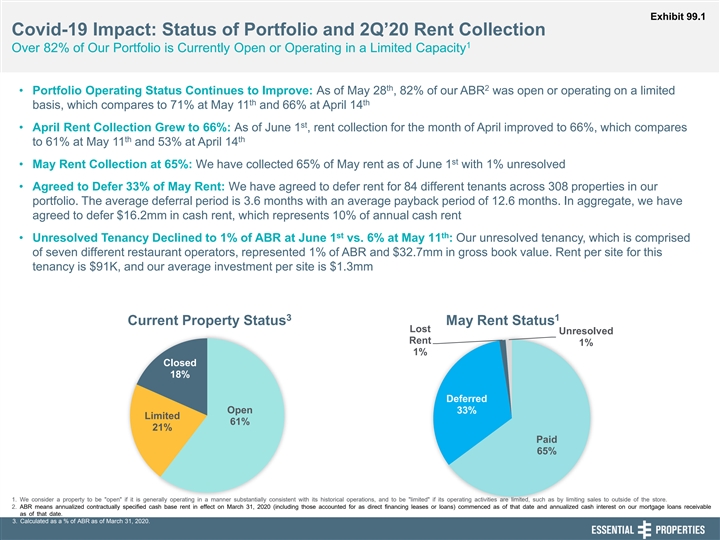
Exhibit 99.1 Covid-19 Impact: Status of Portfolio and 2Q’20 Rent Collection 1 Over 82% of Our Portfolio is Currently Open or Operating in a Limited Capacity th 2 • Portfolio Operating Status Continues to Improve: As of May 28 , 82% of our ABR was open or operating on a limited th th basis, which compares to 71% at May 11 and 66% at April 14 st • April Rent Collection Grew to 66%: As of June 1 , rent collection for the month of April improved to 66%, which compares th th to 61% at May 11 and 53% at April 14 st • May Rent Collection at 65%: We have collected 65% of May rent as of June 1 with 1% unresolved • Agreed to Defer 33% of May Rent: We have agreed to defer rent for 84 different tenants across 308 properties in our portfolio. The average deferral period is 3.6 months with an average payback period of 12.6 months. In aggregate, we have agreed to defer $16.2mm in cash rent, which represents 10% of annual cash rent st th • Unresolved Tenancy Declined to 1% of ABR at June 1 vs. 6% at May 11 : Our unresolved tenancy, which is comprised of seven different restaurant operators, represented 1% of ABR and $32.7mm in gross book value. Rent per site for this tenancy is $91K, and our average investment per site is $1.3mm 3 1 Current Property Status May Rent Status Lost Unresolved Rent 1% 1% Closed 18% Deferred Open 33% Limited 61% 21% Paid 65% 1. We consider a property to be open if it is generally operating in a manner substantially consistent with its historical operations, and to be limited if its operating activities are limited, such as by limiting sales to outside of the store. 2. ABR means annualized contractually specified cash base rent in effect on March 31, 2020 (including those accounted for as direct financing leases or loans) commenced as of that date and annualized cash interest on our mortgage loans receivable as of that date. 3. Calculated as a % of ABR as of March 31, 2020.Exhibit 99.1 Covid-19 Impact: Status of Portfolio and 2Q’20 Rent Collection 1 Over 82% of Our Portfolio is Currently Open or Operating in a Limited Capacity th 2 • Portfolio Operating Status Continues to Improve: As of May 28 , 82% of our ABR was open or operating on a limited th th basis, which compares to 71% at May 11 and 66% at April 14 st • April Rent Collection Grew to 66%: As of June 1 , rent collection for the month of April improved to 66%, which compares th th to 61% at May 11 and 53% at April 14 st • May Rent Collection at 65%: We have collected 65% of May rent as of June 1 with 1% unresolved • Agreed to Defer 33% of May Rent: We have agreed to defer rent for 84 different tenants across 308 properties in our portfolio. The average deferral period is 3.6 months with an average payback period of 12.6 months. In aggregate, we have agreed to defer $16.2mm in cash rent, which represents 10% of annual cash rent st th • Unresolved Tenancy Declined to 1% of ABR at June 1 vs. 6% at May 11 : Our unresolved tenancy, which is comprised of seven different restaurant operators, represented 1% of ABR and $32.7mm in gross book value. Rent per site for this tenancy is $91K, and our average investment per site is $1.3mm 3 1 Current Property Status May Rent Status Lost Unresolved Rent 1% 1% Closed 18% Deferred Open 33% Limited 61% 21% Paid 65% 1. We consider a property to be open if it is generally operating in a manner substantially consistent with its historical operations, and to be limited if its operating activities are limited, such as by limiting sales to outside of the store. 2. ABR means annualized contractually specified cash base rent in effect on March 31, 2020 (including those accounted for as direct financing leases or loans) commenced as of that date and annualized cash interest on our mortgage loans receivable as of that date. 3. Calculated as a % of ABR as of March 31, 2020.

Covid-19 Impact: Tenant Industry Breakdown % of Total % of Total 1 1 1 Tenant Industry % of ABR % Open % Limited % Closed 1 Closed ABR Deferred Rent Quick Service Restaurants 14.3% 8% 87% 5% 4% 7% Early Childhood Education 13.3% 67% 4% 29% 21% 28% Car Wash 11.8% 98% 1% 1% 1% 4% Medical / Dental 10.9% 88% 7% 5% 3% 12% Convenience Store 10.6% 96% 2% 2% 1% 4% Health and Fitness 6.6% 17% 32% 51% 19% 13% Casual Dining 5.5% 46% 50% 4% 1% 5% Auto Service 5.2% 99% 1% 0% 0% 3% Entertainment 4.1% 7% 8% 85% 19% 4% Home Furnishings 3.4% 7% 21% 72% 13% 2% Other Service 3.2% 100% 0% 0% 0% 0% Family Dining 3.2% 43% 39% 19% 3% 6% Pet Care Services 3.1% 100% 0% 0% 0% 1% Movie Theatres 2.7% 0% 0% 100% 15% 10% Building Materials 1.7% 100% 0% 0% 0% 0% Grocery 0.6% 100% 0% 0% 0% 0% 1. Property operating status as of May 28th, measured by cash ABR as of March 31, 2020 for each tenant industry.Covid-19 Impact: Tenant Industry Breakdown % of Total % of Total 1 1 1 Tenant Industry % of ABR % Open % Limited % Closed 1 Closed ABR Deferred Rent Quick Service Restaurants 14.3% 8% 87% 5% 4% 7% Early Childhood Education 13.3% 67% 4% 29% 21% 28% Car Wash 11.8% 98% 1% 1% 1% 4% Medical / Dental 10.9% 88% 7% 5% 3% 12% Convenience Store 10.6% 96% 2% 2% 1% 4% Health and Fitness 6.6% 17% 32% 51% 19% 13% Casual Dining 5.5% 46% 50% 4% 1% 5% Auto Service 5.2% 99% 1% 0% 0% 3% Entertainment 4.1% 7% 8% 85% 19% 4% Home Furnishings 3.4% 7% 21% 72% 13% 2% Other Service 3.2% 100% 0% 0% 0% 0% Family Dining 3.2% 43% 39% 19% 3% 6% Pet Care Services 3.1% 100% 0% 0% 0% 1% Movie Theatres 2.7% 0% 0% 100% 15% 10% Building Materials 1.7% 100% 0% 0% 0% 0% Grocery 0.6% 100% 0% 0% 0% 0% 1. Property operating status as of May 28th, measured by cash ABR as of March 31, 2020 for each tenant industry.