Attached files
| file | filename |
|---|---|
| EX-99.1 - EXHIBIT 99.1 - ABM INDUSTRIES INC /DE/ | tm2022804d1_ex99-1.htm |
| 8-K - FORM 8-K - ABM INDUSTRIES INC /DE/ | tm2022804d1_8k.htm |
Exhibit 99.2

1 Investor Presentation SECOND QUARTER 2020

2 Agenda Business Overview Forward - Looking Statements and Non - GAAP Financial Information : Our discussions during this conference call and in this presentation will include forward - looking statements . Actual results could differ materially from those projected in the forward - looking statements . Some of the factors that could cause actual results to differ are discussed in the Company’s SEC filings . Our filings are available on our website at http : //investor . abm . com under “Company Information” . A description of other factors that could cause actual results to differ is also set forth at the end of this presentation . Also, the discussion during this conference call and in this presentation will include certain financial measures that were not prepared in accordance with U . S . generally accepted accounting principles (“U . S . GAAP”) . Please see the Appendix for reconciliations of those historical non - GAAP financial measures and for information relating to the use of certain other non - GAAP financial measures . Reconciliations of certain non - GAAP financial measures can also be found on the Investor Relations portion of our website at http : //investor . abm . com . 1 2 Responding to COVID - 19 3 4 Capital Structure 5 Appendix Second Quarter 2020 Review

3 Business Overview

4

5 $1.62 $2.05 Adjusted EPS $0.94 $1.91 Continuing EPS SIGNIFICANT GROWTH AND CONTINUED OPPORTUNITY AHEAD 2020 Vision Achievements $4.9 $1.6 $6.5 $2.4 Revenue (Billions) Market Cap (Billions) FY 2015 FY 2019 ¹ Please refer to the appendix for a reconciliation of GAAP to non - GAAP measures. 1 Revenue (Billions)

6 Founded in 1909 | $6.5 Billion in Revenue
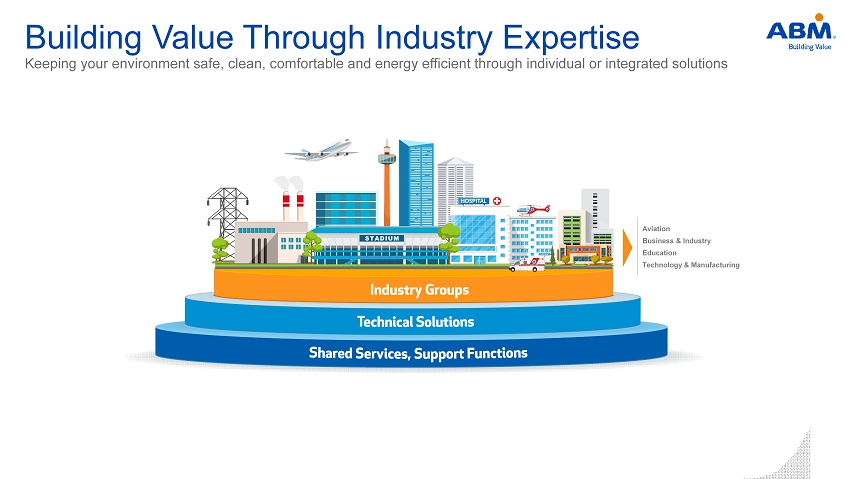
7 Aviation Business & Industry Education Technology & Manufacturing Building Value Through Industry Expertise Keeping your environment safe, clean, comfortable and energy efficient through individual or integrated solutions

8 Business & Industry (50%) Aviation ( 15% ) Technology & Manufacturing ( 14% ) Education ( 13% ) Technical Solutions (8%) Industries We Serve Results as of fiscal 2019.
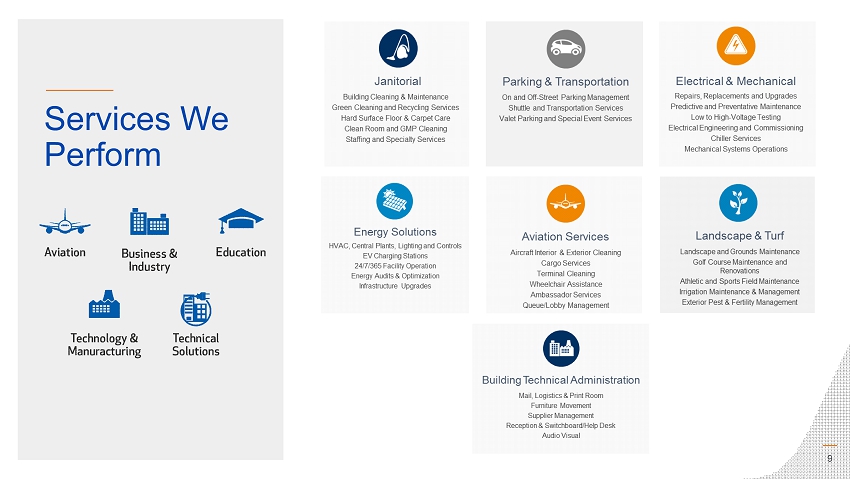
9 Services We Perform

10 Impact to operating costs through SOPs , labor management , technology and purchasing energy and asset lifecycle management Majority self - performed services maximizes alignment with client workplace strategy, increases quality, efficiency and control, and reduces management costs + + $ Value = direct operational cost savings + increased client portfolio asset value + enhanced client workforce productivity Aligning workplace strategy with operational best practices for improved cost efficiencies, productivity, communication and s cal ability Targeting the Outsourcing Continuum SAVINGS SERVICES
11

12 Responding to COVID - 19

13 As with most companies, COVID - 19 has impacted our business This is a dynamic, rapidly shifting environment – with significant externalities “Shelter in place” mandates have been in place – managed by city/state A “new normal” for office occupancy and trends Most sensitive business segments include Aviation and Education ATS facilities project related work experiencing site access impediments …and among our various end markets Impact felt across our national footprint…
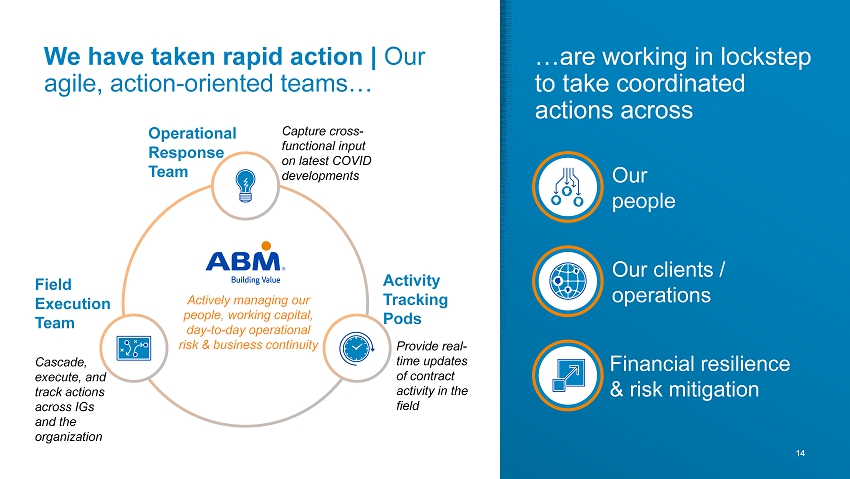
14 We have taken rapid action | Our agile, action - oriented teams… Operational Response Team Capture cross - functional input on latest COVID developments Field Execution Team Cascade, execute, and track actions across IGs and the organization …are working in lockstep to take coordinated actions across Activity Tracking Pods Provide real - time updates of contract activity in the field Actively managing our people, working capital, day - to - day operational risk & business continuity Our people Our clients / operations Financial resilience & risk mitigation

15 Potential opportunities in a post COVID - 19 world: New and increased expectations for workspace and building cleanliness and sanitization Rising demand for service volume and frequency Focus on higher value - added services, such as EnhancedClean ™, to meet new "hyper - vigilant" cleaning environment Higher importance on scale, reach, and reliability where competitors are disrupted and not dependable

16 x ABM’s services have been deemed “essential” to doing business during the ongoing pandemic x Shift towards wellness as COVID - 19 highlights the need to provide building occupants with a safe environment x Building occupants are hyper - aware of the appearance of cleanliness and expect more transparency and visibility into the cleaning process x Offer strategies to minimize transmission risk ABM EnhancedClean ™

17 ABM EnhancedClean™ ABM’s EnhancedClean™ program is a three - step approach that delivers healthy spaces under the guidance of experts 3 Key Differentiators Processes Backed by Experts Hospital Grade Disinfectants & Specialized Equipment Innovative Solutions and Technology

18 Our Post - COVID Future | ABM strengths will drive advantage across markets Comprehensive service line offering Deep client relationships Engaged people These advantages are core components of our market strength today and will continue to propel us into the future Scale advantage Results oriented operating culture Dislocated competition

19 Second Quarter 2020 Review

20 $1,594.7 $1,496.0 2019 2020 Q2 FY20 Revenue Second Quarter 2020 Review

21 Q2 FY20 Income (Loss) from Continuing Operations $31.5 $40.4 2019 2020 Q2 FY20 Adj. Income from Continuing Operations $29.9 ($136.8) 2019 2020 1 FY 2020 includes pre - tax non - cash goodwill and intangible impairment charge of $172.8 million, $170.6 million after tax or $2.5 5 per diluted share. 2 Please refer to the appendix for a reconciliation of GAAP to non - GAAP measures. Second Quarter 2020 Review 2 $0.45 per share $0.47 per share $0.60 per share ($2.05) per share 1
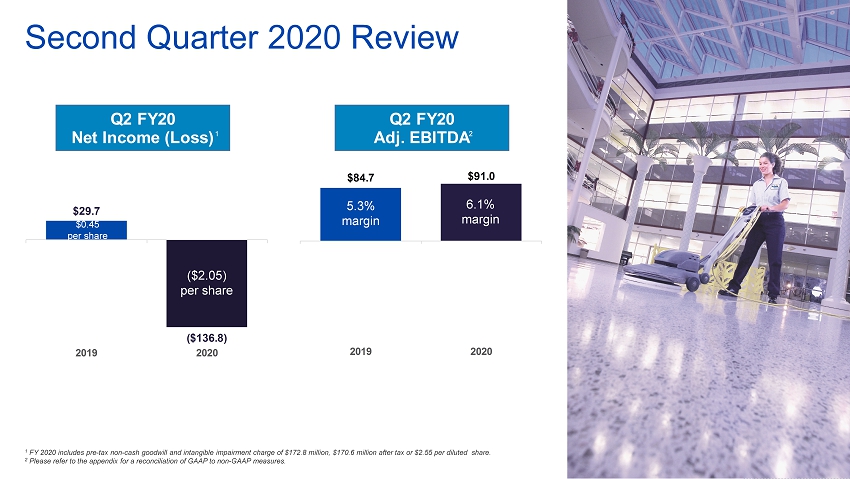
22 Q2 FY20 Net Income (Loss) $84.7 $91.0 2019 2020 Q2 FY20 Adj. EBITDA $29.7 ($136.8) 2019 2020 Second Quarter 2020 Review 2 $0.45 per share ($2.05) per share 6.1% margin 5.3% margin 1 FY 2020 includes pre - tax non - cash goodwill and intangible impairment charge of $172.8 million, $170.6 million after tax or $2.5 5 per diluted share. 2 Please refer to the appendix for a reconciliation of GAAP to non - GAAP measures. 1
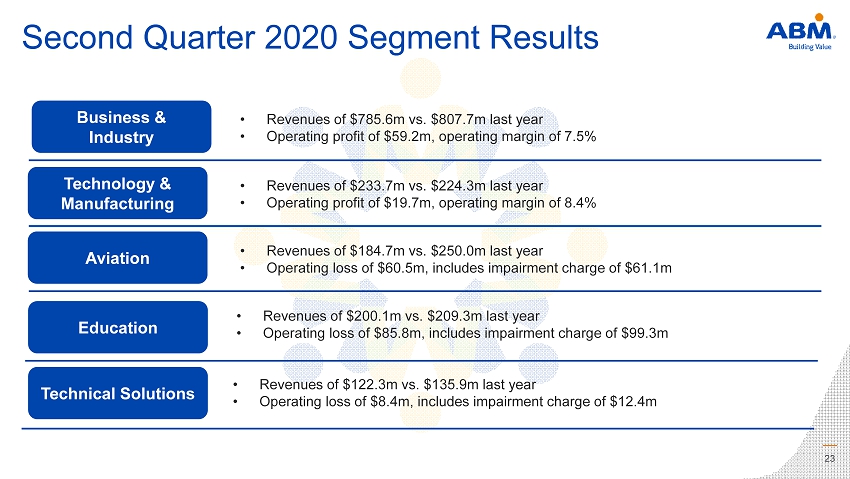
23 Second Quarter 2020 Segment Results Business & Industry • Revenues of $785.6m vs. $807.7m last year • Operating profit of $59.2m, operating margin of 7.5% Technology & Manufacturing • Revenues of $233.7m vs. $224.3m last year • Operating profit of $19.7m, operating margin of 8.4% Aviation • Revenues of $184.7m vs. $250.0m last year • Operating loss of $60.5m, includes impairment charge of $61.1m Education • Revenues of $200.1m vs. $209.3m last year • Operating loss of $85.8m, includes impairment charge of $99.3m Technical Solutions • Revenues of $122.3m vs. $135.9m last year • Operating loss of $8.4m, includes impairment charge of $12.4m
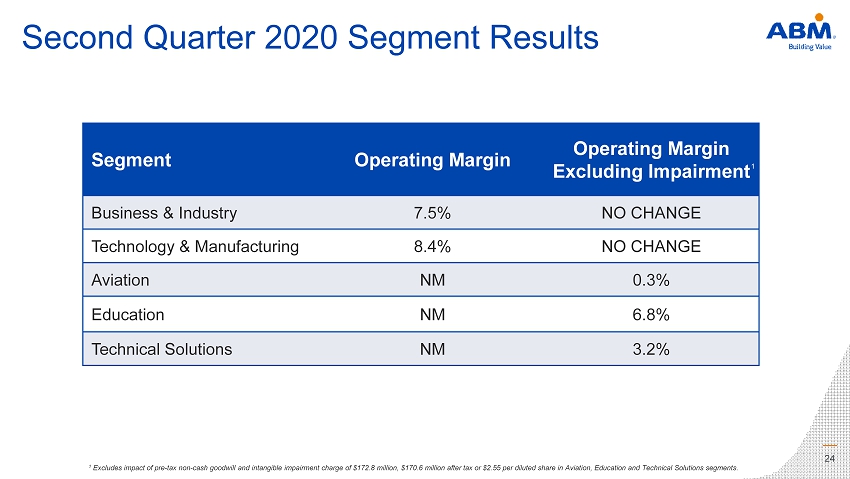
24 Segment Operating Margin Operating Margin Excluding Impairment Business & Industry 7.5% NO CHANGE Technology & Manufacturing 8.4% NO CHANGE Aviation NM 0.3% Education NM 6.8% Technical Solutions NM 3.2% Second Quarter 2020 Segment Results 1 Excludes impact of pre - tax non - cash goodwill and intangible impairment charge of $172.8 million, $170.6 million after tax or $2 .55 per diluted share in Aviation, Education and Technical Solutions segments. 1

25 Capital Structure
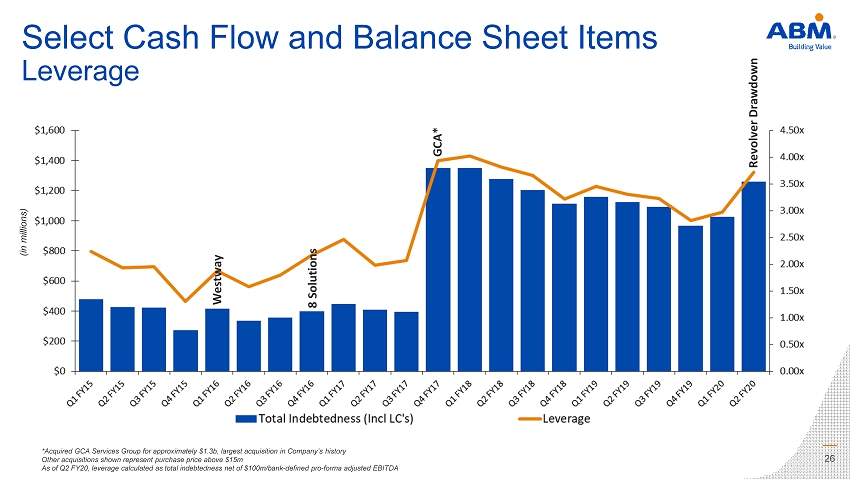
26 Select Cash Flow and Balance Sheet Items Leverage *Acquired GCA Services Group for approximately $1.3b, largest acquisition in Company’s history Other acquisitions shown represent purchase price above $15m As of Q2 FY20, leverage calculated as total indebtedness net of $100m/bank - defined pro - forma adjusted EBITDA (in millions) Westway 8 Solutions GCA* Revolver Drawdown

27 Select Cash Flow and Balance Sheet Items Shareholder Return I N M ARCH 2020 , THE C OMPANY SUSPENDED ALL FURTHER SHARE REPURCHASES A S THE COVID - 19 P ANDEMIC DEVELOPED (in millions) *

28 Select Cash Flow and Balance Sheet Items Annual Dividend LONG HISTORY OF CONSECUTIVE DIVIDEND GROWTH 2Q20 MARKS THE 216 TH CONSECUTIVE QUARTERLY CASH DIVIDEND (in millions)
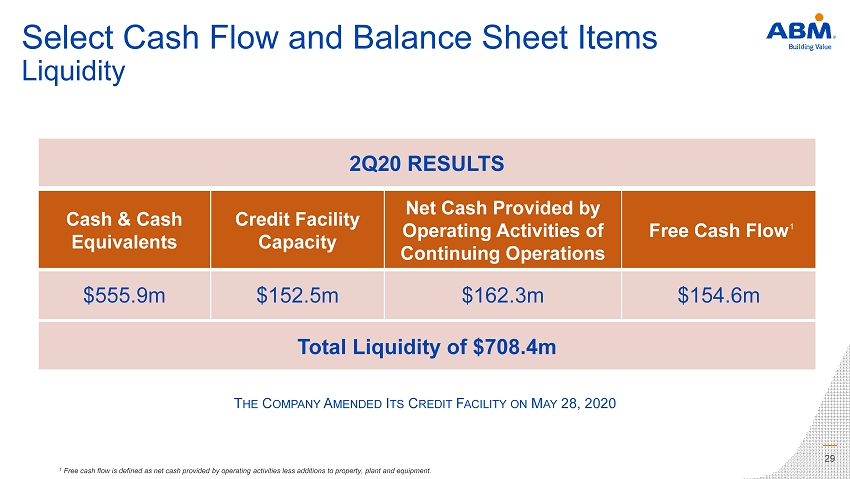
29 Cash & Cash Equivalents Credit Facility Capacity Net Cash Provided by Operating Activities of Continuing Operations Free Cash Flow $555.9m $152.5m $162.3m $154.6m 1 Free cash flow is defined as net cash provided by operating activities less additions to property, plant and equipment. 1 T HE C OMPANY A MENDED I TS C REDIT F ACILITY ON M AY 28, 2020 Select Cash Flow and Balance Sheet Items Liquidity 2Q20 RESULTS Total Liquidity of $708.4m

30 Credit Facility Amendment Financial Covenants Q2 Q3 Q4 Q1 Q2 Q3 Q4 Previous Maximum Leverage Ratio Covenant 4.00x 3.75x 3.75x 3.75x 3.75x 3.50x 3.50x New Maximum Net Leverage Ratio Covenant 4.25x 5.75x 6.50x 6.50x 6.00x 5.25x 5.00x Previous Minimum Fixed Charge Coverage Ratio 1.50x 1.50x 1.50x 1.50x 1.50x 1.50x 1.50x New Minimum Fixed Charge Coverage Ratio 1.50x 1.50x 1.25x 1.15x 1.15x 1.20x 1.20x 2020 2021 Interest Rates Previous Interest Rate Range 100 to 225 bps plus LIBOR on Revolver and Term Loan A New Interest Rate Range 100 to 275 bps plus 75bps LIBOR floor on Revolver 150 to 325 bps plus LIBOR on Term Loan A 1 Leverage referred to as total net debt to bank - defined pro - forma adjusted EBITDA (previously ‘total debt to bank - defined pro - fo rma adjusted EBITDA’). 1

31 Appendix

32 Forward Looking Statements This presentation contains both historical and forward - looking statements about ABM Industries Incorporated (“ABM”) and its subsidiaries (collectively referred to as “ABM,” “we,” “us,” “our,” or the “Company”) . We make forward - looking statements related to future expectations, estimates and projections that are uncertain, and often contain words such as “anticipate,” “believe,” “could,” “estimate,” “expect,” “forecast,” “intend,” “likely,” “may,” “outlook,” “plan,” “predict,” “should,” “target,” or other similar words or phrases . These statements are not guarantees of future performance and are subject to known and unknown risks, uncertainties, and assumptions that are difficult to predict . For us, particular uncertainties that could cause our actual results to be materially different from those expressed in our forward - looking statements include : the COVID - 19 pandemic has had and is expected to continue to have a negative effect on the U . S . and global economy and has disrupted and is expected to continue to disrupt our operations and our clients’ operations which has adversely affected and may continue to adversely affect our business, results of operations, cash flows, and financial condition ; our success depends on our ability to gain profitable business despite competitive market pressures ; our business success depends on our ability to attract and retain qualified personnel and senior management and to manage labor costs ; our ability to preserve long - term client relationships is essential to our continued success ; changes to our businesses, operating structure, financial reporting structure, or personnel relating to the implementation of strategic transformations, enhanced business processes, and technology initiatives may not have the desired effects on our financial condition and results of operations ; acquisitions, divestitures, and other strategic transactions could fail to achieve financial or strategic objectives, disrupt our ongoing business, and adversely impact our results of operations ; we manage our insurable risks through a combination of third - party purchased policies and self - insurance, and we retain a substantial portion of the risk associated with expected losses under these programs, which exposes us to volatility associated with those risks, including the possibility that adjustments to our ultimate insurance loss reserves could result in material charges against our earnings ; our risk management and safety programs may not have the intended effect of reducing our liability for personal injury or property loss ; our international business involves risks different from those we face in the United States that could have an effect on our results of operations and financial condition ; our use of subcontractors or joint venture partners to perform work under customer contracts exposes us to liability and financial risk ; we may experience breaches of, or disruptions to, our information technology systems or those of our third - party providers or clients, or other compromises of our data that could adversely affect our business ; unfavorable developments in our class and representative actions and other lawsuits alleging various claims could cause us to incur substantial liabilities ; a significant number of our employees are covered by collective bargaining agreements that could expose us to potential liabilities in relationship to our participation in multiemployer pension plans, requirements to make contributions to other benefit plans, and the potential for strikes, work slowdowns or similar activities, and union organizing drives ; our business may be materially affected by changes to fiscal and tax policies, and negative or unexpected tax consequences could adversely affect our results of operations ; changes in general economic conditions, such as changes in energy prices, government regulations, or consumer preferences, could reduce the demand for facility services and, as a result, reduce our earnings and adversely affect our financial condition ; future increases in the level of our borrowings or in interest rates could affect our results of operations ; impairment of goodwill and long - lived assets could have a material adverse effect on our financial condition and results of operations ; if we fail to maintain proper and effective internal control over financial reporting in the future, our ability to produce accurate and timely financial statements could be negatively impacted, which could harm our operating results and investor perceptions of our Company and as a result may have a material adverse effect on the value of our common stock ; our business may be negatively impacted by adverse weather conditions ; catastrophic events, disasters, and terrorist attacks could disrupt our services ; and actions of activist investors could disrupt our business . For additional information on these and other risks and uncertainties we face, see ABM’s risk factors, as they may be amended from time to time, set forth in our filings with the Securities and Exchange Commission, including our most recent Annual Report on Form 10 - K and subsequent filings . We urge readers to consider these risks and uncertainties in evaluating our forward - looking statements . We caution readers not to place undue reliance upon any such forward - looking statements, which speak only as of the date made . We undertake no obligation to publicly update any forward - looking statements, whether as a result of new information, future events, or otherwise, except as required by law .

33 Use of Non - GAAP Financial Information To supplement ABM’s consolidated financial information, the Company has presented income from continuing operations and income from continuing operations per diluted share as adjusted for items impacting comparability, for the second quarter of fiscal years 2020 and 2019 . These adjustments have been made with the intent of providing financial measures that give management and investors a better understanding of the underlying operational results and trends as well as ABM’s operational performance . In addition, the Company has presented earnings before income from discontinued operations, net of taxes, interest, taxes, depreciation and amortization and excluding items impacting comparability (adjusted EBITDA) for the second quarter of fiscal years 2020 and 2019 . Adjusted EBITDA is among the indicators management uses as a basis for planning and forecasting future periods . The Company has also presented Free Cash Flow which is defined as net cash provided by operating activities less additions to property, plant and equipment . The presentation of these non - GAAP financial measures is not meant to be considered in isolation or as a substitute for financial statements prepared in accordance with accounting principles generally accepted in the United States of America . (See accompanying financial tables for supplemental financial data and corresponding reconciliations to certain GAAP financial measures . )

34 Unaudited Reconciliation of Non - GAAP Financial Measures (a) The Company adjusts (loss) income from continuing operations to exclude the impact of certain items that are unusual, non - recurring, or otherwise do not reflect management's views of the underlying operational results and trends of the Company . (b) Represents the net adjustments to our self - insurance reserve for general liability, workers’ compensation, automobile and medical and dental insurance claims related to prior period accident years . Management believes these prior period reserve changes do not illustrate the performance of the Company’s normal ongoing operations given the current year's insurance expense is estimated by management in conjunction with the Company's outside actuary to take into consideration past history and current costs and regulatory trends . Once the Company develops its best estimate of insurance expense premiums for the year, the Company fully allocates such costs out to the business leaders to hold them accountable for the current year costs within operations . However, since these prior period reserve changes relate to claims that could date back many years, current management has limited ability to influence the ultimate development of the prior year changes . Accordingly, including the prior period reserve changes in the Company's current operational results would not depict how the business is run as the Company holds its management accountable for the current year’s operational performance . The Company believes the exclusion of the self - insurance adjustment from (loss) income from continuing operations is useful to investors by enabling them to better assess our operating performance in the context of current year profitability . For the three and six months ended April 30 , 2020 , our self - insurance general liability, workers’ compensation, and automobile and medical and dental insurance claims related to prior period accident years increased by $ 3 . 9 million and decreased by $ 2 . 7 million, respectively . For the six months ended April 30 , 2019 , the liability increased by $ 5 . 0 million . (c) Primarily represents one - time implementation costs related to the Company's transformational IT infrastructure projects and requirements associated with General Data Protection Regulation standards . (d) Represents restructuring costs related to the continued integration of GCA acquisition in September 2017 . (e) The Company's tax impact is calculated using the federal and state statutory rate of 28 . 11 % for US and 19 % for UK for FY 2020 and FY 2019 . We calculate tax from the underlying whole - dollar amounts, as a result, certain amounts may not recalculate based on reported numbers due to rounding . (f) FY 20 QTD and YTD includes a $ 45 . 2 M tax charge related to impairment of nondeductible goodwill .

35 Unaudited Reconciliation of Non - GAAP Financial Measures

36 Unaudited Reconciliation of Non - GAAP Financial Measures

37 Contact Us INVESTOR RELATIONS Susie A. Kim (212) 297 - 9721 susie.kim@abm.com