Attached files
| file | filename |
|---|---|
| EX-99.1 - EXHIBIT 99.1 - MFA FINANCIAL, INC. | tm2022697d1_ex99-1.htm |
| 8-K - FORM 8-K - MFA FINANCIAL, INC. | tm2022697d1_8k.htm |
Exhibit 99.2

June 2020 Company Update • • • Capital Raise Q1 2020 Financial Results Review Q2 Portfolio activity through May 31, 2020
Forward Looking Statements When used in this presentation or other written or oral communications, statements which are not historical in nature, including those containing words such as “will,” “believe,” “expect,” “anticipate,” “estimate,” “plan,” “continue,” “intend,” “should,” “could,” “would,” “may,” the negative of these words or similar expressions, are intended to identify “forward-looking statements” within the meaning of Section 27A of the 1933 Act and Section 21E of the 1934 Act and, as such, may involve known and unknown risks, uncertainties and assumptions. Statements regarding the following subjects, among others, may be forward-looking: risks related to the ongoing spread and economic and operational effects of the COVID-19 virus; uncertainties related to the Company’s new financing arrangements, including without limitation uncertainties regarding the funding of such arrangements and the anticipated benefits and uses of such funds; the Company’s ability to meet its ongoing obligations under its forbearance agreement and the Company’s expectations with respect to any exit from forbearance or the ability to extend such forbearance if needed; the Company’s ability to accurately estimate information related to its operations and financial condition subsequent to the end of the first quarter (particularly in light of the highly volatile and uncertain market conditions); payments of future dividends, including payment in arrears on the Company’s Series B and Series C Preferred Stock; changes in interest rates and the market (i.e., fair) value of MFA’s MBS, residential whole loans, CRT securities and other assets; changes in the prepayment rates on residential mortgage assets, an increase of which could result in a reduction of the yield on certain investments in its portfolio and could require MFA to reinvest the proceeds received by it as a result of such prepayments in investments with lower coupons, while a decrease in which could result in an increase in the interest rate duration of certain investments in MFA’s portfolio making their valuation more sensitive to changes in interest rates and could result in lower forecasted cash flows, or in certain circumstances, impairment on certain MBS purchased at a discount; credit risks underlying MFA’s assets, including changes in the default rates and management’s assumptions regarding default rates on the mortgage loans securing MFA’s Non-Agency MBS and relating to MFA’s residential whole loan portfolio; MFA’s ability to borrow to finance its assets and the terms, including the cost, maturity and other terms, of any such borrowings; implementation of or changes in government regulations or programs affecting MFA’s business; MFA’s estimates regarding taxable income, the actual amount of which is dependent on a number of factors, including, but not limited to, changes in the amount of interest income and financing costs, the method elected by MFA to accrete the market discount on Non-Agency MBS and residential whole loans and the extent of prepayments, realized losses and changes in the composition of MFA’s Agency MBS, Non-Agency MBS and residential whole loan portfolios that may occur during the applicable tax period, including gain or loss on any MBS disposals and whole loan modifications, foreclosures and liquidations; the timing and amount of distributions to stockholders, which are declared and paid at the discretion of MFA’s Board of Directors and will depend on, among other things, MFA’s taxable income, its financial results and overall financial condition and liquidity, maintenance of its REIT qualification and such other factors as MFA’s Board of Directors deems relevant; MFA’s ability to maintain its qualification as a REIT for federal income tax purposes; MFA’s ability to maintain its exemption from registration under the Investment Company Act of 1940, as amended (or the Investment Company Act), including statements regarding the Concept Release issued by the Securities and Exchange Commission (SEC) relating to interpretive issues under the Investment Company Act with respect to the status under the Investment Company Act of certain companies that are engaged in the business of acquiring mortgages and mortgage-related interests; MFA’s ability to continue growing its residential whole loan portfolio which is dependent on, among other things, the supply of loans offered for sale in the market; expected returns on MFA’s investments in non-performing residential whole loans (NPLs), which are affected by, among other things, the length of time required to foreclose upon, sell, liquidate or otherwise reach a resolution of the property underlying the NPL, home price values, amounts advanced to carry the asset (e.g., taxes, insurance, maintenance expenses, etc. on the underlying property) and the amount ultimately realized upon resolution of the asset; targeted or expected returns on MFA’s investments in recently-originated loans, the performance of which is, similar to MFA’s other mortgage loan investments, subject to, among other things, differences in prepayment risk, credit risk and financing cost associated with such investments; risks associated with MFA’s investments in MSR-related assets, including servicing, regulatory and economic risks, risks associated with our investments in loan originators, and risks associated with investing in real estate assets, including changes in business conditions and the general economy. These and other risks, uncertainties and factors, including those described in the annual, quarterly and current reports that MFA files with the SEC, could cause MFA’s actual results to differ materially from those projected in any forward-looking statements it makes. All forward-looking statements are based on beliefs, assumptions and expectations of MFA’s future performance, taking into account all information currently available. Readers are cautioned not to place undue reliance on these forward-looking statements, which speak only as of the date on which they are made. New risks and uncertainties arise over time and it is not possible to predict those events or how they may affect MFA. Except as required by law, MFA is not obligated to, and does not intend to, update or revise any forward-looking statements, whether as a result of new information, future events or otherwise. 2
Capital Raise and Committed Term Borrowing Facility • MFA has reached an agreement for a $500 million capital raise through a private senior secured loan to be funded by certain funds and accounts managed by subsidiaries of Apollo Global Management, Inc. (“Apollo”) including subsidiaries of Athene Holding Ltd. (“Athene”), to which Apollo provides asset management and advisory services. • MFAisalsoenteringintoacommittednon-mark-to-markettermborrowingfacilityof approximately $1.65 billion. This facility will be funded by Barclays and Athene. • Athene has committed to purchase, subject to certain pricing conditions, a portion of the Company’s first Non-QM loan securitization. • In connection with the transactions, Apollo and Athene have committed to purchase the lesser of 4.9% or $50 million of MFA’s common stock in the open market over a 12 month period and will also receive warrants to purchase MFA common stock at varying prices over a five year period. • Apollo will also receive the right to designate a non-voting observer to MFA’s Board of Directors. (1) • Closing these transactionswill allow for exit from MFA’s current forbearance agreement. (1) Both the senior secured loan and term borrowing facilities are subject to various closing conditions and completion of transaction related documentation. 3

Strategic partnership with Apollo bolsters balance sheet • MFA is excited about this new partnership that we believe provides strategic potential. • Apollo’s deep institutional relationships and affiliate network provides potential synergies that can significantly assist our business. • In addition to the $500 million senior secured loan, $1.65 billion of committed term non-mark-to-market financing for our whole loan portfolio allows time for asset prices to recover, as we look ahead to potential securitization to further term out our financing. • Following closing and funding of these transactions and an exit from forbearance, we anticipate that more than half of our asset based financing obligations would be comprised of term, non-mark-to-market financing. • Closing and funding of these transactions and exit from forbearance would also allow us to pay the accumulated unpaid dividends on our Series B and Series C preferred stock issues. • After a difficult start to the year, we are committed to continued efforts to generate future long term value for shareholders, with Apollo and Athene as strategic and significant shareholders. 4
Overview of Q1 2020 results • Unprecedented disruption in residential mortgage markets, due to COVID-19 concerns, resulted in MFA generating a loss in the first quarter of 2020 of $2.02 per common share. GAAP book value decreased to $4.34 per share at March 31, 2020, while Economic book value (1) decreased to $4.09. • Starting in mid-March through the end of the quarter, a lack of liquidity drove forced selling in MBS and other securities, significantly impacting pricing and causing margin calls to balloon. • Loan origination ground to a standstill.Concerns about mandatory borrower forbearance and the uncertain macro economic outlook negatively impacted pricing on our loan portfolios. • Despite significant asset disposals to generate liquidity, MFA was unable to meet the avalanche of margin calls and entered into forbearance discussions with lenders, ultimately reaching a forbearance agreement in April that has been extended to June 26. (1) Economic book value is a Non-GAAP financial measure of MFA’s financial position. To calculate Economic book value, our portfolios of Residential whole loans at carrying value are adjusted to their fair value, rather than the carrying value that is required to be reported under the GAAP accounting model applied to these loans. Refer to slide 17 for additional information, including a reconciliation of GAAP book value to Economic book value. 5
Estimated REIT taxable income, undistributed income and implications for common and preferred dividends in 2020 • Undistributed REIT taxable income at the start of 2020 was approximately $0.05 per share. To avoid paying corporate income tax, we are required to declare a dividend for this income prior to filing our REIT tax return in October 2020 and pay such dividend before the end of the year. • Estimated REIT taxable income for Q1 2020 of approximately $0.10 per share. In order to avoid a 4% excise tax, we are required to declare dividends in 2020 for at least 85% of our estimated 2020 REIT taxable income. • Capital losses generated from sales of residential mortgage assets to date in 2020 are carried forward and offset against future capital gains, but capital losses do not offset ordinary REIT taxable income. • Prior to declaring any dividends on our common stock, we are required to pay accumulated unpaid dividends on our Series B and Series C preferred stock. We expect that exit from forbearance and funds provided by our capital raise will permit these payments. 6
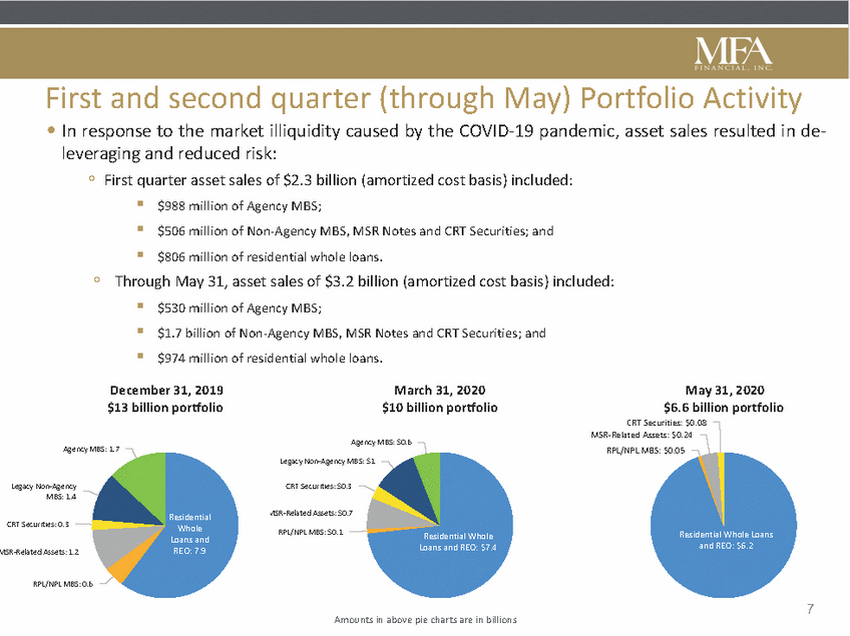
First and second quarter (through May) Portfolio Activity • In response to the market illiquidity caused by the COVID-19 pandemic, asset sales resulted in de-leveraging and reduced risk: ◦ First quarter asset sales of $2.3 billion (amortized cost basis) included: ▪ ▪ ▪ $988 million of Agency MBS; $506 million of Non-Agency MBS, MSR Notes and CRT Securities; and $806 million of residential whole loans. ◦Through May 31, asset sales of $3.2 billion (amortized cost basis) included: ▪ ▪ ▪ $530 million of Agency MBS; $1.7 billion of Non-Agency MBS, MSR Notes and CRT Securities; and $974 million of residential whole loans. December 31, 2019 $13 billion portfolio March 31, 2020 $10 billion portfolio May 31, 2020 $6.6 billion portfolio CRT Securities: $0.08 MSR-Related Assets: $0.24 RPL/NPL MBS: $0.05 Agency MBS: $0.6 Agency MBS: 1.7 Legacy Non-Agency MBS: $1 Legacy Non-Agency MBS: 1.4 CRT Securities: $0.3 SR-Related Assets: $0.7 Residential Whole Loans and REO: 7.9 CRT Securities: 0.3 RPL/NPL MBS: $0.1 Residential Whole Loans and REO: $6.2 Residential Whole Loans and REO: $7.4 MSR-Related Assets: 1.2 RPL/NPL MBS: 0.6 7 Amounts in above pie charts are in billions
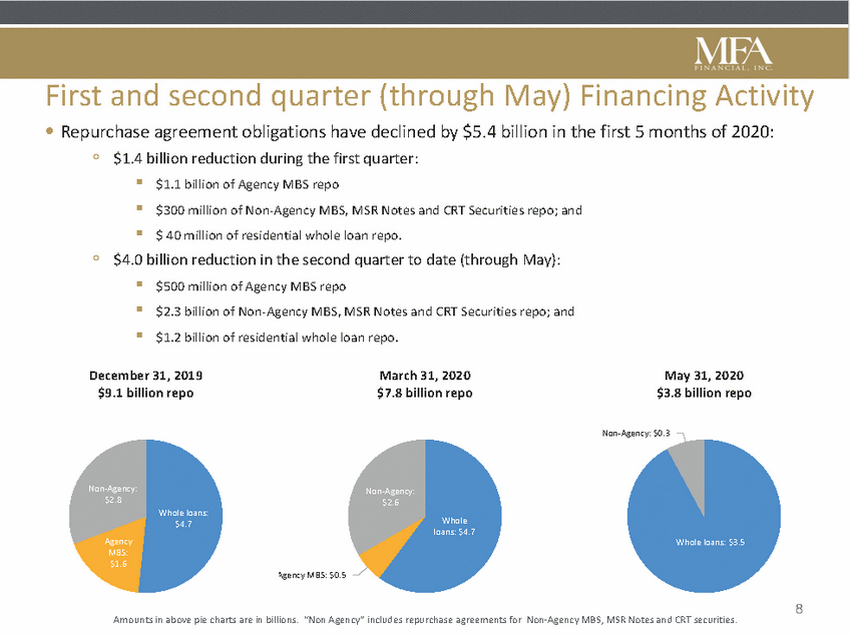
First and second quarter (through May) Financing Activity • Repurchase agreement obligations have declined by $5.4 billion in the first 5 months of 2020: ◦ $1.4 billion reduction during the first quarter: ▪ ▪ ▪ $1.1 billion of Agency MBS repo $300 million of Non-Agency MBS, MSR Notes and CRT Securities repo; and $ 40 million of residential whole loan repo. ◦ $4.0 billion reduction in the second quarter to date (through May): ▪ ▪ ▪ $500 million of Agency MBS repo $2.3 billion of Non-Agency MBS, MSR Notes and CRT Securities repo; and $1.2 billion of residential whole loan repo. December 31, 2019 $9.1 billion repo March 31, 2020 $7.8 billion repo May 31, 2020 $3.8 billion repo Non-Agency: $0.3 Non-Agency: $2.8 Non-Agency: $2.6 Whole loans: $4.7 Whole loans: $4.7 Whole loans: $3.5 MBS: $1.6 Agency MBS: $0.5 8 Amounts in above pie charts are in billions. “Non Agency” includes repurchase agreements for Non-Agency MBS, MSR Notes and CRT securities.
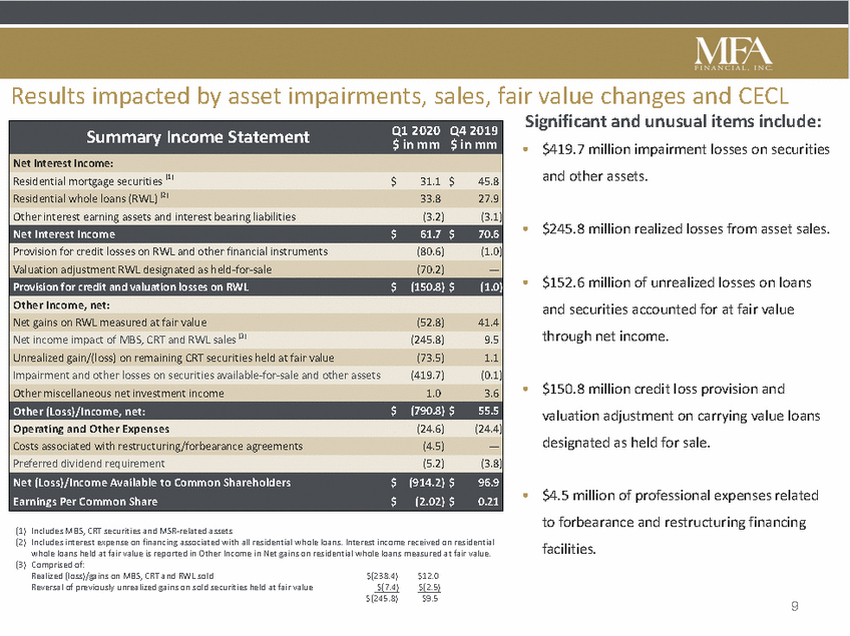
Results impacted by asset impairments, sales, fair value changes and CECL Significant and unusual items include: $ in mm $ in mm • $419.7 million impairment losses on securities and other assets. • $245.8 million realized losses from asset sales. • $152.6 million of unrealized losses on loans and securities accounted for at fair value through net income. • $150.8 million credit loss provision and valuation adjustment on carrying value loans designated as held for sale. • $4.5 million of professional expenses related to forbearance and restructuring financing facilities. (1) Includes MBS, CRT securities and MSR-related assets (2) Includes interest expense on financing associated with all residential whole loans. Interest income received on residential whole loans held at fair value is reported in Other Income in Net gains on residential whole loans measured at fair value. (3) Comprised of: Realized (loss)/gains on MBS, CRT and RWL sold Reversal of previously unrealized gains on sold securities held at fair value $(238.4) $(7.4) $12.0 $(2.5) $(245.8) $9.5 9 Summary Income StatementQ1 2020 Q4 2019 Net Interest Income: Residential mortgage securities (1)$31.1 $45.8 Residential whole loans (RWL) (2)33.827.9 Other interest earning assets and interest bearing liabilities(3.2)(3.1) Net Interest Income$61.7 $70.6 Provision for credit losses on RWL and other financial instruments(80.6)(1.0) Valuation adjustment RWL designated as held-for-sale(70.2)— Provision for credit and valuation losses on RWL$(150.8) $(1.0) Other Income, net: Net gains on RWL measured at fair value(52.8)41.4 Net income impact of MBS, CRT and RWL sales (3)(245.8)9.5 Unrealized gain/(loss) on remaining CRT securities held at fair value(73.5)1.1 Impairment and other losses on securities available-for-sale and other assets(419.7)(0.1) Other miscellaneous net investment income1.03.6 Other (Loss)/Income, net:$(790.8) $55.5 Operating and Other Expenses(24.6)(24.4) Costs associated with restructuring/forbearance agreements(4.5)— Preferred dividend requirement(5.2)(3.8) Net (Loss)/Income Available to Common Shareholders$(914.2) $96.9 Earnings Per Common Share$(2.02) $0.21
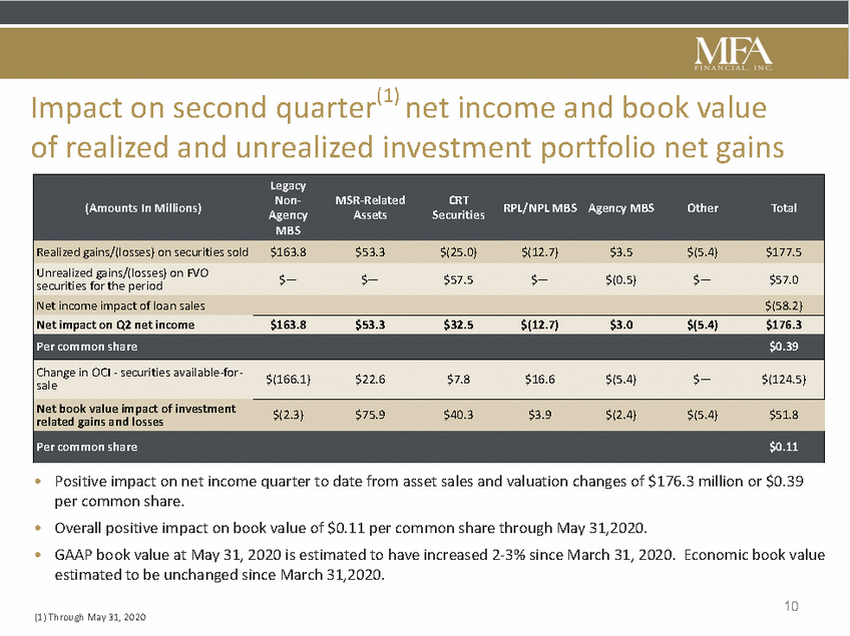
Impact on second quarter(1) net income and book value of realized and unrealized investment portfolio net gains Agency Assets Securities $— $— $57.5 $— $(0.5) $— $57.0 securities for the period $(166.1) $22.6 $7.8 $16.6 $(5.4) $— $(124.5) sale $(2.3) $75.9 $40.3 $3.9 $(2.4) $(5.4) $51.8 related gains and losses • Positive impact on net income quarter to date from asset sales and valuation changes of $176.3 million or $0.39 per common share. Overall positive impact on book value of $0.11 per common share through May 31,2020. GAAP book value at May 31, 2020 is estimated to have increased 2-3% since March 31, 2020. Economic book value estimated to be unchanged since March 31,2020. • • 10 (1) Through May 31, 2020 Legacy (Amounts In Millions)Non-MSR-RelatedCRTRPL/NPL MBS Agency MBSOtherTotal MBS Realized gains/(losses) on securities sold$163.8$53.3$(25.0)$(12.7)$3.5$(5.4)$177.5 Unrealized gains/(losses) on FVO Net income impact of loan sales$(58.2) Net impact on Q2 net income$163.8$53.3$32.5$(12.7)$3.0$(5.4)$176.3 Per common share$0.39 Change in OCI - securities available-for-Net book value impact of investment Per common share$0.11
Summary • Closing of the $500 million term loan and committed non-mark-to-market financing of approximately $1.65 billion is expected to stabilize the balance sheet and facilitate exit from forbearance. • Strategic relationship with Apollo and Athene provide significant potential opportunities for our future investment and financing strategy. • First quarter earnings and book value significantly impacted by COVID-19 impact on market liquidity, resulting in dislocation in pricing for residential mortgage assets. • As markets started to recover, particularly for certain securities, we worked diligently to preserve book value through judicious sales of assets, generating net gains that have positively impacted second quarter earnings and book value through May, 31 2020. • Current investment portfolio is 95% residential whole loans and REO. At June 12, 2020, cash on hand was $242 million. Unpaid margin calls significantly reduced to $32 million. 11

Additional Information 12
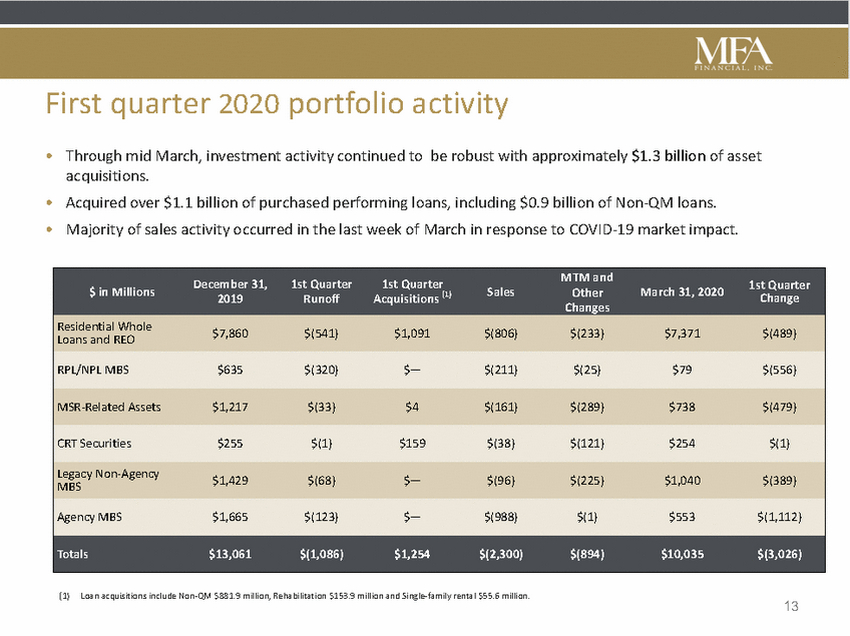
First quarter 2020 portfolio activity • Through mid March, investment activity continued to be robust with approximately $1.3 billion of asset acquisitions. Acquired over $1.1 billion of purchased performing loans, including $0.9 billion of Non-QM loans. Majority of sales activity occurred in the last week of March in response to COVID-19 market impact. • • December 31, 1st Quarter 1st Quarter 1st Quarter $ in Millions March 31, 2020 Changes $7,860 $(541) $1,091 $(806) $(233) $7,371 $(489) Loans and REO $1,429 $(68) $— $(96) $(225) $1,040 $(389) MBS (1) Loan acquisitions include Non-QM $881.9 million, Rehabilitation $153.9 million and Single-family rental $55.6 million. 13 MTM and 2019RunoffAcquisitions (1) SalesOtherChange Residential Whole RPL/NPL MBS$635$(320)$—$(211)$(25)$79$(556) MSR-Related Assets$1,217$(33)$4$(161)$(289)$738$(479) CRT Securities$255$(1)$159$(38)$(121)$254$(1) Legacy Non-Agency Agency MBS$1,665$(123)$—$(988)$(1)$553$(1,112) Totals$13,061$(1,086)$1,254$(2,300)$(894)$10,035$(3,026)
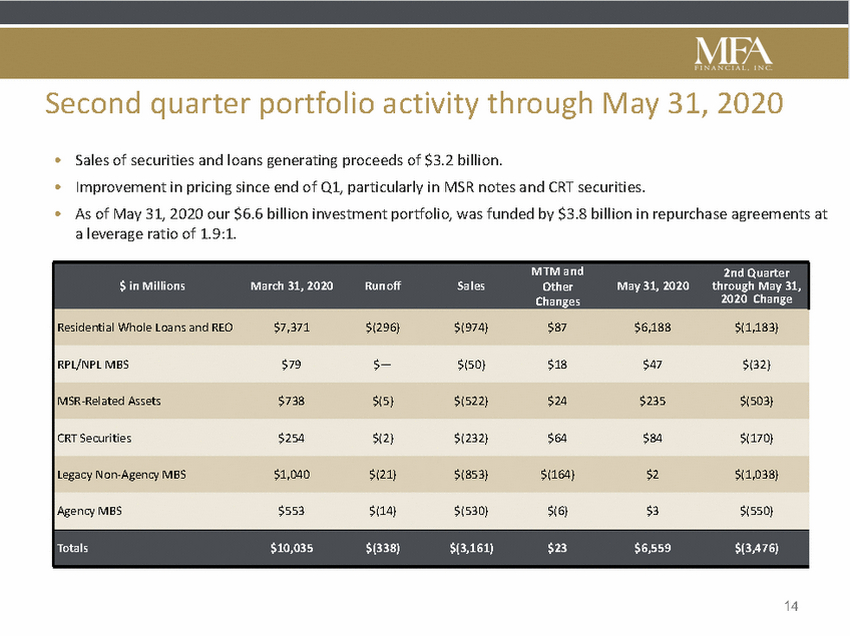
Second quarter portfolio activity through May 31, 2020 • • • Sales of securities and loans generating proceeds of $3.2 billion. Improvement in pricing since end of Q1, particularly in MSR notes and CRT securities. As of May 31, 2020 our $6.6 billion investment portfolio, was funded by $3.8 billion in repurchase agreements at a leverage ratio of 1.9:1. 2020 Change Changes 14 MTM and2nd Quarter $ in MillionsMarch 31, 2020RunoffSalesOtherMay 31, 2020through May 31, Residential Whole Loans and REO$7,371$(296)$(974)$87$6,188$(1,183) RPL/NPL MBS$79$—$(50)$18$47$(32) MSR-Related Assets$738$(5)$(522)$24$235$(503) CRT Securities$254$(2)$(232)$64$84$(170) Legacy Non-Agency MBS$1,040$(21)$(853)$(164)$2$(1,038) Agency MBS$553$(14)$(530)$(6)$3$(550) Totals$10,035$(338)$(3,161)$23$6,559$(3,476)
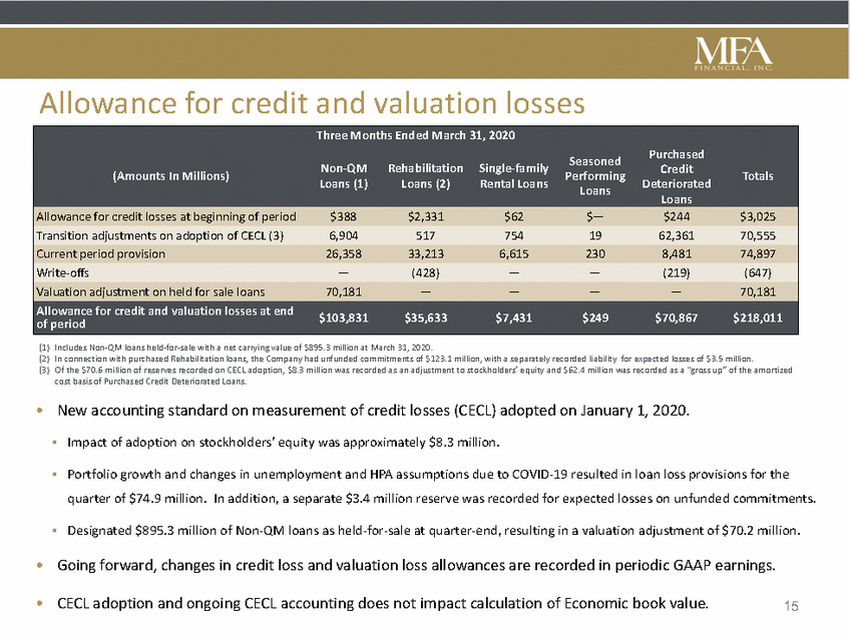
Allowance for credit and valuation losses Non-QM Rehabilitation Single-family Credit (Amounts In Millions) Performing Totals Loans $103,831 $35,633 $7,431 $249 $70,867 $218,011 of period (1) Includes Non-QM loans held-for-sale with a net carrying value of $895.3 million at March 31, 2020. (2) In connection with purchased Rehabilitation loans, the Company had unfunded commitments of $123.1 million, with a separately recorded liability for expected losses of $3.5 million. (3) Of the $70.6 million of reserves recorded on CECL adoption, $8.3 million was recorded as an adjustment to stockholders’ equity and $62.4 million was recorded as a “gross up” of the amortized cost basis of Purchased Credit Deteriorated Loans. • New accounting standard on measurement of credit losses (CECL) adopted on January 1, 2020. Impact of adoption on stockholders’ equity was approximately $8.3 million. ▪ ▪ Portfolio growth and changes in unemployment and HPA assumptions due to COVID-19 resulted in loan loss provisions for the quarter of $74.9 million. In addition, a separate $3.4 million reserve was recorded for expected losses on unfunded commitments. ▪ Designated $895.3 million of Non-QM loans as held-for-sale at quarter-end, resulting in a valuation adjustment of $70.2 million. • Going forward, changes in credit loss and valuation loss allowances are recorded in periodic GAAP earnings. • CECL adoption and ongoing CECL accounting does not impact calculation of Economic book value. 15 Three Months Ended March 31, 2020 SeasonedPurchased Loans (1)Loans (2)Rental LoansLoansDeteriorated Allowance for credit losses at beginning of period$388$2,331$62$—$244$3,025 Transition adjustments on adoption of CECL (3)6,9045177541962,36170,555 Current period provision26,35833,2136,6152308,48174,897 Write-offs—(428)——(219)(647) Valuation adjustment on held for sale loans70,181————70,181 Allowance for credit and valuation losses at end
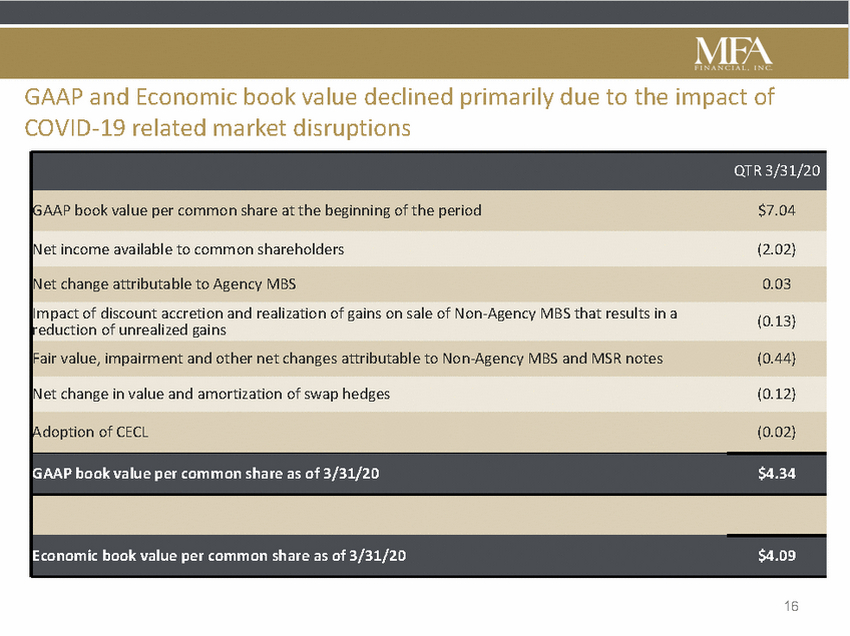
GAAP and Economic book value declined primarily due to the impact of COVID-19 related market disruptions (0.13) reduction of unrealized gains 16 QTR 3/31/20 GAAP book value per common share at the beginning of the period$7.04 Net income available to common shareholders(2.02) Net change attributable to Agency MBS0.03 Impact of discount accretion and realization of gains on sale of Non-Agency MBS that results in a Fair value, impairment and other net changes attributable to Non-Agency MBS and MSR notes(0.44) Net change in value and amortization of swap hedges(0.12) Adoption of CECL(0.02) GAAP book value per common share as of 3/31/20$4.34 Economic book value per common share as of 3/31/20$4.09
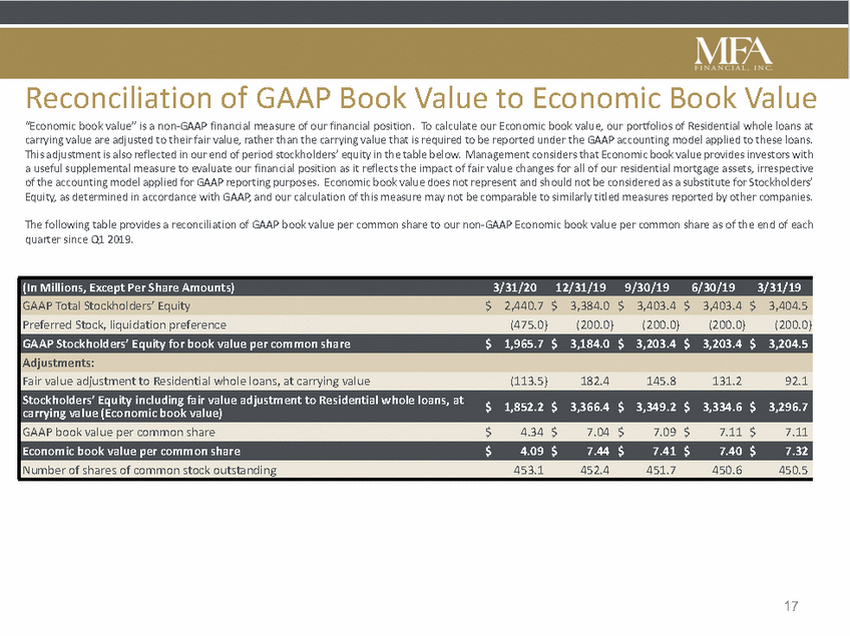
Reconciliation of GAAP Book Value to Economic Book Value “Economic book value” is a non-GAAP financial measure of our financial position. To calculate our Economic book value, our portfolios of Residential whole loans at carrying value are adjusted to their fair value, rather than the carrying value that is required to be reported under the GAAP accounting model applied to these loans. This adjustment is also reflected in our end of period stockholders’ equity in the table below. Management considers that Economic book value provides investors with a useful supplemental measure to evaluate our financial position as it reflects the impact of fair value changes for all of our residential mortgage assets, irrespective of the accounting model applied for GAAP reporting purposes. Economic book value does not represent and should not be considered as a substitute for Stockholders’ Equity, as determined in accordance with GAAP, and our calculation of this measure may not be comparable to similarly titled measures reported by other companies. The following table provides a reconciliation of GAAP book value per common share to our non-GAAP Economic book value per common share as of the end of each quarter since Q1 2019. $ 1,852.2 $ 3,366.4 $ 3,349.2 $ 3,334.6 $ 3,296.7 carrying value (Economic book value) 17 (In Millions, Except Per Share Amounts)3/31/2012/31/199/30/196/30/193/31/19 GAAP Total Stockholders’ Equity$2,440.7 $3,384.0 $3,403.4 $3,403.4 $3,404.5 Preferred Stock, liquidation preference(475.0)(200.0)(200.0)(200.0)(200.0) GAAP Stockholders’ Equity for book value per common share$1,965.7 $3,184.0 $3,203.4 $3,203.4 $3,204.5 Adjustments: Fair value adjustment to Residential whole loans, at carrying value(113.5)182.4145.8131.292.1 Stockholders’ Equity including fair value adjustment to Residential whole loans, at GAAP book value per common share$4.34 $7.04 $7.09 $7.11 $7.11 Economic book value per common share$4.09 $7.44 $7.41 $7.40 $7.32 Number of shares of common stock outstanding453.1452.4451.7450.6450.5