Attached files
| file | filename |
|---|---|
| 8-K - FORM 8-K - FIFTH THIRD BANCORP | d864009d8k.htm |
Morgan Stanley Virtual US Financials Conference Greg D. Carmichael Chairman, President & Chief Executive Officer June 10, 2020 Exhibit 99.1
Cautionary statement This presentation contains statements that we believe are “forward-looking statements” within the meaning of Section 27A of the Securities Act of 1933, as amended, and Rule 175 promulgated thereunder, and Section 21E of the Securities Exchange Act of 1934, as amended, and Rule 3b-6 promulgated thereunder. These statements relate to our financial condition, results of operations, plans, objectives, future performance or business. They usually can be identified by the use of forward-looking language such as “will likely result,” “may,” “are expected to,” “is anticipated,” “potential,” “estimate,” “forecast,” “projected,” “intends to,” or may include other similar words or phrases such as “believes,” “plans,” “trend,” “objective,” “continue,” “remain,” or similar expressions, or future or conditional verbs such as “will,” “would,” “should,” “could,” “might,” “can,” or similar verbs. You should not place undue reliance on these statements, as they are subject to risks and uncertainties, including but not limited to the risk factors set forth in our most recent Annual Report on Form 10-K as updated by our Quarterly Reports on Form 10-Q. When considering these forward-looking statements, you should keep in mind these risks and uncertainties, as well as any cautionary statements we may make. Moreover, you should treat these statements as speaking only as of the date they are made and based only on information then actually known to us. We undertake no obligation to release revisions to these forward-looking statements or reflect events or circumstances after the date of this document. There are a number of important factors that could cause future results to differ materially from historical performance and these forward-looking statements. Factors that might cause such a difference include, but are not limited to: (1) effects of the global COVID-19 pandemic; (2) deteriorating credit quality; (3) loan concentration by location or industry of borrowers or collateral; (4) problems encountered by other financial institutions; (5) inadequate sources of funding or liquidity; (6) unfavorable actions of rating agencies; (7) inability to maintain or grow deposits; (8) limitations on the ability to receive dividends from subsidiaries; (9) cyber-security risks; (10) Fifth Third’s ability to secure confidential information and deliver products and services through the use of computer systems and telecommunications networks; (11) failures by third-party service providers; (12) inability to manage strategic initiatives and/or organizational changes; (13) inability to implement technology system enhancements; (14) failure of internal controls and other risk management systems; (15) losses related to fraud, theft or violence; (16) inability to attract and retain skilled personnel; (17) adverse impacts of government regulation; (18) governmental or regulatory changes or other actions; (19) failures to meet applicable capital requirements; (20) regulatory objections to Fifth Third’s capital plan; (21) regulation of Fifth Third’s derivatives activities; (22) deposit insurance premiums; (23) assessments for the orderly liquidation fund; (24) replacement of LIBOR; (25) weakness in the national or local economies; (26) global political and economic uncertainty or negative actions; (27) changes in interest rates; (28) changes and trends in capital markets; (29) fluctuation of Fifth Third’s stock price; (30) volatility in mortgage banking revenue; (31) litigation, investigations and enforcement proceedings by governmental authorities; (32) breaches of contractual covenants, representations and warranties; (33) competition and changes in the financial services industry; (34) changing retail distribution strategies, customer preferences and behavior; (35) risks relating to Fifth Third’s ability to realize the anticipated benefits of the merger with MB Financial, Inc.; (36) difficulties in identifying, acquiring or integrating suitable strategic partnerships, investments or acquisitions; (37) potential dilution from future acquisitions; (38) loss of income and/or difficulties encountered in the sale and separation of businesses, investments or other assets; (39)results of investments or acquired entities; (40) changes in accounting standards or interpretation or declines in the value of Fifth Third’s goodwill or other intangible assets; (41) inaccuracies or other failures from the use of models; (42) effects of critical accounting policies and judgments or the use of inaccurate estimates; (43) weather-related events, other natural disasters, or health emergencies; and (44) the impact of reputational risk created by these or other developments on such matters as business generation and retention, funding and liquidity. You should refer to our periodic and current reports filed with the Securities and Exchange Commission, or “SEC,” for further information on other factors, which could cause actual results to be significantly different from those expressed or implied by these forward-looking statements. Annualized, pro forma, projected and estimated numbers are used for illustrative purpose only, are not forecasts and may not reflect actual results.
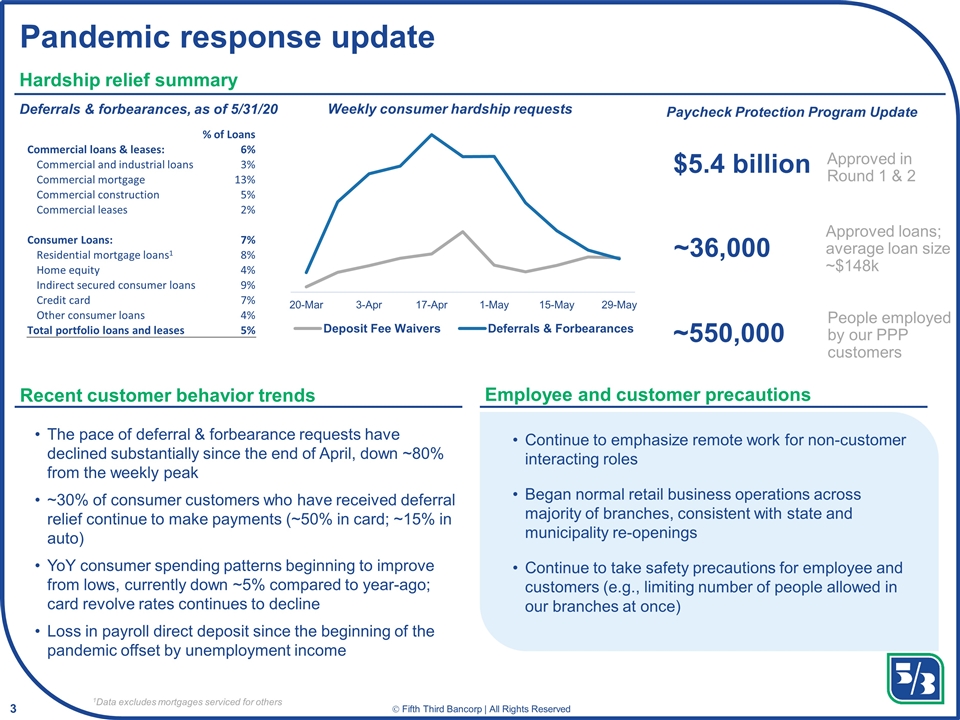
Pandemic response update The pace of deferral & forbearance requests have declined substantially since the end of April, down ~80% from the weekly peak ~30% of consumer customers who have received deferral relief continue to make payments (~50% in card; ~15% in auto) YoY consumer spending patterns beginning to improve from lows, currently down ~5% compared to year-ago; card revolve rates continues to decline Loss in payroll direct deposit since the beginning of the pandemic offset by unemployment income Continue to emphasize remote work for non-customer interacting roles Began normal retail business operations across majority of branches, consistent with state and municipality re-openings Continue to take safety precautions for employee and customers (e.g., limiting number of people allowed in our branches at once) Recent customer behavior trends Hardship relief summary Weekly consumer hardship requests % of Loans Commercial loans & leases: 6% Commercial and industrial loans 3% Commercial mortgage 13% Commercial construction 5% Commercial leases 2% Consumer Loans: 7% Residential mortgage loans1 8% Home equity 4% Indirect secured consumer loans 9% Credit card 7% Other consumer loans 4% Total portfolio loans and leases 5% Deferrals & forbearances, as of 5/31/20 Paycheck Protection Program Update $5.4 billion ~36,000 ~550,000 Approved in Round 1 & 2 Approved loans; average loan size ~$148k People employed by our PPP customers Employee and customer precautions 1Data excludes mortgages serviced for others
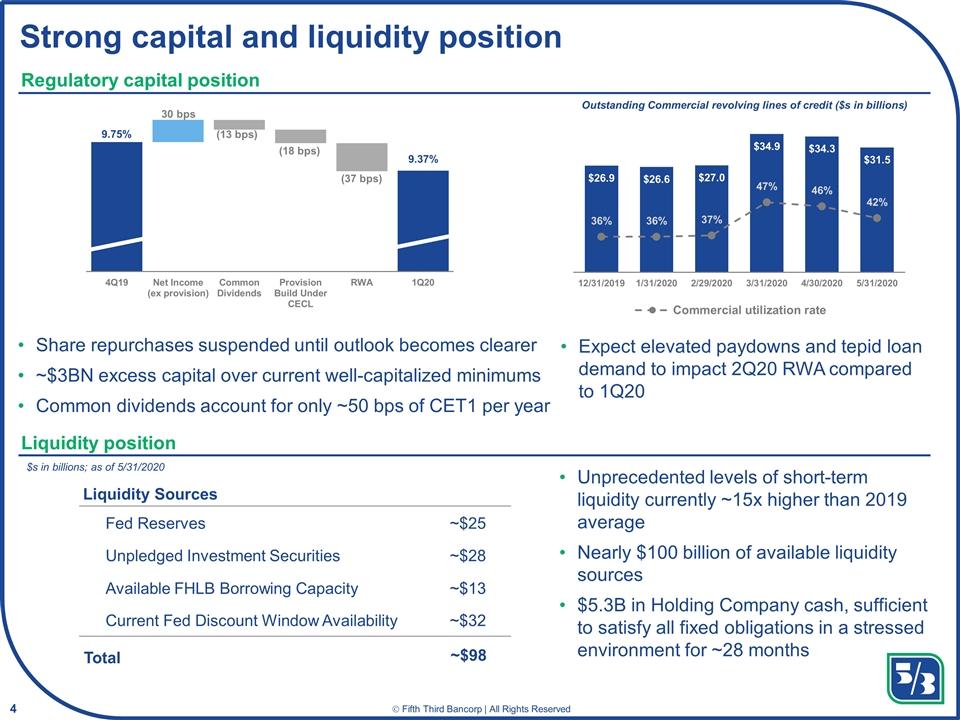
Unprecedented levels of short-term liquidity currently ~15x higher than 2019 average Nearly $100 billion of available liquidity sources $5.3B in Holding Company cash, sufficient to satisfy all fixed obligations in a stressed environment for ~28 months Strong capital and liquidity position Regulatory capital position Liquidity position Fed Reserves Unpledged Investment Securities Available FHLB Borrowing Capacity Current Fed Discount Window Availability Total $s in billions; as of 5/31/2020 ~$25 ~$28 ~$13 ~$32 ~$98 Liquidity Sources 30 bps (13 bps) (18 bps) (37 bps) Share repurchases suspended until outlook becomes clearer ~$3BN excess capital over current well-capitalized minimums Common dividends account for only ~50 bps of CET1 per year Expect elevated paydowns and tepid loan demand to impact 2Q20 RWA compared to 1Q20 Outstanding Commercial revolving lines of credit ($s in billions)
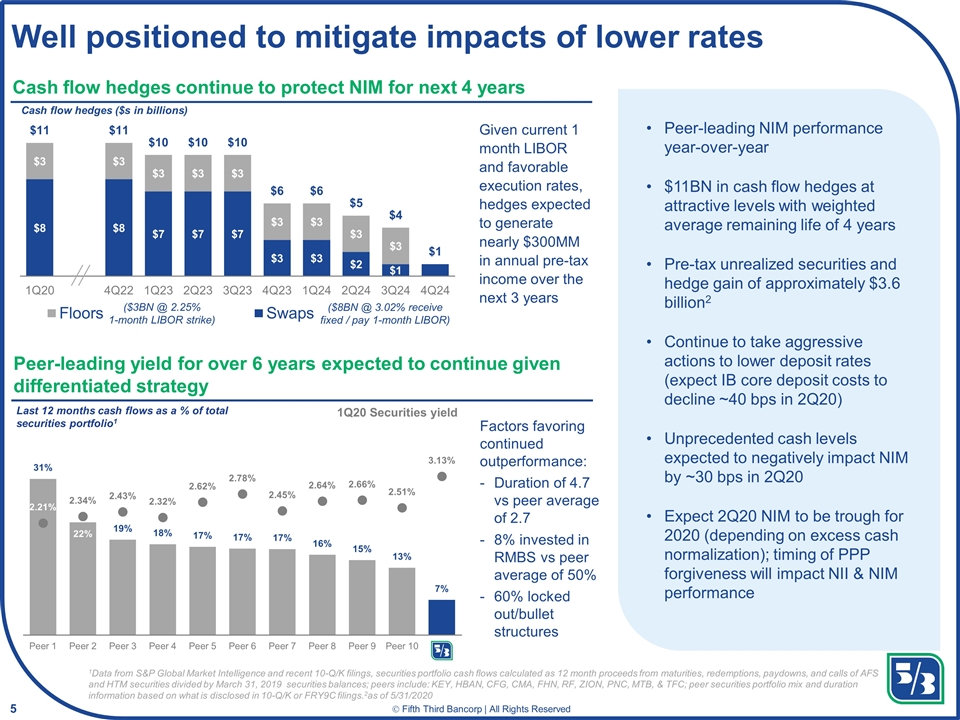
Factors favoring continued outperformance: Duration of 4.7 vs peer average of 2.7 8% invested in RMBS vs peer average of 50% 60% locked out/bullet structures Well positioned to mitigate impacts of lower rates Cash flow hedges ($s in billions) Peer-leading yield for over 6 years expected to continue given differentiated strategy Peer-leading NIM performance year-over-year $11BN in cash flow hedges at attractive levels with weighted average remaining life of 4 years Pre-tax unrealized securities and hedge gain of approximately $3.6 billion2 Continue to take aggressive actions to lower deposit rates (expect IB core deposit costs to decline ~40 bps in 2Q20) Unprecedented cash levels expected to negatively impact NIM by ~30 bps in 2Q20 Expect 2Q20 NIM to be trough for 2020 (depending on excess cash normalization); timing of PPP forgiveness will impact NII & NIM performance Last 12 months cash flows as a % of total securities portfolio1 1Q20 Securities yield Cash flow hedges continue to protect NIM for next 4 years ($3BN @ 2.25% 1-month LIBOR strike) ($8BN @ 3.02% receive fixed / pay 1-month LIBOR) Given current 1 month LIBOR and favorable execution rates, hedges expected to generate nearly $300MM in annual pre-tax income over the next 3 years 1Data from S&P Global Market Intelligence and recent 10-Q/K filings, securities portfolio cash flows calculated as 12 month proceeds from maturities, redemptions, paydowns, and calls of AFS and HTM securities divided by March 31, 2019 securities balances; peers include: KEY, HBAN, CFG, CMA, FHN, RF, ZION, PNC, MTB, & TFC; peer securities portfolio mix and duration information based on what is disclosed in 10-Q/K or FRY9C filings.2as of 5/31/2020
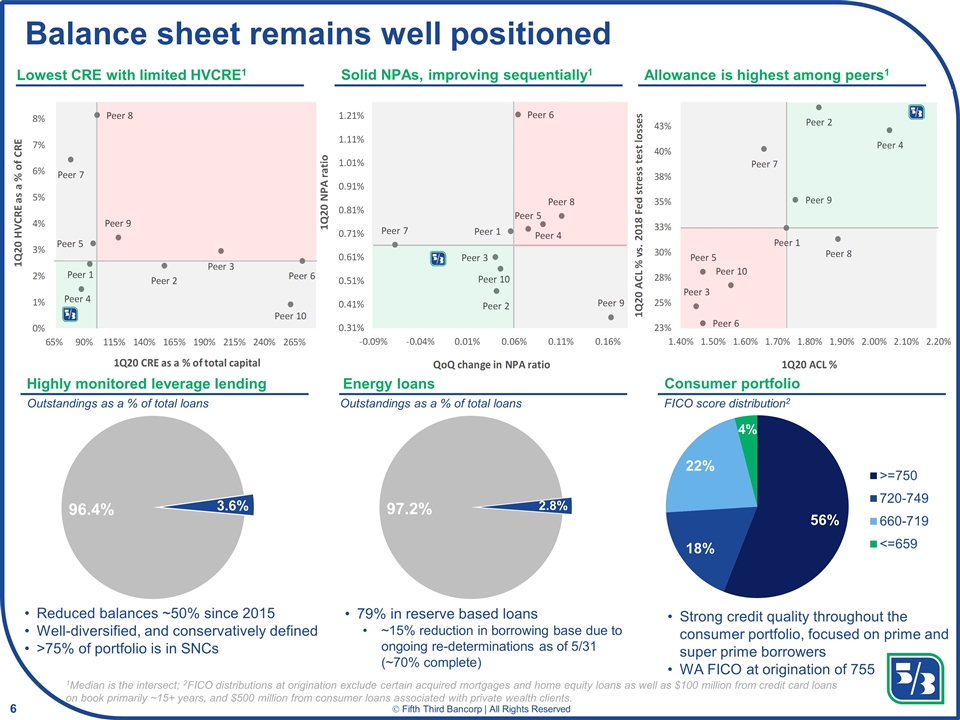
Balance sheet remains well positioned Reduced balances ~50% since 2015 Well-diversified, and conservatively defined >75% of portfolio is in SNCs Highly monitored leverage lending Outstandings as a % of total loans Energy loans Consumer portfolio FICO score distribution2 Allowance is highest among peers1 Lowest CRE with limited HVCRE1 Solid NPAs, improving sequentially1 79% in reserve based loans ~15% reduction in borrowing base due to ongoing re-determinations as of 5/31 (~70% complete) Strong credit quality throughout the consumer portfolio, focused on prime and super prime borrowers WA FICO at origination of 755 Outstandings as a % of total loans 1Median is the intersect; 2FICO distributions at origination exclude certain acquired mortgages and home equity loans as well as $100 million from credit card loans on book primarily ~15+ years, and $500 million from consumer loans associated with private wealth clients.
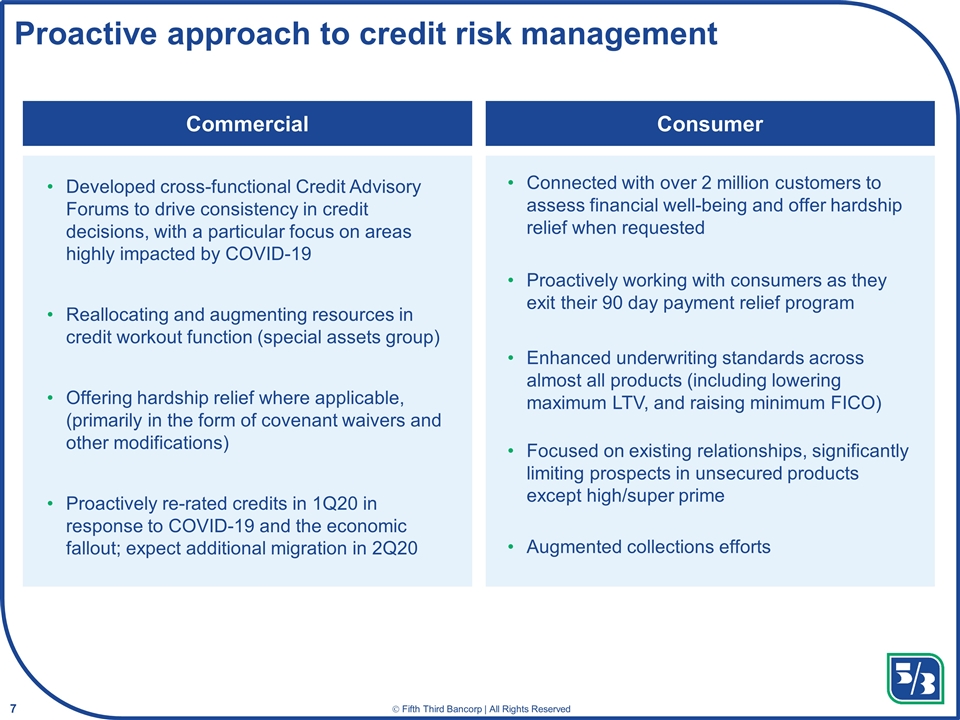
Proactive approach to credit risk management Developed cross-functional Credit Advisory Forums to drive consistency in credit decisions, with a particular focus on areas highly impacted by COVID-19 Reallocating and augmenting resources in credit workout function (special assets group) Offering hardship relief where applicable, (primarily in the form of covenant waivers and other modifications) Proactively re-rated credits in 1Q20 in response to COVID-19 and the economic fallout; expect additional migration in 2Q20 Connected with over 2 million customers to assess financial well-being and offer hardship relief when requested Proactively working with consumers as they exit their 90 day payment relief program Enhanced underwriting standards across almost all products (including lowering maximum LTV, and raising minimum FICO) Focused on existing relationships, significantly limiting prospects in unsecured products except high/super prime Augmented collections efforts Commercial Consumer
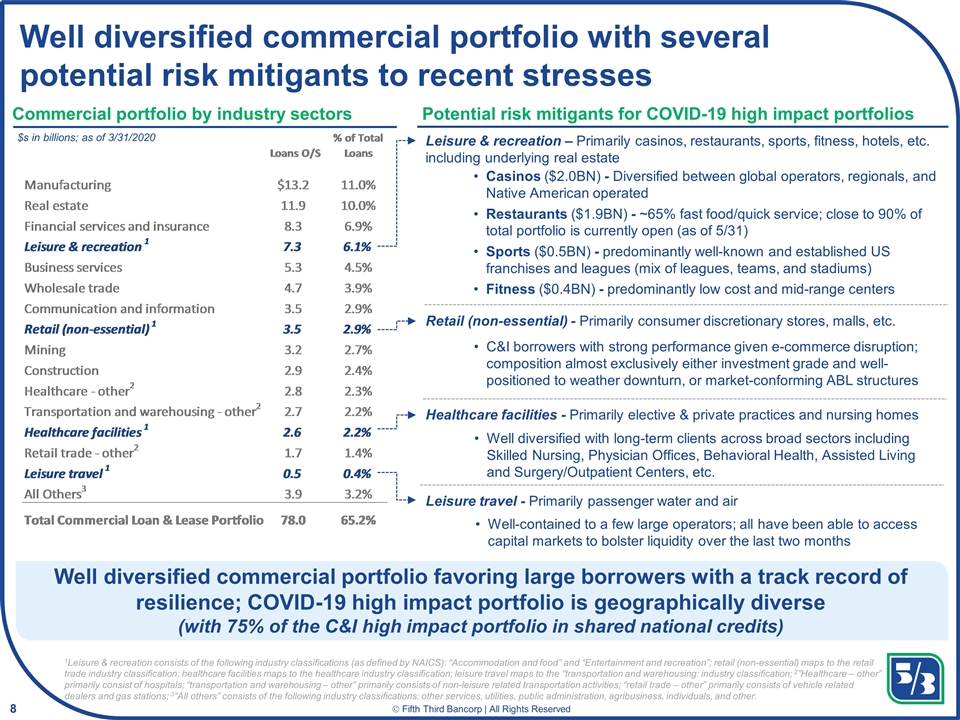
Commercial portfolio by industry sectors Well diversified commercial portfolio with several potential risk mitigants to recent stresses $s in billions; as of 3/31/2020 Potential risk mitigants for COVID-19 high impact portfolios Well diversified commercial portfolio favoring large borrowers with a track record of resilience; COVID-19 high impact portfolio is geographically diverse (with 75% of the C&I high impact portfolio in shared national credits) Casinos ($2.0BN) - Diversified between global operators, regionals, and Native American operated Restaurants ($1.9BN) - ~65% fast food/quick service; close to 90% of total portfolio is currently open (as of 5/31) Sports ($0.5BN) - predominantly well-known and established US franchises and leagues (mix of leagues, teams, and stadiums) Fitness ($0.4BN) - predominantly low cost and mid-range centers Leisure & recreation – Primarily casinos, restaurants, sports, fitness, hotels, etc. including underlying real estate Healthcare facilities - Primarily elective & private practices and nursing homes Well diversified with long-term clients across broad sectors including Skilled Nursing, Physician Offices, Behavioral Health, Assisted Living and Surgery/Outpatient Centers, etc. Retail (non-essential) - Primarily consumer discretionary stores, malls, etc. C&I borrowers with strong performance given e-commerce disruption; composition almost exclusively either investment grade and well-positioned to weather downturn, or market-conforming ABL structures Leisure travel - Primarily passenger water and air Well-contained to a few large operators; all have been able to access capital markets to bolster liquidity over the last two months 1Leisure & recreation consists of the following industry classifications (as defined by NAICS): “Accommodation and food” and “Entertainment and recreation”; retail (non-essential) maps to the retail trade industry classification; healthcare facilities maps to the healthcare industry classification; leisure travel maps to the “transportation and warehousing: industry classification; 2”Healthcare – other” primarily consist of hospitals; “transportation and warehousing – other” primarily consists of non-leisure related transportation activities; “retail trade – other” primarily consists of vehicle related dealers and gas stations; 3”All others” consists of the following industry classifications: other services, utilities, public administration, agribusiness, individuals, and other.
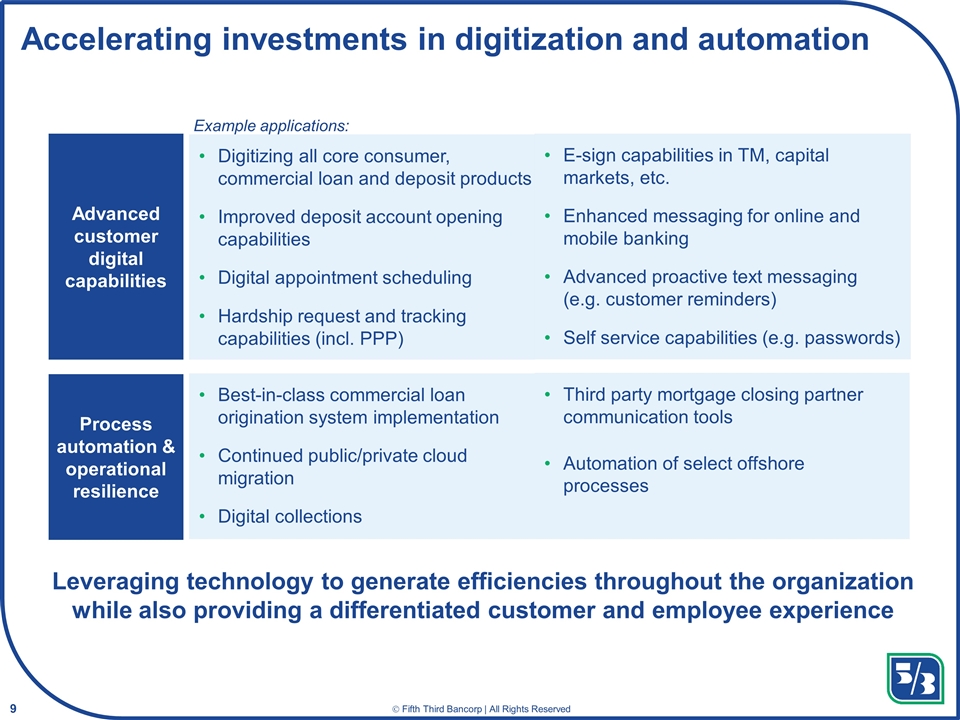
Accelerating investments in digitization and automation Digitizing all core consumer, commercial loan and deposit products Improved deposit account opening capabilities Digital appointment scheduling Hardship request and tracking capabilities (incl. PPP) Advanced customer digital capabilities Process automation & operational resilience Best-in-class commercial loan origination system implementation Continued public/private cloud migration Digital collections Example applications: Leveraging technology to generate efficiencies throughout the organization while also providing a differentiated customer and employee experience E-sign capabilities in TM, capital markets, etc. Enhanced messaging for online and mobile banking Advanced proactive text messaging (e.g. customer reminders) Self service capabilities (e.g. passwords) Third party mortgage closing partner communication tools Automation of select offshore processes
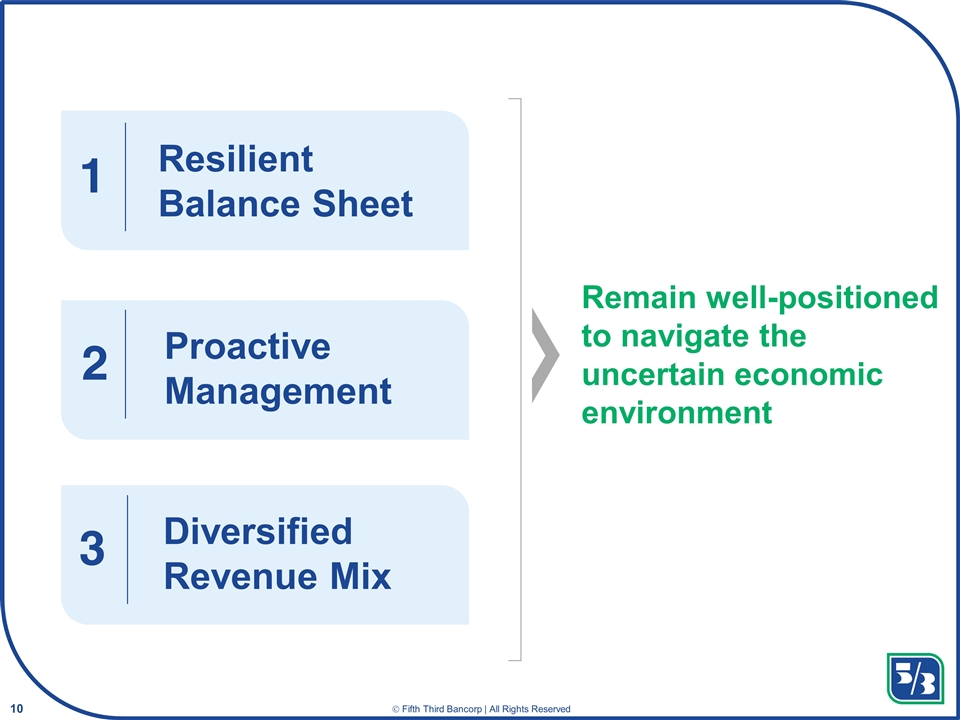
Remain well-positioned to navigate the uncertain economic environment Resilient Balance Sheet Proactive Management Diversified Revenue Mix 1 2 3
