Attached files
| file | filename |
|---|---|
| 8-K - FORM 8-K - SiteOne Landscape Supply, Inc. | tm2022074d1_8k.htm |
Exhibit 99.1

40 th Annual William Blair Growth Stock Conference June 9, 2020
2 Disclaimer Forward - Looking Statements This presentation contains “forward - looking statements” within the meaning of the Federal Private Securities Litigation Reform A ct of 1995. Forward - looking statements may include, but are not limited to, statements relating to our 2020 Adjusted EBITDA outlook. Some of the forward - looking statements can be identified by the use of terms such as “may,” “intend,” “might,” “will,” “should,” “could,” “would,” “expect,” “believe,” “estimate,” “anticipate,” “predict,” “proj ect ,” “potential,” or the negative of these terms, and similar expressions. You should be aware that these forward - looking statements are subject to risks and uncertainties that are beyond ou r control. Further, any forward - looking statement speaks only as of the date on which it is made, and we undertake no obligation to update any forward - looking statement to reflec t events or circumstances after the date on which it is made or to reflect the occurrence of anticipated or unanticipated events or circumstances. New factors emerge from time to ti me that may cause our business not to develop as we expect, and it is not possible for us to predict all of them. Factors that may cause actual results to differ materially f rom those expressed or implied by the forward - looking statements include, but are not limited to, the following: the potential negative impact of the COVID - 19 pandemic (which, among other things, may exacerbate each of the risk listed below); economic downturn or recession; cyclicality in residential and commercial construction markets; general economic and fin ancial conditions; weather conditions, seasonality and availability of water to end - users; public perceptions that our products and services are not environmentally friendly; comp etitive industry pressures; product shortages and the loss of key suppliers; product price fluctuations; ability to pass along product cost increases; inventory management risks; abi lity to implement our business strategies and achieve our growth objectives; acquisition and integration risks; increased operating costs; risks associated with our large labor fo rce (including work stoppages due to COVID - 19); retention of key personnel; construction defect and product liability claims; impairment of goodwill; adverse credit and fina nci al markets events and conditions (which have worsened and may continue to worse as a result of the COVID - 19 pandemic); credit sale risks; performance of individual branches; environmental, health and safety laws and regulations; hazardous materials and related materials; laws and government regulations applicable to our business that could ne gatively impact demand for our products; computer data processing systems; cybersecurity incidents; security of personal information about our customers; intellectual pr operty and other proprietary rights; the possibility of securities litigation; unanticipated changes in our tax provisions; our substantial indebtedness and our ability to obtain fi nan cing in the future; increases in interest rates; risks related to our common stock; terrorism or the threat of terrorism; and other risks, as described in Item 1A , “Risk Factors,” and elsewhere in our Annual Report on Form 10 - K for the fiscal year ended December 29, 2019, as updated by our subsequent filings under the Securities Exchange Act of 1934, as amend ed, including Forms 10 - Q and 8 - K. Non - GAAP Financial Information This release includes certain financial information, not prepared in accordance with U.S. GAAP. Because not all companies cal cul ate non - GAAP financial information identically (or at all), the presentations herein may not be comparable to other similarly titled measures used by other companies. Further, the se measures should not be considered substitutes for the information contained in the historical financial information of the Company prepared in accordance with U.S. GAAP th at is set forth herein. We present Adjusted EBITDA in order to evaluate the operating performance and efficiency of our business. Adjusted EBITDA rep res ents EBITDA as further adjusted for items permitted under the covenants of our credit facilities. EBITDA represents our net income (loss) plus the sum of income tax (b ene fit) expense, interest expense, net of interest income, and depreciation and amortization. Adjusted EBITDA is further adjusted for stock - based compensation expense, (gain) loss on sale of assets not in the ordinary course of business, other non - cash items, financing fees, other fees, and expenses related to acquisitions and other non - recurring (income ) loss. Adjusted EBITDA excludes any earnings or loss of acquisitions prior to their respective acquisition dates for all periods presented. Adjusted EBITDA is not a measure of our liquidity or financial performance under GAAP and should not be considered as an alternative to net income, operating income or any other performance measures derived in accor dan ce with GAAP, or as an alternative to cash flow from operating activities as a measure of our liquidity. The use of Adjusted EBITDA instead of net income has limitations as an analytical tool. Because not all companies use identical calculations, our presentation of Adjusted EBITDA may not be comparable to other similarly titled measures of other co mpanies, limiting its usefulness as a comparative measure. Net debt is defined as long - term debt (net of issuance costs and discounts) plus finance leases, net of cash and cash - e quivalents on our balance sheet. Leverage Ratio is defined as Net Debt to trailing twelve months Adjusted EBITDA. We define Organic Daily Sales as Organic Sales divided by the number of Selling Days in the relevant reporting period. We define Organic Sales as Net sales, including Net sales from newly - opened greenfield branches, but excluding Net sales from acquired branches until they have been under our ownership for at least four full fiscal quarters at the start of the fiscal year. Selling Days are the number of bu sin ess days, excluding Saturdays, Sundays and holidays, that SiteOne branches are open during the relevant reporting period.

3 Today’s Presenters Doug Black Chairman & CEO ▪ Joined SiteOne in April 2014 ▪ Previously spent 18 years at CRH plc most recently as President and COO of Oldcastle Inc. ▪ Held a variety of roles including CEO and COO of Oldcastle Materials ▪ Previously a consultant with McKinsey ▪ M.B.A. from Duke and B.S. from the U.S. Military Academy at West Point John Guthrie EVP & CFO ▪ 18 years with SiteOne managing Finance, Human Resources, Credit and Administration ▪ Previously with Deere & Co. in Finance ▪ M.B.A. from University of Chicago and B.S. from University of Illinois Scott Salmon EVP of Strategy & Development ▪ Joined SiteOne in March 2019 ▪ 17 years at CRH plc, recently as President of the Oldcastle Lawn & Garden division ▪ Experience at Oldcastle included four years as a senior Strategy and Development executive ▪ Served as an F - 16 Pilot and Flight Commander in the United States Air Force ▪ M.P.P from Harvard University and B.S. from the United States Air Force Academy

4 x 2020 Performance and Outlook with COVID - 19 Impacts x SiteOne Strategic Position Overview 12% (1) As of year end 2019. Management Estimates
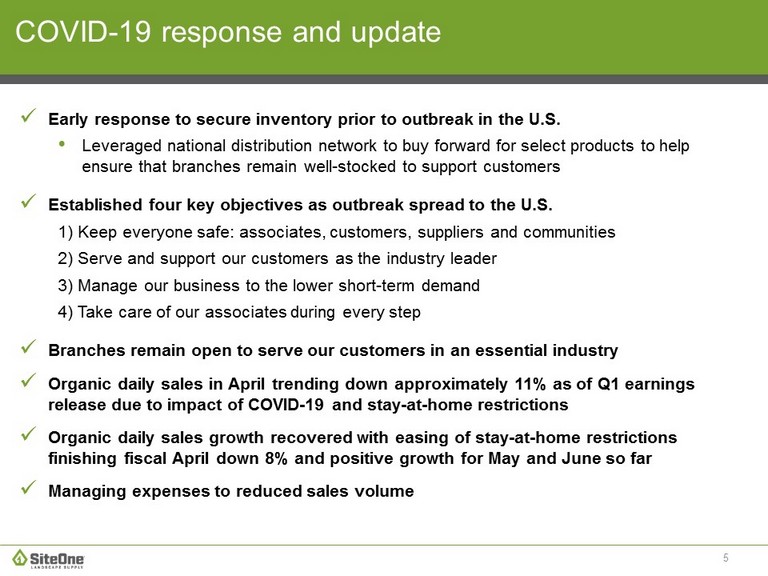
5 x Early response to secure inventory prior to outbreak in the U.S. • Leveraged national distribution network to buy forward for select products to help ensure that branches remain well - stocked to support customers x Established four key objectives as outbreak spread to the U.S. 1) Keep everyone safe: associates, customers, suppliers and communities 2) Serve and support our customers as the industry leader 3) Manage our business to the lower short - term demand 4) Take care of our associates during every step x Branches remain open to serve our customers in an essential industry x Organic daily sales in April trending down approximately 11% as of Q1 earnings release due to impact of COVID - 19 and stay - at - home restrictions x Organic daily sales growth recovered with easing of stay - at - home restrictions finishing fiscal April down 8% and positive growth for May and June so far x Managing expenses to reduced sales volume COVID - 19 response and update

6 x Managing liquidity in uncertain market environment • Borrowed ~$100 million under $375 million ABL Facility on April 1, 2020 to increase financial flexibility amid uncertainty in capital markets • Repaid borrowing on May 29, 2020 reflecting good cash flow and increased stability in capital markets • As of June 5 th , cash on hand was ~ $70 million and available ABL capacity was ~$187 million for total liquidity of ~$257 million • Reduced capital expenditures including postponement of pending acquisitions x Withdrew previously provided 2020 guidance given COVID - 19 uncertainty COVID - 19 response and update

7 First Quarter 2020 highlights x Net sales increased 10% to $459.8 million x Organic Daily Sales increased 5% x Gross profit increased 10% to $142.8 million; gross margin declined 10 bps to 31.1% x Net loss of $17.5 million, compared to net loss of $24.1 million in the prior - year period x Adjusted EBITDA loss of $3.6 million as a result of seasonality x Net leverage ratio of 3.2x compared to 3.6x in the prior year period x Completed 4 acquisitions with approximately $43 million in TTM net sales (1) x Announced the appointment of Shannon Versaggi as Chief Marketing Officer effective February 17, 2020 Source: Company data (1) Trailing twelve months (TTM) revenues in the year acquired

8 2020 Outlook x Continue to focus on keeping everyone safe x Sales trends have improved as state and local COVID - 19 restrictions have eased x Going forward sales expected to be supported by maintenance and commercial end markets x Carefully managing expenses and capital expenditures to maintain solid liquidity position going into an uncertain second half x Expect to resume M&A activity when end markets stabilize x Continue to pursue key commercial and operational initiatives

9 Company and industry overview ■ Largest and only national wholesale distributor of landscape supplies ■ $20 billion highly fragmented market (1) ■ More than four times the size of next competitor and only ~ 12% market share (1) ■ Serving residential and commercial landscape professionals ■ Complementary value - added services and product support ■ Approximately 120,000 SKUs ■ Over 550 branches and three distribution centers covering 45 U.S. states and six Canadian provinces (2) Balanced end markets (FY19) (1) As of year end 2019. Source: Management estimates, Company data, independent 3 rd party support (2) Branch count a s of Q1 ‘20 Maintenance 42% New Construction 41% Repair & Upgrade 17% Distribution Center Branch
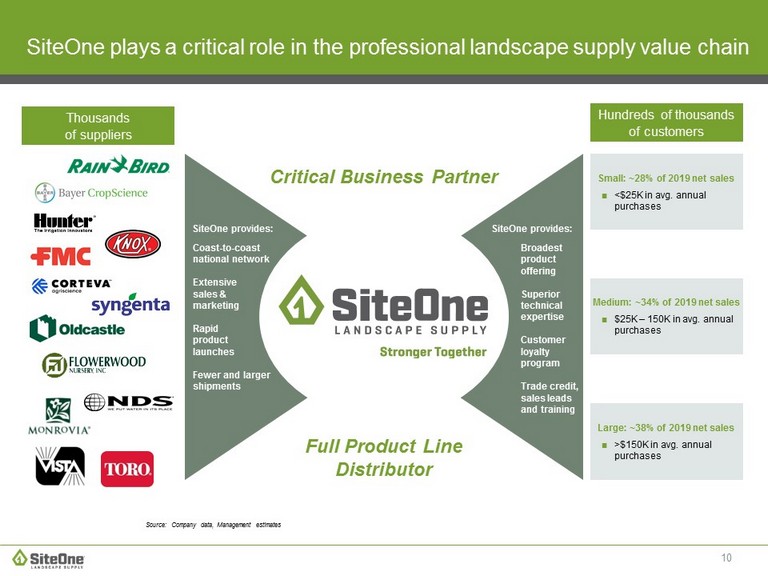
10 SiteOne plays a critical role in the professional landscape supply value chain Thousands of suppliers Hundreds of thousands of customers Large: ~ 38 % of 2019 net sales ■ >$150K in avg. annual purchases Medium: ~34% of 2019 net sales ■ $25K – 150K in avg. annual purchases Coast - to - coast national network Extensive sales & marketing Rapid product launches Fewer and larger shipments Broadest product offering Superior technical expertise Customer loyalty program Trade credit, sales leads and training SiteOne provides: SiteOne provides: Critical Business Pa rtner Small: ~28% of 2019 net sales ■ <$25K in avg. annual purchases Full Product Line Distributor Source: Company data, Management estimates

11 We are the only National full product line provider in the industry Irrigation & Lighting Agronomics Nursery Hardscapes Merchandised Products Market Position % of 2019 Sales 33% 28% 12% 13% 14% Key Products ▪ Sprinklers ▪ Controllers ▪ Pumps ▪ Outdoor lighting ▪ Fertilizer ▪ Control Products ▪ Seed ▪ Ice melt ▪ Trees ▪ Shrubs ▪ Accent plants ▪ Concrete paver & wall systems ▪ Natural Stone ▪ Bulk aggregates ▪ Accessories ▪ Merchandised accessories ▪ Consumables ▪ Erosion control ▪ Tools & equipment Key Suppliers #1 #1 #1 #1 #1 Four Verticals Landscape Accessories Source: Company data, Management estimates
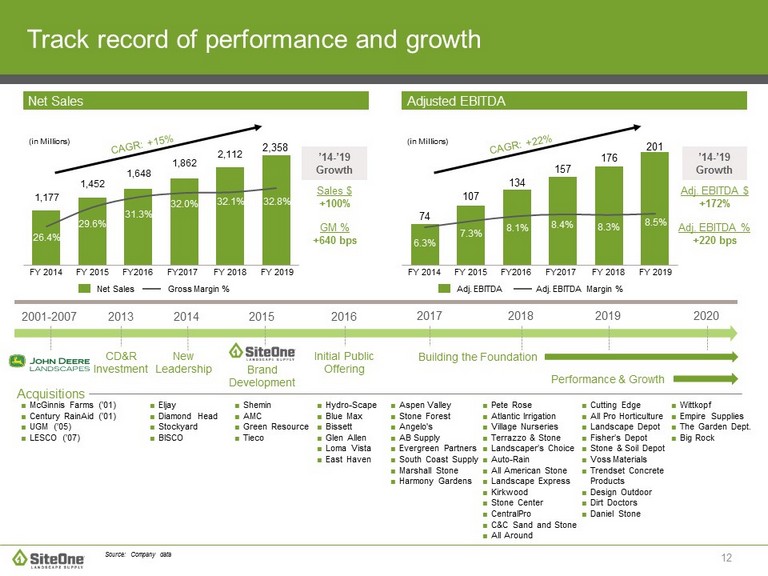
12 Track record of performance and growth ■ Eljay ■ Diamond Head ■ Stockyard ■ BISCO CD&R Investment ■ McGinnis Farms (’01) ■ Century RainAid (’01) ■ UGM (’05) ■ LESCO (’07) ■ Hydro - Scape ■ Blue Max ■ Bissett ■ Glen Allen ■ Loma Vista ■ East Haven ■ Aspen Valley ■ Stone Forest ■ Angelo's ■ AB Supply ■ Evergreen Partners ■ South Coast Supply ■ Marshall Stone ■ Harmony Gardens Building the Foundation ■ Pete Rose ■ Atlantic Irrigation ■ Village Nurseries ■ Terrazzo & Stone ■ Landscaper’s Choice ■ Auto - Rain ■ All American Stone ■ Landscape Express ■ Kirkwood ■ Stone Center ■ CentralPro ■ C&C Sand and Stone ■ All Around Source: Company data 2013 2001 - 2007 2014 2015 ■ Shemin ■ AMC ■ Green Resource ■ Tieco 2016 2017 2018 Initial Public Offering New Leadership 1,177 1,452 1,648 1,862 2,112 2,358 26.4% 31.3% FY 2014 29.6% FY 2015 FY2016 32.0% FY2017 Net Sales Gross Margin % Adj. EBITDA Adj. EBITDA Margin % Sales $ +100% GM % +640 bps Performance & Growth Brand Development (in Millions) Net Sales Adjusted EBITDA ’14 - ’19 Growth 32.1% FY 2018 ■ Cutting Edge ■ All Pro Horticulture ■ Landscape Depot ■ Fisher’s Depot ■ Stone & Soil Depot ■ Voss Materials ■ Trendset Concrete Products ■ Design Outdoor ■ Dirt Doctors ■ Daniel Stone 2019 Acquisitions 2020 ■ Wittkopf ■ Empire Supplies ■ The Garden Dept. ■ Big Rock FY 2019 32.8% 74 107 134 157 176 201 6.3% 8.1% FY 2014 7.3% FY 2015 FY2016 8.4% FY2017 Adj. EBITDA $ +172% Adj. EBITDA % +220 bps (in Millions) ’14 - ’19 Growth 8.3% FY 2018 FY 2019 8.5%

13 SiteOne is poised for long - term growth and margin enhancement Current strategy x Leverage strengths of both large and local company ■ Fully exploit our scale, resources and capabilities ■ Execute local market growth strategies ■ Deliver superior value to our customers and suppliers ■ Close and integrate high value - added acquisitions ■ Entrepreneurial local area teams supported by world - class leadership and functional support x Drive commercial and operational performance ■ Category management ■ Pricing ■ Supply chain ■ Salesforce performance ■ Marketing and e - Commerce ■ Operational excellence Value creation levers 1) Organic growth 2) Margin expansion 3) Acquisition growth

14 # of markets (1) Full Product Line Offering Missing either Hardscapes or Nursery Missing both Hardscapes and Nursery No Presence Significant room to grow across product lines Source: Management estimates; U.S. Census Bureau ~80 ~50 ~50 ~ 50 SiteOne offers all product lines in only ~21% of our target markets today… (1) Target markets as of 2019 are represented by metropolitan statistical areas (“MSAs”) where either SiteOne currently has a presence or MSAs with a population above ~200k, which cover ~80% of the total U.S. population. We have branches in approximately 50% of MSAs.

15 x SiteOne is the leading industry consolidator x Significant sourcing advantage with 80+ associates scouting new growth opportunities x Our pipeline is deep and expanding x M&A team in place to execute our acquisition strategy x Acquisitions are expected to be accretive and present significant profit growth potential Robust pipeline provides significant growth opportunity 12% (1) As of year end 2019. Management Estimates ~$20bn market (1) 88%

16 Position # 1 Avg yrs industry expertise % former contractors / golf super’int Regional VP 10 24 18% Area Manager 50 23 64% Area Business Manager 46 19 59% Branch Manager ~511 15 44% Outside Sales Rep ~360 17 52% Functional Excellence Local Leadership Team Senior Leadership Team ■ Functional areas are led by top industry talent from best - in - class companies including: Category Management Pricing Supply chain Marketing and e - Comm Operational Excellence Strategy Name Experience Doug Black Chairman & CEO John Guthrie EVP & CFO Scott Salmon EVP, Strategy & Development Greg Weller EVP , Operations Briley Brisendine General Counsel Joseph Ketter EVP, H uman Resources Matt Hart West Division President Taylor Koch East Division President Shannon Versaggi Chief Marketing Officer Sean Kramer Chief Information Officer (1) As of December 31, 2017 Source: Company data Proven management team driving performance and growth

17 Proven management team Compelling and sustainable growth strategy Uniquely attractive industry Clear market leader Value - creating acquisitions Operational and commercial excellence Investment highlights

Appendix
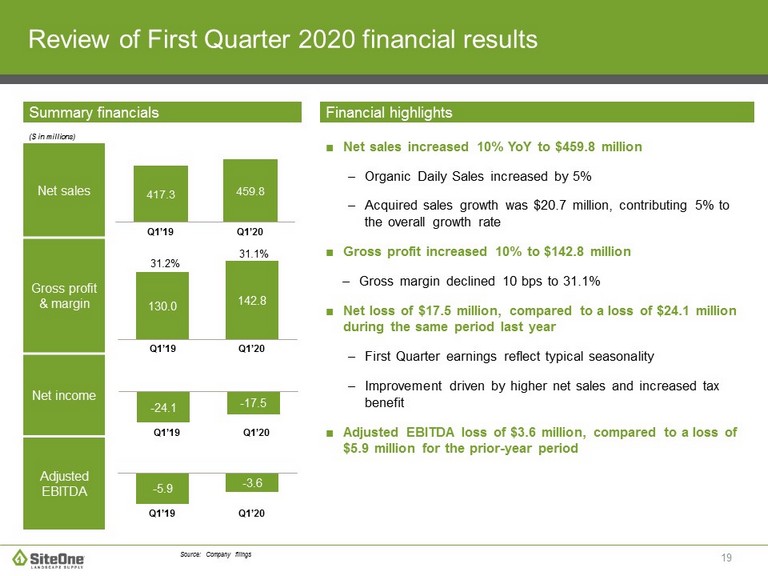
19 Net sales Gross profit & margin Net income Adjusted EBITDA Review of First Quarter 2020 financial results Source: Company filings Summary financials Financial highlights ($ in millions) 417.3 459.8 Q1’19 Q1’20 130.0 142.8 31.2% Q1’20 Q1’19 31.1% ■ Net sales increased 10% YoY to $459.8 million – Organic Daily Sales increased by 5% – Acquired sales growth was $20.7 million, contributing 5% to the overall growth rate ■ Gross profit increased 10% to $142.8 million – Gross margin declined 10 bps to 31.1% ■ Net loss of $17.5 million, compared to a loss of $24.1 million during the same period last year – First Quarter earnings reflect typical seasonality – Improvement driven by higher net sales and increased tax benefit ■ Adjusted EBITDA loss of $3.6 million, compared to a loss of $5.9 million for the prior - year period - 5.9 - 3.6 Q1’19 Q1’20 - 24.1 - 17.5 Q1’19 Q1’20

20 Balance sheet & cash flow highlights Net debt 1 $650.2 Cash used in operating activities $65.6 Capital expenditures $4.6 First Quarter 2020 Balance sheet & cash flow highlights ($ in millions) 1 Net debt is calculated as long - term debt plus finance leases, net of cash and cash equivalents 2 Leverage ratio defined as net debt (including finance leases) to trailing twelve months Adjusted EBITDA Source: Company filings ■ Working capital increased to $520.8 million, compared to $482.9 million in the prior - year period – Reflects working capital additions from 2019 - 2020 acquisitions – Working capital projected to decrease during the remainder of the year due to seasonality and optimization of our supply chain ■ Cash used in operating activities of $65.6 million, compared to $48.5 million in the prior - year period – Reflects increased investment in working capital prior to spring ■ Capital expenditures were $4.6 million, compared to $6.4 million in the prior - year period ■ Net debt / Adjusted EBITDA of 3.2x, reduced from 3.6x a year ago – Leverage decrease attributable to improved profitability – Year - end target net debt / Adjusted EBITDA leverage 2 of 2.0x – 3.0x
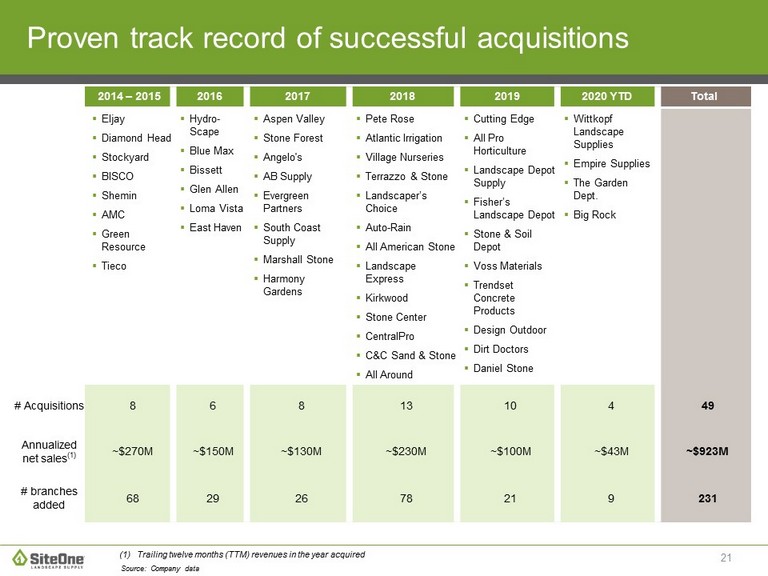
21 2014 – 2015 2016 2017 2018 2019 2020 YTD Total ▪ Eljay ▪ Diamond Head ▪ Stockyard ▪ BISCO ▪ Shemin ▪ AMC ▪ Green Resource ▪ Tieco ▪ Hydro - Scape ▪ Blue Max ▪ Bissett ▪ Glen Allen ▪ Loma Vista ▪ East Haven ▪ Aspen Valley ▪ Stone Forest ▪ Angelo's ▪ AB Supply ▪ Evergreen Partners ▪ South Coast Supply ▪ Marshall Stone ▪ Harmony Gardens ▪ Pete Rose ▪ Atlantic Irrigation ▪ Village Nurseries ▪ Terrazzo & Stone ▪ Landscaper’s Choice ▪ Auto - Rain ▪ All American Stone ▪ Landscape Express ▪ Kirkwood ▪ Stone Center ▪ CentralPro ▪ C&C Sand & Stone ▪ All Around ▪ Cutting Edge ▪ All Pro Horticulture ▪ Landscape Depot Supply ▪ Fisher’s Landscape Depot ▪ Stone & Soil Depot ▪ Voss Materials ▪ Trendset Concrete Products ▪ Design Outdoor ▪ Dirt Doctors ▪ Daniel Stone ▪ Wittkopf Landscape Supplies ▪ Empire Supplies ▪ The Garden Dept. ▪ Big Rock # Acquisitions 8 6 8 13 10 4 49 Annualized net sales (1) ~$270M ~$150M ~$130M ~$230M ~$100M ~$43M ~$923M # branches added 68 29 26 78 21 9 231 Proven track record of successful acquisitions Source: Company data (1) Trailing twelve months (TTM) revenues in the year acquired

22 ($ in millions) 2020 2019 2018 Q1’20 Q4’19 Q3’19 Q2’19 Q1’19 Q4’18 Q3 ‘18 Q2 ‘18 Net income (loss) $(17.5) $2.5 $34.6 $64.7 $(24.1) $(2.1) $29.9 $63.1 Income tax expense (benefit) (13.5) (5.6) 9.7 19.3 (9.6) (5.6) 2.4 14.7 Interest expense, net 7.7 7.5 8.2 8.7 9.0 8.3 9.2 8.0 Depreciation and amortization 16.3 14.8 14.6 14.7 15.4 14.0 14.1 12.5 EBITDA $(7.0) $19.2 $67.1 $107.4 $(9.3) $14.6 $55.6 $98.3 Stock - based compensation 2.5 2.0 2.5 5.4 1.8 1.8 1.9 2.1 (Gain) loss on sale of assets 0.1 0.1 0.1 -- 0.1 (0.1) (0.3) 0.1 Financing fees -- -- -- -- -- 0.1 0.7 -- Acquisitions & other 0.8 0.9 0.8 1.5 1.5 1.7 2.1 2.5 Adjusted EBITDA $(3.6) $22.2 $70.5 $114.3 $(5.9) $18.1 $60.0 $103.0 Non - GAAP reconciliations A B C D E Represents stock - based compensation expense recorded during the period. Represents any gain or loss associated with the sale of assets not in the ordinary course of business. Represents fees associated with our debt refinancing and debt amendments. Represents professional fees, retention and severance payments, and performance bonuses related to historical acquisitions. Although we have incurred professional fees, retention and severance payments, and performance bonuses related to acquisition s i n several historical periods and expect to incur such fees and payments for any future acquisitions, we cannot predict the timi ng or amount of any such fees or payments. Adjusted EBITDA excludes any earnings or loss of acquisitions prior to their respective acquisition dates for all periods pre sen ted. A B C D E Adjusted EBITDA Reconciliation
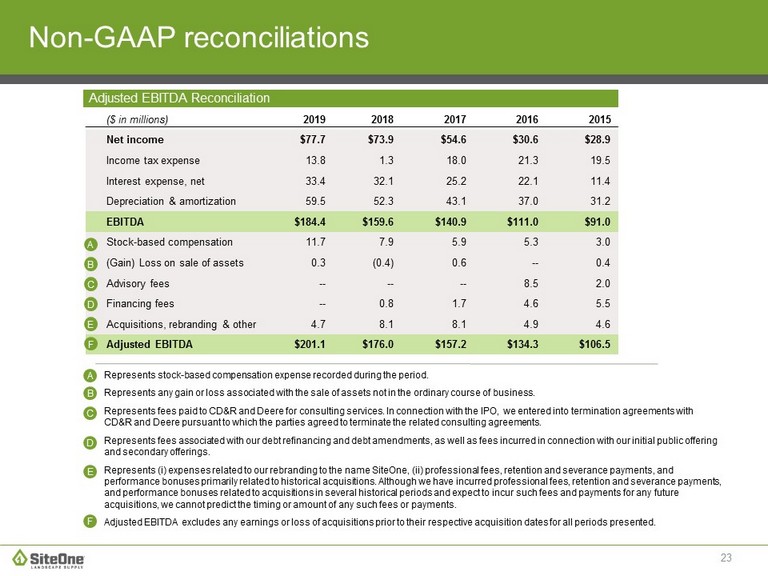
23 ($ in millions) 2019 2018 2017 2016 2015 Net income $77.7 $73.9 $54.6 $30.6 $28.9 Income tax expense 13.8 1.3 18.0 21.3 19.5 Interest expense, net 33.4 32.1 25.2 22.1 11.4 Depreciation & amortization 59.5 52.3 43.1 37.0 31.2 EBITDA $184.4 $159.6 $140.9 $111.0 $91.0 Stock - based compensation 11.7 7.9 5.9 5.3 3.0 (Gain) Loss on sale of assets 0.3 (0.4) 0.6 -- 0.4 Advisory fees -- -- -- 8.5 2.0 Financing fees -- 0.8 1.7 4.6 5.5 Acquisitions, rebranding & other 4.7 8.1 8.1 4.9 4.6 Adjusted EBITDA $201.1 $176.0 $157.2 $134.3 $106.5 Non - GAAP reconciliations Represents stock - based compensation expense recorded during the period. Represents any gain or loss associated with the sale of assets not in the ordinary course of business. Represents fees paid to CD&R and Deere for consulting services. In connection with the IPO, we entered into termination agree men ts with CD&R and Deere pursuant to which the parties agreed to terminate the related consulting agreements. Represents fees associated with our debt refinancing and debt amendments, as well as fees incurred in connection with our ini tia l public offering and secondary offerings. Represents ( i ) expenses related to our rebranding to the name SiteOne, (ii) professional fees, retention and severance payments, and performance bonuses primarily related to historical acquisitions. Although we have incurred professional fees, retention and sev erance payments, and performance bonuses related to acquisitions in several historical periods and expect to incur such fees and payments for any future acquisitions, we cannot predict the timing or amount of any such fees or payments. Adjusted EBITDA excludes any earnings or loss of acquisitions prior to their respective acquisition dates for all periods pre sen ted. A B C D A B C D E E F F Adjusted EBITDA Reconciliation

24 Non - GAAP reconciliations 2020 2019 ($ in millions) FY’20 Q4’20 Q3’20 Q2’20 Q1’20 FY’19 Q4’19 Q3’19 Q2’19 Q1’19 Reported Net Sales -- -- -- -- $459.8 $2,357.5 $535.0 $652.8 $752.4 $417.3 Organic Sales -- -- -- -- $434.8 $2,292.9 $513.6 $630.8 $735.5 $413.0 Acquisition contribution -- -- -- -- $25.0 $64.6 $21.4 $22.0 $16.9 $4.3 Selling Days 256 65 63 64 64 252 61 63 64 64 Organic Daily Sales -- -- -- -- $6.8 $9.1 $8.4 $10.0 $11.5 $6.5 B B 2020 Organic Daily Sales Reconciliation A Represents Net sales from acquired branches that have not been under our ownership for at least four full fiscal quarters at the start of the 2020 fiscal year. Includes Net sales from branches acquired in 2019 and 2020. A Organic Sales equals Net sales less Net sales from branches that were acquired in 2019 and 2020 .
