Attached files
| file | filename |
|---|---|
| EX-99.1 - EXHIBIT 99.1 - HEALTHPEAK PROPERTIES, INC. | tm2012075d4_ex99-1.htm |
| 8-K - FORM 8-K - HEALTHPEAK PROPERTIES, INC. | tm2012075-4_8k.htm |
Exhibit 99.2
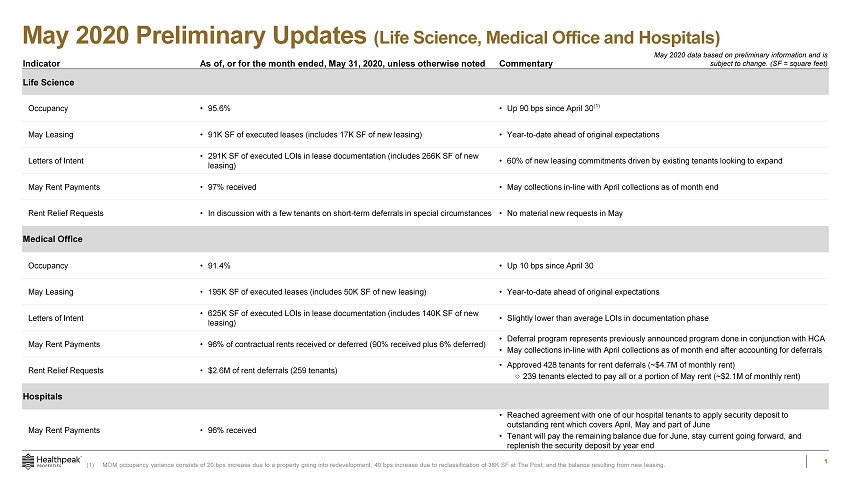
May 2020 Preliminary Updates (Life Science, Medical Office and Hospitals) 1 Indicator As of, or for the month ended, May 31, 2020, unless otherwise noted Commentary Life Science Occupancy • 95.6% • Up 90 bps since April 30 (1) May Leasing • 91K SF of executed leases (includes 17K SF of new leasing) • Year - to - date ahead of original expectations Letters of Intent • 291K SF of executed LOIs in lease documentation (includes 266K SF of new leasing) • 60% of new leasing commitments driven by existing tenants looking to expand May Rent Payments • 97% received • May collections in - line with April collections as of month end Rent Relief Requests • In discussion with a few tenants on short - term deferrals in special circumstances • No material new requests in May Medical Office Occupancy • 91.4% • Up 10 bps since April 30 May Leasing • 195K SF of executed leases (includes 50K SF of new leasing) • Year - to - date ahead of original expectations Letters of Intent • 625K SF of executed LOIs in lease documentation (includes 140K SF of new leasing) • Slightly lower than average LOIs in documentation phase May Rent Payments • 96% of contractual rents received or deferred (90% received plus 6% deferred) • Deferral program represents previously announced program done in conjunction with HCA • May collections in - line with April collections as of month end after accounting for deferrals Rent Relief Requests • $2.6M of rent deferrals (259 tenants) • Approved 428 tenants for rent deferrals (~$4.7M of monthly rent) o 239 tenants elected to pay all or a portion of May rent (~$2.1M of monthly rent) Hospitals May Rent Payments • 96% received • Reached agreement with one of our hospital tenants to apply security deposit to outstanding rent which covers April, May and part of June • Tenant will pay the remaining balance due for June, stay current going forward, and replenish the security deposit by year end May 2020 data based on preliminary information and is subject to change. (SF = square feet) (1) MOM occupancy variance consists of 20 bps increase due to a property going into redevelopment, 40 bps increase due to reclass ifi cation of 38K SF at The Post, and the balance resulting from new leasing.

May 2020 Preliminary Updates (Senior Housing) (1) Properties that are held for sale, in redevelopment or in development are excluded from reporting statistics. (2) Move - in and move - out data excludes skilled nursing beds given the Medicare residents usually have lengths of stay of 30 days or less. (3) Skilled nursing units in our CCRC and SHOP portfolios received $14.6M (SHOP $2.1M and CCRCs $12.5M) of Coronavirus Aid, Relie f, and Economic Security ("CARES") Act funding in April and May. This represents pro rata funding provided to all Medicare providers, and, in the most recent tranche, $50k per property plus $2,500 per bed. 2 Indicator As of, or for the month ended, May 31, 2020, unless otherwise noted Commentary Senior Housing: SHOP (1)(2)(3) Total Occupancy • Spot occupancy declined 190 bps May 31, 2020 vs April 30, 2020 Move - ins • Declined 65% vs. May 2019; Increased 53% vs. Apr 2020 • 78% of our properties are now accepting move - ins, versus 45% as of late April Move - outs • Declined 12% vs. May 2019; Declined 29% vs. Apr 2020 • Driven by lower voluntary move - outs in the May 2019 comparison period Leads • Declined 37% vs. May 2019; Increased 26% vs. Apr 2020 • Operators are prioritizing digital marketing platforms Tours • Declined 46% vs. May 2019; Increased 19% vs. Apr 2020 • Tours in May 2020 were entirely virtual / digital Senior Housing: CCRC (1)(2)(3) IL/AL/MC Occupancy SNF Occupancy Total Occupancy • Spot occupancy declined 110 bps in IL/AL/MC May 31, 2020 vs April 30, 2020 • Spot occupancy increased 110 bps in skilled nursing May 31, 2020 vs April 30, 2020 • Total spot occupancy declined 70 bps May 31, 2020 vs April 30, 2020 IL/AL/MC Move - ins • Declined 86% vs. May 2019; Increased 30% vs. Apr 2020 • 67% of our IL/AL/MC properties in are now accepting move - ins, versus 60% as of late April IL/AL/MC Move - outs • Declined 25% vs. May 2019; Increased 4% vs. Apr 2020 • Driven by lower voluntary move - outs in the May 2019 comparison period IL/AL/MC Leads • Declined 45% vs. May 2019; Increased 21% vs. Apr 2020 • Operators are prioritizing digital marketing platforms IL/AL/MC Tours • Declined 49% vs. May 2019; Declined 7% vs. Apr 2020 • Tours in May 2020 were entirely virtual / digital Senior Housing (SHOP and CCRC) Expense Update April Expense Results (May expense results not yet available) Total expenses increased 5% • Labor increased 6% • Supplies increased 135% • April results came in at the low end of PEAK’s 5 - 15% expense outlook • We expect Supply increases to be within the range set forth in our earnings framework (30 - 90%) over a multi - month period due to stockpiling and high COVID - 19 activity in April • Total COVID - 19 expenses in April were $7.9M (SHOP $5.5M and CCRCs $2.4M); $240k related to testing which we anticipate to increase over the coming months Senior Housing: NNN Tenant Updates May Rent Payments • 97% received + 3% deferred Capital Senior Living • Agreed to defer 25% of rent (~$1.7M) from April 2020 to maturity in October 2020. The deferred rent must be repaid within 3 y ear s of lease expiration (10/31/20) and, if not repaid within one year of lease expiration, will bear interest at L+300. Harbor Retirement Associates (HRA) • Withdrew rent relief request Senior Housing: Known COVID - 19 Positive Cases Based on the reports Healthpeak receives from its operators across 222 properties, as of May 31, 2020, Healthpeak had 72 properties managed by 14 different operators with confirmed resident COVID - 19 cases, and 42 of those affected properties had experienced resident deaths. • New COVID - 19 resident positive cases have declined from a peak of 162 per week in mid - late April to 40 per week in late May • 41 of our 72 COVID - 19 resident positive properties are 14 or more days from the most recent exposure May 2020 data based on preliminary information and is subject to change. Spot Occupancy (May 31) Average Daily Census (May) 79.5% 79.8% Spot Occupancy (May 31) Average Daily Census (May) 83.8% 84.1% 59.0% 79.6% 56.9% 79.6%