Attached files
| file | filename |
|---|---|
| 8-K - 8-K - CNB FINANCIAL CORP/PA | d935948d8k.htm |

Exhibit 99.1 Annual Shareholder Meeting April 21, 2020 CNB Financial Corporation Investor Presentation June 11, 2020 1Exhibit 99.1 Annual Shareholder Meeting April 21, 2020 CNB Financial Corporation Investor Presentation June 11, 2020 1

Forward Looking Statements This presentation includes forward-looking statements within the meaning of Section 27A of the Securities Act of 1933, as amended, and Section 21E of the Securities Exchange Act of 1934, as amended, with respect to CNB’s financial condition, liquidity, results of operations, future performance and business. These forward-looking statements are intended to be covered by the safe harbor for “forward-looking statements” provided by the Private Securities Litigation Reform Act of 1995. Forward-looking statements are those that are not historical facts. Forward-looking statements include statements with respect to beliefs, plans, objectives, goals, expectations, anticipations, estimates and intentions that are subject to significant risks and uncertainties and are subject to change based on various factors (some of which are beyond CNB’s control). Forward-looking statements often include the words “believes,” “expects,” “anticipates,” “estimates,” “forecasts,” “intends,” “plans,” “targets,” “potentially,” “probably,” “projects,” “outlook” or similar expressions or future conditional verbs such as “may,” “will,” “should,” “would” and “could.” CNB’s actual results may differ materially from those contemplated by the forward-looking statements, which are neither statements of historical fact nor guarantees or assurances of future performance. Such known and unknown risks, uncertainties and other factors that could cause the actual results to differ materially from the statements, include, but are not limited to, (i) the duration and scope of the COVID-19 pandemic and the local, national and global impact of COVID-19, (ii) actions governments, businesses and individuals take in response to the pandemic, (iii) the pace of recovery when the COVID-19 pandemic subsides, (iv) changes in general business, industry or economic conditions or competition; (v) changes in any applicable law, rule, regulation, policy, guideline or practice governing or affecting financial holding companies and their subsidiaries or with respect to tax or accounting principles or otherwise; (vi) adverse changes or conditions in capital and financial markets; (vii) changes in interest rates; (viii) higher than expected costs or other difficulties related to integration of combined or merged businesses; (ix) the effects of business combinations and other acquisition transactions, including the inability to realize our loan and investment portfolios; (x) changes in the quality or composition of our loan and investment portfolios; (xi) adequacy of loan loss reserves; (xii) increased competition; (xiii) loss of certain key officers; (xiv) deposit attrition; (xv) rapidly changing technology; (xvi) unanticipated regulatory or judicial proceedings and liabilities and other costs; (xvii) changes in the cost of funds, demand for loan products or demand for financial services; and (xviii) other economic, competitive, governmental or technological factors affecting our operations, markets, products, services and prices. Such developments could have an adverse impact on CNB's financial position and results of operations. For more information about factors that could cause actual results to differ from those discussed in the forward-looking statements, please refer to the “Risk Factors” and “Management’s Discussion and Analysis of Financial Condition and Results of Operations” sections of and the forward-looking statement disclaimers in CNB’s annual and quarterly reports. The forward-looking statements are based upon management’s beliefs and assumptions and are made as of the date of this presentation. CNB undertakes no obligation to publicly update or revise any forward-looking statements included in this presentation to update the reasons why actual results could differ from those contained in such statements, whether as a result of new information, future events or otherwise, except to the extent required by law. In light of these risks, uncertainties and assumptions, the forward-looking events discussed in this presentation might not occur and you should not put undue reliance on any forward-looking statements. 2Forward Looking Statements This presentation includes forward-looking statements within the meaning of Section 27A of the Securities Act of 1933, as amended, and Section 21E of the Securities Exchange Act of 1934, as amended, with respect to CNB’s financial condition, liquidity, results of operations, future performance and business. These forward-looking statements are intended to be covered by the safe harbor for “forward-looking statements” provided by the Private Securities Litigation Reform Act of 1995. Forward-looking statements are those that are not historical facts. Forward-looking statements include statements with respect to beliefs, plans, objectives, goals, expectations, anticipations, estimates and intentions that are subject to significant risks and uncertainties and are subject to change based on various factors (some of which are beyond CNB’s control). Forward-looking statements often include the words “believes,” “expects,” “anticipates,” “estimates,” “forecasts,” “intends,” “plans,” “targets,” “potentially,” “probably,” “projects,” “outlook” or similar expressions or future conditional verbs such as “may,” “will,” “should,” “would” and “could.” CNB’s actual results may differ materially from those contemplated by the forward-looking statements, which are neither statements of historical fact nor guarantees or assurances of future performance. Such known and unknown risks, uncertainties and other factors that could cause the actual results to differ materially from the statements, include, but are not limited to, (i) the duration and scope of the COVID-19 pandemic and the local, national and global impact of COVID-19, (ii) actions governments, businesses and individuals take in response to the pandemic, (iii) the pace of recovery when the COVID-19 pandemic subsides, (iv) changes in general business, industry or economic conditions or competition; (v) changes in any applicable law, rule, regulation, policy, guideline or practice governing or affecting financial holding companies and their subsidiaries or with respect to tax or accounting principles or otherwise; (vi) adverse changes or conditions in capital and financial markets; (vii) changes in interest rates; (viii) higher than expected costs or other difficulties related to integration of combined or merged businesses; (ix) the effects of business combinations and other acquisition transactions, including the inability to realize our loan and investment portfolios; (x) changes in the quality or composition of our loan and investment portfolios; (xi) adequacy of loan loss reserves; (xii) increased competition; (xiii) loss of certain key officers; (xiv) deposit attrition; (xv) rapidly changing technology; (xvi) unanticipated regulatory or judicial proceedings and liabilities and other costs; (xvii) changes in the cost of funds, demand for loan products or demand for financial services; and (xviii) other economic, competitive, governmental or technological factors affecting our operations, markets, products, services and prices. Such developments could have an adverse impact on CNB's financial position and results of operations. For more information about factors that could cause actual results to differ from those discussed in the forward-looking statements, please refer to the “Risk Factors” and “Management’s Discussion and Analysis of Financial Condition and Results of Operations” sections of and the forward-looking statement disclaimers in CNB’s annual and quarterly reports. The forward-looking statements are based upon management’s beliefs and assumptions and are made as of the date of this presentation. CNB undertakes no obligation to publicly update or revise any forward-looking statements included in this presentation to update the reasons why actual results could differ from those contained in such statements, whether as a result of new information, future events or otherwise, except to the extent required by law. In light of these risks, uncertainties and assumptions, the forward-looking events discussed in this presentation might not occur and you should not put undue reliance on any forward-looking statements. 2

Overview § Four local community banking brands serving diverse markets in three states § Strong and successful track record of organic growth – Loan and deposit growth of 12.8% and 16.7%, respectively, for Q1 2020 versus Q1 2019, all organic – Three year, ending Q1 2020, loan and deposit CAGR of 14.3% and 15.2%, respectively, all organic § Acquisitions on a selective basis to enter new growth markets or supplement existing growth markets § High performing business model with ROA and ROE averaging 1.06%, and 12.49%, respectively, over the last three years § In a strong position to address the risks of the COVID-related crisis – Low percentage of the loan portfolio in the industries most sensitive to the shutdown – Manageable loan modification requests spread broadly over diverse group of industries – Ample liquidity to insure continued active support of our communities – Meaningful participation in the Paycheck Protection Program (PPP) helps support our customers and build brand momentum following the crisis 3Overview § Four local community banking brands serving diverse markets in three states § Strong and successful track record of organic growth – Loan and deposit growth of 12.8% and 16.7%, respectively, for Q1 2020 versus Q1 2019, all organic – Three year, ending Q1 2020, loan and deposit CAGR of 14.3% and 15.2%, respectively, all organic § Acquisitions on a selective basis to enter new growth markets or supplement existing growth markets § High performing business model with ROA and ROE averaging 1.06%, and 12.49%, respectively, over the last three years § In a strong position to address the risks of the COVID-related crisis – Low percentage of the loan portfolio in the industries most sensitive to the shutdown – Manageable loan modification requests spread broadly over diverse group of industries – Ample liquidity to insure continued active support of our communities – Meaningful participation in the Paycheck Protection Program (PPP) helps support our customers and build brand momentum following the crisis 3

COVID-19 Response 4COVID-19 Response 4

Customer Experience § Established COVID-19 Preparedness Committee comprised of Senior Management, focused on safety of our customers and employees § Re-established loan pricing floors at adjustable levels as part of standard pricing decisions § Implemented proactive communication protocols via CNB website, emails, social media and newspaper/radio ads § Implemented temporary branch closures, while maintaining limited lobby hours (by appointment only) and regular drive-through hours: – Currently: • All but 3 branches have fully reopened • 3 branches consolidated into existing branches based on changing customer patterns § Significantly participated in the SBA – Paycheck Protection Program (PPP) to support small businesses in our communities proactively § Granted needs-based loan payment deferrals due to COVID-19 impact, with no negative credit reporting – Proactively reached out to the Hospitality industry to establish principal and interest payment deferrals for six months. 5Customer Experience § Established COVID-19 Preparedness Committee comprised of Senior Management, focused on safety of our customers and employees § Re-established loan pricing floors at adjustable levels as part of standard pricing decisions § Implemented proactive communication protocols via CNB website, emails, social media and newspaper/radio ads § Implemented temporary branch closures, while maintaining limited lobby hours (by appointment only) and regular drive-through hours: – Currently: • All but 3 branches have fully reopened • 3 branches consolidated into existing branches based on changing customer patterns § Significantly participated in the SBA – Paycheck Protection Program (PPP) to support small businesses in our communities proactively § Granted needs-based loan payment deferrals due to COVID-19 impact, with no negative credit reporting – Proactively reached out to the Hospitality industry to establish principal and interest payment deferrals for six months. 5

Employee Experience § Employed a split team approach § Leveraged IT network capabilities to support work from home § All Commercial and Private Banking Sales Teams worked remotely § Diversified Customer Service Center agents into 3 locations, in 3 states – As call volumes nearly doubled, supplemented call center staffing with existing staff from temporarily closed branches § Implemented a more robust employee communication process (multiple communications per week) § Initiated a temporary hiring freeze § Maintained employee wages at pre-pandemic rates (even with reduced hours) § All benefits, including 401K company match, maintained 6Employee Experience § Employed a split team approach § Leveraged IT network capabilities to support work from home § All Commercial and Private Banking Sales Teams worked remotely § Diversified Customer Service Center agents into 3 locations, in 3 states – As call volumes nearly doubled, supplemented call center staffing with existing staff from temporarily closed branches § Implemented a more robust employee communication process (multiple communications per week) § Initiated a temporary hiring freeze § Maintained employee wages at pre-pandemic rates (even with reduced hours) § All benefits, including 401K company match, maintained 6

Customer Initiatives 7Customer Initiatives 7

SBA Paycheck Protection Program (PPP) by Region As of April 30, 2020 $ in Thousands CNB Bank ERIEBANK FCBank BankOnBuffalo Total SBA approved loans $ 58,808 $ 77,829 $ 36,509 $ 42,341 $ 215,487 # of SBA approved loans 462 677 172 258 1,569 Average size per loan $ 127 $ 115 $ 212 $ 164 $ 137 Processing fees $ 2,189 $ 3,247 $ 1,253 $ 1,564 $ 8,253 Processing fees (%) 3.72% 4.17% 3.43% 3.69% 3.83% Over 30,000 employees estimated to benefit at companies receiving funds through PPP. 8SBA Paycheck Protection Program (PPP) by Region As of April 30, 2020 $ in Thousands CNB Bank ERIEBANK FCBank BankOnBuffalo Total SBA approved loans $ 58,808 $ 77,829 $ 36,509 $ 42,341 $ 215,487 # of SBA approved loans 462 677 172 258 1,569 Average size per loan $ 127 $ 115 $ 212 $ 164 $ 137 Processing fees $ 2,189 $ 3,247 $ 1,253 $ 1,564 $ 8,253 Processing fees (%) 3.72% 4.17% 3.43% 3.69% 3.83% Over 30,000 employees estimated to benefit at companies receiving funds through PPP. 8

SBA Paycheck Protection Program (PPP) by Industry As of April 30, 2020 Total Average # of Loan Loan Loans $ in Thousands Manufacturing $ 46,735 $ 225 208 Healthcare 34,155 208 164 Construction 27,908 166 168 Professional and Business Services 22,522 129 175 Retail 13,145 95 139 Other Services 10,560 78 135 Restaurants 10,218 76 135 Waste Management 9,444 133 71 Transportation 7,342 153 48 Wholesale 7,329 156 47 Finance and Insurance 5,121 79 65 Mining, Quarrying, and Oil and Gas Extraction 4,606 128 36 Information 4,114 257 16 Arts and Entertainment 3,172 86 37 Commercial Real Estate 3,052 60 51 Agricultural 1,670 76 22 Other 4,394 85 52 Total $ 215,487 $ 137 1,569 Total Expected # of Loan Origination Pool Funded Fees Loans < $350,000 $ 106,165 $ 5,308 1,419 $350,000 - $2,000,000 92,575 2,777 144 > $2,000,000 16,747 168 6 Total $ 215,487 $ 8,253 1,569 9SBA Paycheck Protection Program (PPP) by Industry As of April 30, 2020 Total Average # of Loan Loan Loans $ in Thousands Manufacturing $ 46,735 $ 225 208 Healthcare 34,155 208 164 Construction 27,908 166 168 Professional and Business Services 22,522 129 175 Retail 13,145 95 139 Other Services 10,560 78 135 Restaurants 10,218 76 135 Waste Management 9,444 133 71 Transportation 7,342 153 48 Wholesale 7,329 156 47 Finance and Insurance 5,121 79 65 Mining, Quarrying, and Oil and Gas Extraction 4,606 128 36 Information 4,114 257 16 Arts and Entertainment 3,172 86 37 Commercial Real Estate 3,052 60 51 Agricultural 1,670 76 22 Other 4,394 85 52 Total $ 215,487 $ 137 1,569 Total Expected # of Loan Origination Pool Funded Fees Loans < $350,000 $ 106,165 $ 5,308 1,419 $350,000 - $2,000,000 92,575 2,777 144 > $2,000,000 16,747 168 6 Total $ 215,487 $ 8,253 1,569 9

Loan Modifications As of April 30, 2020 By Region $ in Thousands CNB Bank ERIEBANK FCBank BankOnBuffalo Total Deferred loans $ 129,890 $ 145,558 $ 44,614 $ 102,302 $ 422,364 # of deferred loans 513 558 80 67 1,218 By Loan Category Commercial, Industrial and Commercial Residential Agricultural Mortgages Real Estate Consumer Total Deferred loans $ 174,083 $ 179,380 $ 66,893 $ 2,008 $ 422,364 # of deferred loans 427 124 496 171 1,218 § Focused on “needs-based” customers with a demonstrated impact from the COVID- 19 pandemic § Total modified loans comprised 15% of total loan portfolio outstanding as of April 30, 2020 § Modifications are comprised of 50% Principal and Interest and 50% Interest Only payments § Modifications are comprised of 59% for 5-6 months and 41% for 1-4 months 10Loan Modifications As of April 30, 2020 By Region $ in Thousands CNB Bank ERIEBANK FCBank BankOnBuffalo Total Deferred loans $ 129,890 $ 145,558 $ 44,614 $ 102,302 $ 422,364 # of deferred loans 513 558 80 67 1,218 By Loan Category Commercial, Industrial and Commercial Residential Agricultural Mortgages Real Estate Consumer Total Deferred loans $ 174,083 $ 179,380 $ 66,893 $ 2,008 $ 422,364 # of deferred loans 427 124 496 171 1,218 § Focused on “needs-based” customers with a demonstrated impact from the COVID- 19 pandemic § Total modified loans comprised 15% of total loan portfolio outstanding as of April 30, 2020 § Modifications are comprised of 50% Principal and Interest and 50% Interest Only payments § Modifications are comprised of 59% for 5-6 months and 41% for 1-4 months 10

Loan Modifications by Industry As of April 30, 2020 Loans with Deferred Payments Portfolio # of Interest % of $ in Thousands Q1 2020 Loans Only P&I Total Portfolio Commercial Real Estate (Office/Apt/Mixed, etc) $ 667,162 131 $ 57,610 $ 42,918 $ 100,528 15% Hotels / Motels 179,176 37 140 85,196 85,336 48% Residential and Consumer 909,082 632 52,736 12,945 65,681 7% Manufacturing 139,147 75 36,826 2,956 39,782 29% Arts and Entertainment 28,775 18 34 22,122 22,156 77% Utilities 19,525 2 19,525 0 19,525 100% Retail 93,271 46 14,527 2,495 17,022 18% Professional, Scientific, and Technical Services 43,400 18 10,442 3,420 13,862 32% Restaurants 26,307 46 1,193 11,487 12,680 48% Healthcare 152,048 41 4,710 4,072 8,782 6% Other Services 57,127 53 3,737 4,867 8,604 15% Finance and Insurance 50,686 3 251 6,339 6,590 13% Agricultural 60,074 15 5,926 323 6,249 10% Construction 69,905 23 628 5,131 5,759 8% Wholesale 47,980 18 921 2,003 2,924 6% Transportation 21,126 24 2,509 311 2,820 13% Mining, Quarrying, and Oil and Gas Extraction 24,009 15 173 1,639 1,812 8% Waste Management 25,738 14 135 1,336 1,471 6% Education 8,748 2 0 283 283 3% Other 231,920 5 408 90 498 0% Total $ 2,855,206 1,218 $ 212,431 $ 209,933 $ 422,364 15% 11Loan Modifications by Industry As of April 30, 2020 Loans with Deferred Payments Portfolio # of Interest % of $ in Thousands Q1 2020 Loans Only P&I Total Portfolio Commercial Real Estate (Office/Apt/Mixed, etc) $ 667,162 131 $ 57,610 $ 42,918 $ 100,528 15% Hotels / Motels 179,176 37 140 85,196 85,336 48% Residential and Consumer 909,082 632 52,736 12,945 65,681 7% Manufacturing 139,147 75 36,826 2,956 39,782 29% Arts and Entertainment 28,775 18 34 22,122 22,156 77% Utilities 19,525 2 19,525 0 19,525 100% Retail 93,271 46 14,527 2,495 17,022 18% Professional, Scientific, and Technical Services 43,400 18 10,442 3,420 13,862 32% Restaurants 26,307 46 1,193 11,487 12,680 48% Healthcare 152,048 41 4,710 4,072 8,782 6% Other Services 57,127 53 3,737 4,867 8,604 15% Finance and Insurance 50,686 3 251 6,339 6,590 13% Agricultural 60,074 15 5,926 323 6,249 10% Construction 69,905 23 628 5,131 5,759 8% Wholesale 47,980 18 921 2,003 2,924 6% Transportation 21,126 24 2,509 311 2,820 13% Mining, Quarrying, and Oil and Gas Extraction 24,009 15 173 1,639 1,812 8% Waste Management 25,738 14 135 1,336 1,471 6% Education 8,748 2 0 283 283 3% Other 231,920 5 408 90 498 0% Total $ 2,855,206 1,218 $ 212,431 $ 209,933 $ 422,364 15% 11

Loan Portfolio Profile 12Loan Portfolio Profile 12

Loan Portfolio Diversification Commercial, Industrial and Agricultural Loan Composition at 3/31/2020 Manufacturing: Consumer, 13% Credit cards and Healthcare: Overdrafts: 11% 4% Public Other: Administration: 60% 10% Retail: Commercial, Residential 6% industrial real estate: and 28% agricultural: Commercial Mortgages 38% Apartments: 25% Other: 34% Commercial mortgages: 30% Hospitality: 20% Office: 8% Mixed Use: 13% 13Loan Portfolio Diversification Commercial, Industrial and Agricultural Loan Composition at 3/31/2020 Manufacturing: Consumer, 13% Credit cards and Healthcare: Overdrafts: 11% 4% Public Other: Administration: 60% 10% Retail: Commercial, Residential 6% industrial real estate: and 28% agricultural: Commercial Mortgages 38% Apartments: 25% Other: 34% Commercial mortgages: 30% Hospitality: 20% Office: 8% Mixed Use: 13% 13

Most Economically Sensitive Industries Total Gross Loans as of 3/31/2020 Hospitality: Energy: § The Corporation is not significantly 6% 1% Restaurants: 1% dependent on these economically Healthcare: sensitive industries 5% § For these industries, the Corporation prioritizes – Projects, properties or operators that are in- market. – Experienced and proven owner-operators § Debt Service Coverage of 1.25 or better and LTV of 80% or better Other: 87% As of March 31, 2020 Outstanding Average $ in Thousands Balance Loan Size Past Due % Non-Performing Most economically sensitive industries* $ 37 9,645 $ 595 2.9% ** $ 12,599 ** All other loans 2,475,561 91 1.0% 19,278 Total gross loans $ 2,855,206 $ 102 1.3% $ 31,877 * The selected industries include Hospitality, Energy, Restaurants and Healthcare. ** Includes one commercial real estate loan relationship totaling approximately $9.7 million with adequate collateral support. 14Most Economically Sensitive Industries Total Gross Loans as of 3/31/2020 Hospitality: Energy: § The Corporation is not significantly 6% 1% Restaurants: 1% dependent on these economically Healthcare: sensitive industries 5% § For these industries, the Corporation prioritizes – Projects, properties or operators that are in- market. – Experienced and proven owner-operators § Debt Service Coverage of 1.25 or better and LTV of 80% or better Other: 87% As of March 31, 2020 Outstanding Average $ in Thousands Balance Loan Size Past Due % Non-Performing Most economically sensitive industries* $ 37 9,645 $ 595 2.9% ** $ 12,599 ** All other loans 2,475,561 91 1.0% 19,278 Total gross loans $ 2,855,206 $ 102 1.3% $ 31,877 * The selected industries include Hospitality, Energy, Restaurants and Healthcare. ** Includes one commercial real estate loan relationship totaling approximately $9.7 million with adequate collateral support. 14

Hospitality Independent: 1% Hospitality overview: § Franchise hotels comprise 99% of total hotel portfolio § Resort or destination related hospitality sites comprise approximately 1% of total hotel portfolio § Prioritize tier 1 preferred franchises: $180M Hilton and Marriott; secondarily tier 2 franchises: Holiday Inn and Choice § Prioritize limited service hotels with 60- 150 rooms As of March 31, 2020 Total Outstanding Average Non- $ in Thousands # of Loans Commitment Balance Loan Size Past Due Performing Independent 9 $ 1,448 $ 1,448 $ 161 0.0% $ 0 Franchised 56 207,039 177,728 3,174 0.0% 0 Total 65 $ 208,487 $ 179,176 $ 2,757 0.0% $ 0 15Hospitality Independent: 1% Hospitality overview: § Franchise hotels comprise 99% of total hotel portfolio § Resort or destination related hospitality sites comprise approximately 1% of total hotel portfolio § Prioritize tier 1 preferred franchises: $180M Hilton and Marriott; secondarily tier 2 franchises: Holiday Inn and Choice § Prioritize limited service hotels with 60- 150 rooms As of March 31, 2020 Total Outstanding Average Non- $ in Thousands # of Loans Commitment Balance Loan Size Past Due Performing Independent 9 $ 1,448 $ 1,448 $ 161 0.0% $ 0 Franchised 56 207,039 177,728 3,174 0.0% 0 Total 65 $ 208,487 $ 179,176 $ 2,757 0.0% $ 0 15
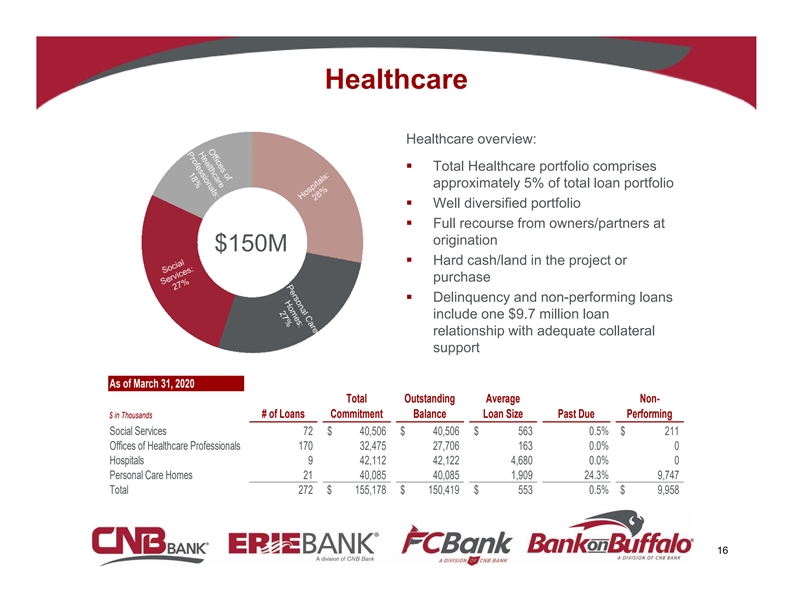
Healthcare Healthcare overview: § Total Healthcare portfolio comprises approximately 5% of total loan portfolio § Well diversified portfolio § Full recourse from owners/partners at origination $150M § Hard cash/land in the project or purchase § Delinquency and non-performing loans include one $9.7 million loan relationship with adequate collateral support As of March 31, 2020 Total Outstanding Average Non- $ in Thousands # of Loans Commitment Balance Loan Size Past Due Performing Social Services 72 $ 40,506 $ 40,506 $ 563 0.5% $ 211 Offices of Healthcare Professionals 170 32,475 27,706 163 0.0% 0 Hospitals 9 42,112 42,122 4,680 0.0% 0 Personal Care Homes 21 40,085 40,085 1,909 24.3% 9,747 Total 272 $ 155,178 $ 150,419 $ 553 0.5% $ 9,958 16Healthcare Healthcare overview: § Total Healthcare portfolio comprises approximately 5% of total loan portfolio § Well diversified portfolio § Full recourse from owners/partners at origination $150M § Hard cash/land in the project or purchase § Delinquency and non-performing loans include one $9.7 million loan relationship with adequate collateral support As of March 31, 2020 Total Outstanding Average Non- $ in Thousands # of Loans Commitment Balance Loan Size Past Due Performing Social Services 72 $ 40,506 $ 40,506 $ 563 0.5% $ 211 Offices of Healthcare Professionals 170 32,475 27,706 163 0.0% 0 Hospitals 9 42,112 42,122 4,680 0.0% 0 Personal Care Homes 21 40,085 40,085 1,909 24.3% 9,747 Total 272 $ 155,178 $ 150,419 $ 553 0.5% $ 9,958 16

Financial Performance 17Financial Performance 17

Financial Highlights First Quarter Fourth Quarter First Quarter $ in Thousands except per share 2020 2019 2019 Net Income $ 8,813 $ 10,484 $ 9,473 Income before provision and taxes 13,616 13,594 12,736 Diluted earnings per share 0.57 0.69 0.62 Dividends declared per share 0.17 0.17 0.17 Book value per share 21.10 20.00 18.04 Tangible book value per share 18.58 17.45 15.46 Return on average assets 0.95% 1.15% 1.18% Return on average equity 11.32% 13.79% 14.37% Efficiency ratio 60.34% 61.52% 60.85% Net interest margin, tax equivalent 3.49% 3.54% 3.76% Loans outstanding (net of unearned income) 2,850,660 2,764,173 2,526,090 Deposits 3,100,216 3,102,327 2,657,359 18Financial Highlights First Quarter Fourth Quarter First Quarter $ in Thousands except per share 2020 2019 2019 Net Income $ 8,813 $ 10,484 $ 9,473 Income before provision and taxes 13,616 13,594 12,736 Diluted earnings per share 0.57 0.69 0.62 Dividends declared per share 0.17 0.17 0.17 Book value per share 21.10 20.00 18.04 Tangible book value per share 18.58 17.45 15.46 Return on average assets 0.95% 1.15% 1.18% Return on average equity 11.32% 13.79% 14.37% Efficiency ratio 60.34% 61.52% 60.85% Net interest margin, tax equivalent 3.49% 3.54% 3.76% Loans outstanding (net of unearned income) 2,850,660 2,764,173 2,526,090 Deposits 3,100,216 3,102,327 2,657,359 18

Operating Efficiency Initiatives The Corporation implemented certain revenue and operational efficiency improvement initiatives during the first quarter of 2020, including: § Re‐established loan pricing floors ranging from 4% to 5%, based on loan risk rating § Implemented temporary hiring freeze; once hiring freeze ends, staff additions will be prioritized based on business‐generating functions § Eliminated positions based on efficiencies developed during work‐at‐home period § General operating expenditures prioritized to support business generation and loan portfolio management § Consolidated 3 branches into existing branch facilities § Expect $1.0 million, after‐tax, one‐time cost in 2020 and approximately $1.5 million, after‐tax, annual earnings increase in 2021 and beyond. 19Operating Efficiency Initiatives The Corporation implemented certain revenue and operational efficiency improvement initiatives during the first quarter of 2020, including: § Re‐established loan pricing floors ranging from 4% to 5%, based on loan risk rating § Implemented temporary hiring freeze; once hiring freeze ends, staff additions will be prioritized based on business‐generating functions § Eliminated positions based on efficiencies developed during work‐at‐home period § General operating expenditures prioritized to support business generation and loan portfolio management § Consolidated 3 branches into existing branch facilities § Expect $1.0 million, after‐tax, one‐time cost in 2020 and approximately $1.5 million, after‐tax, annual earnings increase in 2021 and beyond. 19

Historical Credit Quality § Credit metrics reflect conservative lending culture § Net charge-offs at 10-year low Historical Credit Quality 1.60 0.6 1.40 0.5 1.20 0.4 1.00 0.80 0.3 0.60 0.2 0.40 0.1 0.20 0.00 0 2011Y 2012Y 2013Y 2014Y 2015Y 2016Y 2017Y 2018Y 2019Y Q1 2020 NPA/TA Net Charge Offs - Consolidated Net Charge Offs - CNB Bank 20 NPA/TA (%) Net Charge-Offs / Loans Receivable (%)Historical Credit Quality § Credit metrics reflect conservative lending culture § Net charge-offs at 10-year low Historical Credit Quality 1.60 0.6 1.40 0.5 1.20 0.4 1.00 0.80 0.3 0.60 0.2 0.40 0.1 0.20 0.00 0 2011Y 2012Y 2013Y 2014Y 2015Y 2016Y 2017Y 2018Y 2019Y Q1 2020 NPA/TA Net Charge Offs - Consolidated Net Charge Offs - CNB Bank 20 NPA/TA (%) Net Charge-Offs / Loans Receivable (%)

Capital Ratios CET1 Ratio TCE/TA 8.00 12.00 7.00 10.00 6.00 8.00 5.00 4.00 6.00 3.00 4.00 2.00 2.00 1.00 0.00 0.00 2014Y 2015Y 2016Y 2017Y 2018Y 2019Y Q1 2020 * 2014Y 2015Y 2016Y 2017Y 2018Y 2019Y Q1 2020 Leverage Ratio Total Risk-Based Ratio 9.00 16.00 8.00 14.00 7.00 12.00 6.00 10.00 5.00 8.00 4.00 6.00 3.00 4.00 2.00 2.00 1.00 0.00 0.00 * 2014Y 2015Y 2016Y 2017Y 2018Y 2019Y Q1 2020 * 2014Y 2015Y 2016Y 2017Y 2018Y 2019Y Q1 2020 * - Minimum ratio required to be well-capitalized including capital conservation buffer Source: Company data as of March 31, 2020. 21Capital Ratios CET1 Ratio TCE/TA 8.00 12.00 7.00 10.00 6.00 8.00 5.00 4.00 6.00 3.00 4.00 2.00 2.00 1.00 0.00 0.00 2014Y 2015Y 2016Y 2017Y 2018Y 2019Y Q1 2020 * 2014Y 2015Y 2016Y 2017Y 2018Y 2019Y Q1 2020 Leverage Ratio Total Risk-Based Ratio 9.00 16.00 8.00 14.00 7.00 12.00 6.00 10.00 5.00 8.00 4.00 6.00 3.00 4.00 2.00 2.00 1.00 0.00 0.00 * 2014Y 2015Y 2016Y 2017Y 2018Y 2019Y Q1 2020 * 2014Y 2015Y 2016Y 2017Y 2018Y 2019Y Q1 2020 * - Minimum ratio required to be well-capitalized including capital conservation buffer Source: Company data as of March 31, 2020. 21

Capital Management As of March 31, 2020 - Consolidated Well Consolidated Ratio Capitalized* Capital Excess $ in Thousands Total capital ratio 12.66% 10.50% $ 363,124 $ 61,918 Tier 1 capital ratio 10.15% 8.50% 291,209 47,376 Common equity tier 1 ratio 9.45% 7.00% 271,209 70,405 Leverage ratio 7.85% 5.00% 291,209 105,694 * Well Capitalized includes the fully phased-in capital conservation buffer. 22Capital Management As of March 31, 2020 - Consolidated Well Consolidated Ratio Capitalized* Capital Excess $ in Thousands Total capital ratio 12.66% 10.50% $ 363,124 $ 61,918 Tier 1 capital ratio 10.15% 8.50% 291,209 47,376 Common equity tier 1 ratio 9.45% 7.00% 271,209 70,405 Leverage ratio 7.85% 5.00% 291,209 105,694 * Well Capitalized includes the fully phased-in capital conservation buffer. 22

Liquidity As of March 31, 2020 $ in Thousands Availability Excess cash $ 65,710 FHLB 493,203 Unpledged securities 138,701 Unsecured lines of credit 66,000 Brokered deposit capacity 562,974 Total $ 1,326,588 The Corporation is also participating in the Federal Reserve’s Paycheck Protection Program Lending Facility to provide further liquidity in support of the PPP. 23Liquidity As of March 31, 2020 $ in Thousands Availability Excess cash $ 65,710 FHLB 493,203 Unpledged securities 138,701 Unsecured lines of credit 66,000 Brokered deposit capacity 562,974 Total $ 1,326,588 The Corporation is also participating in the Federal Reserve’s Paycheck Protection Program Lending Facility to provide further liquidity in support of the PPP. 23

Available for Sale Securities Portfolio Corporate Notes Other Pooled and Bonds < 1% SBA 1% 5% $516M As of April 30, 2020 Unrealized $ in Thousands Current Par Book Value Fair Value Gain (Loss) U.S. government sponsored entities $ 123 ,819 $ 124,148 $ 131,232 $ 7,084 State and political subdivisions 66,376 67,239 69,351 2,112 Residential and multi-family mortgages 268 ,435 270,839 282,839 12,000 Corporate notes and bonds 8,350 8,350 7,712 (638) Pooled SBA 23,252 23,391 24,319 928 Other 1,020 1,020 981 (39) Total $ 491 ,252 $ 494,987 $ 516,434 $ 2 1,447 24Available for Sale Securities Portfolio Corporate Notes Other Pooled and Bonds < 1% SBA 1% 5% $516M As of April 30, 2020 Unrealized $ in Thousands Current Par Book Value Fair Value Gain (Loss) U.S. government sponsored entities $ 123 ,819 $ 124,148 $ 131,232 $ 7,084 State and political subdivisions 66,376 67,239 69,351 2,112 Residential and multi-family mortgages 268 ,435 270,839 282,839 12,000 Corporate notes and bonds 8,350 8,350 7,712 (638) Pooled SBA 23,252 23,391 24,319 928 Other 1,020 1,020 981 (39) Total $ 491 ,252 $ 494,987 $ 516,434 $ 2 1,447 24

Bank of Akron Update As of March 31, 2020 § Bank of Akron Merger Update: – On a pro forma basis as of March 31, 2020: • Total Assets of $406 million, or 9.7% of CNB total assets • Total Loans of $327 million, or 10.3% of CNB total loans • Total Deposits of $361 million, or 10.4% of CNB total deposits – Akron Shareholder approval received on March 18, 2020 (no shareholder vote required for CNB) – Transaction expected to close in 3rd Quarter of 2020, as originally expected – Current capital levels fully support the transaction 25Bank of Akron Update As of March 31, 2020 § Bank of Akron Merger Update: – On a pro forma basis as of March 31, 2020: • Total Assets of $406 million, or 9.7% of CNB total assets • Total Loans of $327 million, or 10.3% of CNB total loans • Total Deposits of $361 million, or 10.4% of CNB total deposits – Akron Shareholder approval received on March 18, 2020 (no shareholder vote required for CNB) – Transaction expected to close in 3rd Quarter of 2020, as originally expected – Current capital levels fully support the transaction 25

Non‐GAAP Financial Reconciliation Tangible common equity, tangible assets, and tangible book value per share are non‐GAAP financial measures calculated using GAAP amounts. Tangible common equity is calculated by excluding the balance of goodwill and the core deposit intangible from the calculation of shareholders’ equity. Tangible assets are calculated by excluding the balance of goodwill and the core deposit intangible from the calculation of total assets. Tangible book value per share is calculated by dividing tangible common equity by the number of shares outstanding. CNB believes that these non‐GAAP financial measures provide information to investors that is useful in understanding its financial condition because, in the case of the tangible common equity to tangible assets ratio, the ratio is an additional measure used to assess capital adequacy and, in the case of tangible book value per share, tangible book value per share is an additional measure used to assess CNB’s value. Because not all companies use the same calculations of tangible common equity and tangible assets, this presentation may not be comparable to other similarly titled measures calculated by other companies. A reconciliation of these non‐GAAP financial measures is provided below (dollars in thousands, except share and per share data). December 31, March 31, (in thousands, except per share) 2014 2015 2016 2017 2018 2019 2020 Total Shareholders' Equity $ 188,548 $ 201,913 $ 211,784 $ 243,910 $ 262,830 $ 304,966 $ 324,802 Less: Goodwill 27,194 27,194 38,730 38,730 38,730 38,730 38,730 Less: Core Deposit Intangible 3,403 2,395 2,854 1,625 727 160 77 Tangible Common Equity $ 157,951 $ 172,324 $ 170,200 $ 203,555 $ 223,373 $ 266,076 $ 285,995 Total Assets $ 2, 189,213 $ 2,285,136 $ 2,573,821 $ 2,768,773 $ 3,221,521 $ 3,763,659 $ 3,779,138 Less: Goodwill 27,194 27,194 38,730 38,730 38,730 38,730 38,730 Less: Core Deposit Intangible 3,403 2,395 2,854 1,625 727 160 77 Tangible Assets $ 2,158,616 $ 2,255,547 $ 2,532,237 $ 2,728,418 $ 3,182,064 $ 3,724,769 $ 3,740,331 Tangible Common Equity / Tangible Assets 7.32% 7.64% 6.72% 7.46% 7.02% 7.14% 7.65% Tangible Book Value per Share $ 10.97 $ 11.96 $ 11.76 $ 13.33 $ 14.69 $ 17.45 $ 18.58 Ending Shares Outstanding 14,404,416 14,407,980 14,467,815 15,264,740 15,207,281 15,247,985 15,396,617 Three Months Ended March 31, December 31, March 31, 2019 2019 2020 Income before income taxes $ 11,430 $ 12,782 $ 10,537 Provision for loan losses 1,306 812 3,079 Income before taxes and provision $ 12,736 $ 13,594 $ 13,616 26Non‐GAAP Financial Reconciliation Tangible common equity, tangible assets, and tangible book value per share are non‐GAAP financial measures calculated using GAAP amounts. Tangible common equity is calculated by excluding the balance of goodwill and the core deposit intangible from the calculation of shareholders’ equity. Tangible assets are calculated by excluding the balance of goodwill and the core deposit intangible from the calculation of total assets. Tangible book value per share is calculated by dividing tangible common equity by the number of shares outstanding. CNB believes that these non‐GAAP financial measures provide information to investors that is useful in understanding its financial condition because, in the case of the tangible common equity to tangible assets ratio, the ratio is an additional measure used to assess capital adequacy and, in the case of tangible book value per share, tangible book value per share is an additional measure used to assess CNB’s value. Because not all companies use the same calculations of tangible common equity and tangible assets, this presentation may not be comparable to other similarly titled measures calculated by other companies. A reconciliation of these non‐GAAP financial measures is provided below (dollars in thousands, except share and per share data). December 31, March 31, (in thousands, except per share) 2014 2015 2016 2017 2018 2019 2020 Total Shareholders' Equity $ 188,548 $ 201,913 $ 211,784 $ 243,910 $ 262,830 $ 304,966 $ 324,802 Less: Goodwill 27,194 27,194 38,730 38,730 38,730 38,730 38,730 Less: Core Deposit Intangible 3,403 2,395 2,854 1,625 727 160 77 Tangible Common Equity $ 157,951 $ 172,324 $ 170,200 $ 203,555 $ 223,373 $ 266,076 $ 285,995 Total Assets $ 2, 189,213 $ 2,285,136 $ 2,573,821 $ 2,768,773 $ 3,221,521 $ 3,763,659 $ 3,779,138 Less: Goodwill 27,194 27,194 38,730 38,730 38,730 38,730 38,730 Less: Core Deposit Intangible 3,403 2,395 2,854 1,625 727 160 77 Tangible Assets $ 2,158,616 $ 2,255,547 $ 2,532,237 $ 2,728,418 $ 3,182,064 $ 3,724,769 $ 3,740,331 Tangible Common Equity / Tangible Assets 7.32% 7.64% 6.72% 7.46% 7.02% 7.14% 7.65% Tangible Book Value per Share $ 10.97 $ 11.96 $ 11.76 $ 13.33 $ 14.69 $ 17.45 $ 18.58 Ending Shares Outstanding 14,404,416 14,407,980 14,467,815 15,264,740 15,207,281 15,247,985 15,396,617 Three Months Ended March 31, December 31, March 31, 2019 2019 2020 Income before income taxes $ 11,430 $ 12,782 $ 10,537 Provision for loan losses 1,306 812 3,079 Income before taxes and provision $ 12,736 $ 13,594 $ 13,616 26

June 11, 2020 27June 11, 2020 27