Attached files
| file | filename |
|---|---|
| 8-K - 8-K - SiriusPoint Ltd | tpre-20200608.htm |

Investor Presentation JUNE 2020 For Information Purposes Only
CAUTIONARY STATEMENT REGARDING FORWARD-LOOKING STATEMENTS Certain statements and information in this presentation may constitute forward-looking statements within the meaning of the Private Securities Litigation Reform Act of 1995. The words “believe,” “anticipate,” “plan,” “intend,” “foresee,” “guidance,” “potential,” “expect,” “should,” “will” “continue,” “could,” “estimate,” “forecast,” “goal,” “may,” “objective,” “predict,” “projection,” or similar expressions are intended to identify forward-looking statements (including those contained in certain visual depictions) in this presentation. These forward-looking statements reflect Third Point Reinsurance Ltd.’s ("Third Point Re" or the “Company”) current expectations and/or beliefs concerning future events. The Company has made every reasonable effort to ensure that the information, estimates, forecasts and assumptions on which these statements are based are current, reasonable and complete. However, these forward-looking statements are subject to a number of risks and uncertainties that may cause the Company’s actual performance to differ materially from that projected in such statements. Although it is not possible to identify all of these risks and factors, they include, among others, the following: results of operations fluctuate and may not be indicative of our prospects; a pandemic or other catastrophic event, including the recent outbreak of COVID-19, may adversely impact our financial condition or results of operations; more established competitors; losses exceeding reserves; highly cyclical property and casualty reinsurance industry; losses from catastrophe exposure; downgrade, withdrawal of ratings or change in rating outlook by rating agencies; significant decrease in our capital or surplus; dependence on key executives; inability to service our indebtedness; limited cash flow and liquidity due to our indebtedness; inability to raise necessary funds to pay principal or interest on debt; potential lack of availability of capital in the future; credit risk associated with the use of reinsurance brokers; future strategic transactions such as acquisitions, dispositions, mergers or joint ventures; technology breaches or failures, including cyber-attacks; lack of control over Third Point Enhanced LP (“TP Fund”); lack of control over the allocation and performance of TP Fund’s investment portfolio; dependence on Third Point LLC to implement TP Fund’s investment strategy; limited ability to withdraw our capital accounts from TP Fund; decline in revenue due to poor performance of TP Fund’s investment portfolio; TP Fund’s investment strategy involves risks that are greater than those faced by competitors; termination by Third Point LLC of our or TP Fund’s investment management agreements; potential conflicts of interest with Third Point LLC; losses resulting from significant investment positions; credit risk associated with the default on obligations of counterparties; ineffective investment risk management systems; fluctuations in the market value of TP Fund’s investment portfolio; trading restrictions being placed on TP Fund’s investments; limited termination provisions in our investment management agreements; limited liquidity and lack of valuation data on certain TP Fund’s investments; fluctuations in market value of our fixed-income securities; U.S. and global economic downturns; specific characteristics of investments in mortgage-backed securities and other asset-backed securities, in securities of issues based outside the U.S., and in special situation or distressed companies; loss of key employees at Third Point LLC; Third Point LLC’s compensation arrangements may incentivize investments that are risky or speculative; increased regulation or scrutiny of alternative investment advisers affecting our reputation; suspension or revocation of our reinsurance licenses; potentially being deemed an investment company under U.S. federal securities law; failure of reinsurance subsidiaries to meet minimum capital and surplus requirements; changes in Bermuda or other law and regulation that may have an adverse impact on our operations; Third Point Re and/or Third Point Re BDA potentially becoming subject to U.S. federal income taxation; potential characterization of Third Point Re and/or Third Point Re BDA as a passive foreign investment company; subjection of our affiliates to the base erosion and anti-abuse tax; potentially becoming subject to U.S. withholding and information reporting requirements under the Foreign Account Tax Compliance Act; and other risks and factors listed under “Risk Factors” in the Company’s most recent Annual Report on Form 10-K, as updated by our Quarterly Report on Form 10-Q for the period ended March 31, 2020, and other periodic and current disclosures filed with the Securities and Exchange Commission. All forward-looking statements speak only as of the date made and the Company undertakes no obligation to update or revise publicly any forward-looking statements, whether as a result of new information, future events or otherwise. This presentation may also contain non-GAAP financial information. The Company’s management uses this information in its internal analysis of results and believes that this information may be informative to investors in gauging the quality of the Company’s financial performance, identifying trends in our results and providing meaningful period-to- period comparisons. For additional information regarding these non-GAAP financial measures, including any required reconciliations to the most directly comparable financial measure calculated according to GAAP, see the Non-GAAP Measures & Other Financial Measures section of this presentation. 2 For Information Purposes Only

COMPANY OVERVIEW Specialty property & casualty reinsurer based in TPRE Full Year 2019 Highlights Bermuda • 16.7% return on equity (1) • 15.9% increase in diluted book value per share to $15.04 (1) • Combined ratio of 103.2%, of which 4.1 points was attributable A- (Excellent) financial strength rating from A.M. to catastrophe events during the year Best Company • Wrote $68 million of new property catastrophe business • Attracted talented industry veterans to continue the build out of Began operations in January 2012 and the Company’s platform completed IPO in August 2013 • 12.8% return on investments managed by Third Point LLC TPRE Q1 2020 Results Investment portfolio managed by Third Point • (13.0)% return on equity (1) LLC • (13.2)% decrease in diluted book value per share to $13.05 (1) • Combined ratio of 97.0%, of which 6.5 points was attributable to the impact of COVID-19 • Transitioning to a specialty reinsurer • Improved underwriting result is a significant milestone in the • Improving profitability and delivering ongoing transformation of the company to a specialty reinsurer more consistent returns • Reported 15 straight quarters with no prior year adverse • Goal: deliver value from both sides of the development Company’s balance sheet • (7.3)% return on investments managed by Third Point LLC due to market volatility from COVID-19 (1) Non-GAAP financial measure. There is no comparable GAAP measure. Please see descriptions and reconciliations on slides 21 & 22. 3 For Information Purposes Only

INVESTMENT HIGHLIGHTS 1 Transitioning to a Specialty Reinsurer 2 Attracting Experienced Talent 3 Expanding into Higher Margin Business Lines 4 Capital Markets Expertise to Drive Value 5 Improving Underwriting Profitability 6 Differentiated Investment Strategy 7 Deliver Attractive Risk Adjusted Returns 4 For Information Purposes Only
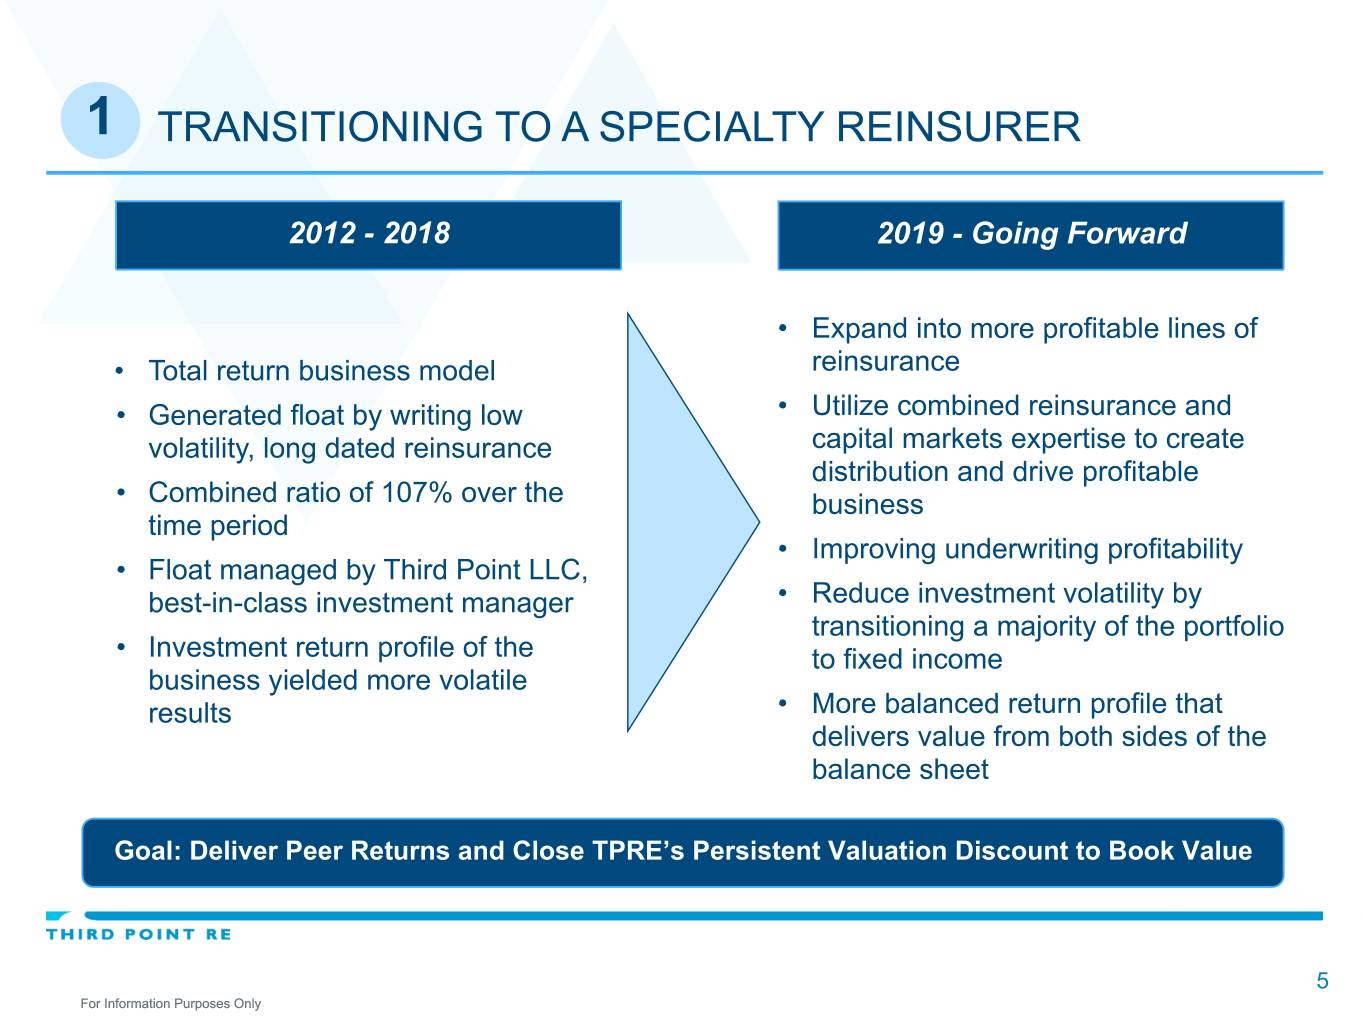
1 TRANSITIONING TO A SPECIALTY REINSURER 2012 - 2018 2019 - Going Forward • Expand into more profitable lines of • Total return business model reinsurance • Generated float by writing low • Utilize combined reinsurance and volatility, long dated reinsurance capital markets expertise to create distribution and drive profitable • Combined ratio of 107% over the business time period • Improving underwriting profitability • Float managed by Third Point LLC, best-in-class investment manager • Reduce investment volatility by transitioning a majority of the portfolio • Investment return profile of the to fixed income business yielded more volatile results • More balanced return profile that delivers value from both sides of the balance sheet Goal: Deliver Peer Returns and Close TPRE’s Persistent Valuation Discount to Book Value 5 For Information Purposes Only
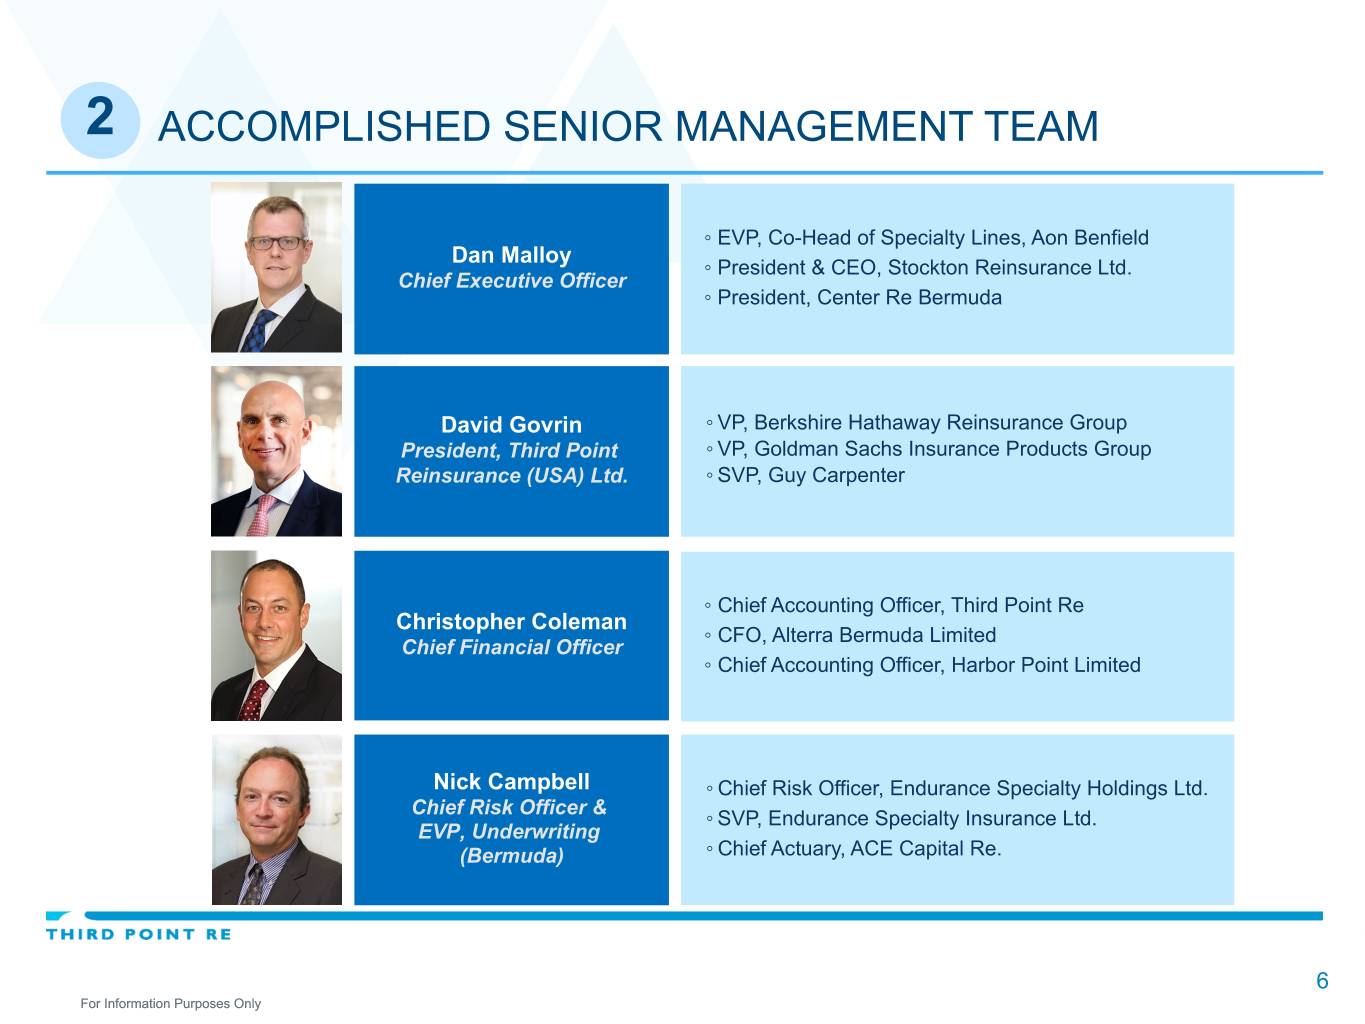
2 ACCOMPLISHED SENIOR MANAGEMENT TEAM ◦ EVP, Co-Head of Specialty Lines, Aon Benfield Dan Malloy ◦ President & CEO, Stockton Reinsurance Ltd. Chief Executive Officer ◦ President, Center Re Bermuda David Govrin ◦ VP, Berkshire Hathaway Reinsurance Group President, Third Point ◦ VP, Goldman Sachs Insurance Products Group Reinsurance (USA) Ltd. ◦ SVP, Guy Carpenter ◦ Chief Accounting Officer, Third Point Re Christopher Coleman ◦ CFO, Alterra Bermuda Limited Chief Financial Officer ◦ Chief Accounting Officer, Harbor Point Limited Nick Campbell ◦ Chief Risk Officer, Endurance Specialty Holdings Ltd. Chief Risk Officer & ◦ SVP, Endurance Specialty Insurance Ltd. EVP, Underwriting (Bermuda) ◦ Chief Actuary, ACE Capital Re. 6 For Information Purposes Only
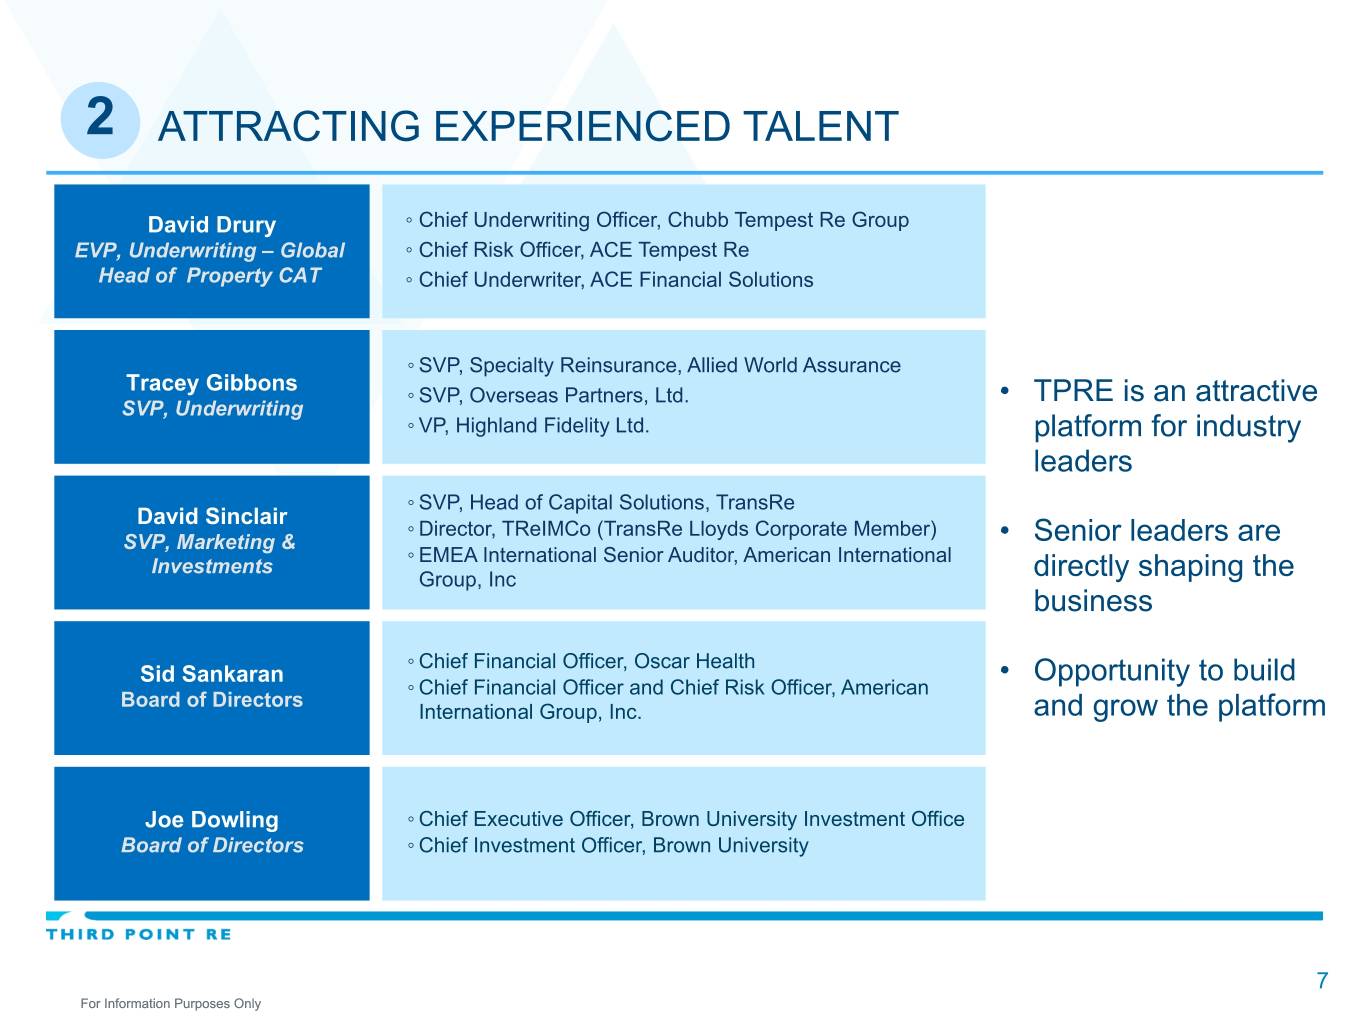
2 ATTRACTING EXPERIENCED TALENT David Drury ◦ Chief Underwriting Officer, Chubb Tempest Re Group EVP, Underwriting – Global ◦ Chief Risk Officer, ACE Tempest Re Head of Property CAT ◦ Chief Underwriter, ACE Financial Solutions ◦ SVP, Specialty Reinsurance, Allied World Assurance Tracey Gibbons ◦ SVP, Overseas Partners, Ltd. • TPRE is an attractive SVP, Underwriting ◦ VP, Highland Fidelity Ltd. platform for industry leaders ◦ SVP, Head of Capital Solutions, TransRe David Sinclair ◦ Director, TReIMCo (TransRe Lloyds Corporate Member) SVP, Marketing & • Senior leaders are ◦ EMEA International Senior Auditor, American International Investments Group, Inc directly shaping the business ◦ Chief Financial Officer, Oscar Health Sid Sankaran • Opportunity to build ◦ Chief Financial Officer and Chief Risk Officer, American Board of Directors International Group, Inc. and grow the platform Joe Dowling ◦ Chief Executive Officer, Brown University Investment Office Board of Directors ◦ Chief Investment Officer, Brown University 7 For Information Purposes Only
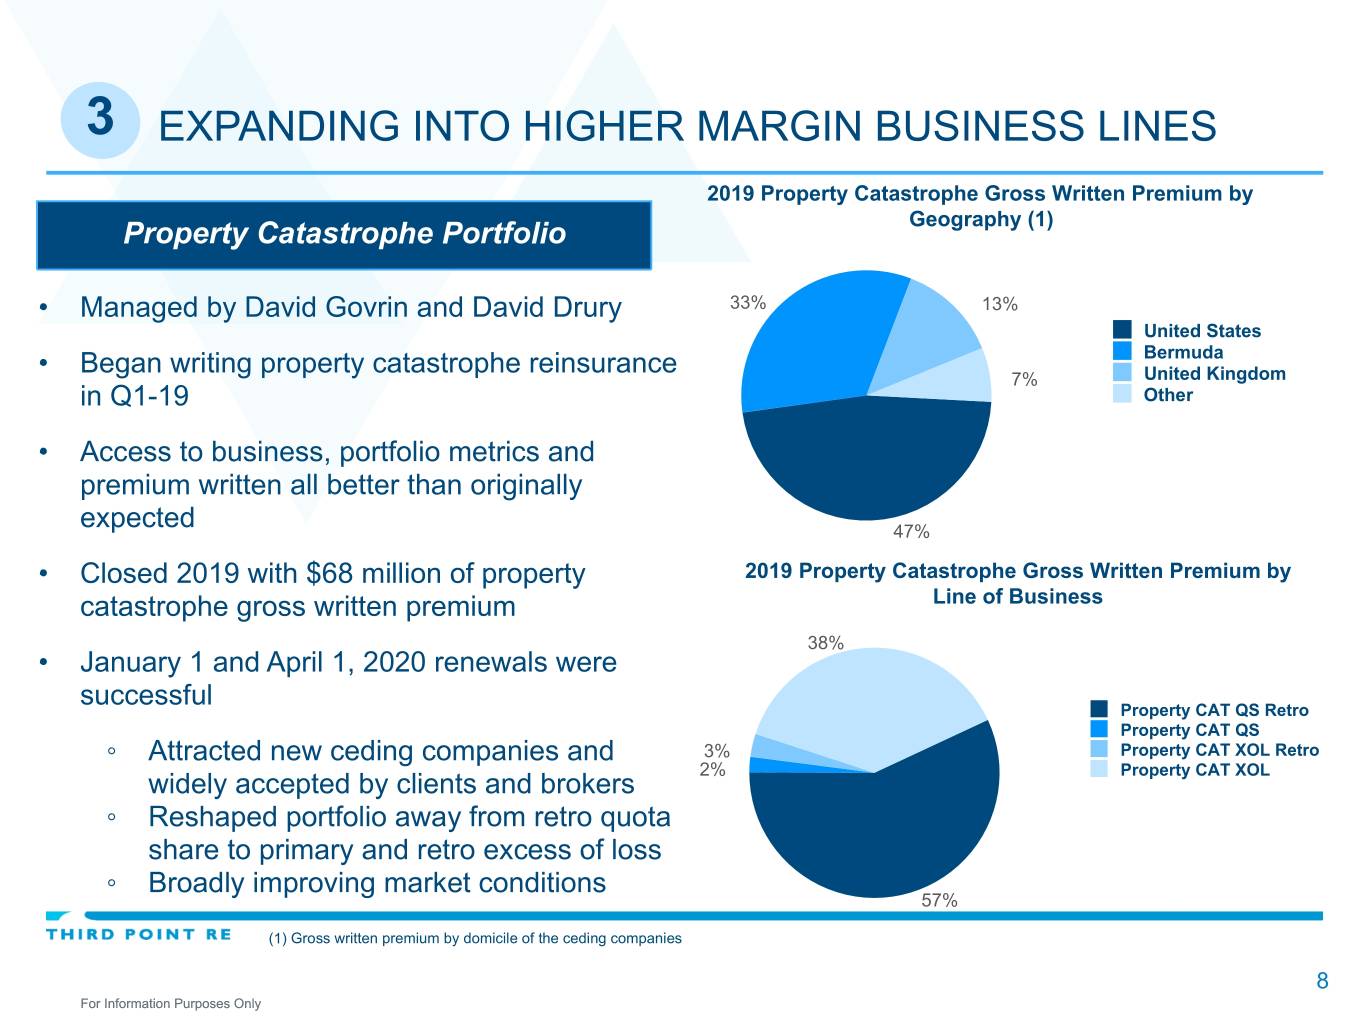
3 EXPANDING INTO HIGHER MARGIN BUSINESS LINES 2019 Property Catastrophe Gross Written Premium by Property Catastrophe Portfolio Geography (1) • Managed by David Govrin and David Drury 33% 13% United States Bermuda • Began writing property catastrophe reinsurance United Kingdom 7% in Q1-19 Other • Access to business, portfolio metrics and premium written all better than originally expected 47% • Closed 2019 with $68 million of property 2019 Property Catastrophe Gross Written Premium by catastrophe gross written premium Line of Business 38% • January 1 and April 1, 2020 renewals were successful Property CAT QS Retro Property CAT QS ◦ Attracted new ceding companies and 3% Property CAT XOL Retro 2% Property CAT XOL widely accepted by clients and brokers ◦ Reshaped portfolio away from retro quota share to primary and retro excess of loss ◦ Broadly improving market conditions 57% (1) Gross written premium by domicile of the ceding companies 8 For Information Purposes Only
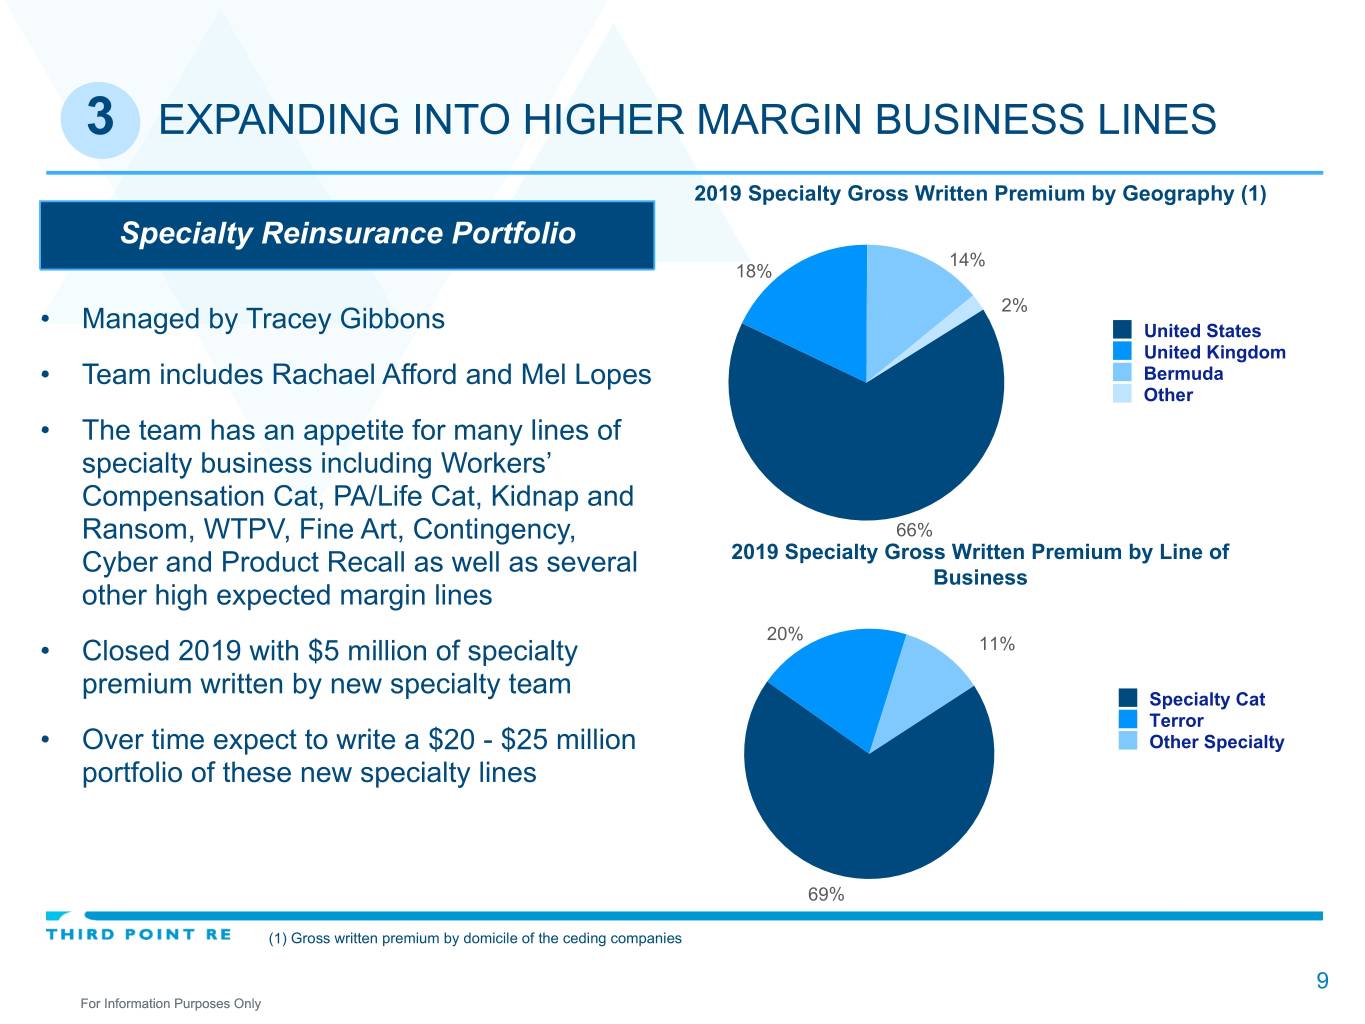
3 EXPANDING INTO HIGHER MARGIN BUSINESS LINES 2019 Specialty Gross Written Premium by Geography (1) Specialty Reinsurance Portfolio 14% 18% 2% • Managed by Tracey Gibbons United States United Kingdom • Team includes Rachael Afford and Mel Lopes Bermuda Other • The team has an appetite for many lines of specialty business including Workers’ Compensation Cat, PA/Life Cat, Kidnap and Ransom, WTPV, Fine Art, Contingency, 66% Cyber and Product Recall as well as several 2019 Specialty Gross Written Premium by Line of Business other high expected margin lines 20% • Closed 2019 with $5 million of specialty 11% premium written by new specialty team Specialty Cat Terror • Over time expect to write a $20 - $25 million Other Specialty portfolio of these new specialty lines 69% (1) Gross written premium by domicile of the ceding companies 9 For Information Purposes Only
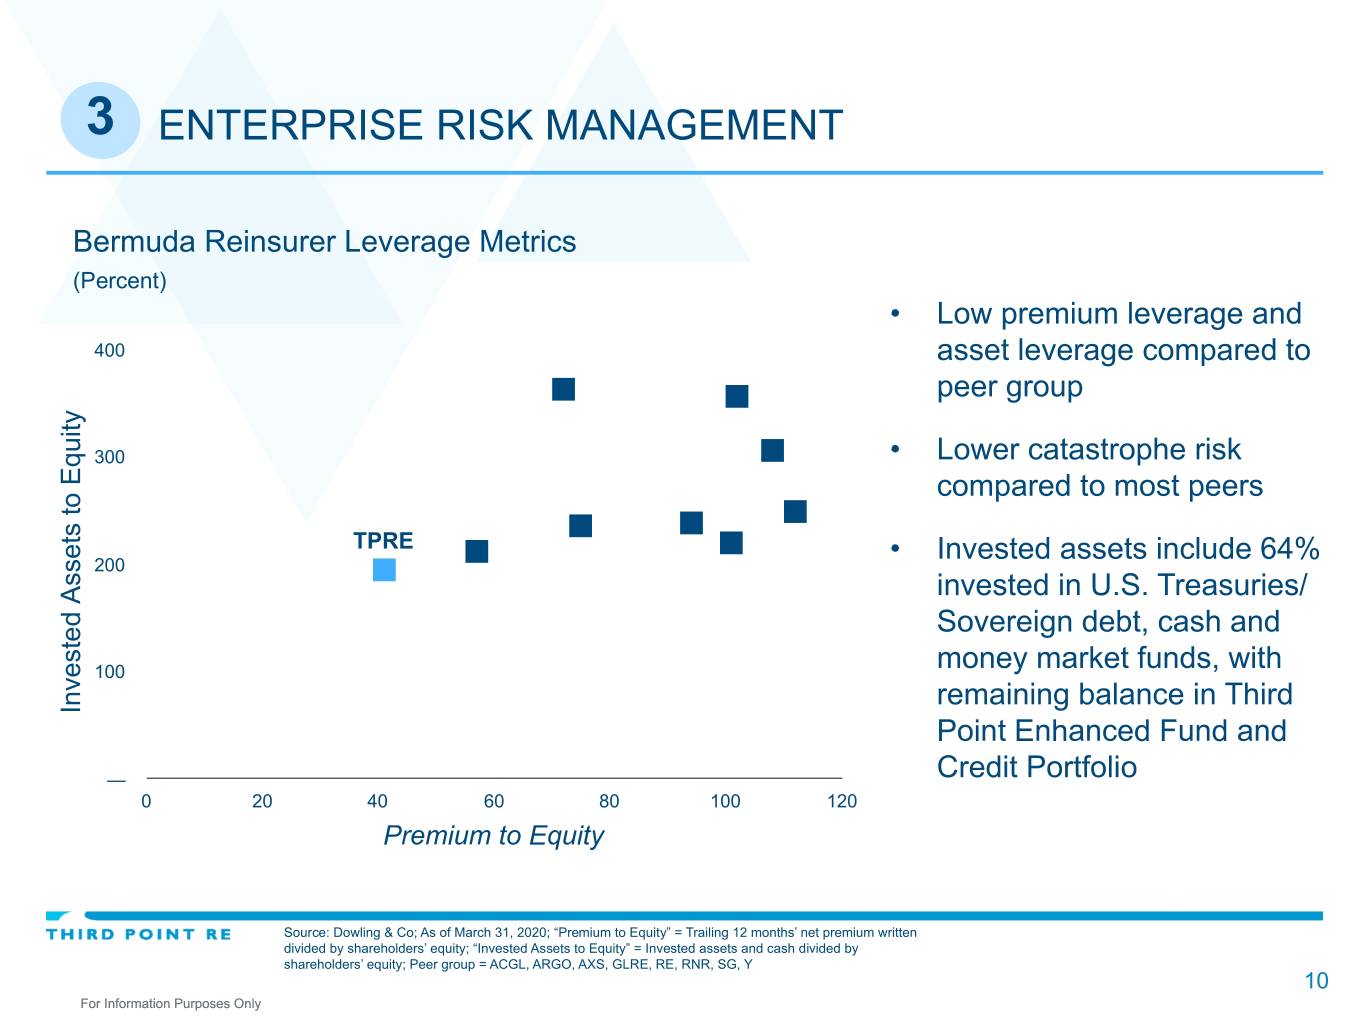
3 ENTERPRISE RISK MANAGEMENT Bermuda Reinsurer Leverage Metrics (Percent) • Low premium leverage and 400 asset leverage compared to peer group 300 • Lower catastrophe risk compared to most peers TPRE • Invested assets include 64% 200 invested in U.S. Treasuries/ Sovereign debt, cash and 100 money market funds, with remaining balance in Third In vested Assets to Equity Point Enhanced Fund and — Credit Portfolio 0 20 40 60 80 100 120 Premium to Equity Source: Dowling & Co; As of March 31, 2020; “Premium to Equity” = Trailing 12 months’ net premium written divided by shareholders’ equity; “Invested Assets to Equity” = Invested assets and cash divided by shareholders’ equity; Peer group = ACGL, ARGO, AXS, GLRE, RE, RNR, SG, Y 10 For Information Purposes Only
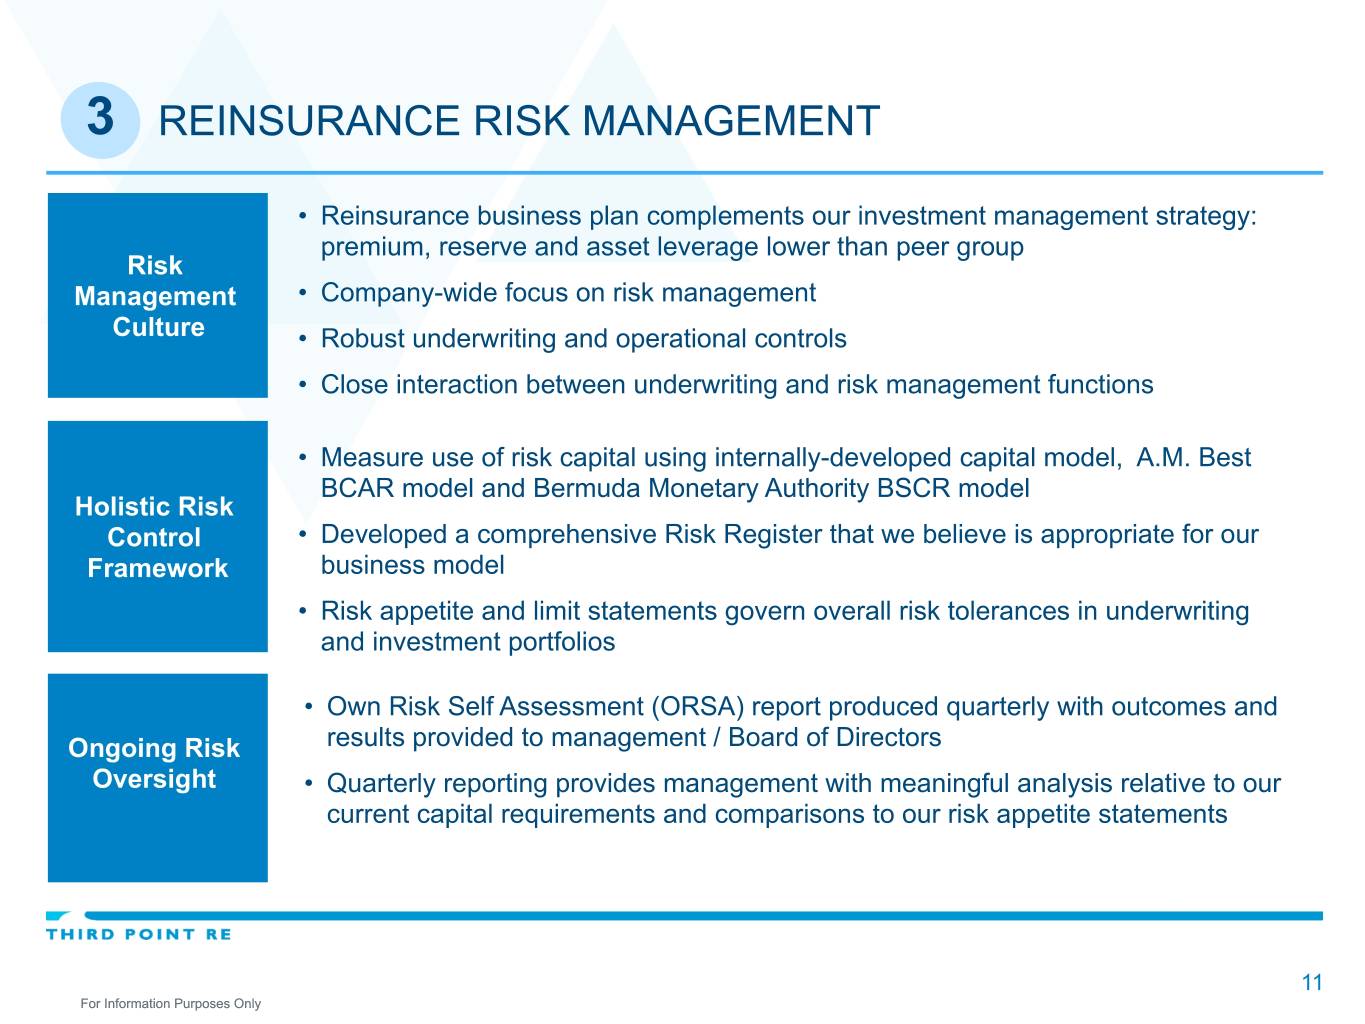
3 REINSURANCE RISK MANAGEMENT • Reinsurance business plan complements our investment management strategy: premium, reserve and asset leverage lower than peer group Risk Management • Company-wide focus on risk management Culture • Robust underwriting and operational controls • Close interaction between underwriting and risk management functions • Measure use of risk capital using internally-developed capital model, A.M. Best BCAR model and Bermuda Monetary Authority BSCR model Holistic Risk Control • Developed a comprehensive Risk Register that we believe is appropriate for our Framework business model • Risk appetite and limit statements govern overall risk tolerances in underwriting and investment portfolios • Own Risk Self Assessment (ORSA) report produced quarterly with outcomes and Ongoing Risk results provided to management / Board of Directors Oversight • Quarterly reporting provides management with meaningful analysis relative to our current capital requirements and comparisons to our risk appetite statements 11 For Information Purposes Only

3 FAVORABLE ACCIDENT YEAR LOSS DEVELOPMENT Reported 15 straight quarters with no prior year adverse development 106.0% 104.8% 103.8% 104.0% 104.0% 102.7% Q1 2020 combined ratio includes 6.5 102.0% 101.1% 101.2% points attributable to the impact of COVID-19 100.0% 98.4% 98.5% 98.0% 97.2% 97.0% 96.0% 94.0% Q1 2019 Q2 2019 Q3 2019 Q4 2019 Q1 2020 Combined ratio (as reported) Accident year ex-CAT losses combined ratio (1) (1) The accident year ex-CAT losses combined ratio excludes catastrophe losses, net of reinstatement premiums and profit commission adjustments, and prior year loss development. 12 For Information Purposes Only

3 CURRENT BUSINESS MIX 2019 Total Gross Written Premium by Geography (1) Full Year 2019 Performance ▪ 9% increase in gross written premiums to $632 million 24% 23% United States ▪ Top-line growth continues to be driven by accelerating United Kingdom rate increases in commercial lines Bermuda 1% Other ▪ $68 million of new property catastrophe business ▪ Partially offset by contracts that we did not renew in the year as a result of underlying pricing and/or terms and 52% conditions as part of our shift in underwriting strategy to improve underwriting margins 2019 Total Gross Written Premium by Line of Business 2016 2017 2018 2019 Q1 2020 Gross Written Premium $617.4 $641.6 $578.3 $631.8 $204.1 39% ($ Millions) Property Combined Ratio 108.5% 107.7% 106.8% 103.2% 97.0% Casualty 14% Specialty Retroactive 24% 23% (1) Gross written premium by domicile of the ceding companies 13 For Information Purposes Only
4 CAPITAL MARKETS EXPERTISE TO DRIVE VALUE • One area we focus on in solutions-driven business is the creation of long-term partnerships and optionality on high margin reinsurance premium with expense efficient distribution models and lower intermediation costs (closer linking of capital to risk) • We offer two value added approaches to drive origination of these opportunities and differentiation of TPRE ◦ Capital solutions driven reinsurance structures that are creative, flexible and responsive to clients desire to use reinsurance in their capital structure in lieu of other capital alternatives ◦ Non-reinsurance capital solutions (equity/debt) paired with reinsurance • We have closed four transactions to date and have a number of pipeline opportunities we hope to close by the latter part of 2020 ◦ Closed two solutions driven reinsurance transactions ◦ Closed two non-reinsurance capital solutions paired with reinsurance ◦ Current closed transactions represent approximately 10% of TPRE 2020 projected written premium ◦ Optionality to write premium that could increase the contribution from these types of transactions to 20% of written premium in future years 14 For Information Purposes Only
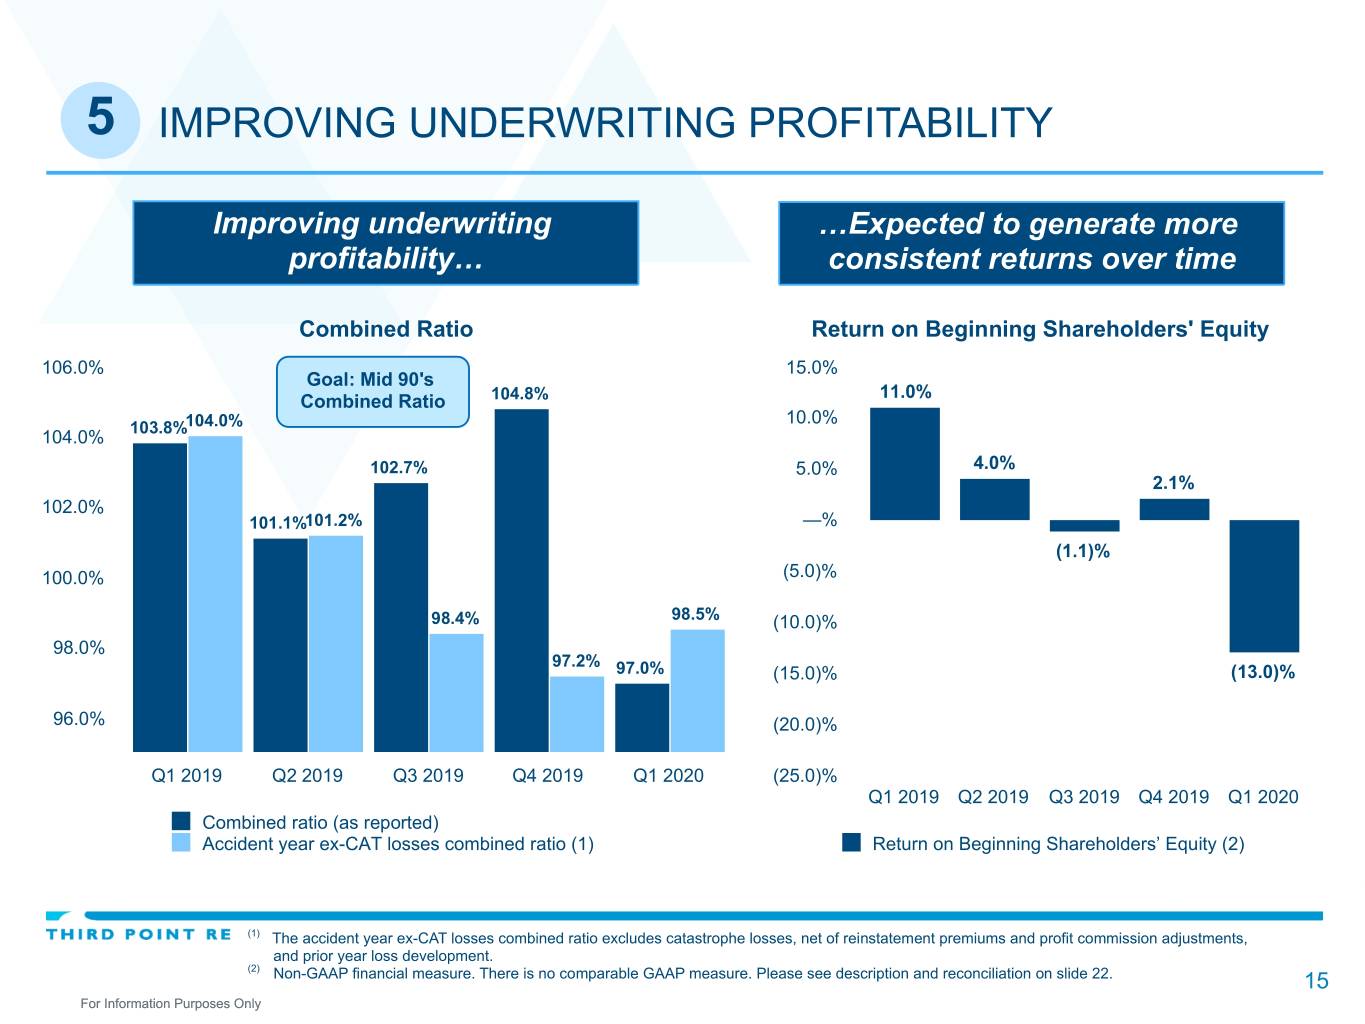
5 IMPROVING UNDERWRITING PROFITABILITY Improving underwriting …Expected to generate more profitability… consistent returns over time Combined Ratio Return on Beginning Shareholders' Equity 106.0% 15.0% Goal: Mid 90's 11.0% Combined Ratio 104.8% 10.0% 103.8%104.0% 104.0% 102.7% 5.0% 4.0% 2.1% 102.0% 101.1%101.2% —% (1.1)% 100.0% (5.0)% 98.4% 98.5% (10.0)% 98.0% 97.2% 97.0% (15.0)% (13.0)% 96.0% (20.0)% Q1 2019 Q2 2019 Q3 2019 Q4 2019 Q1 2020 (25.0)% Q1 2019 Q2 2019 Q3 2019 Q4 2019 Q1 2020 Combined ratio (as reported) Accident year ex-CAT losses combined ratio (1) Return on Beginning Shareholders’ Equity (2) (1) The accident year ex-CAT losses combined ratio excludes catastrophe losses, net of reinstatement premiums and profit commission adjustments, and prior year loss development. (2) Non-GAAP financial measure. There is no comparable GAAP measure. Please see description and reconciliation on slide 22. 15 For Information Purposes Only
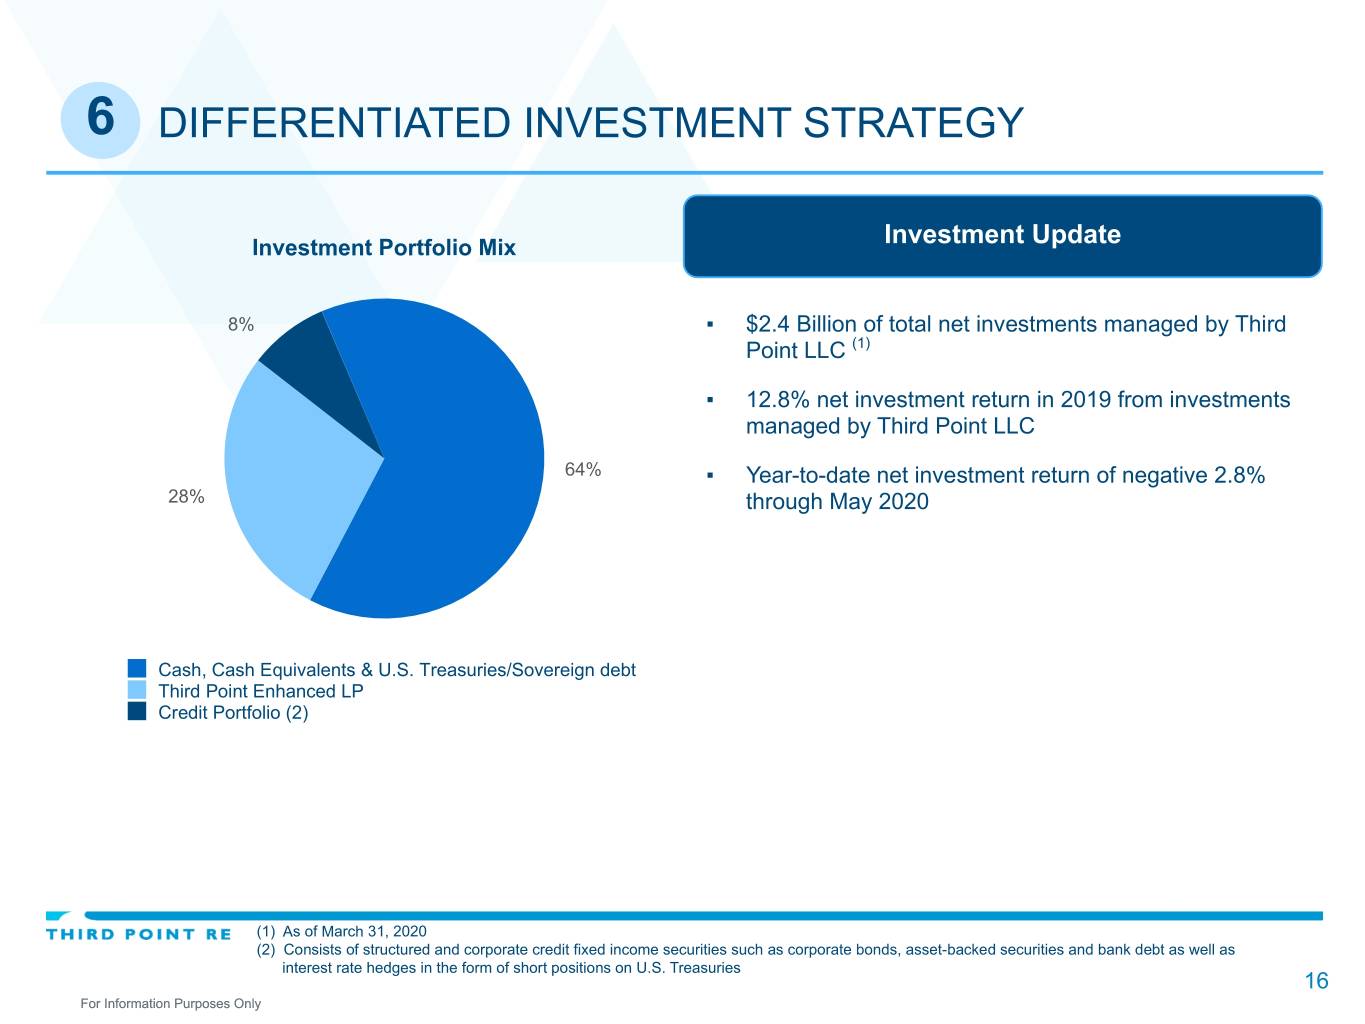
6 DIFFERENTIATED INVESTMENT STRATEGY Investment Portfolio Mix Investment Update 8% ▪ $2.4 Billion of total net investments managed by Third Point LLC (1) ▪ 12.8% net investment return in 2019 from investments managed by Third Point LLC 64% ▪ Year-to-date net investment return of negative 2.8% 28% through May 2020 Cash, Cash Equivalents & U.S. Treasuries/Sovereign debt Third Point Enhanced LP Credit Portfolio (2) (1) As of March 31, 2020 (2) Consists of structured and corporate credit fixed income securities such as corporate bonds, asset-backed securities and bank debt as well as interest rate hedges in the form of short positions on U.S. Treasuries 16 For Information Purposes Only
POISED TO DELIVER IMPROVED RESULTS • Transitioning to a Specialty Reinsurer • Attracting experienced talent • Expanding into higher margin business lines • Capital markets expertise to drive value • Improving underwriting profitability • Differentiated investment manager • Designed to deliver attractive risk adjusted returns Goal: Deliver Peer Returns and Close TPRE’s Persistent Valuation Discount to Book Value 17 For Information Purposes Only

Key Financial Highlights For Information Purposes Only 18
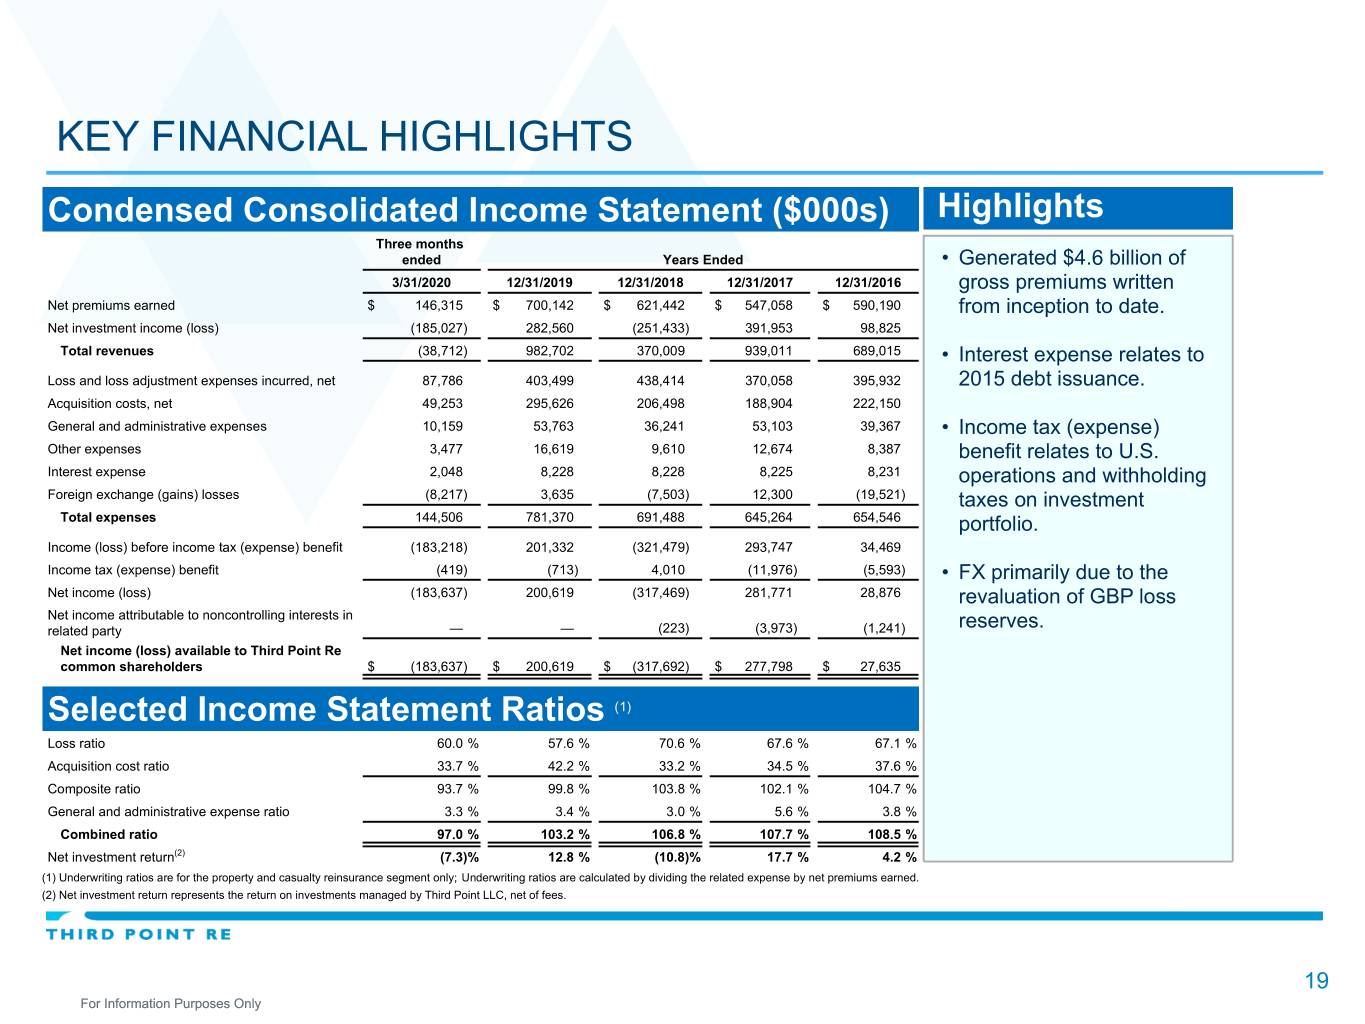
KEY FINANCIAL HIGHLIGHTS Condensed Consolidated Income Statement ($000s) Highlights Three months ended Years Ended • Generated $4.6 billion of 3/31/2020 12/31/2019 12/31/2018 12/31/2017 12/31/2016 gross premiums written Net premiums earned $ 146,315 $ 700,142 $ 621,442 $ 547,058 $ 590,190 from inception to date. Net investment income (loss) (185,027) 282,560 (251,433) 391,953 98,825 Total revenues (38,712) 982,702 370,009 939,011 689,015 • Interest expense relates to Loss and loss adjustment expenses incurred, net 87,786 403,499 438,414 370,058 395,932 2015 debt issuance. Acquisition costs, net 49,253 295,626 206,498 188,904 222,150 General and administrative expenses 10,159 53,763 36,241 53,103 39,367 • Income tax (expense) Other expenses 3,477 16,619 9,610 12,674 8,387 benefit relates to U.S. Interest expense 2,048 8,228 8,228 8,225 8,231 operations and withholding Foreign exchange (gains) losses (8,217) 3,635 (7,503) 12,300 (19,521) taxes on investment Total expenses 144,506 781,370 691,488 645,264 654,546 portfolio. Income (loss) before income tax (expense) benefit (183,218) 201,332 (321,479) 293,747 34,469 Income tax (expense) benefit (419) (713) 4,010 (11,976) (5,593) • FX primarily due to the Net income (loss) (183,637) 200,619 (317,469) 281,771 28,876 revaluation of GBP loss Net income attributable to noncontrolling interests in related party — — (223) (3,973) (1,241) reserves. Net income (loss) available to Third Point Re common shareholders $ (183,637) $ 200,619 $ (317,692) $ 277,798 $ 27,635 Selected Income Statement Ratios (1) Loss ratio 60.0 % 57.6 % 70.6 % 67.6 % 67.1 % Acquisition cost ratio 33.7 % 42.2 % 33.2 % 34.5 % 37.6 % Composite ratio 93.7 % 99.8 % 103.8 % 102.1 % 104.7 % General and administrative expense ratio 3.3 % 3.4 % 3.0 % 5.6 % 3.8 % Combined ratio 97.0 % 103.2 % 106.8 % 107.7 % 108.5 % Net investment return(2) (7.3) % 12.8 % (10.8) % 17.7 % 4.2 % (1) Underwriting ratios are for the property and casualty reinsurance segment only; Underwriting ratios are calculated by dividing the related expense by net premiums earned. (2) Net investment return represents the return on investments managed by Third Point LLC, net of fees. 19 For Information Purposes Only

KEY FINANCIAL HIGHLIGHTS Selected Balance Sheet Data ($000s) Highlights As of 3/31/2020 12/31/2019 12/31/2018 12/31/2017 12/31/2016 • $286.0 million of capital Total assets $ 3,342,534 $ 3,439,694 $ 3,086,234 $ 4,671,794 $ 3,895,644 raised with 2013 IPO. Total liabilities 2,110,833 2,025,620 1,881,660 2,902,079 2,445,919 Total shareholders’ equity 1,231,701 1,414,074 1,204,574 1,661,496 1,449,725 • $115.0 million of debt Noncontrolling interests in related party — — — (5,407) (35,674) issued in 2015. Shareholders' equity attributable to Third Point Re common shareholders $ 1,231,701 $ 1,414,074 $ 1,204,574 $ 1,656,089 $ 1,414,051 • 72.3% cumulative net investment return through Investments ($000s) March 31, 2020 (1). As of 3/31/2020 12/31/2019 12/31/2018 12/31/2017 12/31/2016 Total net investments managed by Third Point LLC $ 2,374,992 $ 2,590,127 $ 2,134,131 $ 2,589,895 $ 2,191,559 Selected Balance Sheet Metrics Three months ended Twelve months ended 3/31/2020 12/31/2019 12/31/2018 12/31/2017 12/31/2016 Diluted book value per share* $ 13.05 $ 15.04 $ 12.98 $ 15.71 $ 13.29 Growth in diluted book value per share* (13.2) % 15.9 % (17.4) % 18.2 % 3.8 % Return on beginning shareholders’ equity attributable to Third Point Re common shareholders* (13.0) % 16.7 % (20.0) % 20.1 % 2.0 % * Non-GAAP financial measure. There is no comparable GAAP measure. Please see descriptions and reconciliations on slides 21 and 22. (1) Cumulative net investment return represents the cumulative return on investments managed by Third Point LLC, net of fees. The cumulative net investment return on investments managed by Third Point LLC is the percentage change in value of a dollar invested from January 1, 2012 to March 31, 2020 on our investment managed by Third Point LLC. Prior to the investment account restructuring, effective August 31, 2018, the stated return was net of noncontrolling interests and net of withholding taxes, which were presented as a component of income tax expense in our condensed consolidated statements of income (loss). Net investment return is the key indicator by which we measure the performance of Third Point LLC, our investment manager. 20 For Information Purposes Only
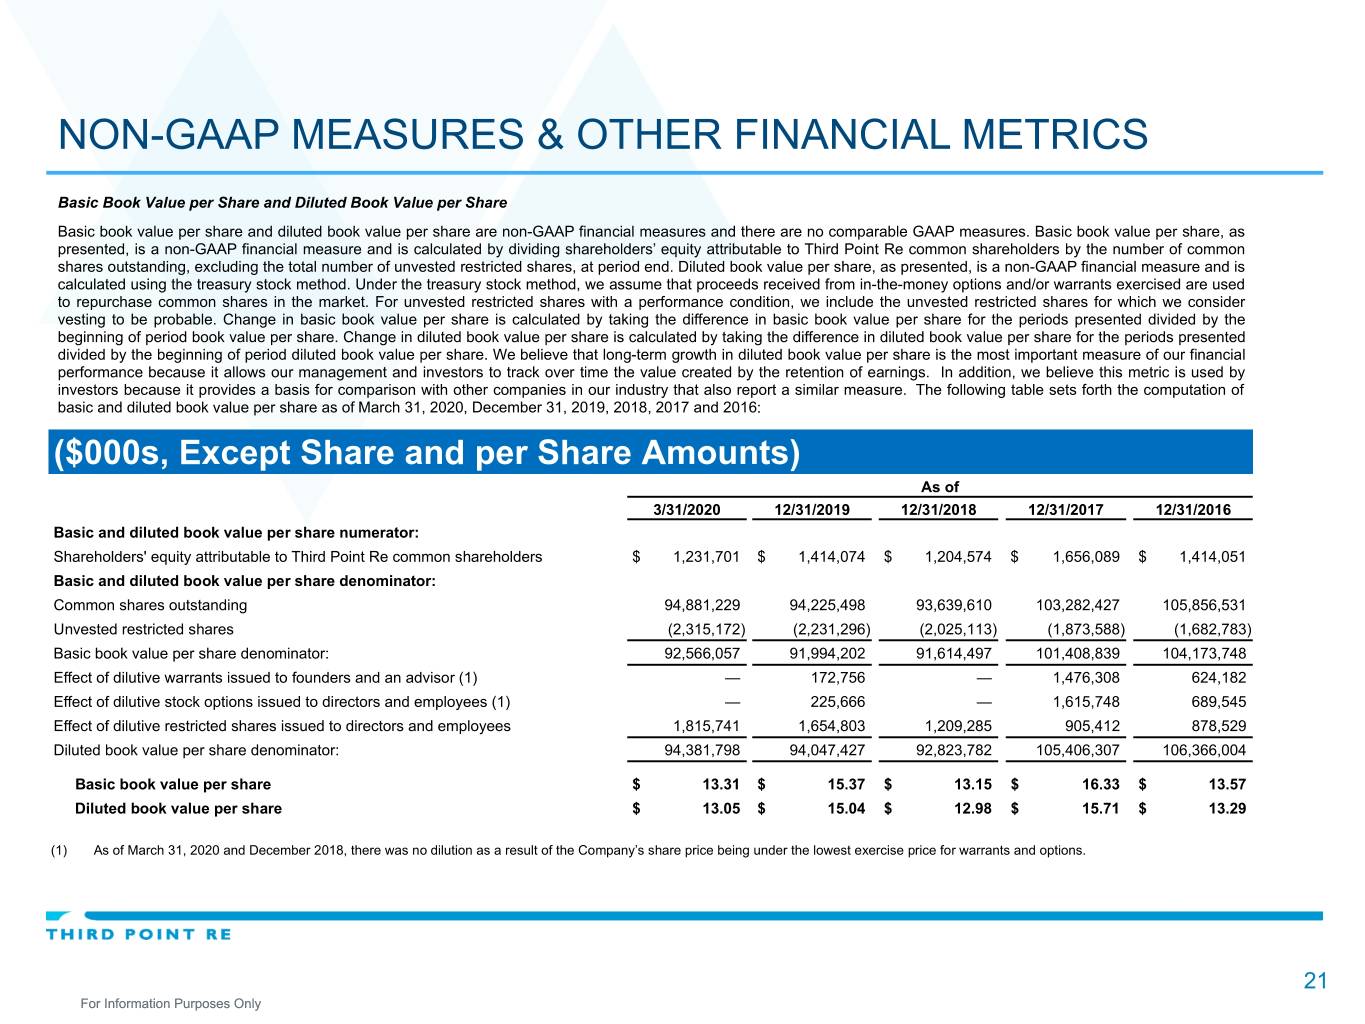
NON-GAAP MEASURES & OTHER FINANCIAL METRICS Basic Book Value per Share and Diluted Book Value per Share Basic book value per share and diluted book value per share are non-GAAP financial measures and there are no comparable GAAP measures. Basic book value per share, as presented, is a non-GAAP financial measure and is calculated by dividing shareholders’ equity attributable to Third Point Re common shareholders by the number of common shares outstanding, excluding the total number of unvested restricted shares, at period end. Diluted book value per share, as presented, is a non-GAAP financial measure and is calculated using the treasury stock method. Under the treasury stock method, we assume that proceeds received from in-the-money options and/or warrants exercised are used to repurchase common shares in the market. For unvested restricted shares with a performance condition, we include the unvested restricted shares for which we consider vesting to be probable. Change in basic book value per share is calculated by taking the difference in basic book value per share for the periods presented divided by the beginning of period book value per share. Change in diluted book value per share is calculated by taking the difference in diluted book value per share for the periods presented divided by the beginning of period diluted book value per share. We believe that long-term growth in diluted book value per share is the most important measure of our financial performance because it allows our management and investors to track over time the value created by the retention of earnings. In addition, we believe this metric is used by investors because it provides a basis for comparison with other companies in our industry that also report a similar measure. The following table sets forth the computation of basic and diluted book value per share as of March 31, 2020, December 31, 2019, 2018, 2017 and 2016: ($000s, Except Share and per Share Amounts) As of 3/31/2020 12/31/2019 12/31/2018 12/31/2017 12/31/2016 Basic and diluted book value per share numerator: Shareholders' equity attributable to Third Point Re common shareholders $ 1,231,701 $ 1,414,074 $ 1,204,574 $ 1,656,089 $ 1,414,051 Basic and diluted book value per share denominator: Common shares outstanding 94,881,229 94,225,498 93,639,610 103,282,427 105,856,531 Unvested restricted shares (2,315,172) (2,231,296) (2,025,113) (1,873,588) (1,682,783) Basic book value per share denominator: 92,566,057 91,994,202 91,614,497 101,408,839 104,173,748 Effect of dilutive warrants issued to founders and an advisor (1) — 172,756 — 1,476,308 624,182 Effect of dilutive stock options issued to directors and employees (1) — 225,666 — 1,615,748 689,545 Effect of dilutive restricted shares issued to directors and employees 1,815,741 1,654,803 1,209,285 905,412 878,529 Diluted book value per share denominator: 94,381,798 94,047,427 92,823,782 105,406,307 106,366,004 Basic book value per share $ 13.31 $ 15.37 $ 13.15 $ 16.33 $ 13.57 Diluted book value per share $ 13.05 $ 15.04 $ 12.98 $ 15.71 $ 13.29 (1) As of March 31, 2020 and December 2018, there was no dilution as a result of the Company’s share price being under the lowest exercise price for warrants and options. 21 For Information Purposes Only
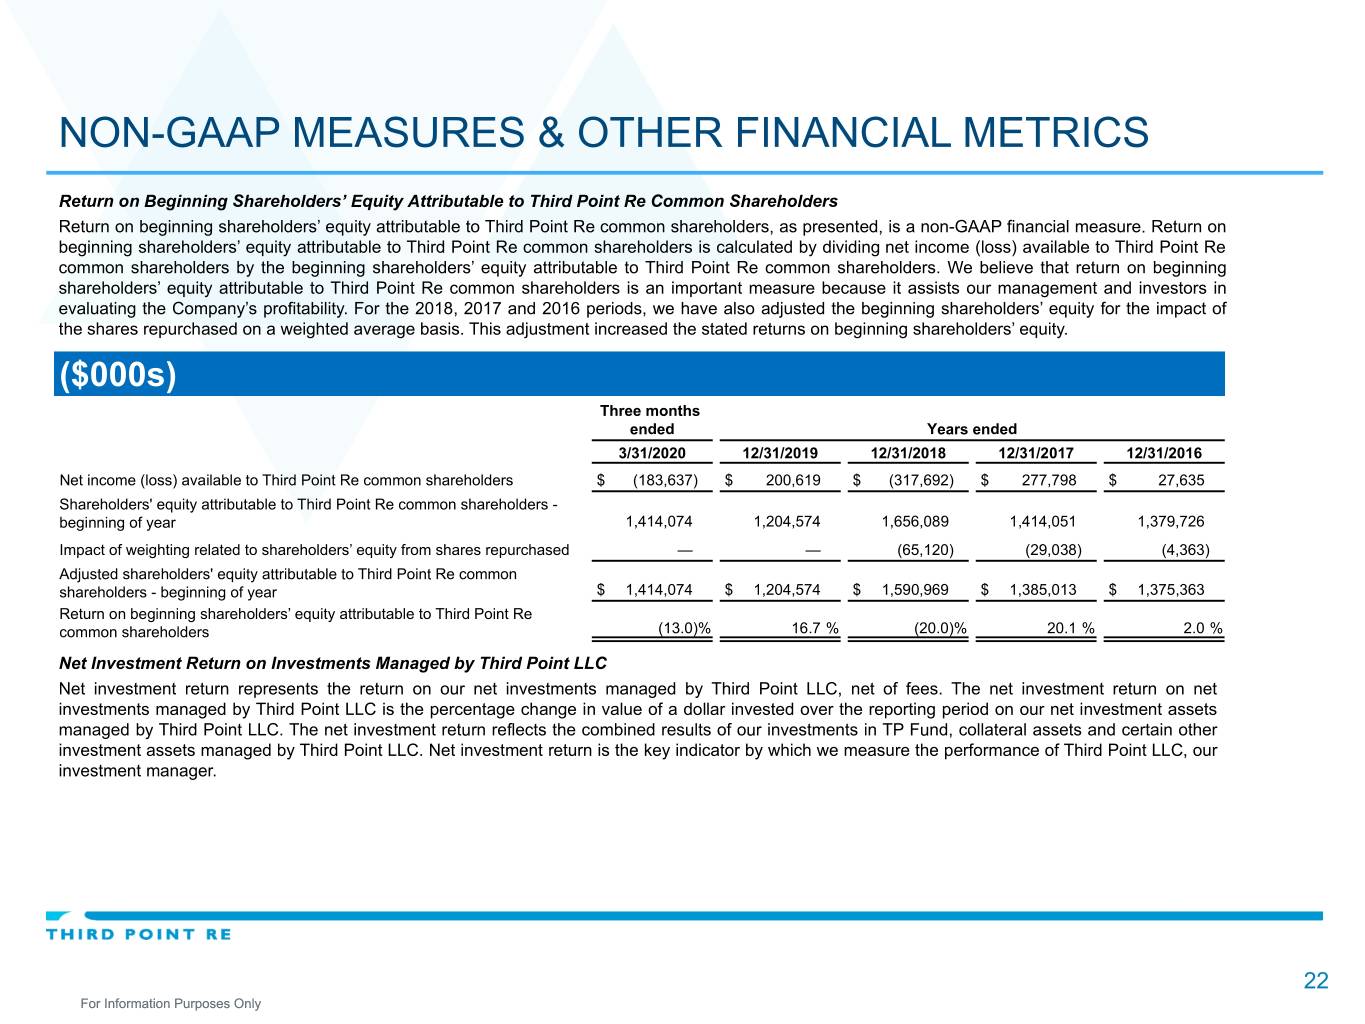
NON-GAAP MEASURES & OTHER FINANCIAL METRICS Return on Beginning Shareholders’ Equity Attributable to Third Point Re Common Shareholders Return on beginning shareholders’ equity attributable to Third Point Re common shareholders, as presented, is a non-GAAP financial measure. Return on beginning shareholders’ equity attributable to Third Point Re common shareholders is calculated by dividing net income (loss) available to Third Point Re common shareholders by the beginning shareholders’ equity attributable to Third Point Re common shareholders. We believe that return on beginning shareholders’ equity attributable to Third Point Re common shareholders is an important measure because it assists our management and investors in evaluating the Company’s profitability. For the 2018, 2017 and 2016 periods, we have also adjusted the beginning shareholders’ equity for the impact of the shares repurchased on a weighted average basis. This adjustment increased the stated returns on beginning shareholders’ equity. ($000s) Three months ended Years ended 3/31/2020 12/31/2019 12/31/2018 12/31/2017 12/31/2016 Net income (loss) available to Third Point Re common shareholders $ (183,637) $ 200,619 $ (317,692) $ 277,798 $ 27,635 Shareholders' equity attributable to Third Point Re common shareholders - beginning of year 1,414,074 1,204,574 1,656,089 1,414,051 1,379,726 Impact of weighting related to shareholders’ equity from shares repurchased — — (65,120) (29,038) (4,363) Adjusted shareholders' equity attributable to Third Point Re common shareholders - beginning of year $ 1,414,074 $ 1,204,574 $ 1,590,969 $ 1,385,013 $ 1,375,363 Return on beginning shareholders’ equity attributable to Third Point Re common shareholders (13.0) % 16.7 % (20.0) % 20.1 % 2.0 % Net Investment Return on Investments Managed by Third Point LLC Net investment return represents the return on our net investments managed by Third Point LLC, net of fees. The net investment return on net investments managed by Third Point LLC is the percentage change in value of a dollar invested over the reporting period on our net investment assets managed by Third Point LLC. The net investment return reflects the combined results of our investments in TP Fund, collateral assets and certain other investment assets managed by Third Point LLC. Net investment return is the key indicator by which we measure the performance of Third Point LLC, our investment manager. 22 For Information Purposes Only
Appendix 23 For Information Purposes Only
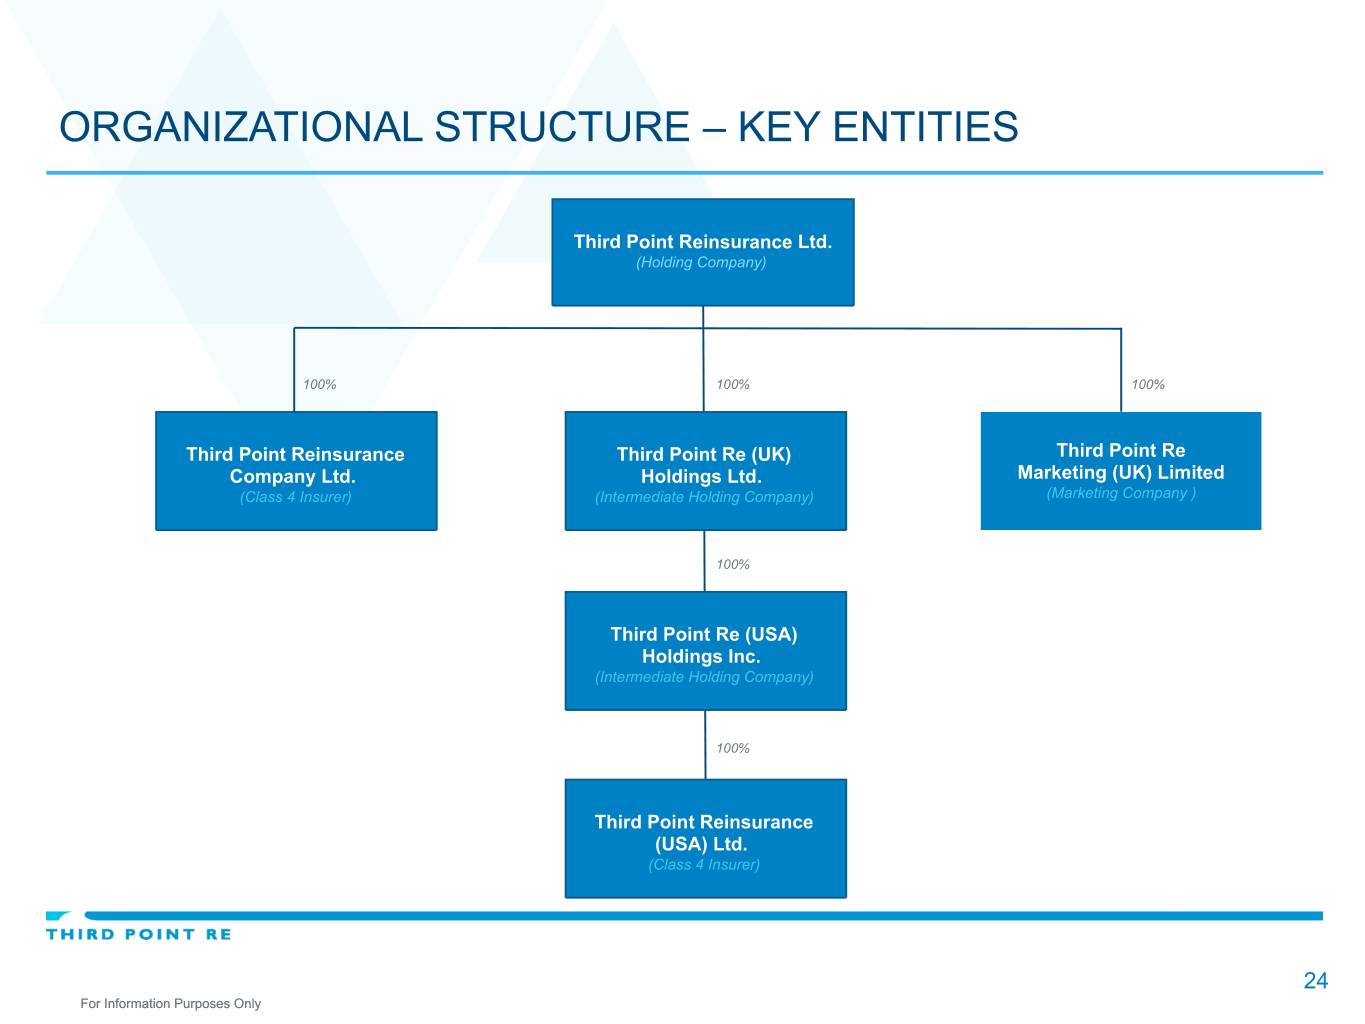
ORGANIZATIONAL STRUCTURE – KEY ENTITIES Third Point Reinsurance Ltd. (Holding Company) 100% 100% 100% Third Point Reinsurance Third Point Re (UK) Third Point Re Company Ltd. Holdings Ltd. Marketing (UK) Limited (Class 4 Insurer) (Intermediate Holding Company) (Marketing Company ) 100% Third Point Re (USA) Holdings Inc. (Intermediate Holding Company) 100% Third Point Reinsurance (USA) Ltd. (Class 4 Insurer) 24 For Information Purposes Only
