Attached files
| file | filename |
|---|---|
| EX-99.3 - EX-99.3 - THOR INDUSTRIES INC | tho-ex993_85.htm |
| EX-99.1 - EX-99.1 - THOR INDUSTRIES INC | d937197dex991.htm |
| 8-K - 8-K - THOR INDUSTRIES INC | tho-8k_20200608.htm |

THIRD QUARTER FISCAL 2020 RESULTS Exhibit 99.2

Forward-Looking Statements This presentation includes certain statements that are “forward-looking” statements within the meaning of the U.S. Private Securities Litigation Reform Act of 1995, Section 27A of the Securities Act of 1933, as amended, and Section 21E of the Securities Exchange Act of 1934, as amended. These forward-looking statements are made based on management’s current expectations and beliefs regarding future and anticipated developments and their effects upon Thor, and inherently involve uncertainties and risks. These forward-looking statements are not a guarantee of future performance. We cannot assure you that actual results will not differ materially from our expectations. Factors which could cause materially different results include, among others, the extent and impact of the coronavirus pandemic and various governmental mandates imposed due to the pandemic on retail customer demand, our independent dealers, our supply chain, our production and the resulting impact on our consolidated results of operations, financial position, cash flows and liquidity; the effect of raw material and commodity price fluctuations; raw material, commodity or chassis supply restrictions; the impact of tariffs on material or other input costs; the level and magnitude of warranty claims incurred; legislative, regulatory and tax law and/or policy developments including their potential impact on our dealers and their retail customers or on our suppliers; the costs of compliance with governmental regulation; legal and compliance issues including those that may arise in conjunction with recently completed transactions; lower consumer confidence and the level of discretionary consumer spending, especially in the wake of the coronavirus pandemic; interest rate fluctuations; the potential impact of interest rate fluctuations on the general economy and specifically on our dealers and consumers; restrictive lending practices; management changes; the success of new and existing products, services and production facilities; consumer preferences; the ability to efficiently utilize existing production facilities; the pace of acquisitions and the successful closing, integration and financial impact thereof; the potential loss of existing customers of acquisitions; our ability to retain key management personnel of acquired companies; a shortage of necessary personnel for production; the loss or reduction of sales to key dealers; disruption of the delivery of units to dealers; increasing costs for freight and transportation; asset impairment charges; cost structure changes; competition; the impact of potential losses under repurchase or financed receivable agreements; the potential impact of the strength of the U.S. dollar on international demand for products priced in U.S. dollars; general economic, market and political conditions in the various countries in which our products are produced and/or sold; the impact of changing emissions and other regulatory standards in the various jurisdictions in which our products are produced and/or sold; and changes to our investment and capital allocation strategies or other facets of our strategic plan. Additional risks and uncertainties surrounding the acquisition of Erwin Hymer Group SE ("EHG") include risks regarding the potential benefits of the acquisition and the anticipated operating synergies, the integration of the business, the impact of exchange rate fluctuations and unknown or understated liabilities related to the acquisition and EHG's business. These and other risks and uncertainties are discussed more fully in Item 1A of our Annual Report on Form 10-K for the year ended July 31, 2019 and Part II, Item 1A of our quarterly report on Form 10-Q for the period ended April 30, 2020. We disclaim any obligation or undertaking to disseminate any updates or revisions to any forward-looking statements contained in this presentation or to reflect any change in our expectations after the date hereof or any change in events, conditions or circumstances on which any statement is based, except as required by law.
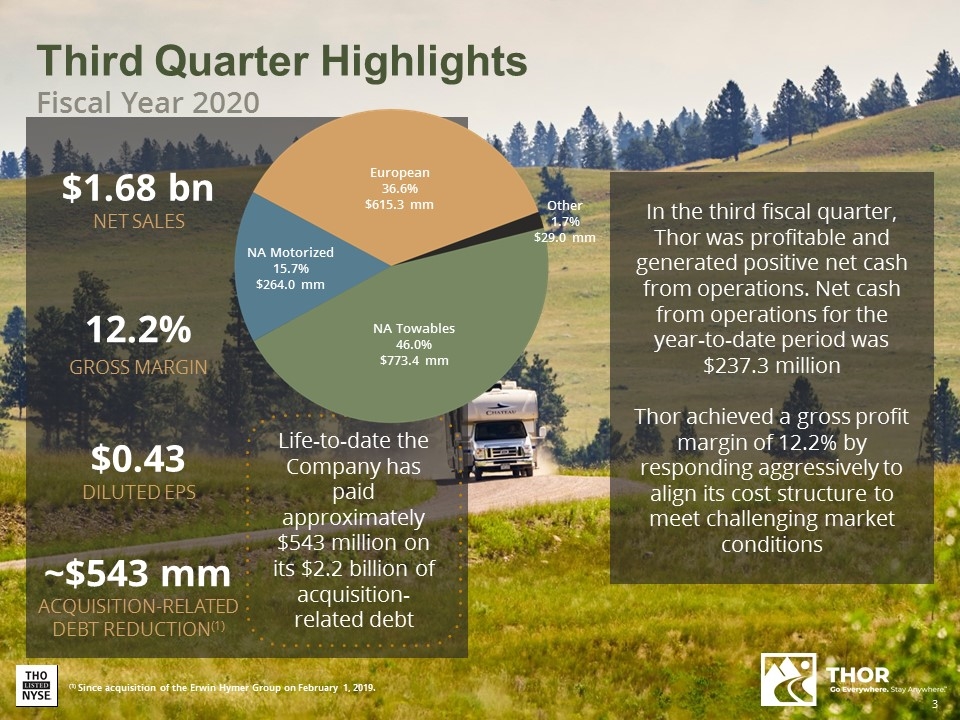
Third Quarter Highlights Fiscal Year 2020 $1.68 bn NET SALES In the third fiscal quarter, Thor was profitable and generated positive net cash from operations. Net cash from operations for the year-to-date period was $237.3 million Thor achieved a gross profit margin of 12.2% by responding aggressively to align its cost structure to meet challenging market conditions Life-to-date the Company has paid approximately $543 million on its $2.2 billion of acquisition-related debt ~$543 mm ACQUISITION-RELATED DEBT REDUCTION(1) $0.43 DILUTED EPS 12.2% GROSS MARGIN (1) Since acquisition of the Erwin Hymer Group on February 1, 2019. European 36.6% $615.3 mm NA Motorized 15.7% $264.0 mm NA Towables 46.0% $773.4 mm Other 1.7% $29.0 mm
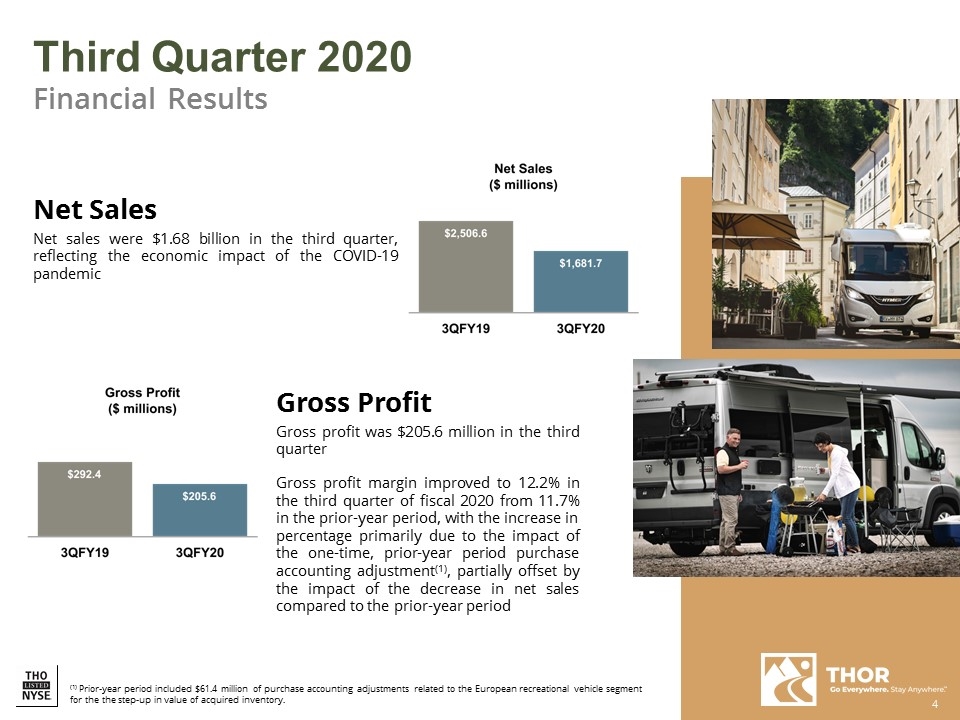
Third Quarter 2020 Financial Results Net Sales Net sales were $1.68 billion in the third quarter, reflecting the economic impact of the COVID-19 pandemic Gross Profit Gross profit was $205.6 million in the third quarter Gross profit margin improved to 12.2% in the third quarter of fiscal 2020 from 11.7% in the prior-year period, with the increase in percentage primarily due to the impact of the one-time, prior-year period purchase accounting adjustment(1), partially offset by the impact of the decrease in net sales compared to the prior-year period (1) Prior-year period included $61.4 million of purchase accounting adjustments related to the European recreational vehicle segment for the the step-up in value of acquired inventory.
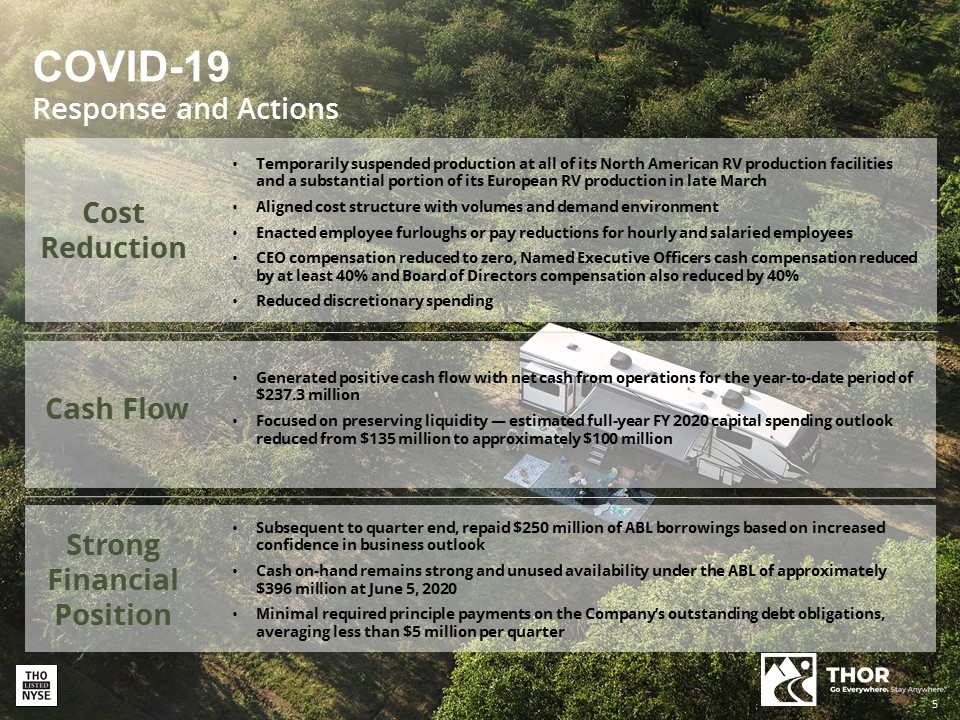
Temporarily suspended production at all of its North American RV production facilities and a substantial portion of its European RV production in late March Aligned cost structure with volumes and demand environment Enacted employee furloughs or pay reductions for hourly and salaried employees CEO compensation reduced to zero, Named Executive Officers cash compensation reduced by at least 40% and Board of Directors compensation also reduced by 40% Reduced discretionary spending COVID-19 Response and Actions Generated positive cash flow with net cash from operations for the year-to-date period of $237.3 million Focused on preserving liquidity — estimated full-year FY 2020 capital spending outlook reduced from $135 million to approximately $100 million Subsequent to quarter end, repaid $250 million of ABL borrowings based on increased confidence in business outlook Cash on-hand remains strong and unused availability under the ABL of approximately $396 million at June 5, 2020 Minimal required principle payments on the Company’s outstanding debt obligations, averaging less than $5 million per quarter Cost Reduction Cash Flow Strong Financial Position
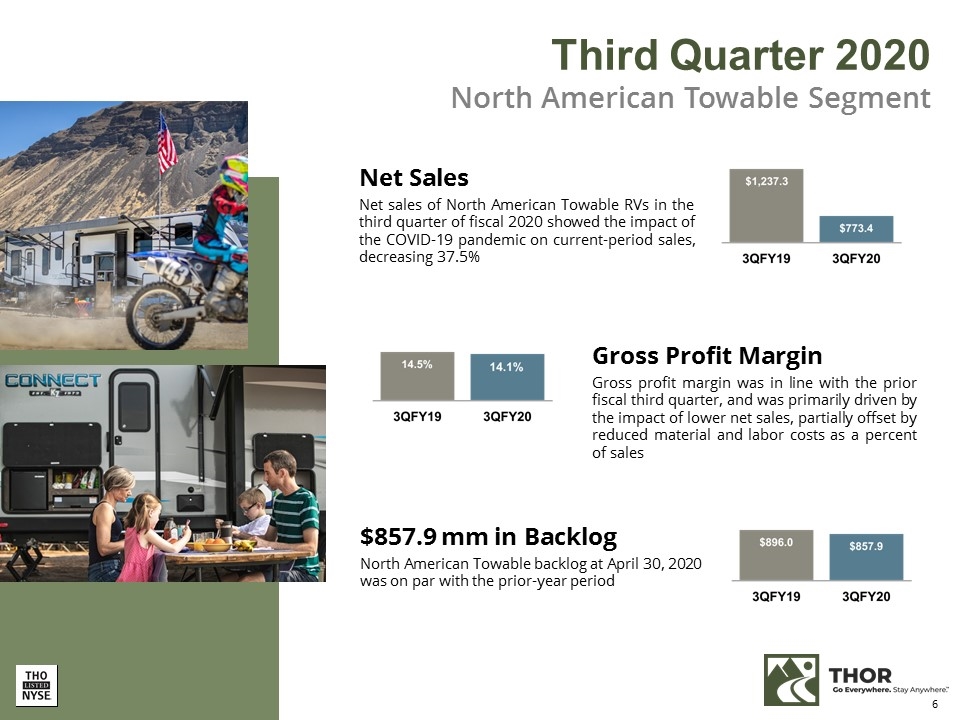
Third Quarter 2020 North American Towable Segment Net Sales Net sales of North American Towable RVs in the third quarter of fiscal 2020 showed the impact of the COVID-19 pandemic on current-period sales, decreasing 37.5% Gross Profit Margin Gross profit margin was in line with the prior fiscal third quarter, and was primarily driven by the impact of lower net sales, partially offset by reduced material and labor costs as a percent of sales $857.9 mm in Backlog North American Towable backlog at April 30, 2020 was on par with the prior-year period
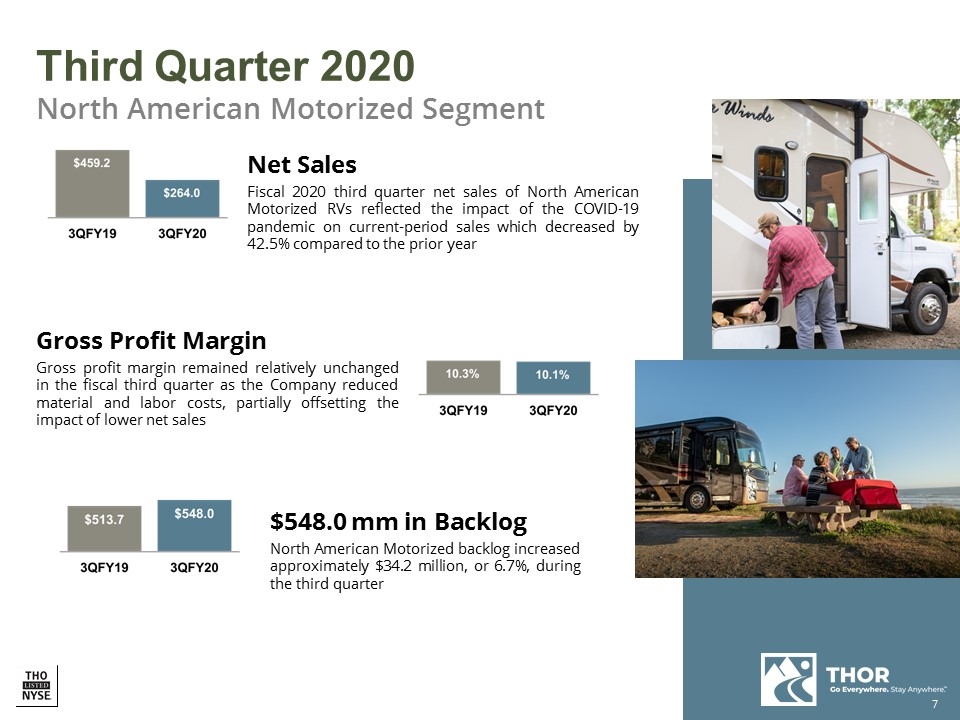
Net Sales Fiscal 2020 third quarter net sales of North American Motorized RVs reflected the impact of the COVID-19 pandemic on current-period sales which decreased by 42.5% compared to the prior year Third Quarter 2020 North American Motorized Segment Gross Profit Margin Gross profit margin remained relatively unchanged in the fiscal third quarter as the Company reduced material and labor costs, partially offsetting the impact of lower net sales $548.0 mm in Backlog North American Motorized backlog increased approximately $34.2 million, or 6.7%, during the third quarter
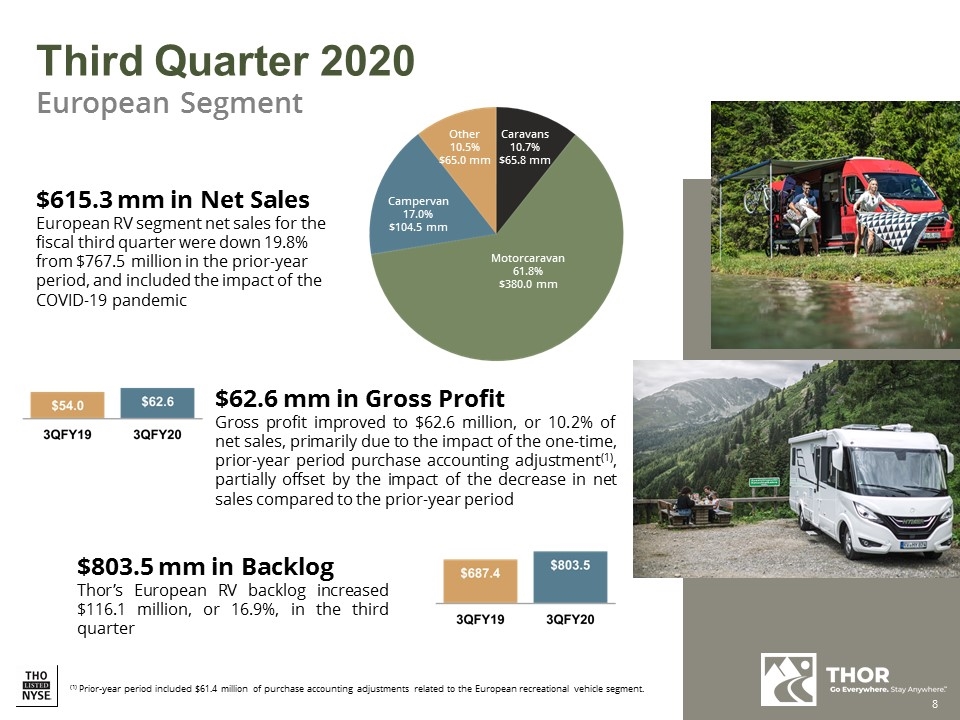
$615.3 mm in Net Sales European RV segment net sales for the fiscal third quarter were down 19.8% from $767.5 million in the prior-year period, and included the impact of the COVID-19 pandemic Third Quarter 2020 European Segment $62.6 mm in Gross Profit Gross profit improved to $62.6 million, or 10.2% of net sales, primarily due to the impact of the one-time, prior-year period purchase accounting adjustment(1), partially offset by the impact of the decrease in net sales compared to the prior-year period $803.5 mm in Backlog Thor’s European RV backlog increased $116.1 million, or 16.9%, in the third quarter Other 10.5% $65.0 mm Campervan 17.0% $104.5 mm Caravans 10.7% $65.8 mm Motorcaravan 61.8% $380.0 mm (1) Prior-year period included $61.4 million of purchase accounting adjustments related to the European recreational vehicle segment.
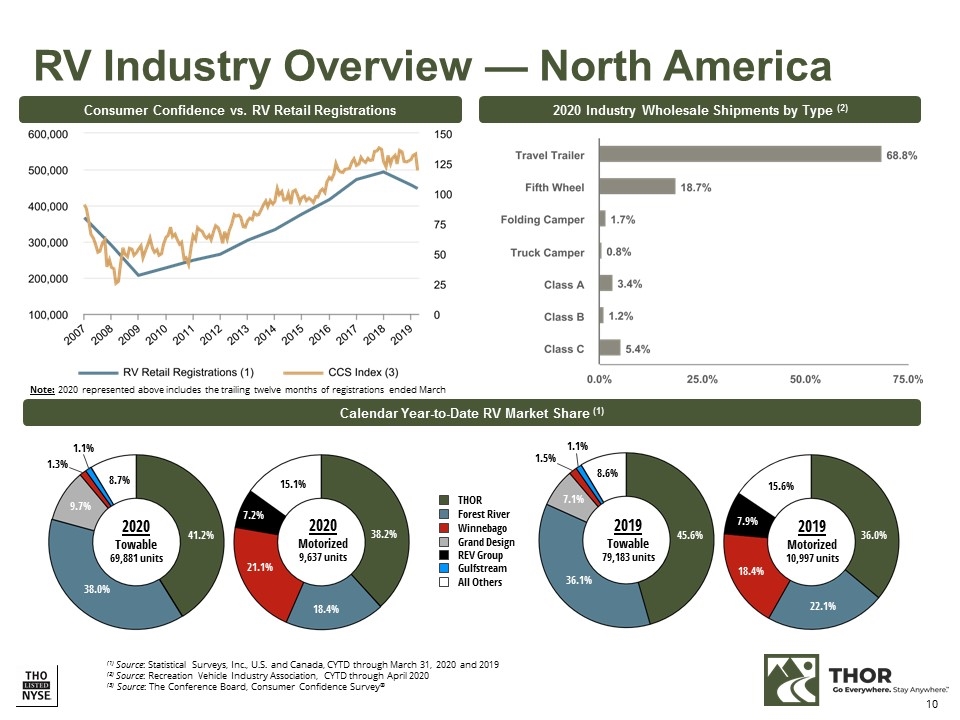
(1) Source: Statistical Surveys, Inc., U.S. and Canada, CYTD through March 31, 2020 and 2019 (2) Source: Recreation Vehicle Industry Association, CYTD through April 2020 (3) Source: The Conference Board, Consumer Confidence Survey® 2020 Industry Wholesale Shipments by Type (2) Consumer Confidence vs. RV Retail Registrations Calendar Year-to-Date RV Market Share (1) RV Industry Overview — North America 2019 2018 Total Share % Total Share % THOR Industries 32,468 40.8 % 40,101 44.5 % Forest River 28,312 35.6 % 31,040 34.4 % Grand Design 6,778 8.5 % 5,640 6.3 % Winnebago 2,931 3.7 % 3,175 3.5 % REV Group 1,124 1.4 % 1,353 1.5 % Gulfstream 863 1.1 % 946 1.0 % Subtotal 72,476 91.1 % 82,255 91.2 % All Others 7,042 8.9 % 7,925 8.8 % Grand Total 79,518 100.0 % 90,180 100.0 % THOR Forest River Winnebago Grand Design REV Group Gulfstream All Others 2020 Towable 69,881 units 2020 Motorized 9,637 units 2019 Motorized 10,997 units 2019 Towable 79,183 units 38.2% 41.2% 36.0% 45.6% 38.0% 18.4% 9.7% 1.3% 8.7% 1.1% 21.1% 7.2% 15.1% 8.6% 7.1% 36.1% 1.1% 1.5% 15.6% 22.1% 18.4% 7.9% Note: 2020 represented above includes the trailing twelve months of registrations ended March
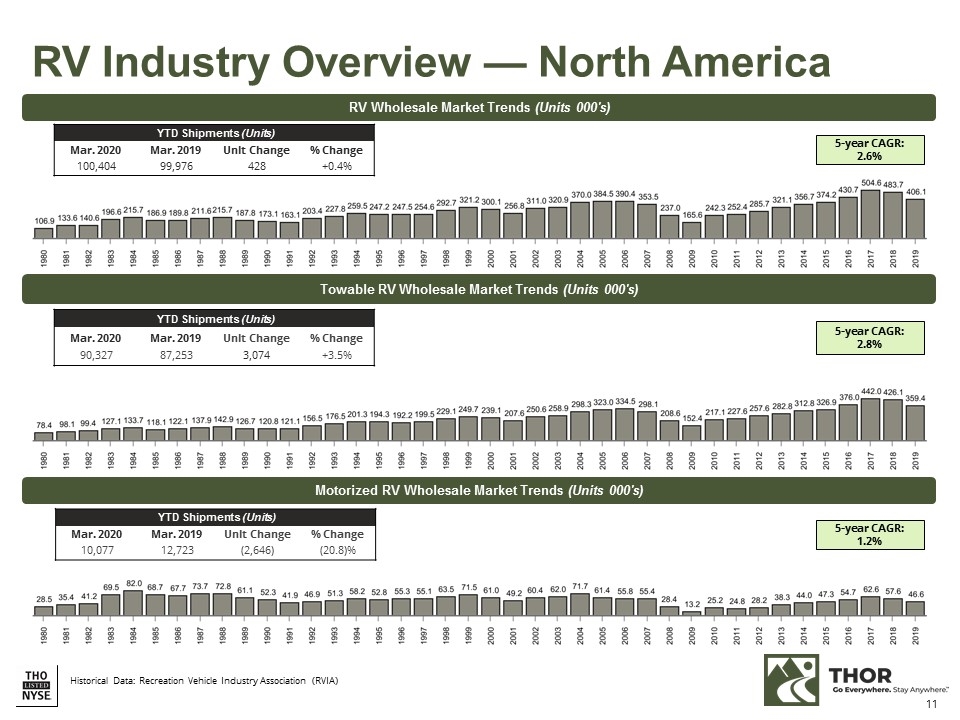
RV Industry Overview — North America RV Wholesale Market Trends (Units 000's) Towable RV Wholesale Market Trends (Units 000's) YTD Shipments (Units) Mar. 2020 Mar. 2019 Unit Change % Change 100,404 99,976 428 +0.4% YTD Shipments (Units) Mar. 2020 Mar. 2019 Unit Change % Change 90,327 87,253 3,074 +3.5% Motorized RV Wholesale Market Trends (Units 000's) YTD Shipments (Units) Mar. 2020 Mar. 2019 Unit Change % Change 10,077 12,723 (2,646) (20.8)% Historical Data: Recreation Vehicle Industry Association (RVIA) 5-year CAGR: 2.6% 5-year CAGR: 2.8% 5-year CAGR: 1.2%
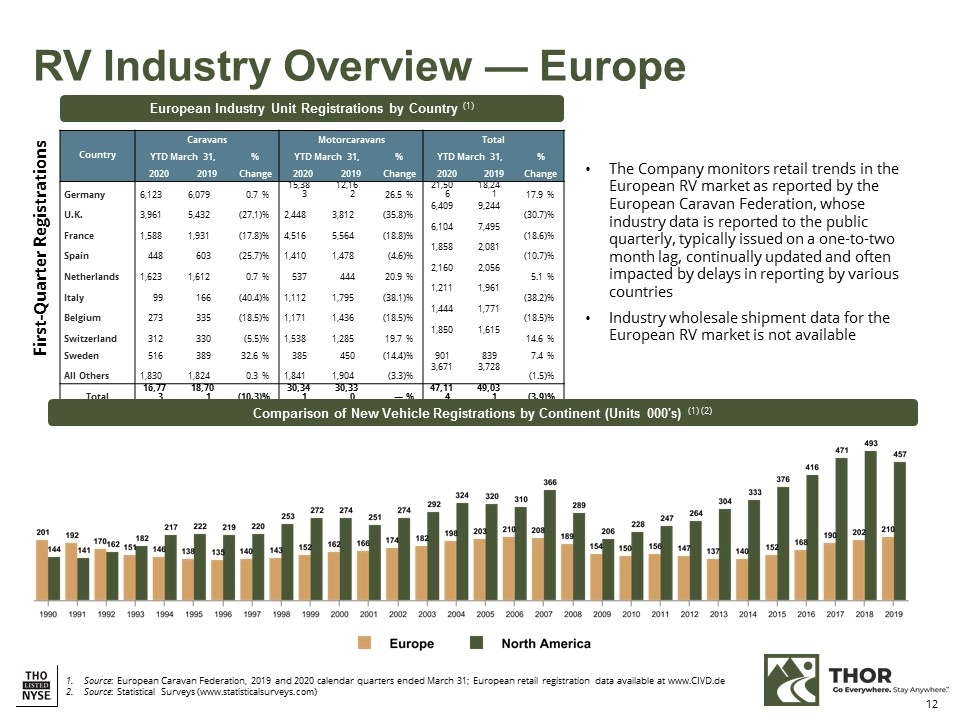
RV Industry Overview — Europe Source: European Caravan Federation, 2019 and 2020 calendar quarters ended March 31; European retail registration data available at www.CIVD.de Source: Statistical Surveys (www.statisticalsurveys.com) Country Caravans Motorcaravans Total YTD March 31, % YTD March 31, % YTD March 31, % 2020 2019 Change 2020 2019 Change 2020 2019 Change Germany 6,123 6,079 0.7 % 15,383 12,162 26.5 % 21,506 18,241 17.9 % U.K. 3,961 5,432 (27.1) % 2,448 3,812 (35.8) % 6,409 9,244 (30.7) % France 1,588 1,931 (17.8) % 4,516 5,564 (18.8) % 6,104 7,495 (18.6) % Spain 448 603 (25.7) % 1,410 1,478 (4.6) % 1,858 2,081 (10.7) % Netherlands 1,623 1,612 0.7 % 537 444 20.9 % 2,160 2,056 5.1 % Italy 99 166 (40.4) % 1,112 1,795 (38.1) % 1,211 1,961 (38.2) % Belgium 273 335 (18.5) % 1,171 1,436 (18.5) % 1,444 1,771 (18.5) % Switzerland 312 330 (5.5) % 1,538 1,285 19.7 % 1,850 1,615 14.6 % Sweden 516 389 32.6 % 385 450 (14.4) % 901 839 7.4 % All Others 1,830 1,824 0.3 % 1,841 1,904 (3.3) % 3,671 3,728 (1.5) % Total 16,773 18,701 (10.3) % 30,341 30,330 — % 47,114 49,031 (3.9) % European Industry Unit Registrations by Country (1) The Company monitors retail trends in the European RV market as reported by the European Caravan Federation, whose industry data is reported to the public quarterly, typically issued on a one-to-two month lag, continually updated and often impacted by delays in reporting by various countries Industry wholesale shipment data for the European RV market is not available First-Quarter Registrations Comparison of New Vehicle Registrations by Continent (Units 000's) (1) (2)

INVESTOR RELATIONS CONTACT: Mark Trinske Vice President of Investor Relations mtrinske@thorindustries.com (574) 970-7912
