Attached files
| file | filename |
|---|---|
| 8-K - FORM 8-K - O-I Glass, Inc. /DE/ | tm2022060-1_8k.htm |
| EX-99.1 - EXHIBIT 99.1 - O-I Glass, Inc. /DE/ | tm2022060d1_ex99-1.htm |
Exhibit 99.2
INVESTOR PRESENTATION JUNE 8, 2020 UPDATE

2 SAFE HARBOR COMMENTS Forward - Looking Statements This presentation contains “forward - looking” statements related to O - I Glass, Inc. (“O - I Glass” or the “company”) within the me aning of Section 21E of the Securities Exchange Act of 1934, as amended (the “Exchange Act”) and Section 27A of the Securities Act of 1933. Forward - looking statements reflect the company’s current expectat ions and projections about future events at the time, and thus involve uncertainty and risk. The words “believe,” “expect,” “anticipate,” “will,” “could,” “would,” “should,” “may,” “plan,” “estima te, ” “intend,” “predict,” “potential,” “continue,” and the negatives of these words and other similar expressions generally identify forward - looking statements. It is possible that the company’s future financial performance may differ from expectations due to a variety of factors inclu din g, but not limited to the following: (1) the company’s ability to obtain the benefits it anticipates from the Corporate Modernization, (2) risks inherent in, and potentially adverse developments related to, the Cha pte r 11 bankruptcy proceeding involving the company’s wholly owned subsidiary Paddock Enterprises, LLC (“Paddock”), that could adversely affect the company and the company’s liquidity or results of opera tio ns, including the impact of deconsolidating Paddock from the company’s financials, risks from asbestos - related claimant representatives asserting claims against the company and potential for litigati on and payment demands against us by such representatives and other third parties, (3) the amount that will be necessary to fully and finally resolve all of Paddock’s asbestos - related claims and the com pany’s obligations to make payments to resolve such claims under the terms of its support agreement with Paddock, (4) the company’s ability to manage its cost structure, including its success in implementing re structuring or other plans aimed at improving the company’s operating efficiency and working capital management, achieving cost savings, and remaining well - positioned to address the company’s legacy liabilities, (5) the company’s ability to acquire or divest businesses, acquire and expand plants, integrate operations of acquired businesses and achieve expected benefits from acquisitions, divestitures or expansions, (6) the company’s ability to achieve its strategic plan, (7) foreign currency fluctuations relative to the U.S. dollar, (8) changes in capital availability or cost, including interest rate fluct uat ions and the ability of the company to refinance debt at favorable terms, (9) the general political, economic and competitive conditions in markets and countries where the company has operations, including uncertain tie s related to Brexit, economic and social conditions, disruptions in the supply chain, competitive pricing pressures, inflation or deflation, changes in tax rates and laws, natural disasters and weather, ( 10) the impact of COVID - 19 and the various governmental, industry and consumer actions related thereto, (11) the company’s ability to generate sufficient future cash flows to ensure the company’s goodwill is not impaired, (12) consumer preferences for alternative forms of packaging, (13) cost and availability of raw materials, labor, energy and transportation, (14) consolidation among competitors and customers, (1 5) unanticipated expenditures with respect to data privacy, environmental, safety and health laws, (16) unanticipated operational disruptions, including higher capital spending, (17) the company’s ability to fu rther develop its sales, marketing and product development capabilities, (18) the failure of the company’s joint venture partners to meet their obligations or commit additional capital to the joint venture, (19 ) the ability of the company and the third parties on which it relies for information technology system support to prevent and detect security breaches related to cybersecurity and data privacy, (20) changes in U.S . trade policies, and the other risk factors discussed in the company’s Annual Report on Form 10 - K for the year ended December 31, 2019 and any subsequently filed Annual Report on Form 10 - K, Quarterly Report s on Form 10 - Q or the company’s other filings with the Securities and Exchange Commission. It is not possible to foresee or identify all such factors. Any forward - looking statements in this documen t are based on certain assumptions and analyses made by the company in light of its experience and perception of historical trends, current conditions, expected future developments, and other factors it be lieves are appropriate in the circumstances. Forward - looking statements are not a guarantee of future performance and actual results or developments may differ materially from expectations. While the compan y c ontinually reviews trends and uncertainties affecting the company’s results or operations and financial condition, the company does not assume any obligation to update or supplement any particular forward - lo oking statements contained in this document. The Company routinely posts important information on its website – www.o - i.com/investors.

3 FOUNDED IN 1903 As Owens Bottle Company OPERATING IN 3 REGIONS: Americas, Europe and Asia - Pacific $6.7 BILLION in net sales in 2019 6000+ direct customers O - I AT A GLANCE MAGMA revolutionize glass making 78 factories 23 countries LEADING GLOBAL glass container supplier 71% OF NET SALES from non - US operations GLASS IS THE MOST sustainable packaging option 2019 PRODUCT PORTFOLIO: 35% beer, 21% wine, 16% food, 14% NAB, 12% spirits

STRONG MARKET POSITION STABLE, BALANCED FOOD AND BEVERAGE PORTFOLIO * NOTE: 2019 volume data in tonnes , does not include non - consolidated O - I JV’s AMERICAS 55% Total O - I Sales EUROPE 36% Total O - I Sales ASIA PACIFIC 9% Total O - I Sales Globally, approximately 20 - 25% of products packaged in glass are consumed on - premise , while 75 - 80% are used at home ( Euromonitor , O - I est.) 42% 17% 17% 8% 13% 3% 26% 14% 10% 35% 13% 2% 43% 13% 13% 25% 1% 5% ■ Beer ■ Food ■ NAB ■ Wine ■ Spirits ■ Other 4

1 3 2 EXECUTING O - I GLASS INVESTMENT THESIS BOLD STRUCTURAL ACTIONS TO CHANGE O - I’S BUSINESS FUNDAMENTALS 5 OPTIMIZE STRUCTURE REBALANCE BUSINESS PORTFOLIO AND IMPROVE BALANCE SHEET REVOLUTIONIZE GLASS CREATE A NEW BUSINESS MODEL FOR GLASS PACKAGING TURNAROUND INITIATIVES STRONG OPERATING PERFORMANCE AND COST EFFICIENCIES

6 TURNAROUND INITIATIVES DRIVE STRONG OPERATING PERFORMANCE AND COST EFFICIENCIES TURNAROUND INITIATIVES EXCEEDING MANAGEMENT EXPECTATIONS PROVIDING CONFIDENCE IN ABILITY TO EXECUTE • Top priority • Protective measures aligned with recommendations of WHO, CDC, local authorities Health and Safety • Factory Performance: Excellent progress with ~ $14M 1Q20 benefit at focus plants • Cost Transformation: Augmenting and accelerating to mitigate Covid - 19 • Revenue and Mix Optimization: Primarily focused on mix Turnaround Initiatives • Quickly aligning supply with shifting demand • Optimizing network to mitigate cost impact of downtime • Protecting assets while managing period of volatility Discipline and Agility

REVOLUTIONIZING GLASS A NEW BUSINESS MODEL FOR GLASS PACKAGING MAGMA Development (2019 – 2022+) Generation 1 Generation 2 Generation 3 MAGMA Melter Modular end - to - end system ( melter , forming, etc ) Optimized modular end - to - end system (automation, digitization, etc ) Limited Locations Expanded Number of Locations Anywhere 7 Generation 3 In a world where SUSTAINABILITY is more important than ever, we are proud to make an inherently sustainable product ● Made from natural, readily available raw materials ● 100 percent endlessly recyclable into new food - safe glass packaging ● Reusable over and over again ● Does not impact the product’s taste or integrity ● Only food contact material ‘Generally Recognized as Safe’ by U.S. Food and Drug Administration MAGMA reinvents how glass is made, creating a new and more profitable future business model for glass ● New capacity at lower capital commitment and intensity ● Total cost of ownership below legacy ● Increased scalability ● Rapid new capacity deployment and asset portability ● Competitively enter new markets at lower risk ● Production flexibility to support diversified offerings ● Superior sustainability profile ● Securing customer commitments for future deployment
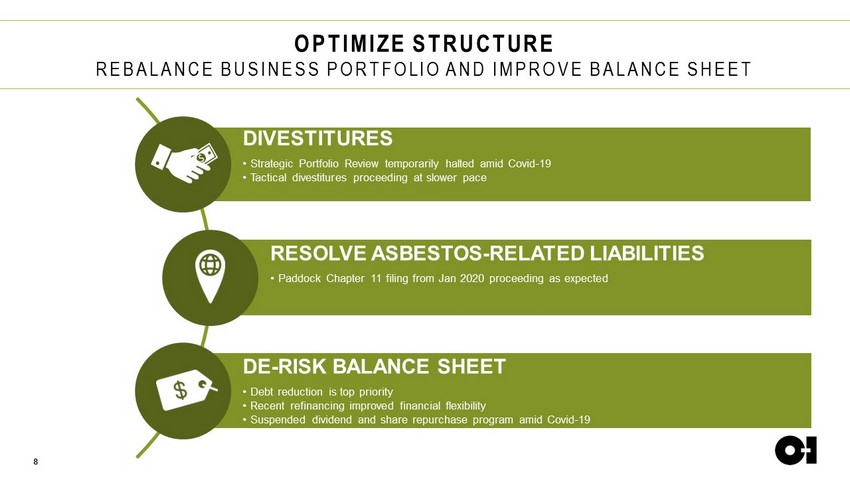
8 OPTIMIZE STRUCTURE REBALANCE BUSINESS PORTFOLIO AND IMPROVE BALANCE SHEET DIVESTITURES • Strategic Portfolio Review temporarily halted amid Covid - 19 • Tactical divestitures proceeding at slower pace RESOLVE ASBESTOS - RELATED LIABILITIES • Paddock Chapter 11 filing from Jan 2020 proceeding as expected DE - RISK BALANCE SHEET • Debt reduction is top priority • Recent refinancing improved financial flexibility • Suspended dividend and share repurchase program amid Covid - 19

2Q20 BUSINESS UPDATE SUCCESSFULLY ADAPTING TO COVID - 19 WITH SPEED AND AGILITY 9 Shipments gradually improving as markets begin to reopen ● Daily shipments down ~ 18% QTD through May (Mexico/Andean down ~ 35%) ◉ Trends improved starting mid - May in most markets; Mexico/Andean reopening early June ◉ Excluding Mexico/Andean, O - I daily shipments down ~ 13% since mid - May ● Continue to expect FY2020 volumes down 5 - 10% (+/ - given fluid situation) Prudently matching supply with lower demand ● Managing downtime to reduce impact of cost absorption from curtailment ● Shifting curtailment from primarily line closures to more furnace/plant downtime ◉ Cash cost absorption sensitivity: ~ 50% @ lines, ~ 20 - 30% @ furnaces, <10% @ plants Successful actions to aggressively managing costs ● Lower CapEx spending ● Accelerating SG&A reduction: reduction in force, salary reduction/deferrals Segment results modestly profitable QTD through May ● Despite incurring the brunt of the pandemic Continued strong liquidity and cash flow comparable with PY ● Lower CapEx and suspended asbestos related payments Preserve Strong Liquidity ● Maintain liquidity > $1.25B each quarter of 2020 Maximize Free Cash Flow ● Balance supply with demand – IDS below FYE19 ● CapEx spend < $300M in 2020 ● Significantly reduce operating costs Manage FYE20 Net Debt At/Below FYE19 (~$5B) ● No significant bond maturities until 2023 2020 Guiding Principles

1 2 10 FOCUSED ON NAVIGATING COVID - 19 AND CREATING LONG TERM VALUE NAVIGATE COVID - 19 ► FOCUS ON LIQUIDITY, FCF AND DEBT REDUCTION ► ALIGN SUPPLY WITH DEMAND AND REDUCE WORKING CAPITAL ► AGGRESSIVELY MANAGE COSTS: CAPEX AND SG&A ► SUSPEND DIVIDEND AND PAUSE SHARE REPURCHASES CREATE LONG - TERM VALUE ► TURNAROUND INITIATIVES ► REVOLUTIONIZE GLASS ► OPTIMIZE STRUCTURE

FINANCIAL APPENDIX

12 NON - GAAP FINANCIAL MEASURES The company uses certain non - GAAP financial measures, which are measures of its historical or future financial performance that are not calculated and presented in accordance with GAAP, within the meaning of applicable SEC rules. Management believes that its presentation and use of certain non - GAAP financi al measures, including adjusted free cash flow, provide relevant and useful supplemental financial information, which is widely used by analysts and investors, as well as by managem ent in assessing both consolidated and business unit performance. These non - GAAP measures are reconciled to the most directly comparable GAAP measures and should be considered supp lemental in nature and should not be considered in isolation or be construed as being more important than comparable GAAP measures. Free cash flow relates to cash provided by continuing operating activities less additions to property, plant and equipment. Adj usted free cash flow relates to cash provided by continuing operating activities less additions to property, plant and equipment plus asbestos - related payments. Management has historicall y used adjusted free cash flow to evaluate its period - over - period cash generation performance because it believes this has provided a useful supplemental measure related to its princip al business activity. Free cash flow and adjusted free cash flow may be useful to investors to assist in understanding the comparability of cash flows generated by the company’s princip al business activity. It should not be inferred that the entire adjusted free cash flow amount is available for discretionary expenditures, since the company has mandatory debt service requ ire ments and other non - discretionary expenditures that are not deducted from the measure. Management uses non - GAAP information principally for internal reporting, forecasting, budgeting and calculating compensation payments. The Company routinely posts important information on its website at www.o - i.com/investors.

13 RECONCILIATION FOR NET DEBT
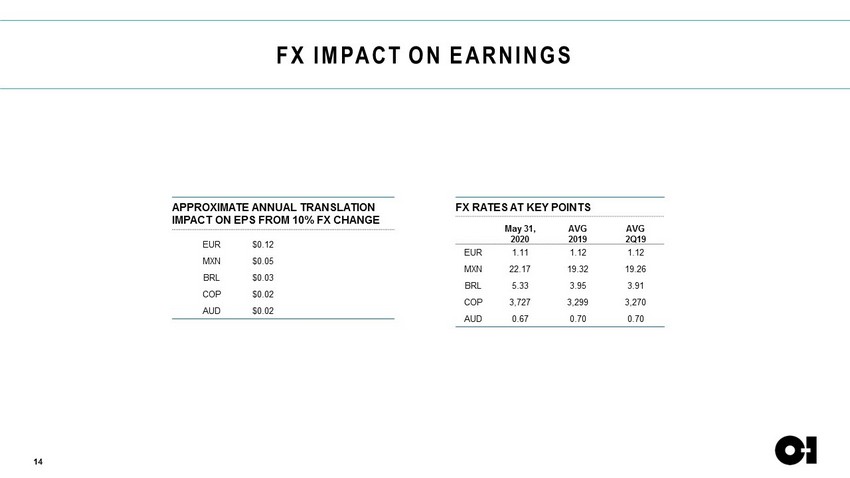
14 FX IMPACT ON EARNINGS APPROXIMATE ANNUAL TRANSLATION IMPACT ON EPS FROM 10% FX CHANGE EUR $0.12 MXN $0.05 BRL $0.03 COP $0.02 AUD $0.02 FX RATES AT KEY POINTS May 31, 2020 AVG 2019 AVG 2Q19 EUR 1.11 1.12 1.12 MXN 22.17 19.32 19.26 BRL 5.33 3.95 3.91 COP 3,727 3,299 3,270 AUD 0.67 0.70 0.70