Attached files
| file | filename |
|---|---|
| 8-K/A - 8-K/A - HarborOne Bancorp, Inc. | tmb-20200507x8ka.htm |
Exhibit 99.1
| Growth Oriented. Community Driven. Trusted and Respected. Investor Presentation May 2020 |
| 2 Forward Looking Statements Certain statements herein constitute forward-looking statements within the meaning of Section 27A of the Securities Act of 1933, as amended, and Section 21E of the Securities Exchange Act of 1934, as amended and are intended to be covered by the safe harbor provisions of the Private Securities Litigation Reform Act of 1995. Such statements may be identified by words such as ”may,” “will,” “should,” “could,” “would,” “plan,” “potential,” “estimate,” “project,” “believe,” “intend,” “anticipate,” “expect,” “target” and similar expressions. These statements are based upon the current assumptions and beliefs of the Company’s management, are expectations of future results, and are subject to significant risks and uncertainties. Actual results may differ materially from those set forth in the forward-looking statements as a result of numerous factors. Factors that could cause such differences to exist include, but are not limited to, the negative impacts and disruptions of the COVID-19 pandemic and measures taken to contain its spread on our employees, customers, business operations, credit quality, financial position, liquidity and results of operations; the length and extent of the economic contraction as a result of the COVID-19 pandemic; continued deterioration in general business and economic conditions on a national basis and in the local markets in which the Company operates; changes in customer behavior due to changing business and economic conditions or legislative or regulatory initiatives leading to changes in demand for loans in our market area; continued turbulence in the capital and debt markets; changes in interest rates; increases in loan default and charge-off rates; decreases in the value of securities and other assets; decreases in deposit levels necessitating increased borrowing to fund loans and investments; competitive pressures from other financial institutions; operational risks including, but not limited to, cybersecurity incidents, fraud, natural disasters and future pandemics; changes in regulation; reputational risk relating to the Company’s participation in the Paycheck Protection Program and other pandemic-related legislative and regulatory initiatives and programs; changes in accounting standards and practices; the risk that goodwill and intangibles recorded in the Company’s financial statements will become impaired; risks related to the implementation of acquisitions, dispositions, and restructurings, including the risk that acquisitions may not produce results at levels or within time frames originally anticipated; the risk that the Company may not be successful in the implementation of our business strategy; changes in assumptions used in making such forward-looking statements; and the other risks and uncertainties detailed in the Company’s Annual Report on Form 10-K and Quarterly Reports on Form 10-Q as filed with the Securities and Exchange Commission (the “SEC”), which are available at the SEC’s website, www.sec.gov. Should one or more of these risks materialize or should underlying beliefs or assumptions prove incorrect, HarborOne Bancorp, Inc.’s actual results could differ materially from those discussed. Forward-looking statements speak only as of the date on which they are made. The Company does not undertake any obligation to update any forward-looking statement to reflect circumstances or events that occur after the date the forward-looking statements are made. |
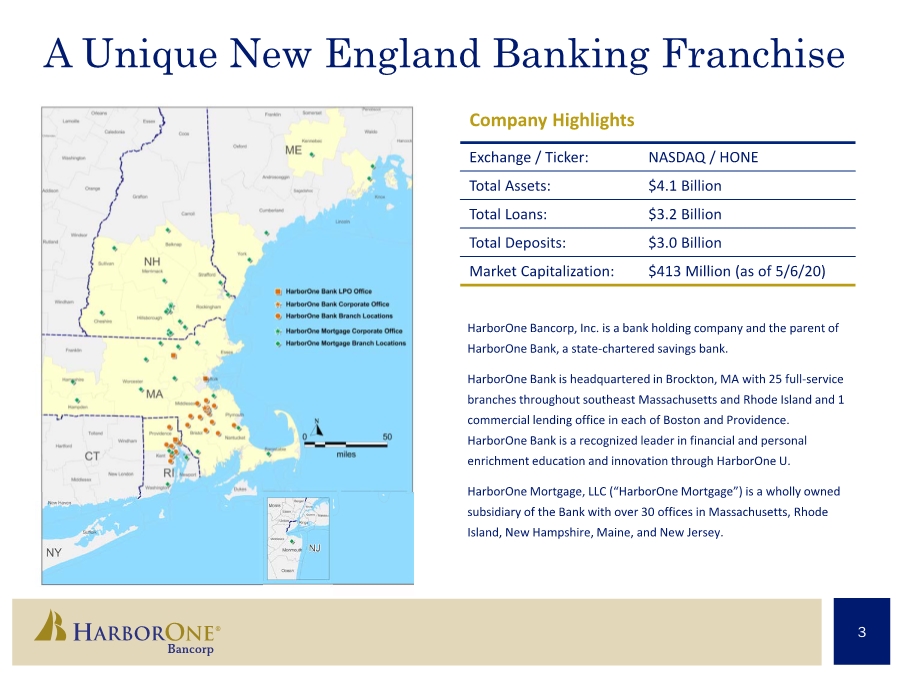
| 3 Exchange / Ticker: NASDAQ / HONE Total Assets: $4.1 Billion Total Loans: $3.2 Billion Total Deposits: $3.0 Billion Market Capitalization: $413 Million (as of 5/6/20) Company Highlights HarborOne Bancorp, Inc. is a bank holding company and the parent of HarborOne Bank, a state-chartered savings bank. HarborOne Bank is headquartered in Brockton, MA with 25 full-service branches throughout southeast Massachusetts and Rhode Island and 1 commercial lending office in each of Boston and Providence. HarborOne Bank is a recognized leader in financial and personal enrichment education and innovation through HarborOne U. HarborOne Mortgage, LLC (“HarborOne Mortgage”) is a wholly owned subsidiary of the Bank with over 30 offices in Massachusetts, Rhode Island, New Hampshire, Maine, and New Jersey. A Unique New England Banking Franchise |
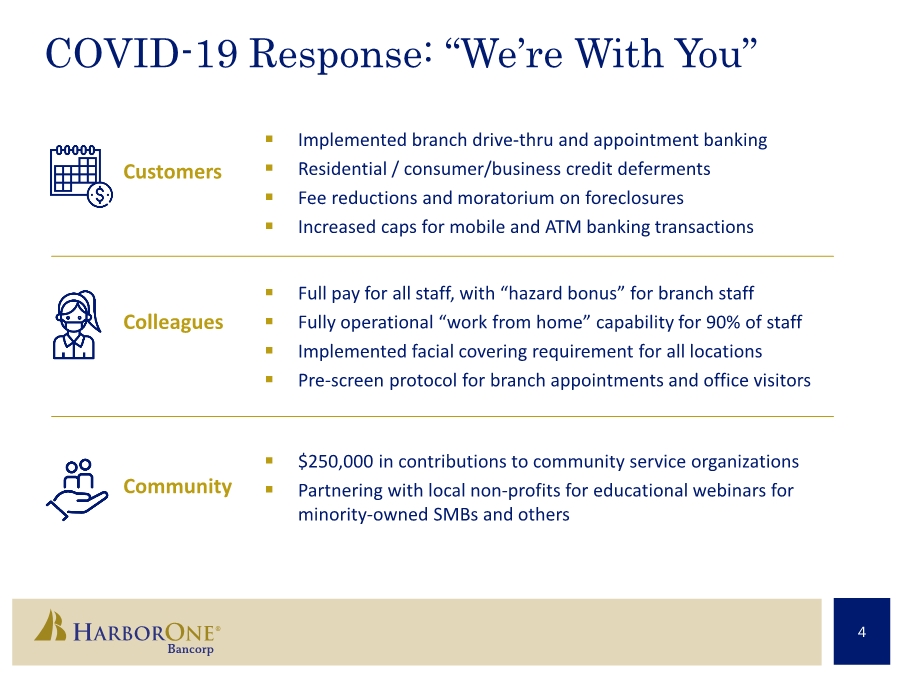
| 4 COVID-19 Response: “We’re With You” Colleagues Community Customers . Implemented branch drive-thru and appointment banking . Residential / consumer/business credit deferments . Fee reductions and moratorium on foreclosures . Increased caps for mobile and ATM banking transactions . Full pay for all staff, with “hazard bonus” for branch staff . Fully operational “work from home” capability for 90% of staff . Implemented facial covering requirement for all locations . Pre-screen protocol for branch appointments and office visitors . $250,000 in contributions to community service organizations . Partnering with local non-profits for educational webinars for minority-owned SMBs and others |
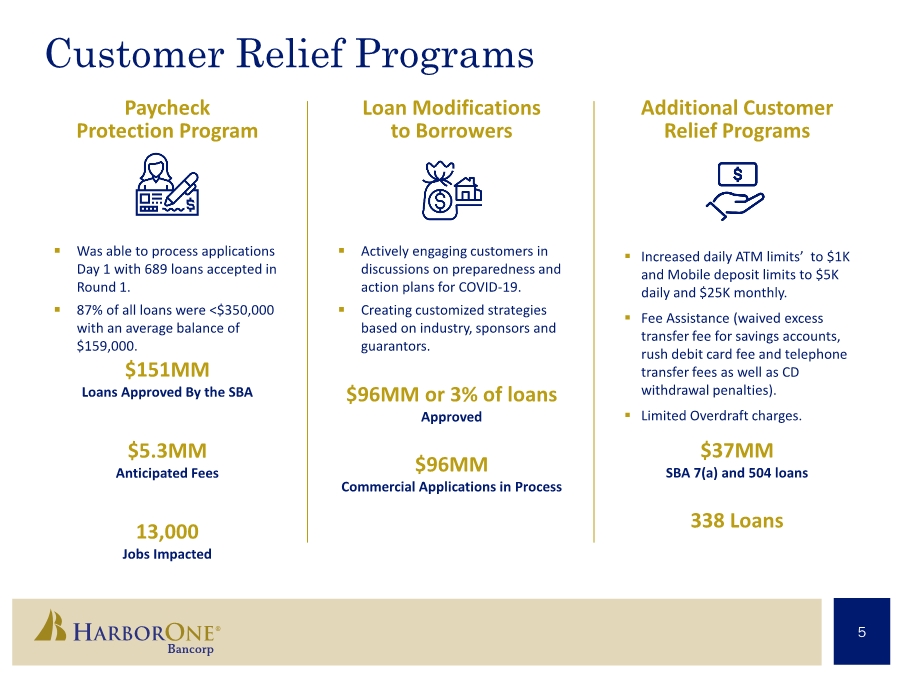
| 5 Customer Relief Programs Paycheck Protection Program . Was able to process applications Day 1 with 689 loans accepted in Round 1. . 87% of all loans were <$350,000 with an average balance of $159,000. $151MM Loans Approved By the SBA $5.3MM Anticipated Fees 13,000 Jobs Impacted Loan Modifications to Borrowers . Actively engaging customers in discussions on preparedness and action plans for COVID-19. . Creating customized strategies based on industry, sponsors and guarantors. Additional Customer Relief Programs . Increased daily ATM limits’ to $1K and Mobile deposit limits to $5K daily and $25K monthly. . Fee Assistance (waived excess transfer fee for savings accounts, rush debit card fee and telephone transfer fees as well as CD withdrawal penalties). . Limited Overdraft charges. $96MM or 3% of loans Approved $96MM Commercial Applications in Process $37MM SBA 7(a) and 504 loans 338 Loans |
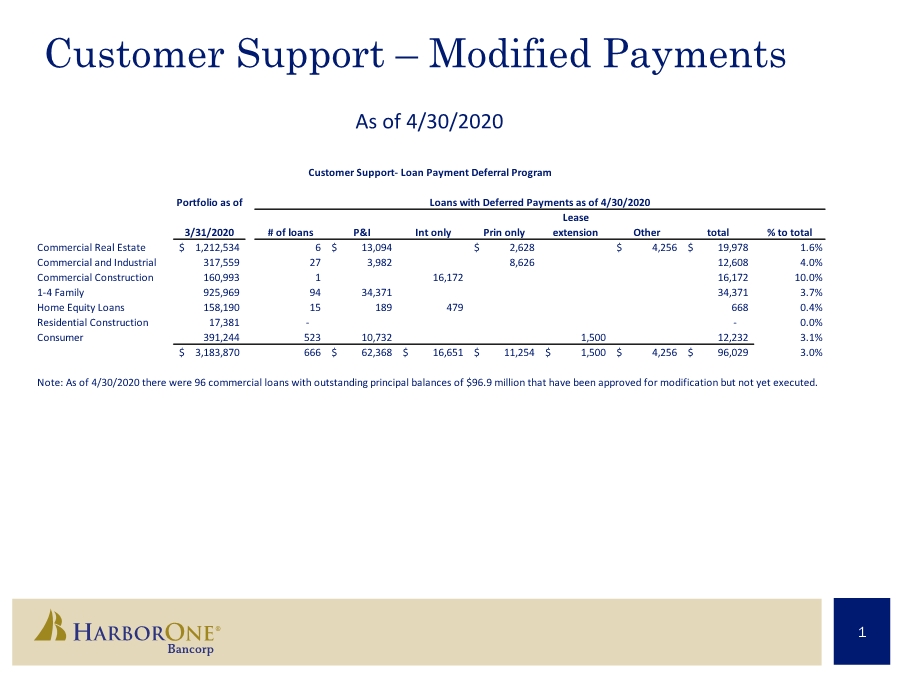
| 1 Customer Support – Modified Payments Portfolio as of 3/31/2020 # of loans P&I Int only Prin only Lease extension Other total % to total Commercial Real Estate 1,212,534 $ 6 13,094 $ 2,628 $ 4,256 $ 19,978 $ 1.6% Commercial and Industrial 317,559 27 3,982 8,626 12,608 4.0% Commercial Construction 160,993 1 16,172 16,172 10.0% 1-4 Family 925,969 94 34,371 34,371 3.7% Home Equity Loans 158,190 15 189 479 668 0.4% Residential Construction 17,381 - - 0.0% Consumer 391,244 523 10,732 1,500 12,232 3.1% 3,183,870 $ 666 62,368 $ 16,651 $ 11,254 $ 1,500 $ 4,256 $ 96,029 $ 3.0% Note: As of 4/30/2020 there were 96 commercial loans with outstanding principal balances of $96.9 million that have been approved for modification but not yet executed. Customer Support- Loan Payment Deferral Program Loans with Deferred Payments as of 4/30/2020 As of 4/30/2020 |
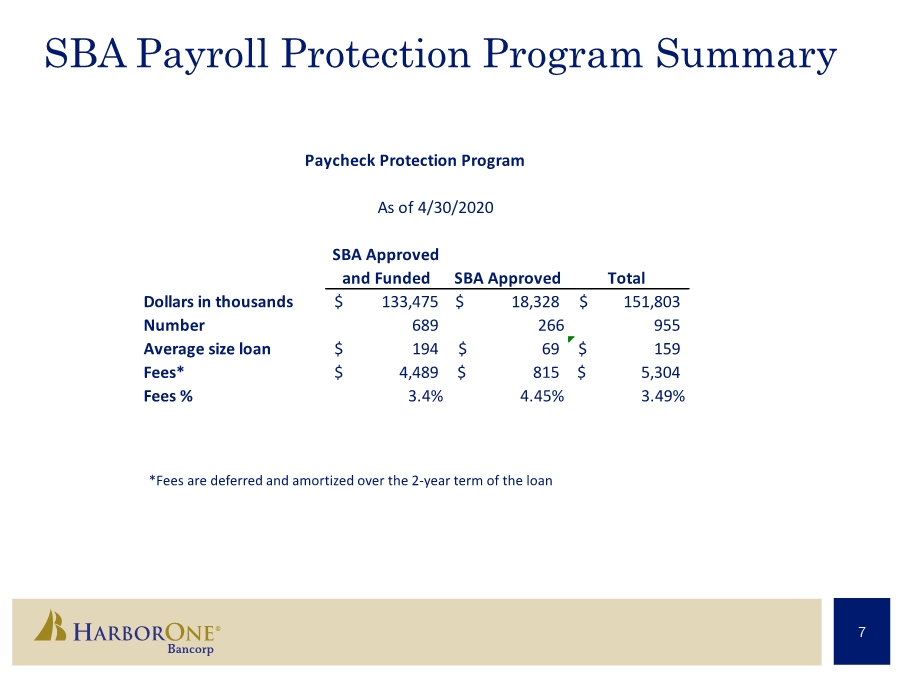
| 7 SBA Payroll Protection Program Summary SBA Approved and Funded SBA Approved Total Dollars in thousands 133,475 $ 18,328 $ 151,803 $ Number 689 266 955 Average size loan 194 $ 69 $ 159 $ Fees* 4,489 $ 815 $ 5,304 $ Fees % 3.4% 4.45% 3.49% As of 4/30/2020 Paycheck Protection Program *Fees are deferred and amortized over the 2-year term of the loan |
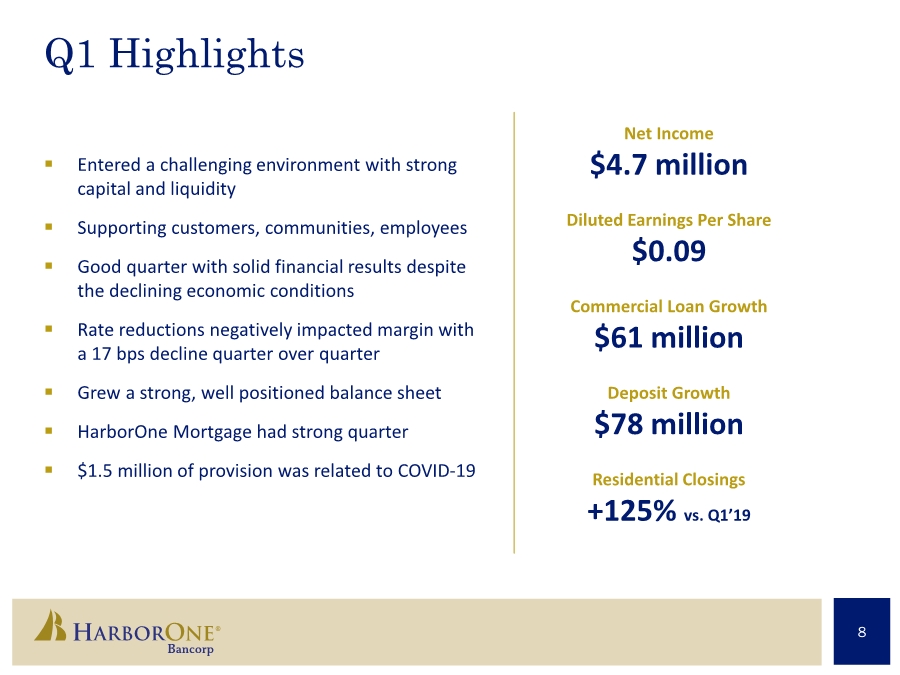
| 8 Q1 Highlights . Entered a challenging environment with strong capital and liquidity . Supporting customers, communities, employees . Good quarter with solid financial results despite the declining economic conditions . Rate reductions negatively impacted margin with a 17 bps decline quarter over quarter . Grew a strong, well positioned balance sheet . HarborOne Mortgage had strong quarter . $1.5 million of provision was related to COVID-19 Net Income $4.7 million Diluted Earnings Per Share $0.09 Commercial Loan Growth $61 million Deposit Growth $78 million Residential Closings +125% vs. Q1’19 |
| 9 Committed to the Fundamentals . Focused on organic growth . Ongoing balance sheet transformation to achieve margin stability . Lower cost deposit drivers with focus on commercial and small business funding sources . We win with our people: investments in training, talent acquisition, and retention . Fee growth platforms via commercial, mortgage, cash management . Seasoned and aligned management team and Board that drive results . Courage to exit legacy lines of business that don’t align with our strategy . Maintain our commitment to being an outstanding community leader - Community is in our DNA, from our Foundation contributions to our Caring Crew volunteer programs . Will only consider M&A with a financially attractive opportunity that ensures minimal TBV dilution |
| 10 Key Priorities Next 12 Months 10 . Transition to the new normal . Concerted approach to digital banking . Disciplined deployment of capital, and using that capital to transition the business faster than anticipated, e.g., technology and process investments . Continuation of profitable commercial loan growth (CRE, C&I, small business) . Driving low-cost funding through the expansion of new markets (de novo branches) and focus on customer relationships and household growth . Grow Boston: commercial, small business, retail, mortgage . Invest in brand-building in the Rhode Island and Boston markets . Extend our successful Rhode Island SBA model into Massachusetts . Expand residential loan offices in Massachusetts and New Jersey . Expand and extend our HarborOne U small business education programming via digital channels |
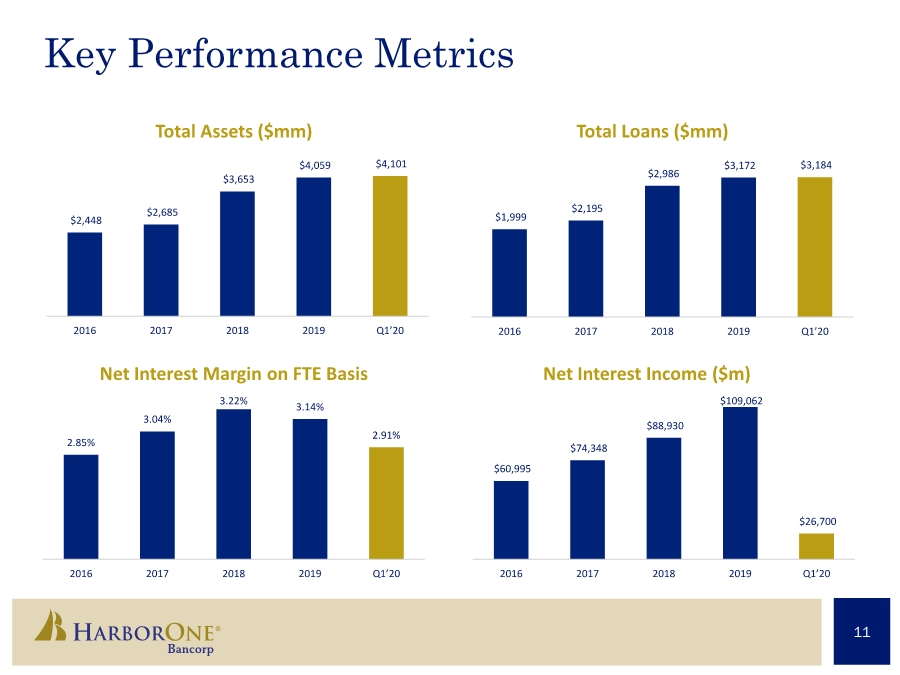
| 11 Key Performance Metrics $2,448 $2,685 $3,653 $4,059 $4,101 2016 2017 2018 2019 Q1’20 $1,999 $2,195 $2,986 $3,172 $3,184 2016 2017 2018 2019 Q1’20 2.85% 3.04% 3.22% 3.14% 2.91% 2016 2017 2018 2019 Q1’20 $60,995 $74,348 $88,930 $109,062 $26,700 2016 2017 2018 2019 Q1’20 Total Loans ($mm) Total Assets ($mm) Net Interest Income ($m) Net Interest Margin on FTE Basis |
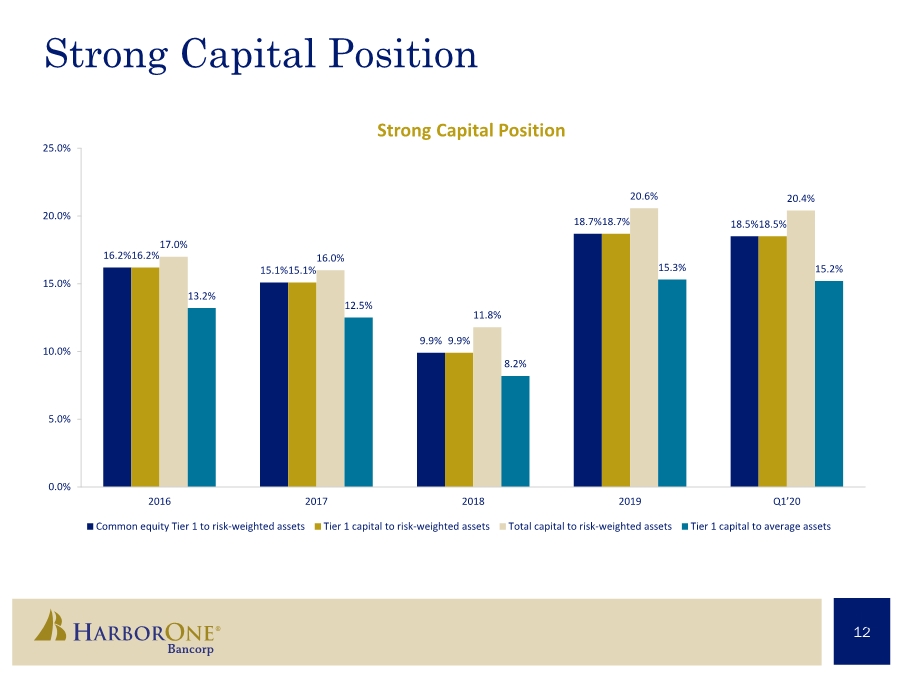
| 12 Strong Capital Position 12 Strong Capital Position 16.2% 15.1% 9.9% 18.7% 18.5% 16.2% 15.1% 9.9% 18.7% 18.5% 17.0% 16.0% 11.8% 20.6% 20.4% 13.2% 12.5% 8.2% 15.3% 15.2% 0.0% 5.0% 10.0% 15.0% 20.0% 25.0% 2016 2017 2018 2019 Q1’20 Common equity Tier 1 to risk-weighted assets Tier 1 capital to risk-weighted assets Total capital to risk-weighted assets Tier 1 capital to average assets |
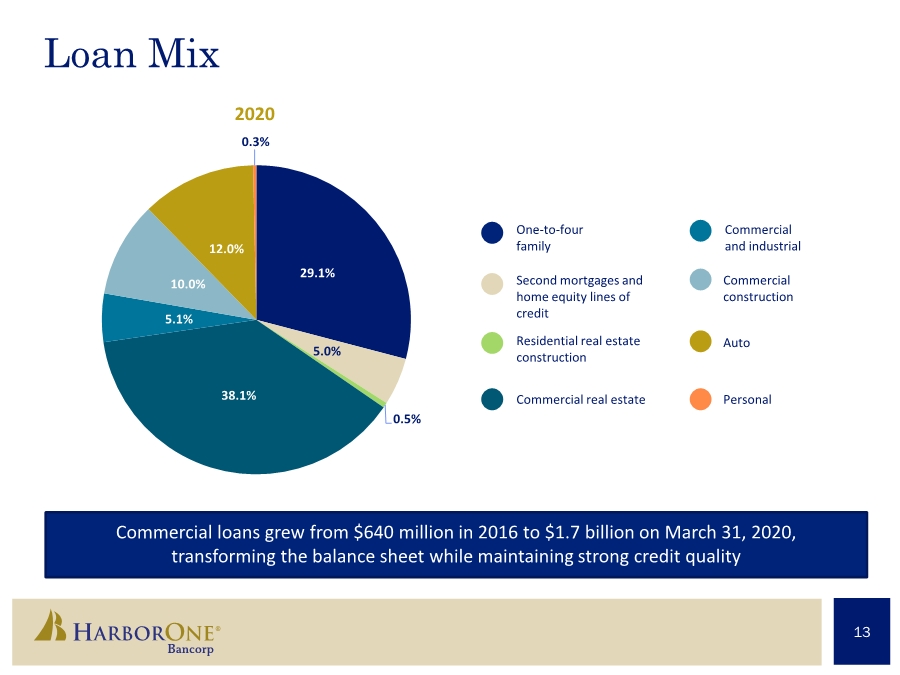
| 13 Loan Mix Commercial loans grew from $640 million in 2016 to $1.7 billion on March 31, 2020, transforming the balance sheet while maintaining strong credit quality 2020 One-to-four family Second mortgages and home equity lines of credit Residential real estate construction Commercial and industrial Commercial construction Auto Commercial real estate Personal 29.1% 5.0% 0.5% 38.1% 5.1% 10.0% 12.0% 0.3% |
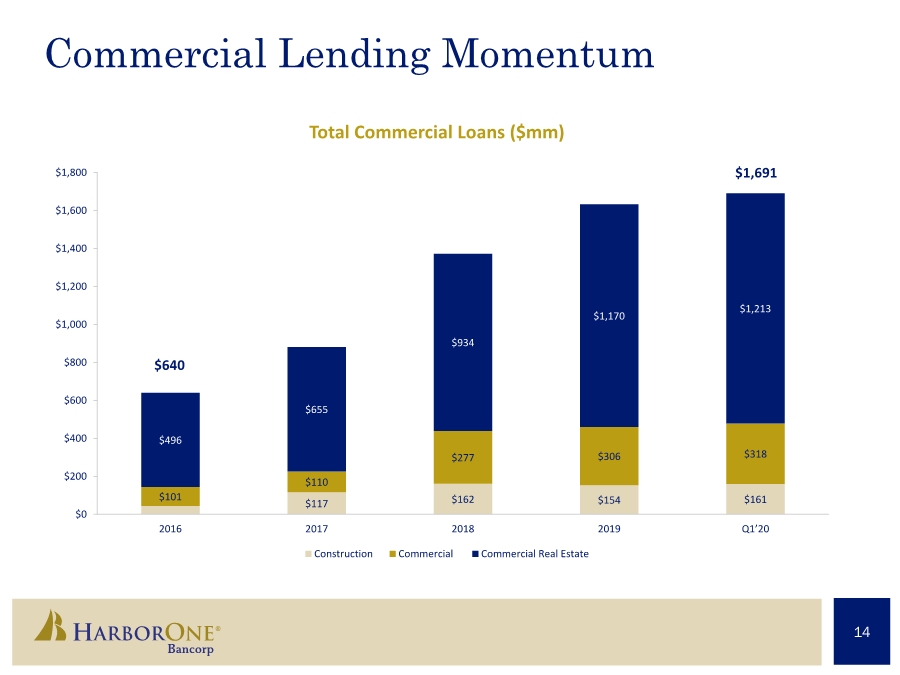
| 14 Commercial Lending Momentum Total Commercial Loans ($mm) $117 $162 $154 $161 $101 $110 $277 $306 $318 $496 $655 $934 $1,170 $1,213 $0 $200 $400 $600 $800 $1,000 $1,200 $1,400 $1,600 $1,800 2016 2017 2018 2019 Q1’20 Construction Commercial Commercial Real Estate $640 $1,691 |
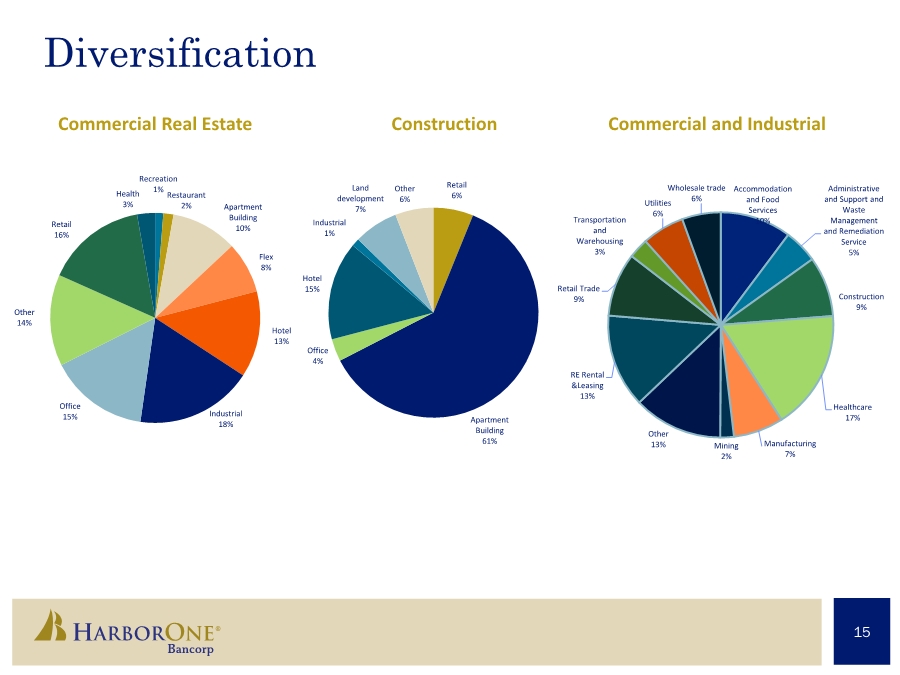
| 15 Diversification Retail 6% Apartment Building 61% Office 4% Hotel 15% Industrial 1% Land development 7% Other 6% Construction Commercial and Industrial Commercial Real Estate Recreation 1% Restaurant 2% Apartment Building 10% Flex 8% Hotel 13% Industrial 18% Office 15% Other 14% Retail 16% Health 3% Accommodation and Food Services 10% Administrative and Support and Waste Management and Remediation Service 5% Construction 9% Healthcare 17% Manufacturing 7% Mining 2% Other 13% RE Rental &Leasing 13% Retail Trade 9% Transportation and Warehousing 3% Utilities 6% Wholesale trade 6% |
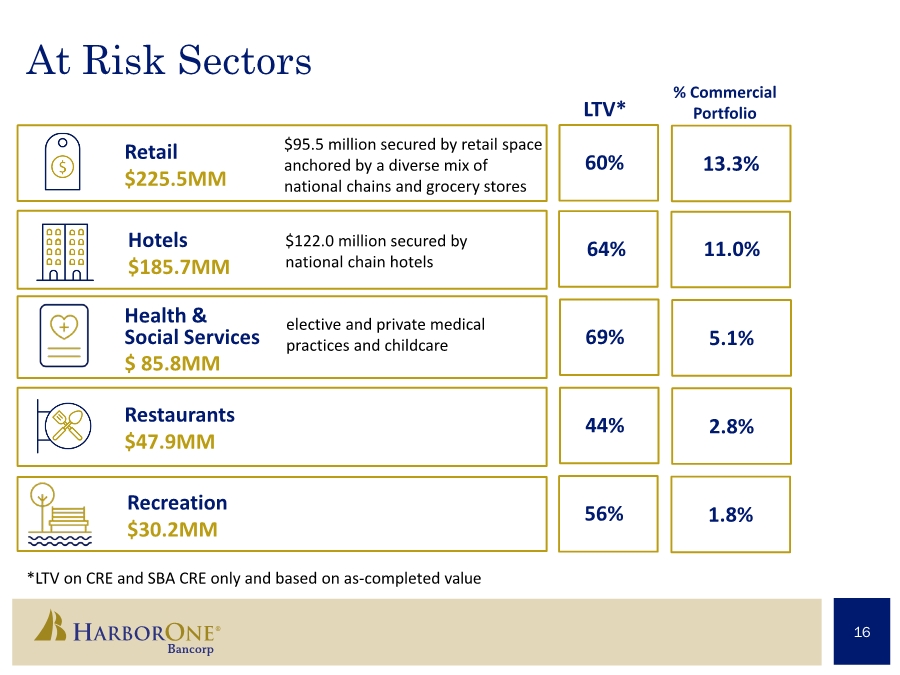
| 16 At Risk Sectors *LTV on CRE and SBA CRE only and based on as-completed value Retail $225.5MM $95.5 million secured by retail space anchored by a diverse mix of national chains and grocery stores Hotels $185.7MM $122.0 million secured by national chain hotels Health & Social Services $ 85.8MM elective and private medical practices and childcare Restaurants $47.9MM Recreation $30.2MM LTV* % Commercial Portfolio 60% 13.3% 64% 11.0% 56% 1.8% 69% 5.1% 44% 2.8% |
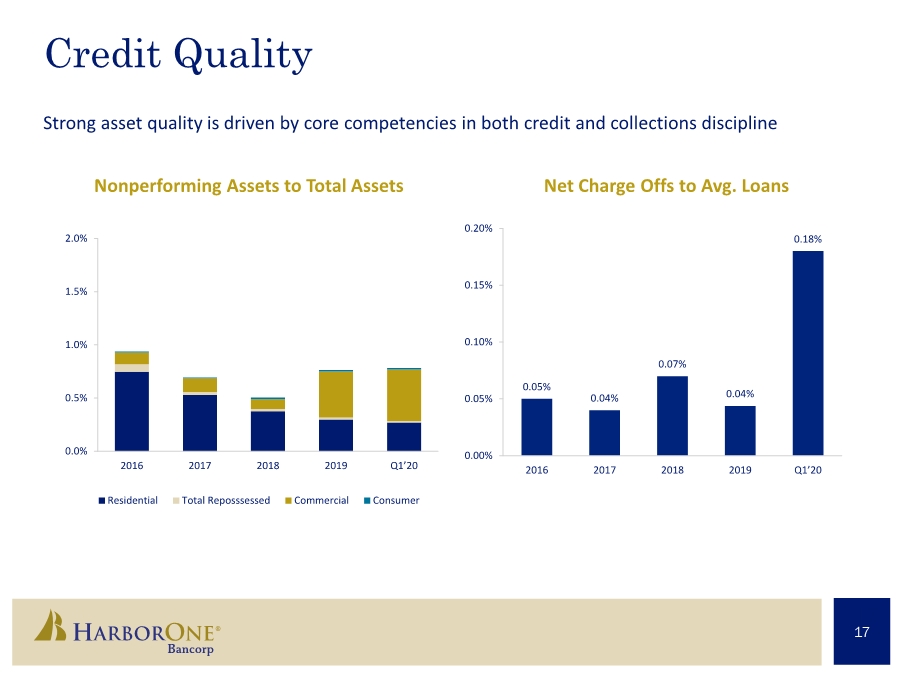
| 17 Credit Quality 17 Nonperforming Assets to Total Assets Net Charge Offs to Avg. Loans Strong asset quality is driven by core competencies in both credit and collections discipline 0.0% 0.5% 1.0% 1.5% 2.0% 2016 2017 2018 2019 Q1’20 Residential Total Reposssessed Commercial Consumer 0.05% 0.04% 0.07% 0.04% 0.18% 0.00% 0.05% 0.10% 0.15% 0.20% 2016 2017 2018 2019 Q1’20 |
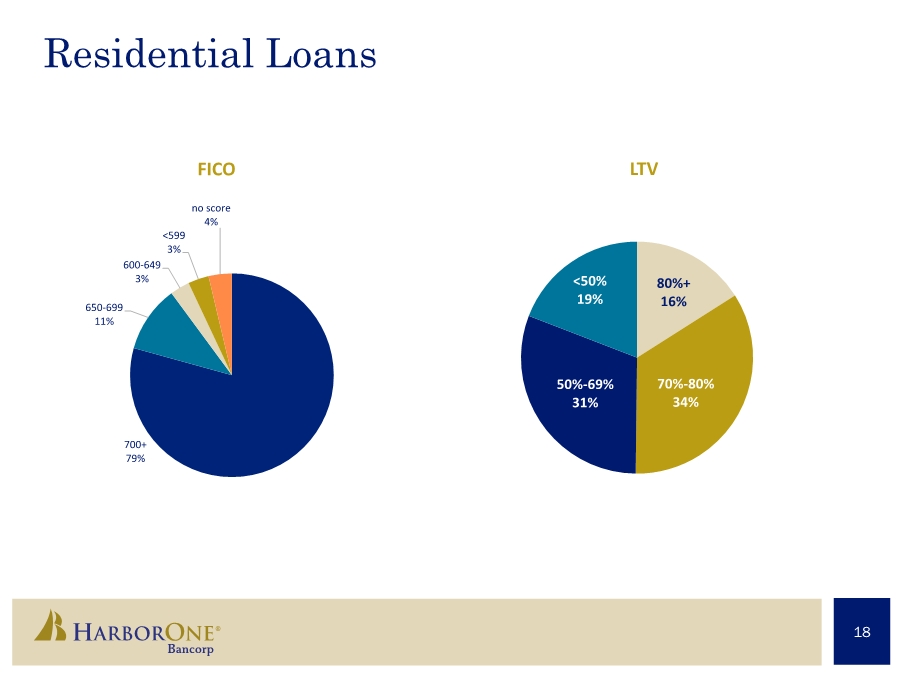
| 18 Residential Loans 700+ 79% 650-699 11% 600-649 3% <599 3% no score 4% FICO LTV 80%+ 16% 70%-80% 34% 50%-69% 31% <50% 19% |
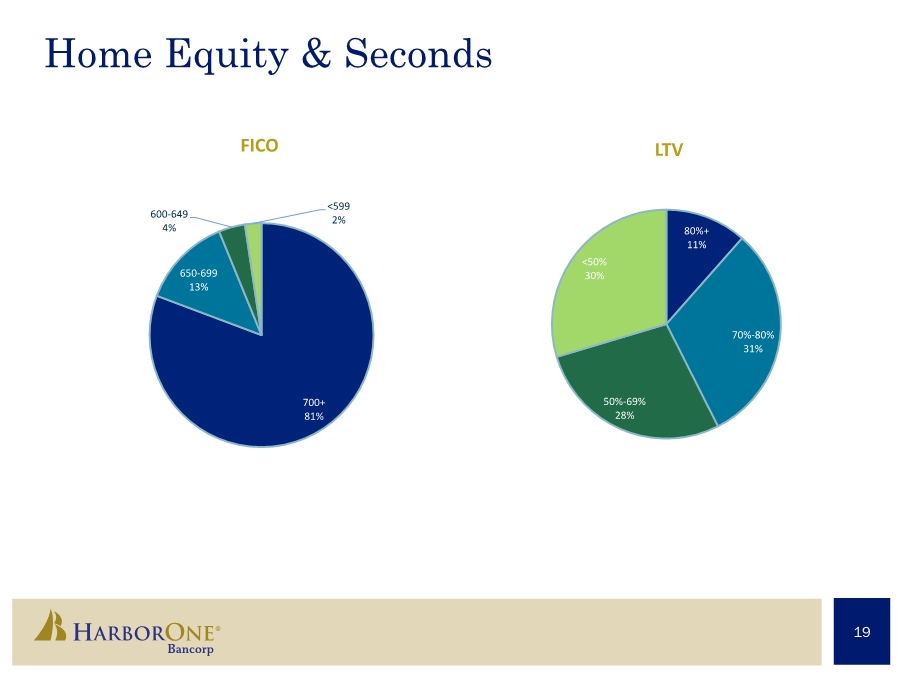
| 19 Home Equity & Seconds 700+ 81% 650-699 13% 600-649 4% <599 2% FICO 80%+ 11% 70%-80% 31% 50%-69% 28% <50% 30% LTV |
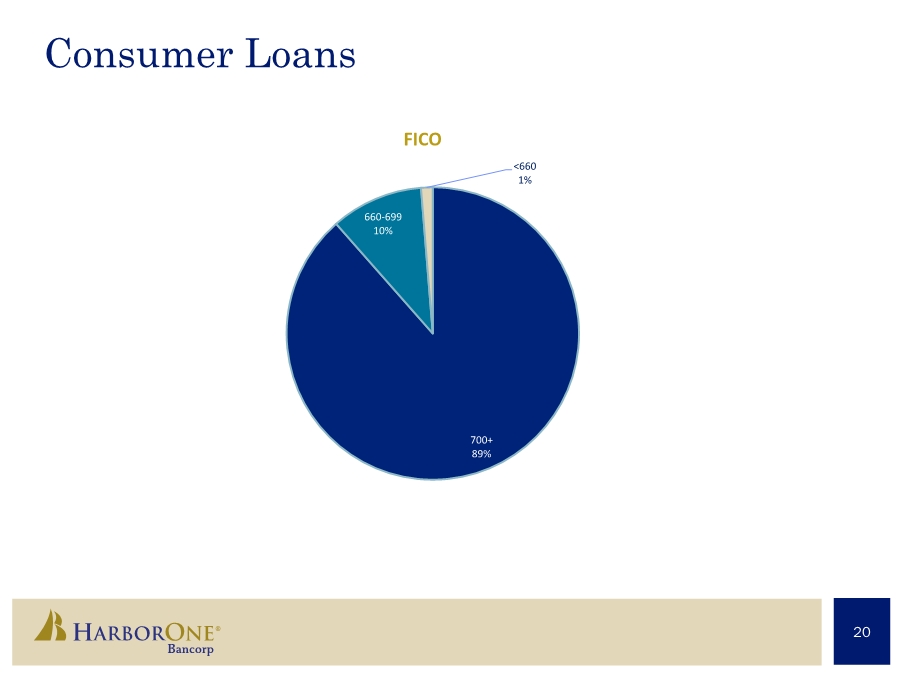
| 20 Consumer Loans 700+ 89% 660-699 10% <660 1% FICO |
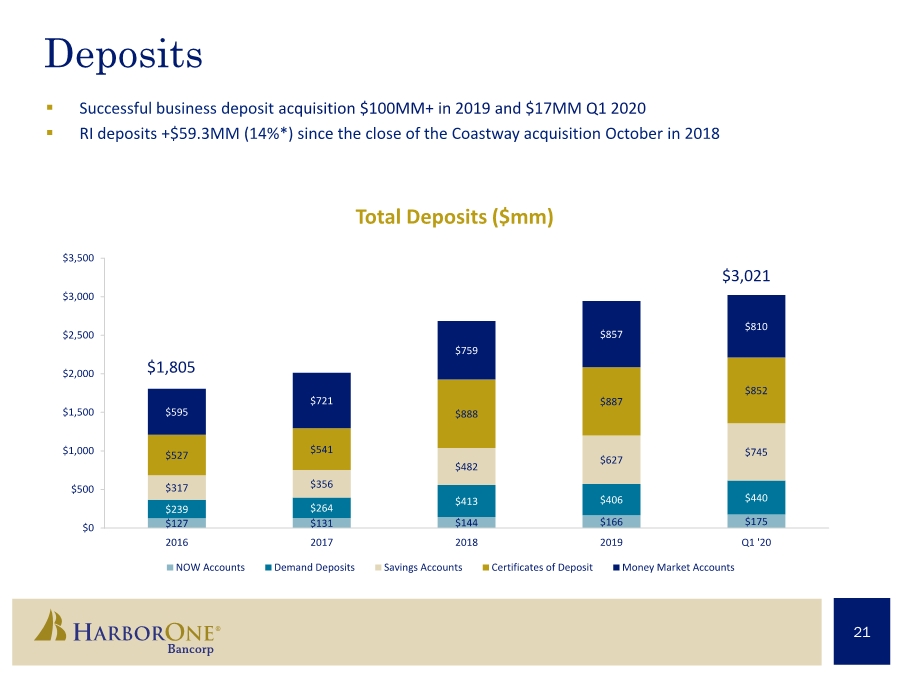
| 21 Deposits . Successful business deposit acquisition $100MM+ in 2019 and $17MM Q1 2020 . RI deposits +$59.3MM (14%*) since the close of the Coastway acquisition October in 2018 Total Deposits ($mm) $1,805 $3,021 $127 $131 $144 $166 $175 $239 $264 $413 $406 $440 $317 $356 $482 $627 $745 $527 $541 $888 $887 $852 $595 $721 $759 $857 $810 $0 $500 $1,000 $1,500 $2,000 $2,500 $3,000 $3,500 2016 2017 2018 2019 Q1 '20 NOW Accounts Demand Deposits Savings Accounts Certificates of Deposit Money Market Accounts |
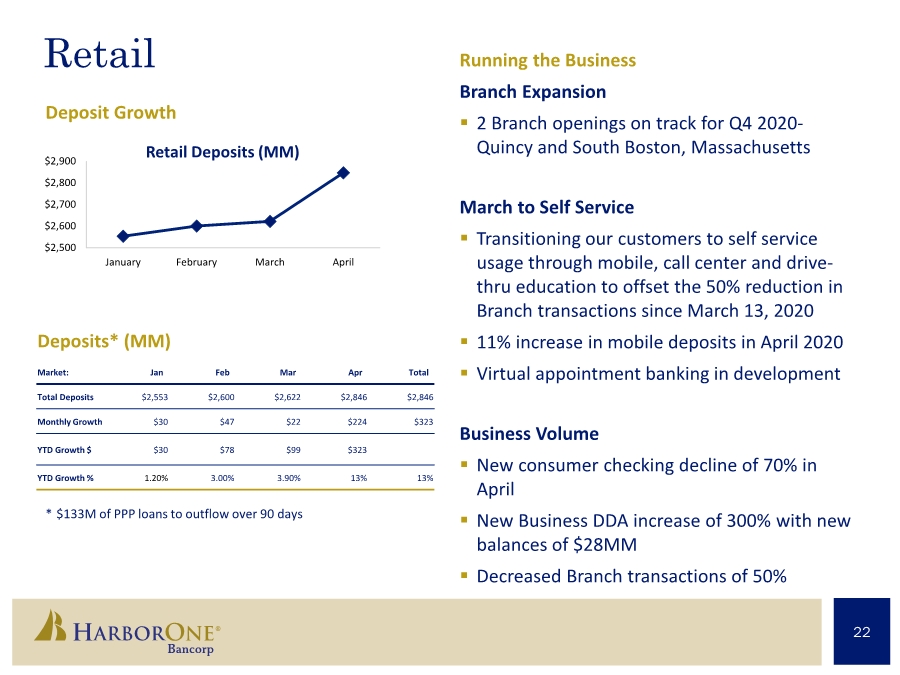
| 22 Retail Deposit Growth Running the Business Branch Expansion . 2 Branch openings on track for Q4 2020- Quincy and South Boston, Massachusetts March to Self Service . Transitioning our customers to self service usage through mobile, call center and drive- thru education to offset the 50% reduction in Branch transactions since March 13, 2020 . 11% increase in mobile deposits in April 2020 . Virtual appointment banking in development Business Volume . New consumer checking decline of 70% in April . New Business DDA increase of 300% with new balances of $28MM . Decreased Branch transactions of 50% $2,500 $2,600 $2,700 $2,800 $2,900 January February March April * $133M of PPP loans to outflow over 90 days Market: Jan Feb Mar Apr Total Total Deposits $2,553 $2,600 $2,622 $2,846 $2,846 Monthly Growth $30 $47 $22 $224 $323 YTD Growth $ $30 $78 $99 $323 YTD Growth % 1.20% 3.00% 3.90% 13% 13% Deposits* (MM) Retail Deposits (MM) |
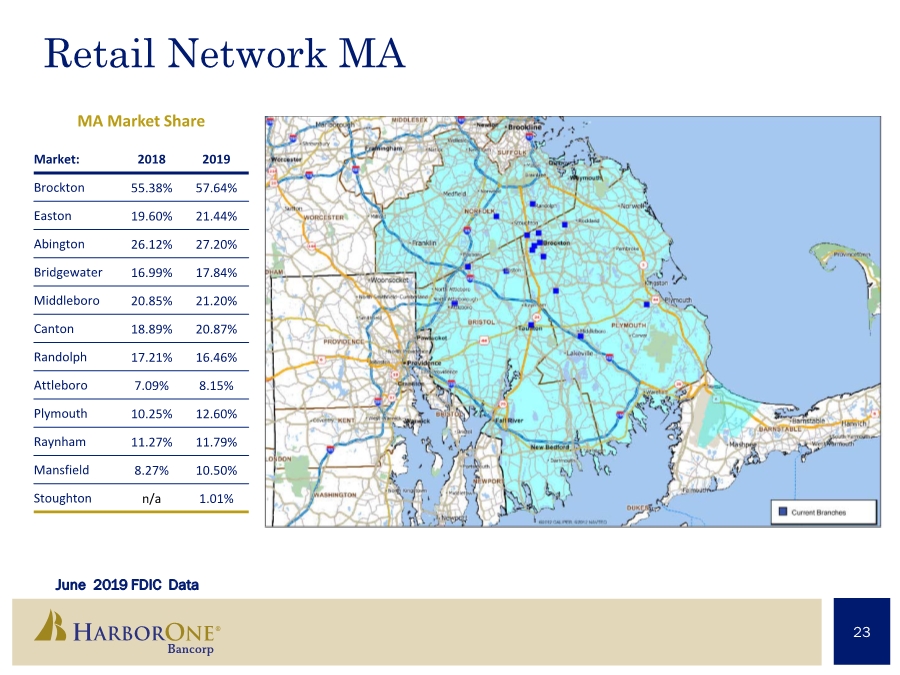
| 23 Retail Network MA June 2019 FDIC Data Market: 2018 2019 Brockton 55.38% 57.64% Easton 19.60% 21.44% Abington 26.12% 27.20% Bridgewater 16.99% 17.84% Middleboro 20.85% 21.20% Canton 18.89% 20.87% Randolph 17.21% 16.46% Attleboro 7.09% 8.15% Plymouth 10.25% 12.60% Raynham 11.27% 11.79% Mansfield 8.27% 10.50% Stoughton n/a 1.01% MA Market Share |
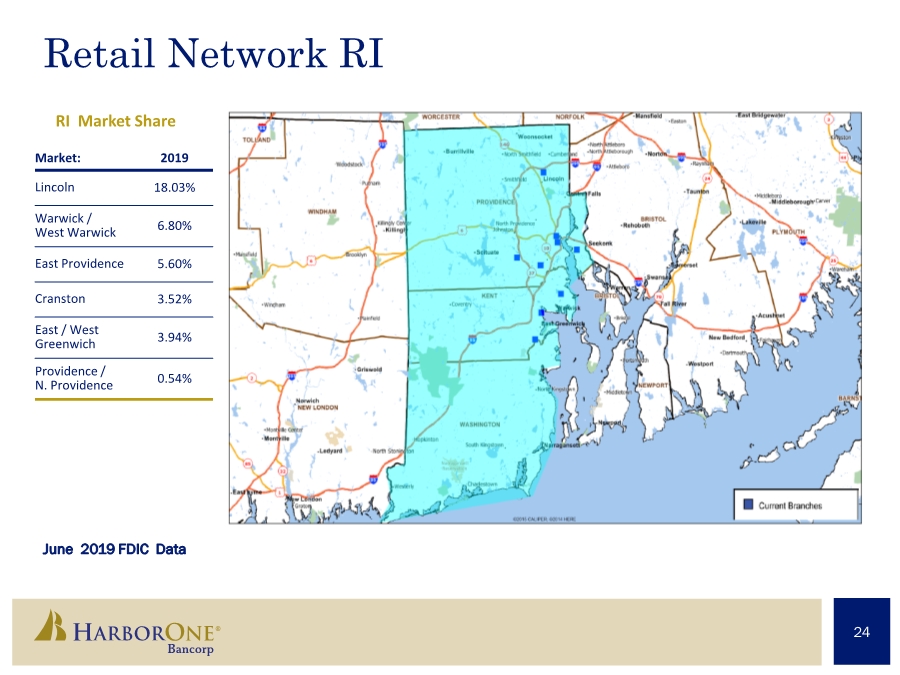
| 24 Retail Network RI June 2019 FDIC Data Market: 2019 Lincoln 18.03% Warwick / West Warwick 6.80% East Providence 5.60% Cranston 3.52% East / West Greenwich 3.94% Providence / N. Providence 0.54% RI Market Share |
| 25 * Data source: The Warren Group . Q1 2020 earnings of $795,000. This included a negative $2.8 million mark on mortgage servicing rights. . 107 loan originators across 5 states (MA/NH/ME/RI/NJ) that also support limited business in FL, NY, CT, VT. . Exceeded $355 million in fundings in Q1 2020 verses $158 million in Q1 2019. Given current pipeline and market expectations on interest rates, we are forecasting fundings to be strong in Q2. . Market share for purchases are 5th in NH, 6th in RI, 11th in ME, 23rd in MA*. . 40%/60% purchase-to-refi split in Q1 2020. Q4 2019 was 50%/50% split. . Disciplined and flexible sales structure to match market expansion and contraction. . Reliable feeder for Bank balance sheet growth based on ALCO needs. |
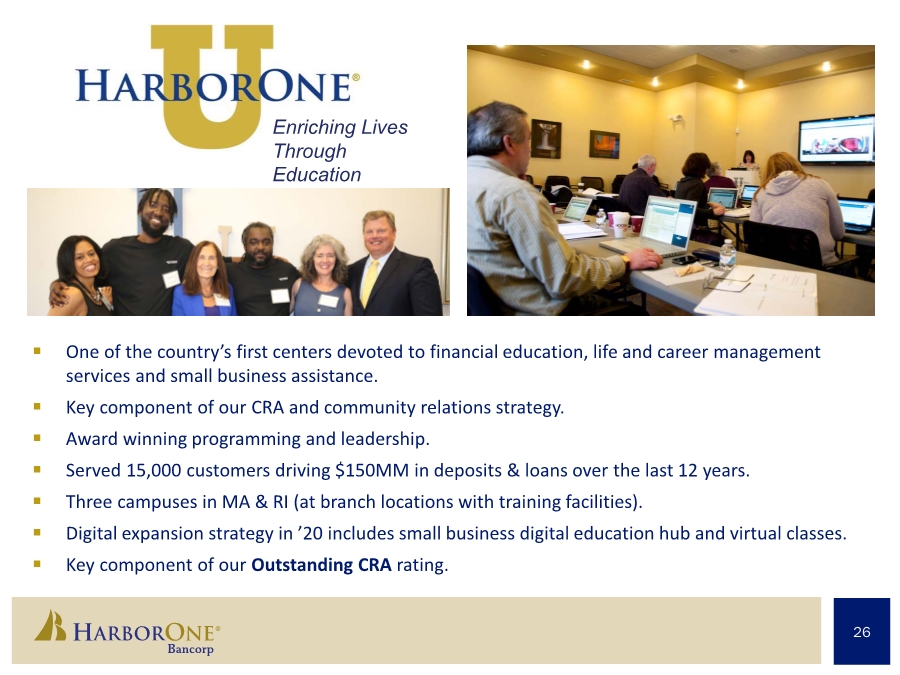
| 26 . One of the country’s first centers devoted to financial education, life and career management services and small business assistance. . Key component of our CRA and community relations strategy. . Award winning programming and leadership. . Served 15,000 customers driving $150MM in deposits & loans over the last 12 years. . Three campuses in MA & RI (at branch locations with training facilities). . Digital expansion strategy in ’20 includes small business digital education hub and virtual classes. . Key component of our Outstanding CRA rating. Enriching Lives Through Education |
| 27 Why HarborOne? Value . $4B commercial bank in attractive New England market . Recognize value in dividend and stock buy-back subject to Board approval and regulatory requirements Leadership . Proven ability to successfully deploy capital . Six-year track record of strategic growth since charter change to a bank…we know how to do it, why to do it, when to do it, and we do what we say we’ll do Well Capitalized . Successful second-step capital raise enables disciplined growth and insulation from economic downturn Respected & Trusted . Strong community ties and unparalleled community programs, e.g., HarborOne U and OneCommunity Scholarship |
| 28 A Commitment To Doing What’s Right Mission Statement We provide a personalized experience while caring about every customer. We focus on understanding their financial goals for today and dreams for tomorrow. We are unwavering in our commitment to the communities that we serve. Vision Statement To be our customers’ most trusted financial partner. Our Values Integrity. Teamwork. Trust. Respect. Accountability. |
| 29 “Our vision for the future is disciplined, organic growth. Our commitment to those we serve and each other is to be the very best that we can be, every day. We embrace challenge, seek opportunity, and are steadfast in our focus to build an exceptional company.” – Jim Blake, CEO |