Attached files
| file | filename |
|---|---|
| 8-K - 8-K - Macquarie Leasing Pty Ltd | d830744d8k.htm |
Exhibit 99.1

Australia and New Zealand Banking Group Limited
ABN 11 005 357 522
Half Year
31 March 2020
Consolidated Financial Report
Dividend Announcement
and Appendix 4D
|
The Consolidated Financial Report and Dividend Announcement contains information required by Appendix 4D of the Australian Securities Exchange (ASX) Listing Rules. It should be read in conjunction with ANZ’s 2019 Annual Report, and is lodged with the ASX under listing rule 4.2A.
|
| RESULTS FOR ANNOUNCEMENT TO THE MARKET |
APPENDIX 4D |
| Name of Company: | Australia and New Zealand Banking Group Limited | |
| ABN 11 005 357 522 |
| Report for the half year ended 31 March 2020
| ||||||||
| Operating Results1 | AUD million | |||||||
| Statutory operating income from continuing operations |

|
-4% | to | 8,893 | ||||
| Statutory profit attributable to shareholders |
|
-51% | to | 1,545 | ||||
| Cash profit2 |
|
-62% | to | 1,323 | ||||
| Cash profit from continuing operations2 |
|
-60% | to | 1,413 | ||||
|
Dividends |
Cents
per
share |
Franked
amount
per share | ||||||
| Proposed interim dividend |
TBD3 | TBD3 | ||||||
| Record date for determining entitlements to the proposed 2020 interim dividend |
TBD3 | |||||||
| Payment date for the proposed 2020 interim dividend |
TBD3 | |||||||
Dividends
Australia and New Zealand Banking Group Limited (ANZ), with consideration to the current uncertainties in the economic outlook and the letter issued by the Australian Prudential Regulation Authority (APRA) to all Authorised Deposit Taking Institutions (ADIs) on 7 April 2020, on capital management and the ongoing Coronavirus (COVID-19) pandemic, has deferred the decision on the payment of a 2020 interim dividend until the economic outlook is clearer. Decisions in relation to the Dividend Reinvestment Plan and Bonus Option Plan will also be made at that time as applicable.
The Board will continue to deliberate and an update will be provided at the August 2020 market update.
| 1 | Unless otherwise noted, all comparisons are to the half year ended 31 March 2019. |
| 2 | Cash profit excludes non-core items included in statutory profit and is provided to assist readers in understanding the result of the core business activities of the Group. The non-core items are calculated consistently period on period so as not to discriminate between positive and negative adjustments, and fall into one of the three categories: gains or losses included in earnings arising from changes in tax, legal or accounting legislation or other non-core items not associated with the core operations of the Group; treasury shares, revaluation of policy liabilities, economic hedging and similar accounting items that represent timing differences that will reverse through earnings in the future; and accounting reclassifications between individual line items that do not impact reported results, such as credit risk on impaired derivatives. Cash profit is not a measure of cash flow or profit determined on a cash basis. The net after tax adjustment was a reduction to statutory profit of $222 million (all attributable to continuing operations) made up of several items. Refer pages 71 to 75 for further details. |
| 3 | The decision on the payment of a 2020 interim dividend has been deferred until the economic outlook is clearer and an update will be provided at the August 2020 market update. |
2
| AUSTRALIA AND NEW ZEALAND BANKING GROUP LIMITED | ABN 11 005 357 522 |
CONSOLIDATED FINANCIAL REPORT, DIVIDEND ANNOUNCEMENT AND APPENDIX 4D
Half year ended 31 March 2020
| CONTENTS |
PAGE | |||
| Disclosure Summary |
5 | |||
| Summary |
7 | |||
| Group Results |
19 | |||
| Divisional Results |
47 | |||
| Profit Reconciliation |
71 | |||
| Condensed Consolidated Financial Statements |
77 | |||
| Supplementary Information |
127 | |||
| Definitions |
139 | |||
| ASX Appendix 4D Cross Reference Index |
142 | |||
| Alphabetical Index |
143 | |||
This Consolidated Financial Report, Dividend Announcement and Appendix 4D has been prepared for Australia and New Zealand Banking Group Limited (the “Company” or “Parent Entity”) together with its subsidiaries which are variously described as “ANZ”, “Group”, “ANZ Group”, “the consolidated entity”, “the Bank”, “us”, “we” or “our”.
All amounts are in Australian dollars unless otherwise stated. The Company has a formally constituted Audit Committee of the Board of Directors. The Condensed Consolidated Financial Statements were approved by resolution of a Committee of the Board of Directors on 29 April 2020.
When used in this Results Announcement the words “estimate”, “project”, “intend”, “anticipate”, “believe”, “expect”, “should” and similar expressions, as they relate to ANZ and its management, are intended to identify forward-looking statements. Readers are cautioned not to place undue reliance on these forward-looking statements, which speak only as of the date hereof. ANZ does not undertake any obligation to publicly release the result of any revisions to these forward-looking statements to reflect events or circumstances after the date hereof or to reflect the occurrence of unanticipated events.
3
| AUSTRALIA AND NEW ZEALAND BANKING GROUP LIMITED |
ABN 11 005 357 522 |
This page has been left blank intentionally
4
DISCLOSURE SUMMARY
SUMMARY OF 2020 HALF YEAR RESULTS AND ASSOCIATED DISCLOSURE MATERIALS
The following disclosure items were lodged separately with the ASX and NZX and can be accessed via the ANZ Shareholder Centre on the Group website http://www.shareholder.anz.com within the disclosures for 2020 Half Year Results.
| • | Consolidated Financial Report, Dividend Announcement and Appendix 4D |
| • | Half Year Results Investor Discussion Pack |
| • | News Release |
| • | APS 330 Pillar III Disclosure as at 31 March 2020 |
| • | Key Financial Data Summary |
| • | United Kingdom Disclosure and Transparency Rules Submission |
5
DISCLOSURE SUMMARY
This page has been left blank intentionally
6
| SUMMARY
|
| CONTENTS | Page | |||
| Guide to Half Year Results |
8 | |||
| Statutory Profit Results |
9 | |||
| Cash Profit Results |
10 | |||
| Financial Performance Summary – Total and continuing operations |
11 | |||
| Key Balance Sheet Metrics |
12 | |||
| Large/Notable Items – continuing operations |
13 | |||
| Full Time Equivalent Staff |
17 | |||
| Other Non-Financial Information |
17 | |||
7
SUMMARY
Guide to Half Year Results
CORONAVIRUS (COVID-19)
The ongoing COVID-19 pandemic has increased the estimation uncertainty in the preparation of these Condensed Consolidated Financial Statements. While pervasive across the financial statements, the estimation uncertainty is predominantly related to expected credit losses where the Group recognised a credit impairment charge of $1.7bn pre-tax in the March 2020 half, and the fair value measurement and recoverable amount assessments of non-financial assets where the Group recognised an impairment loss of $815 million in respect of two of the Group’s Asian associate investments. For further details of these estimation uncertainties refer to Note 1 of the Condensed Consolidated Financial Statements
ACCOUNTING STANDARDS ADOPTED
During the period, the Group adopted AASB 16 Leases (AASB 16) and applied a modified retrospective transition approach in recognising all leases (except for leases of low value assets and short term leases) on the balance sheet based on the present value of remaining lease payments as of 1 October 2019. Consequently on 1 October 2019 the Group recognised an increase in lease liabilities of $1.7 billion, a right-of-use lease asset of $1.6 billion, an increase in deferred tax assets of $37 million and a net reduction to opening retained earnings of $88 million. For further details on key requirements and impacts of the changes refer to Note 1 of the Condensed Consolidated Financial Statements.
The Group early adopted AASB 2019-3 Amendments to Australian Accounting Standards – Interest Rate Benchmark Reform from 1 October 2019. The standard modifies certain hedge accounting requirements to provide relief from the potential effects of the uncertainty caused by interest rate benchmark reform.
NON-IFRS INFORMATION
Statutory profit is prepared in accordance with recognition and measurement requirements of Australian Accounting Standards, which comply with International Financial Reporting Standards (IFRS). The Group provides additional measures of performance in the Consolidated Financial Report & Dividend Announcement which are prepared on a basis other than in accordance with accounting standards. The guidance provided in Australian Securities and Investments Commission (ASIC) Regulatory Guide 230 has been followed when presenting this information.
Cash Profit
Cash profit, a non-IFRS measure, represents ANZ’s preferred measure of the result of the core business activities of the Group, enabling readers to assess Group and Divisional performance against prior periods and against peer institutions. The adjustments made in arriving at cash profit are included in statutory profit which is subject to review within the context of the external auditor’s review of the Condensed Consolidated Financial Statements. Cash profit is not subject to review by the external auditor. The external auditor has informed the Audit Committee that cash profit adjustments have been determined on a consistent basis across each period presented.
| • | Adjustments between statutory profit and cash profit - To calculate cash profit, the Group excludes non-core items from statutory profit. Refer to pages 71 to 75 for adjustments between statutory and cash profit. |
| • | Large/Notable items within cash profit - The Group’s cash profit result from continuing operations includes a number of items collectively referred to as large/notable items. While these items form part of cash profit, given their nature and significance, they have been presented separately with comparative information, where relevant, to provide transparency and aid comparison. Refer to pages 13 to 16 for details of large/notable items. |
DISCONTINUED OPERATIONS
The financial results of the divested Wealth Australia businesses and associated Group reclassification and consolidation impacts are treated as discontinued operations from a financial reporting perspective. The Group Income Statement and Statement of Comprehensive Income show discontinued operations separately from continuing operations in a separate line item ‘Profit/(Loss) from discontinued operations’.
| • | Sale to IOOF Holdings Limited (IOOF) |
In October 2017, the Group announced it had agreed to sell its OnePath pensions and investments (OnePath P&I) business and Aligned Dealer Groups (ADGs) businesses to IOOF. The sale of the ADG business completed on 1 October 2018 and the OnePath P&I business completed on 31 January 2020.
| • | Sale to Zurich Financial Services Australia (Zurich) |
In December 2017, the Group announced it had agreed to sell its life insurance business to Zurich and the transaction completed on 31 May 2019.
Included in the ‘Cash loss from discontinued operations’ is:
| • | A $16 million loss on disposal ($11 million loss after tax) was recognised in the March 2020 half attributable to sale completion costs. The September 2019 half included a $23 million loss ($81 million loss after tax) attributable to sale related adjustments and write-downs, the reversal of the life-to-date cash profit adjustments on the revaluation of policy liabilities sold to Zurich, partially offset by the recycling on sale completion of gains previously deferred in equity reserves; and |
| • | Customer remediation which includes provisions for expected refunds to customers and related remediation costs associated with inappropriate advice or services not provided in the pensions and investments and life insurance businesses, as follows: |
| Half Year | ||||||||||||
| Mar 20 $M |
Sep 19 $M |
Mar 19 $M |
||||||||||
| Customer remediation (pre-tax) |
124 | 166 | 75 | |||||||||
| Customer remediation (post-tax) |
94 | 154 | 53 | |||||||||
8
SUMMARY
Statutory Profit Results
| Half Year | Movement | |||||||||||||||||||
| Mar 20 $M |
Sep 19 $M |
Mar 19 $M |
Mar 20 v. Sep 19 |
Mar 20 v. Mar 19 |
||||||||||||||||
| Net interest income |
7,222 | 7,040 | 7,299 | 3% | -1% | |||||||||||||||
| Other operating income |
1,671 | 2,452 | 1,994 | -32% | -16% | |||||||||||||||
| Operating income |
8,893 | 9,492 | 9,293 | -6% | -4% | |||||||||||||||
| Operating expenses |
(4,605 | ) | (4,706 | ) | (4,365 | ) | -2% | 5% | ||||||||||||
| Profit before credit impairment and income tax |
4,288 | 4,786 | 4,928 | -10% | -13% | |||||||||||||||
| Credit impairment charge |
(1,674 | ) | (402 | ) | (392 | ) | large | large | ||||||||||||
| Profit before income tax |
2,614 | 4,384 | 4,536 | -40% | -42% | |||||||||||||||
| Income tax expense |
(978 | ) | (1,325 | ) | (1,284 | ) | -26% | -24% | ||||||||||||
|
Non-controlling interests |
(1 | ) | (6 | ) | (9 | ) | -83% | -89% | ||||||||||||
| Profit attributable to shareholders of the Company from continuing operations |
1,635 | 3,053 | 3,243 | -46% | -50% | |||||||||||||||
| Profit/(Loss) from discontinued operations |
(90 | ) | (273 | ) | (70 | ) | -67% | 29% | ||||||||||||
| Profit attributable to shareholders of the Company |
1,545 | 2,780 | 3,173 | -44% | -51% | |||||||||||||||
| Earnings Per Ordinary Share (cents) | Half Year | Movement | ||||||||||||||||||||
| Reference Page |
Mar 20 | Sep 19 | Mar 19 | Mar 20 v. Sep 19 |
Mar 20 v. Mar 19 |
|||||||||||||||||
| Basic |
96 | 54.6 | 98.3 | 111.7 | -44% | -51% | ||||||||||||||||
| Diluted |
96 | 51.5 | 94.7 | 106.4 | -46% | -52% | ||||||||||||||||
| Half Year | ||||||||||||||||
| Reference Page |
Mar 20 | Sep 19 | Mar 19 | |||||||||||||
| Ordinary Share Dividends (cents) |
||||||||||||||||
| Interim |
||||||||||||||||
| - fully franked1,2,3 |
95 | TBD | N/A | 80 | ||||||||||||
| - partially franked1 |
95 | TBD | N/A | N/A | ||||||||||||
| Final (partially franked)3,4 |
95 | N/A | 80 | N/A | ||||||||||||
| Total |
95 | TBD | 80 | 80 | ||||||||||||
| Ordinary share dividend payout ratio5 |
95 | TBD | 81.6% | 71.4% | ||||||||||||
| Profitability Ratios |
||||||||||||||||
| Return on average ordinary shareholders’ equity6 |
5.1% | 9.3% | 10.8% | |||||||||||||
| Return on average assets7 |
0.30% | 0.56% | 0.65% | |||||||||||||
| Net interest margin |
1.69% | 1.72% | 1.79% | |||||||||||||
| Net interest income to average credit RWAs7 |
3.96% | 4.03% | 4.23% | |||||||||||||
| Efficiency Ratios |
||||||||||||||||
| Operating expenses to operating income |
53.8% | 51.8% | 48.6% | |||||||||||||
| Operating expenses to average assets7 |
0.92% | 1.00% | 0.94% | |||||||||||||
| Credit Impairment Charge/(Release) |
||||||||||||||||
| Individually assessed credit impairment charge ($M) |
626 | 398 | 379 | |||||||||||||
| Collectively assessed credit impairment charge/(release) ($M) |
1,048 | 4 | 13 | |||||||||||||
| Total credit impairment charge ($M) |
102 | 1,674 | 402 | 392 | ||||||||||||
| Individually assessed credit impairment charge as a % of average gross loans and advances7,8 |
0.20% | 0.13% | 0.12% | |||||||||||||
| Total credit impairment charge as a % of average gross loans and advances7,8 |
0.53% | 0.13% | 0.13% | |||||||||||||
| 1. | The decision on the payment of a 2020 interim dividend has been deferred until the economic outlook is clearer and an update will be provided at the August 2020 market update. |
| 2. | Fully franked for Australian tax purposes (30% tax rate) for the 2019 interim dividend. |
| 3. | Carry New Zealand imputation credits of NZD 9 cents for the 2019 interim and final dividend. |
| 4. | Partially franked at 70% for Australian tax purposes (30% tax rate). |
| 5. | The dividend payout ratio for the March 2020 half will be determined when the decision on the 2020 interim dividend has been made. The dividend payout ratio for the September 2019 half and March 2019 half are calculated using the 2019 final and 2019 interim dividends respectively. |
| 6. | Average ordinary shareholders’ equity excludes non-controlling interests. |
| 7. | Average assets, average gross loans and advances and average credit RWAs include assets held for sale. |
| 8. | Credit impairment charge used in the ratio relates to gross loans and advances and off-balance sheet commitments - undrawn and contingent liabilities. |
9
SUMMARY
Cash Profit Results1
| Half Year | Movement | |||||||||||||||||||
| Mar 20 $M |
Sep 19 $M |
Mar 19 $M |
Mar 20 v. Sep 19 |
Mar 20 v. Mar 19 |
||||||||||||||||
| Net interest income |
7,222 | 7,040 | 7,299 | 3% | -1% | |||||||||||||||
| Other operating income |
1,357 | 2,243 | 2,447 | -40% | -45% | |||||||||||||||
| Operating income |
8,579 | 9,283 | 9,746 | -8% | -12% | |||||||||||||||
| Operating expenses |
(4,605 | ) | (4,706 | ) | (4,365 | ) | -2% | 5% | ||||||||||||
| Profit before credit impairment and income tax |
3,974 | 4,577 | 5,381 | -13% | -26% | |||||||||||||||
| Credit impairment charge |
(1,674 | ) | (402 | ) | (393 | ) | large | large | ||||||||||||
| Profit before income tax |
2,300 | 4,175 | 4,988 | -45% | -54% | |||||||||||||||
| Income tax expense |
(886 | ) | (1,263 | ) | (1,415 | ) | -30% | -37% | ||||||||||||
|
Non-controlling interests |
(1 | ) | (6 | ) | (9 | ) | -83% | -89% | ||||||||||||
| Cash profit from continuing operations |
1,413 | 2,906 | 3,564 | -51% | -60% | |||||||||||||||
| Cash profit/(loss) from discontinued operations |
(90 | ) | (259 | ) | (50 | ) | -65% | 80% | ||||||||||||
| Cash profit |
1,323 | 2,647 | 3,514 | -50% | -62% | |||||||||||||||
| Earnings Per Ordinary Share (cents) | Half Year | Movement | ||||||||||||||||||
| Mar 20 | Sep 19 | Mar 19 | Mar 20 v. Sep 19 |
Mar 20 v. Mar 19 |
||||||||||||||||
| Basic |
46.7 | 93.6 | 123.0 | -50% | -62% | |||||||||||||||
| Diluted |
44.7 | 90.3 | 116.8 | -50% | -62% | |||||||||||||||
| Half Year | ||||||||||||||||
| Reference Page |
Mar 20 | Sep 19 | Mar 19 | |||||||||||||
| Ordinary Share Dividends |
||||||||||||||||
| Ordinary share dividend payout ratio2 |
TBD | 85.7% | 64.5% | |||||||||||||
| Profitability Ratios |
||||||||||||||||
| Return on average ordinary shareholders’ equity3 |
4.4% | 8.9% | 11.9% | |||||||||||||
| Return on average assets4 |
0.26% | 0.53% | 0.72% | |||||||||||||
| Net interest margin |
1.69% | 1.72% | 1.79% | |||||||||||||
| Net interest income to average credit RWAs4 |
3.96% | 4.03% | 4.23% | |||||||||||||
| Efficiency Ratios |
||||||||||||||||
| Operating expenses to operating income |
55.2% | 52.9% | 46.4% | |||||||||||||
| Operating expenses to average assets4 |
0.92% | 1.00% | 0.94% | |||||||||||||
| Credit Impairment Charge/(Release) |
||||||||||||||||
| Individually assessed credit impairment charge ($M) |
29 | 626 | 398 | 380 | ||||||||||||
| Collectively assessed credit impairment charge/(release) ($M) |
29 | 1,048 | 4 | 13 | ||||||||||||
| Total credit impairment charge ($M) |
29 | 1,674 | 402 | 393 | ||||||||||||
| Individually assessed credit impairment charge as a % of average gross loans and advances4,5 |
0.20% | 0.13% | 0.12% | |||||||||||||
| Total credit impairment charge as a % of average gross loans and advances4,5 |
0.53% | 0.13% | 0.13% | |||||||||||||
| Cash Profit/(Loss) By Division | Half Year | Movement | ||||||||||||||||||
| Mar 20 $M |
Sep 19 $M |
Mar 19 $M |
Mar 20 v. Sep 19 |
Mar 20 v. Mar 19 |
||||||||||||||||
| Australia Retail and Commercial |
1,214 | 1,492 | 1,703 | -19% | -29% | |||||||||||||||
| Institutional |
610 | 816 | 1,012 | -25% | -40% | |||||||||||||||
| New Zealand |
567 | 646 | 753 | -12% | -25% | |||||||||||||||
| Pacific |
20 | 26 | 33 | -23% | -39% | |||||||||||||||
| TSO and Group Centre |
(998 | ) | (74 | ) | 63 | large | large | |||||||||||||
| Discontinued Operations |
(90 | ) | (259 | ) | (50 | ) | -65% | 80% | ||||||||||||
| Cash profit |
1,323 | 2,647 | 3,514 | -50% | -62% | |||||||||||||||
| 1. | Cash profit excludes non-core items included in statutory profit and is provided to assist readers in understanding the results of the core business activities of the Group. Refer to pages 71 to 75 for the reconciliation between statutory and cash profit. Refer to pages 13 to 16 for information on large/notable items included in continuing cash profit. |
| 2. | The dividend payout ratio for the March 2020 half will be determined when the decision on the 2020 interim dividend has been made. The dividend payout ratio for the September 2019 half and March 2019 half are calculated using the 2019 final and 2019 interim dividends respectively. |
| 3. | Average ordinary shareholders’ equity excludes non-controlling interests. |
| 4. | Average assets, average gross loans and advances and average credit RWAs include assets held for sale. |
| 5. | Credit impairment charge used in the ratio relates to gross loans and advances and off-balance sheet commitments - undrawn and contingent liabilities. |
10
SUMMARY
Financial Performance Summary – Total and continuing operations
For financial reporting purposes the results of discontinued operations are shown in a separate line item ‘Profit/(Loss) from discontinued operations’. In the table below, Total cash profit - inclusive of discontinued operations and Cash profit - continuing operations are shown. For the purpose of understanding the impact of discontinued operations across various Income Statement categories, Total cash profit - inclusive of discontinued operations is presented such that each Income Statement line item is inclusive of discontinued operations.
| Total cash profit - inclusive of discontinued operations |
Movement | Cash profit - continuing operations | Movement | |||||||||||||||||||||||||||||||||||||||||||||||||
| Mar 20 $M |
Sep 19 $M |
Mar 19 $M |
Mar 20 v. Sep 19 |
Mar 20 v. Mar 19 |
Mar 20 $M |
Sep 19 $M |
Mar 19 $M |
Mar 20 v. Sep 19 |
Mar 20 v. Mar 19 |
|||||||||||||||||||||||||||||||||||||||||||
| Net interest income |
7,217 | 7,021 | 7,242 | 3% | 0% | 7,222 | 7,040 | 7,299 | 3% | -1% | ||||||||||||||||||||||||||||||||||||||||||
| Other operating income |
1,349 | 2,299 | 2,651 | -41% | -49% | 1,357 | 2,243 | 2,447 | -40% | -45% | ||||||||||||||||||||||||||||||||||||||||||
| Operating income |
8,566 | 9,320 | 9,893 | -8% | -13% | 8,579 | 9,283 | 9,746 | -8% | -12% | ||||||||||||||||||||||||||||||||||||||||||
| Operating expenses |
(4,725 | ) | (4,934 | ) | (4,586 | ) | -4% | 3% | (4,605 | ) | (4,706 | ) | (4,365 | ) | -2% | 5% | ||||||||||||||||||||||||||||||||||||
| Profit before credit impairment and income tax |
3,841 | 4,386 | 5,307 | -12% | -28% | 3,974 | 4,577 | 5,381 | -13% | -26% | ||||||||||||||||||||||||||||||||||||||||||
| Credit impairment charge |
(1,674 | ) | (402 | ) | (392 | ) | 316% | 327% | (1,674 | ) | (402 | ) | (393 | ) | 316% | 326% | ||||||||||||||||||||||||||||||||||||
| Profit before income tax |
2,167 | 3,984 | 4,915 | -46% | -56% | 2,300 | 4,175 | 4,988 | -45% | -54% | ||||||||||||||||||||||||||||||||||||||||||
| Income tax expense |
(843 | ) | (1,331 | ) | (1,392) | -37% | -39% | (886 | ) | (1,263 | ) | (1,415 | ) | -30% | -37% | |||||||||||||||||||||||||||||||||||||
| Non-controlling interests |
(1 | ) | (6 | ) | (9 | ) | -83% | -89% | (1 | ) | (6 | ) | (9 | ) | -83% | -89% | ||||||||||||||||||||||||||||||||||||
| Cash Profit |
1,323 | 2,647 | 3,514 | -50% | -62% | 1,413 | 2,906 | 3,564 | -51% | -60% | ||||||||||||||||||||||||||||||||||||||||||
| Average interest earning assets |
856,652 | 814,831 | 811,528 | 5% | 6% | 856,652 | 814,831 | 811,528 | 5% | 6% | ||||||||||||||||||||||||||||||||||||||||||
| Average deposits and other borrowings |
669,342 | 642,448 | 635,822 | 4% | 5% | 669,342 | 642,448 | 635,822 | 4% | 5% | ||||||||||||||||||||||||||||||||||||||||||
| Funds under management1 |
35,665 | 84,171 | 83,164 | -58% | -57% | 35,665 | 35,754 | 33,816 | 0% | 5% | ||||||||||||||||||||||||||||||||||||||||||
| Earnings per share (basic) |
46.7 | 93.6 | 123.0 | -50% | -62% | 49.9 | 102.7 | 124.8 | -51% | -60% | ||||||||||||||||||||||||||||||||||||||||||
| Ordinary share dividend payout ratio2 |
TBD | 86% | 65% | TBD | 78.0% | 63.6% | ||||||||||||||||||||||||||||||||||||||||||||||
| Profitability Ratios |
||||||||||||||||||||||||||||||||||||||||||||||||||||
| Return on average ordinary shareholders’ equity3 |
4.4% | 8.9% | 11.9% | 4.7% | 9.8% | 12.0% | ||||||||||||||||||||||||||||||||||||||||||||||
| Return on average assets |
0.26% | 0.53% | 0.72% | 0.28% | 0.59% | 0.77% | ||||||||||||||||||||||||||||||||||||||||||||||
| Net interest margin |
1.68% | 1.72% | 1.79% | 1.69% | 1.72% | 1.80% | ||||||||||||||||||||||||||||||||||||||||||||||
| Net interest income to average credit RWAs |
3.96% | 4.03% | 4.23% | 3.96% | 4.04% | 4.26% | ||||||||||||||||||||||||||||||||||||||||||||||
| Efficiency Ratios |
||||||||||||||||||||||||||||||||||||||||||||||||||||
| Operating expenses to operating income |
55.2% | 52.9% | 46.4% | 53.7% | 50.7% | 44.8% | ||||||||||||||||||||||||||||||||||||||||||||||
| Operating expenses to average assets |
0.92% | 1.00% | 0.94% | 0.90% | 0.96% | 0.94% | ||||||||||||||||||||||||||||||||||||||||||||||
| FTE4 |
38,939 | 39,060 | 39,359 | 0% | -1% | 37,834 | 37,588 | 37,364 | 1% | 1% | ||||||||||||||||||||||||||||||||||||||||||
| 1. | Funds under management for continuing operations relates to retained wealth management operations in the New Zealand division and Australia Retail and Commercial division. |
| 2. | The dividend payout ratio for the March 2020 half will be determined when the decision on the 2020 interim dividend has been made. The dividend payout ratio for the September 2019 half and March 2019 half are calculated using the 2019 final and 2019 interim dividends respectively. |
| 3. | Average ordinary shareholders’ equity excludes non-controlling interests. |
| 4. | The discontinued operations FTE is based on an estimate of the staff working in the divested businesses using an allocation methodology and includes staff retained in the Group working on transitioning the sold businesses to the purchasers. |
11
SUMMARY
Key Balance Sheet Metrics1
| As at |
Movement | |||||||||||||||||||||||
| Reference Page |
Mar 20 | Sep 19 | Mar 19 | Mar 20 v. Sep 19 |
Mar 20 v. Mar 19 |
|||||||||||||||||||
| Capital Management |
||||||||||||||||||||||||
| Common Equity Tier 1 (Level 2) |
||||||||||||||||||||||||
| - APRA Basel 3 |
42 | 10.8% | 11.4% | 11.5% | ||||||||||||||||||||
| - Internationally Comparable Basel 32 |
42 | 15.5% | 16.4% | 16.9% | ||||||||||||||||||||
| Credit risk weighted assets ($B) |
130 | 386.0 | 358.1 | 345.5 | 8% | 12% | ||||||||||||||||||
| Total risk weighted assets ($B) |
42 | 449.0 | 417.0 | 396.3 | 8% | 13% | ||||||||||||||||||
| APRA Leverage Ratio |
44 | 5.0% | 5.6% | 5.4% | ||||||||||||||||||||
| Balance Sheet: Key Items |
||||||||||||||||||||||||
| Gross loans and advances ($B) |
661.3 | 618.8 | 613.8 | 7% | 8% | |||||||||||||||||||
| Net loans and advances ($B) |
656.6 | 615.3 | 610.2 | 7% | 8% | |||||||||||||||||||
| Total assets ($B) |
1,150.0 | 981.1 | 980.3 | 17% | 17% | |||||||||||||||||||
| Customer deposits ($B) |
566.5 | 511.8 | 493.4 | 11% | 15% | |||||||||||||||||||
| Total equity ($B) |
61.4 | 60.8 | 60.0 | 1% | 2% | |||||||||||||||||||
| As at | Movement | |||||||||||||||||||||||
| Liquidity Risk | Reference Page |
Mar 20 | Sep 19 | Mar 19 | Mar 20 v. Sep 19 |
Mar 20 v. Mar 19 |
||||||||||||||||||
| Liquidity Coverage Ratio (half year average) |
40 | 139% | 143% | 137% | -4% | 2% | ||||||||||||||||||
| Net Stable Funding Ratio |
41 | 118% | 116% | 115% | 2% | 3% | ||||||||||||||||||
| As at | Movement | |||||||||||||||||||||||
| Reference Page |
Mar 20 | Sep 19 | Mar 19 | Mar 20 v. Sep 19 |
Mar 20 v. Mar 19 |
|||||||||||||||||||
| Impaired Assets |
||||||||||||||||||||||||
| Gross impaired assets ($M) |
33 | 2,599 | 2,029 | 2,128 | 28% | 22% | ||||||||||||||||||
| Gross impaired assets as a % of gross loans and advances |
0.39% | 0.33% | 0.35% | |||||||||||||||||||||
| Net impaired assets ($M) |
33 | 1,506 | 1,215 | 1,237 | 24% | 22% | ||||||||||||||||||
| Net impaired assets as a % of shareholders’ equity |
2.5% | 2.0% | 2.0% | |||||||||||||||||||||
| Individually assessed provision ($M) |
31 | 1,093 | 814 | 891 | 34% | 23% | ||||||||||||||||||
| Individually assessed provision as a % of gross impaired assets |
42.1% | 40.1% | 41.9% | |||||||||||||||||||||
| Collectively assessed provision ($M) |
31 | 4,501 | 3,376 | 3,378 | 33% | 33% | ||||||||||||||||||
| Collectively assessed provision as a % of credit risk weighted assets |
1.17% | 0.94% | 0.98% | |||||||||||||||||||||
| Net Tangible Assets |
||||||||||||||||||||||||
| Net tangible assets attributable to ordinary shareholders ($B)3 |
56.4 | 55.5 | 53.7 | 2% | 5% | |||||||||||||||||||
| Net tangible assets per ordinary share ($) |
19.89 | 19.59 | 18.94 | 2% | 5% | |||||||||||||||||||
| As at | Movement | |||||||||||||||||||||||
| Net Loans And Advances By Division (Excluding Held for Sale) | Mar 20 $B |
Sep 19 $B |
Mar 19 $B |
Mar 20 v. Sep 19 |
Mar 20 v. Mar 19 |
|||||||||||||||||||
| Australia Retail and Commercial |
329.8 | 331.9 | 336.6 | -1% | -2% | |||||||||||||||||||
| Institutional4 |
199.4 | 164.5 | 151.7 | 21% | 31% | |||||||||||||||||||
| New Zealand5 |
125.2 | 116.7 | 118.8 | 7% | 5% | |||||||||||||||||||
| Pacific |
2.2 | 2.1 | 2.1 | 5% | 5% | |||||||||||||||||||
| TSO and Group Centre |
- | 0.1 | 0.1 | -100% | -100% | |||||||||||||||||||
| Net loans and advances by division |
656.6 | 615.3 | 609.3 | 7% | 8% | |||||||||||||||||||
| 1. | Balance Sheet amounts and metrics include assets and liabilities held for sale unless otherwise stated. |
| 2. | See page 43 for further details regarding the differences between APRA Basel 3 and Internationally Comparable Basel 3 standards. |
| 3. | Equals total shareholders’ equity less total non-controlling interests, goodwill and other intangible assets. |
| 4. | Excluding the impact of foreign currency translation, the Institutional division Net loans and advances increased 17% compared to September 2019 and 25% compared to March 2019. |
| 5. | Excluding the impact of foreign currency translation, the New Zealand division Net loans and advances increased 2% compared to September 2019 and 4% compared to March 2019. |
12
SUMMARY
Large/Notable Items – continuing operations
Large/notable items included in cash profit from continuing operations are described below.
Divestment impacts
No divestments were announced or completed in the March 2020 half.
In the September 2019 half and March 2019 half, the Group completed the following divestments. As these divestments did not qualify as discontinued operations under accounting standards they form part of continuing operations. The financial impacts from these divestments are summarised below including the business results for those divestments that have completed:
| Gain/(Loss) on sale from divestments | Completed divestment business results | |||||||||||||||
| Half Year | Half Year | |||||||||||||||
| Cash Profit Impact | Sep 19 $M |
Mar 19 $M |
Sep 19 $M |
Mar 19 $M |
||||||||||||
| Paymark |
- | 37 | - | 4 | ||||||||||||
| Cambodia JV |
10 | - | 10 | 21 | ||||||||||||
| OPL NZ |
7 | 197 | - | 14 | ||||||||||||
| PNG Retail, Commercial and SME |
1 | - | 4 | 5 | ||||||||||||
| Profit/(Loss) before income tax |
18 | 234 | 14 | 44 | ||||||||||||
| Income tax benefit/(expense) and non-controlling interests |
- | (47) | (7) | (19) | ||||||||||||
| Cash profit/(loss) from continuing operations |
18 | 187 | 7 | 25 | ||||||||||||
| • | Paymark Limited (Paymark) |
In January 2018, the Group entered into an agreement to sell its 25% shareholding in Paymark Limited to Ingenico Group. The transaction was completed on 11 January 2019. The Group recognised a net gain on sale of $37 million during the March 2019 half.
| • | ANZ Royal Bank (Cambodia) Ltd (Cambodia JV) |
In May 2018, the Group announced it had reached an agreement to sell its 55% stake in Cambodia JV to J Trust, a Japanese diversified financial holding company. The transaction completed on 19 August 2019 and the Group recognised a $10 million net gain on sale, comprising a $30 million release from foreign currency translation reserve, partially offset by a $17 million dividend withholding tax associated with the sale completion and $3 million of asset write-offs in the September 2019 half.
| • | OnePath Life (NZ) Ltd (OPL NZ) |
In May 2018, the Group announced that it had agreed to sell OPL NZ to Cigna Corporation. The transaction completed on 30 November 2018 and the Group recognised a $197 million net gain on sale in the March 2019 half, comprising a $115 million gain on the reversal of the life-to-date cash profit adjustments on the revaluation of policy liabilities sold, a $56 million gain on sale, and a $26 million release from the foreign currency translation reserve. In the September 2019 half a $7 million surplus provision was released.
| • | Papua New Guinea Retail, Commercial and Small-Medium Sized Enterprise businesses (PNG Retail, Commercial and SME) |
In June 2018, the Group announced it had entered into an agreement to sell its Retail, Commercial and Small-Medium Sized Enterprise (SME) banking businesses in Papua New Guinea to Kina Bank. The transaction completed on 23 September 2019 and the Group recognised a gain of $1 million net of costs associated with the sale.
Other large/notable items
| • | Customer remediation |
Customer remediation includes provisions for expected refunds to customers, remediation project costs and related customer and regulatory claims, penalties and litigation outcomes.
Customer remediation charges of $129 million have been recognised in the March 2020 half (Sep 19 half: $485 million; Mar 19 half: $100 million). $58 million relates to customer remediation impacting operating income (Sep 19 half: $148 million; Mar 19 half: $64 million), and $71 million relates to customer remediation impacting operating expenses (Sep 19 half: $337 million; Mar 19 half: $36 million).
| • | Royal Commission legal costs |
External legal costs associated with responding to the Banking Royal Commission, which completed in February 2019, were nil for the March 2020 half (Sep 19 half: $2 million; Mar 19 half: $13 million).
| • | Restructuring |
The Group recognised restructuring expenses of $105 million in the March 2020 half (Sep 19 half: $26 million; Mar 19 half: $51 million) largely relating to business and property changes in Australia Retail and Commercial division.
| • | Lease-related items |
In the March 2020 half, the Group recognised $83 million of additional charges associated with the adoption of the new lease accounting standard on 1 October 2019. Comparative information has not been restated for the adoption of the new lease accounting standard.
| • | Asian associate impairments |
During the March 2020 half, the Group recognised a $815 million impairment in respect of two of the Group’s equity accounted investments to adjust their carrying values in line with their value-in-use calculations (refer Note 1 (iv) of the Condensed Consolidated Financial Statements). AMMB
Holdings Berhad (AmBank) was impaired by $595 million and PT Bank Pan Indonesia (PT Panin) was impaired by $220 million.
13
SUMMARY
Large/Notable items - continuing operations
| Cash Profit Results | March 2020 Half Year vs March 2019 Half Year | March 2020 Half Year vs September 2019 Half Year | ||||||||||||||||||||||||||||||||||||||||||||||||||||||||
| Mar 20 $M |
Large/ notables $M |
Mar 20 ex. Large/ notables $M |
Mar 19 $M |
Large/ notables $M |
Mar 19 ex. Large/ notables $M |
Movt ex. Large/ notables % |
Mar 20 $M |
Large/ notables $M |
Mar 20 ex. Large/ notables $M |
Sep 19 $M |
Large/ notables $M |
Sep 19 ex. Large/ notables $M |
Movt ex. Large/ notables % |
|||||||||||||||||||||||||||||||||||||||||||||
| Net interest income |
7,222 | (43 | ) | 7,265 | 7,299 | 7 | 7,292 | 0% | 7,222 | (43 | ) | 7,265 | 7,040 | (98 | ) | 7,138 | 2% | |||||||||||||||||||||||||||||||||||||||||
| Other operating income |
1,357 | (839 | ) | 2,196 | 2,447 | 231 | 2,216 | -1% | 1,357 | (839 | ) | 2,196 | 2,243 | 3 | 2,240 | -2% | ||||||||||||||||||||||||||||||||||||||||||
| Operating income |
8,579 | (882 | ) | 9,461 | 9,746 | 238 | 9,508 | 0% | 8,579 | (882 | ) | 9,461 | 9,283 | (95 | ) | 9,378 | 1% | |||||||||||||||||||||||||||||||||||||||||
| Operating expenses |
(4,605 | ) | (250 | ) | (4,355 | ) | (4,365 | ) | (125 | ) | (4,240 | ) | 3% | (4,605 | ) | (250 | ) | (4,355 | ) | (4,706 | ) | (384 | ) | (4,322 | ) | 1% | ||||||||||||||||||||||||||||||||
| Profit before credit impairment and income tax |
3,974 | (1,132 | ) | 5,106 | 5,381 | 113 | 5,268 | -3% | 3,974 | (1,132 | ) | 5,106 | 4,577 | (479 | ) | 5,056 | 1% | |||||||||||||||||||||||||||||||||||||||||
| Credit impairment charge |
(1,674 | ) | - | (1,674 | ) | (393 | ) | 1 | (394 | ) | large | (1,674 | ) | - | (1,674 | ) | (402 | ) | (2 | ) | (400 | ) | large | |||||||||||||||||||||||||||||||||||
| Profit/(Loss) before income tax |
2,300 | (1,132 | ) | 3,432 | 4,988 | 114 | 4,874 | -30% | 2,300 | (1,132 | ) | 3,432 | 4,175 | (481 | ) | 4,656 | -26% | |||||||||||||||||||||||||||||||||||||||||
| Income tax benefit/(expense) and non-controlling interests |
(887 | ) | 94 | (981 | ) | (1,424 | ) | (17 | ) | (1,407 | ) | -30% | (887 | ) | 94 | (981 | ) | (1,269 | ) | 82 | (1,351 | ) | -27% | |||||||||||||||||||||||||||||||||||
| Cash profit/(loss) from continuing operations |
1,413 | (1,038 | ) | 2,451 | 3,564 | 97 | 3,467 | -29% | 1,413 | (1,038 | ) | 2,451 | 2,906 | (399 | ) | 3,305 | -26% | |||||||||||||||||||||||||||||||||||||||||
|
|
||||||||||||||||||||||||||||||||||||||||||||||||||||||||||
| Cash Profit/(Loss) By Division |
March 2020 Half Year vs March 2019 Half Year | March 2020 Half Year vs September 2019 Half Year | ||||||||||||||||||||||||||||||||||||||||||||||||||||||||
| Mar 20 $M |
Large/ notables $M |
Mar 20 ex. Large/ notables $M |
Mar 19 $M |
Large/ notables $M |
Mar 19 ex. Large/ notables $M |
Movt ex. Large/ notables % |
Mar 20 $M |
Large/ notables $M |
Mar 20 ex. Large/ notables $M |
Sep 19 $M |
Large/ notables $M |
Sep 19 ex. Large/ notables $M |
Movt ex. Large/ notables % |
|||||||||||||||||||||||||||||||||||||||||||||
| Australia Retail and Commercial |
1,214 | (153 | ) | 1,367 | 1,703 | (83 | ) | 1,786 | -23% | 1,214 | (153 | ) | 1,367 | 1,492 | (303 | ) | 1,795 | -24% | ||||||||||||||||||||||||||||||||||||||||
| Institutional |
610 | (12 | ) | 622 | 1,012 | 8 | 1,004 | -38% | 610 | (12 | ) | 622 | 816 | (32 | ) | 848 | -27% | |||||||||||||||||||||||||||||||||||||||||
| New Zealand |
567 | (28 | ) | 595 | 753 | 14 | 739 | -19% | 567 | (28 | ) | 595 | 646 | (58 | ) | 704 | -15% | |||||||||||||||||||||||||||||||||||||||||
| Pacific |
20 | (3 | ) | 23 | 33 | - | 33 | -30% | 20 | (3 | ) | 23 | 26 | (14 | ) | 40 | -43% | |||||||||||||||||||||||||||||||||||||||||
| TSO and Group Centre 1 |
(998 | ) | (842 | ) | (156 | ) | 63 | 158 | (95 | ) | 64% | (998 | ) | (842 | ) | (156 | ) | (74 | ) | 8 | (82 | ) | 90% | |||||||||||||||||||||||||||||||||||
| Cash profit/(loss) from continuing operations |
1,413 | (1,038 | ) | 2,451 | 3,564 | 97 | 3,467 | -29% | 1,413 | (1,038 | ) | 2,451 | 2,906 | (399 | ) | 3,305 | -26% | |||||||||||||||||||||||||||||||||||||||||
| 1. | TSO and Group Centre includes the Gain/(Loss) on sale from divestments in the September 2019 half and March 2019 half. It also includes the divested business results for the completed sales of Paymark in the March 2019 half. |
14
SUMMARY
Large/Notable items - continuing operations
Within continuing cash profit, the Group has recognised some large/notable items. These items are shown in the tables below.
| March 2020 Half Year | March 2019 Half Year | |||||||||||||||||||||||||||||||||||||||||||||||
| Large/notable items included in continuing cash profit | Large/notable items included in continuing cash profit | |||||||||||||||||||||||||||||||||||||||||||||||
| Customer remediation $M |
Restructuring $M |
Lease-related $M |
Asian associate impairments $M |
Total $M |
Gain/(Loss) on sale from divestments $M |
Divested business results1 $M |
Customer remediation $M |
Royal Commission legal costs $M |
Restructuring $M |
Total $M | ||||||||||||||||||||||||||||||||||||||
| Cash Profit |
||||||||||||||||||||||||||||||||||||||||||||||||
| Net interest income |
(22 | ) | - | (21 | ) | - | (43 | ) | - | 29 | (22 | ) | - | - | 7 | |||||||||||||||||||||||||||||||||
| Other operating income |
(36 | ) | - | 12 | (815 | ) | (839 | ) | 234 | 39 | (42 | ) | - | - | 231 | |||||||||||||||||||||||||||||||||
| Operating income |
(58 | ) | - | (9 | ) | (815 | ) | (882 | ) | 234 | 68 | (64 | ) | - | - | 238 | ||||||||||||||||||||||||||||||||
| Operating expenses |
(71 | ) | (105 | ) | (74 | ) | - | (250 | ) | - | (25 | ) | (36 | ) | (13 | ) | (51 | ) | (125 | ) | ||||||||||||||||||||||||||||
| Profit before credit impairment and income tax |
(129 | ) | (105 | ) | (83 | ) | (815 | ) | (1,132 | ) | 234 | 43 | (100 | ) | (13 | ) | (51 | ) | 113 | |||||||||||||||||||||||||||||
| Credit impairment charge |
- | - | - | - | - | - | 1 | - | - | - | 1 | |||||||||||||||||||||||||||||||||||||
| Profit before income tax |
(129 | ) | (105 | ) | (83 | ) | (815 | ) | (1,132 | ) | 234 | 44 | (100 | ) | (13 | ) | (51 | ) | 114 | |||||||||||||||||||||||||||||
| Income tax benefit/(expense) and non-controlling interests |
38 | 31 | 25 | - | 94 | (47 | ) | (19 | ) | 30 | 4 | 15 | (17 | ) | ||||||||||||||||||||||||||||||||||
| Cash profit/(loss) from continuing operations |
(91 | ) | (74 | ) | (58 | ) | (815 | ) | (1,038 | ) | 187 | 25 | (70 | ) | (9 | ) | (36 | ) | 97 | |||||||||||||||||||||||||||||
| March 2020 Half Year | September 2019 Half Year | |||||||||||||||||||||||||||||||||||||||||||||||
| Large/notable items included in continuing cash profit | Large/notable items included in continuing cash profit | |||||||||||||||||||||||||||||||||||||||||||||||
| Customer remediation $M |
Restructuring $M |
Lease-related $M |
Asian associate impairments $M |
Total $M |
Gain/(Loss) on sale from divestments $M |
Divested business results1 $M |
Customer remediation $M |
Royal Commission legal costs $M |
Restructuring $M |
Total $M | ||||||||||||||||||||||||||||||||||||||
| Cash Profit |
||||||||||||||||||||||||||||||||||||||||||||||||
| Net interest income |
(22 | ) | - | (21 | ) | - | (43 | ) | - | 21 | (119 | ) | - | - | (98 | ) | ||||||||||||||||||||||||||||||||
| Other operating income |
(36 | ) | - | 12 | (815 | ) | (839 | ) | 18 | 14 | (29 | ) | - | - | 3 | |||||||||||||||||||||||||||||||||
| Operating income |
(58 | ) | - | (9 | ) | (815 | ) | (882 | ) | 18 | 35 | (148 | ) | - | - | (95 | ) | |||||||||||||||||||||||||||||||
| Operating expenses |
(71 | ) | (105 | ) | (74 | ) | - | (250 | ) | - | (19 | ) | (337 | ) | (2 | ) | (26 | ) | (384 | ) | ||||||||||||||||||||||||||||
| Profit before credit impairment and income tax |
(129 | ) | (105 | ) | (83 | ) | (815 | ) | (1,132 | ) | 18 | 16 | (485 | ) | (2 | ) | (26 | ) | (479 | ) | ||||||||||||||||||||||||||||
| Credit impairment charge |
- | - | - | - | - | - | (2 | ) | - | - | - | (2 | ) | |||||||||||||||||||||||||||||||||||
| Profit before income tax |
(129 | ) | (105 | ) | (83 | ) | (815 | ) | (1,132 | ) | 18 | 14 | (485 | ) | (2 | ) | (26 | ) | (481 | ) | ||||||||||||||||||||||||||||
| Income tax benefit/(expense) and non-controlling interests |
38 | 31 | 25 | - | 94 | - | (7 | ) | 80 | 1 | 8 | 82 | ||||||||||||||||||||||||||||||||||||
| Cash profit/(loss) from continuing operations |
(91 | ) | (74 | ) | (58 | ) | (815 | ) | (1,038 | ) | 18 | 7 | (405 | ) | (1 | ) | (18 | ) | (399 | ) | ||||||||||||||||||||||||||||
| 1. | Relates to business results for completed divestments. |
15
SUMMARY
Large/Notable items - continuing operations
Within continuing cash profit, the Group has recognised some large/notable items. The impact of these items on the divisional results are shown in the tables below.
| March 2020 Half Year | March 2019 Half Year | |||||||||||||||||||||||||||||||||||||||||||||
| Large/notable items included in continuing cash profit | Large/notable items included in continuing cash profit | |||||||||||||||||||||||||||||||||||||||||||||
| Customer remediation $M |
Restructuring $M |
Lease-related $M |
Asian associate impairments $M |
Total $M |
Gain/(Loss) on sale from divestments $M |
Divested business results1 $M |
Customer remediation $M |
Royal Commission legal costs $M |
Restructuring $M |
Total $M |
||||||||||||||||||||||||||||||||||||
| Profit before income tax |
||||||||||||||||||||||||||||||||||||||||||||||
| Australia Retail and Commercial |
(101 | ) | (85 | ) | (32 | ) | - | (218 | ) | - | - | (100 | ) | - | (19 | ) | (119 | ) | ||||||||||||||||||||||||||||
| Institutional |
- | (4 | ) | (11 | ) | - | (15 | ) | - | 29 | - | - | (7 | ) | 22 | |||||||||||||||||||||||||||||||
| New Zealand |
(26 | ) | (11 | ) | (3 | ) | - | (40 | ) | - | 20 | - | - | (2 | ) | 18 | ||||||||||||||||||||||||||||||
| Pacific |
(2 | ) | - | (2 | ) | - | (4 | ) | - | - | - | - | - | - | ||||||||||||||||||||||||||||||||
| TSO and Group Centre2 |
- | (5 | ) | (35 | ) | (815 | ) | (855 | ) | 234 | (5 | ) | - | (13 | ) | (23 | ) | 193 | ||||||||||||||||||||||||||||
| Profit before income tax |
(129 | ) | (105 | ) | (83 | ) | (815 | ) | (1,132 | ) | 234 | 44 | (100 | ) | (13 | ) | (51 | ) | 114 | |||||||||||||||||||||||||||
| Income tax benefit/(expense) and non-controlling interests |
38 | 31 | 25 | - | 94 | (47 | ) | (19 | ) | 30 | 4 | 15 | (17 | ) | ||||||||||||||||||||||||||||||||
| Cash profit/(loss) from continuing operations |
(91 | ) | (74 | ) | (58 | ) | (815 | ) | (1,038 | ) | 187 | 25 | (70 | ) | (9 | ) | (36 | ) | 97 | |||||||||||||||||||||||||||
| March 2020 Half Year | September 2019 Half Year | |||||||||||||||||||||||||||||||||||||||||||||
| Large/notable items included in continuing cash profit | Large/notable items included in continuing cash profit | |||||||||||||||||||||||||||||||||||||||||||||
| Customer remediation $M |
Restructuring $M |
Lease-related items $M |
Asian associate impairments $M |
Total $M |
Gain/(Loss) on sale from divestments $M |
Divested business results1 $M |
Customer remediation $M |
Royal Commission legal costs $M |
Restructuring $M |
Total $M |
||||||||||||||||||||||||||||||||||||
| Profit before income tax |
||||||||||||||||||||||||||||||||||||||||||||||
| Australia Retail and Commercial |
(101 | ) | (85 | ) | (32 | ) | - | (218 | ) | - | - | (347 | ) | - | (1 | ) | (348 | ) | ||||||||||||||||||||||||||||
| Institutional |
- | (4 | ) | (11 | ) | - | (15 | ) | - | 17 | (49 | ) | - | (9 | ) | (41 | ) | |||||||||||||||||||||||||||||
| New Zealand |
(26 | ) | (11 | ) | (3 | ) | - | (40 | ) | - | - | (75 | ) | - | (6 | ) | (81 | ) | ||||||||||||||||||||||||||||
| Pacific |
(2 | ) | - | (2 | ) | - | (4 | ) | - | - | (14 | ) | - | - | (14 | ) | ||||||||||||||||||||||||||||||
| TSO and Group Centre2 |
- | (5 | ) | (35 | ) | (815 | ) | (855 | ) | 18 | (3 | ) | - | (2 | ) | (10 | ) | 3 | ||||||||||||||||||||||||||||
| Profit before income tax |
(129 | ) | (105 | ) | (83 | ) | (815 | ) | (1,132 | ) | 18 | 14 | (485 | ) | (2 | ) | (26 | ) | (481 | ) | ||||||||||||||||||||||||||
| Income tax benefit/(expense) and non-controlling interests |
38 | 31 | 25 | - | 94 | - | (7 | ) | 80 | 1 | 8 | 82 | ||||||||||||||||||||||||||||||||||
| Cash profit/(loss) from continuing operations |
(91 | ) | (74 | ) | (58 | ) | (815 | ) | (1,038 | ) | 18 | 7 | (405 | ) | (1 | ) | (18 | ) | (399 | ) | ||||||||||||||||||||||||||
| 1. | Relates to business results for completed divestments. |
| 2. | TSO and Group Centre includes the Gain/(Loss) on sale from divestments in the September 2019 half and March 2019 half. It also includes the divested business results for the completed sales of Paymark in the March 2019 half. |
16
SUMMARY
Full Time Equivalent Staff
As at 31 March 2020, ANZ employed 38,939 staff (Sep 19: 39,060; Mar 19: 39,359) on a full-time equivalent (FTE) basis.
| Division | As at | Movement | ||||||||||||||||||
| Mar 20 | Sep 19 | Mar 19 | Mar 20 v. Sep 19 |
Mar 20 v. Mar 19 |
||||||||||||||||
| Australia Retail and Commercial |
14,061 | 13,903 | 13,660 | 1% | 3% | |||||||||||||||
| Institutional1 |
5,350 | 5,468 | 6,085 | -2% | -12% | |||||||||||||||
| New Zealand |
6,103 | 6,121 | 6,003 | 0% | 2% | |||||||||||||||
| Pacific |
1,108 | 1,086 | 1,096 | 2% | 1% | |||||||||||||||
| TSO and Group Centre |
11,212 | 11,010 | 10,520 | 2% | 7% | |||||||||||||||
| Total FTE from continuing operations |
37,834 | 37,588 | 37,364 | 1% | 1% | |||||||||||||||
| Discontinued operations2 |
1,105 | 1,472 | 1,995 | -25% | -45% | |||||||||||||||
| Total FTE |
38,939 | 39,060 | 39,359 | 0% | -1% | |||||||||||||||
| Average FTE |
39,154 | 39,147 | 39,571 | 0% | -1% | |||||||||||||||
| Geography | As at | Movement | ||||||||||||||||||
| Mar 20 | Sep 19 | Mar 19 | Mar 20 v. Sep 19 |
Mar 20 v. Mar 19 |
||||||||||||||||
| Australia |
18,823 | 18,874 | 18,652 | 0% | 1% | |||||||||||||||
| Asia, Pacific, Europe & America1 |
12,584 | 12,695 | 13,396 | -1% | -6% | |||||||||||||||
| New Zealand |
7,532 | 7,491 | 7,311 | 1% | 3% | |||||||||||||||
| Total FTE |
38,939 | 39,060 | 39,359 | 0% | -1% | |||||||||||||||
|
1. Institutional division FTE reduced by 606 as a result of the Cambodia JV and PNG Retail, Commercial and SME divestments completed in the September 2019 half.
2. The discontinued operations FTE is based on an estimate of the staff working in the divested businesses based on an allocation methodology and includes staff retained in the Group working on transitioning the sold businesses to the purchasers. |
| |||||||||||||||||||
| Other Non-Financial Information
|
| |||||||||||||||||||
| Half Year | Movement | |||||||||||||||||||
| Shareholder value - ordinary shares | Mar 20 | Sep 19 | Mar 19 | Mar 20 v. Sep 19 |
Mar 20 v. Mar 19 |
|||||||||||||||
| Share price ($) |
||||||||||||||||||||
| - high |
28.79 | 29.30 | 28.36 | -2% | 2% | |||||||||||||||
| - low |
14.10 | 25.36 | 22.98 | -44% | -39% | |||||||||||||||
| - closing |
16.96 | 28.52 | 26.03 | -41% | -35% | |||||||||||||||
| Closing market capitalisation of ordinary shares ($B) |
48.1 | 80.8 | 73.7 | -40% | -35% | |||||||||||||||
| Total shareholder returns (TSR) |
-38.7% | 12.9% | -4.8% | large | large | |||||||||||||||
| As at Mar 20 | ||||||||||||
| Credit Ratings | Short- Term |
Long- Term |
Outlook | |||||||||
| Moody’s Investor Services |
P1 | Aa3 | Stable | |||||||||
| Standard & Poor’s |
A-1+ | AA- | Stable | |||||||||
| Fitch Ratings |
F1+ | AA- | Negative | |||||||||
On 7 April 2020 Fitch Ratings downgraded the Short-term credit rating to F1 and the Long-term credit rating to A+. The outlook remains negative.
On 8 April 2020 Standard & Poor’s revised the outlook to negative.
17
SUMMARY
This page has been left blank intentionally
18
GROUP RESULTS
| CONTENTS | Page | |||
| Cash Profit |
20 | |||
| Net Interest Income - continuing operations |
21 | |||
| Other Operating Income - continuing operations |
23 | |||
| Operating Expenses - continuing operations |
26 | |||
| Software Capitalisation - continuing operations |
28 | |||
| Credit Risk - continuing operations |
29 | |||
| Income Tax Expense - continuing operations |
35 | |||
| Impact of Foreign Currency Translation - continuing operations |
36 | |||
| Earnings Related Hedges - continuing operations |
37 | |||
| Earnings per Share - continuing operations |
37 | |||
| Dividends - continuing operations |
38 | |||
| Condensed Balance Sheet - including discontinued operations |
39 | |||
| Liquidity Risk - including discontinued operations |
40 | |||
| Funding - including discontinued operations |
41 | |||
| Capital Management - including discontinued operations |
42 | |||
| Leverage Ratio - including discontinued operations |
44 | |||
| Capital Management - Other Developments |
45 | |||
19
GROUP RESULTS
Non-IFRS Information
Statutory profit is prepared in accordance with recognition and measurement requirements of Australian Accounting Standards, which comply with International Financial Reporting Standards (IFRS). The Group provides additional measures of performance in the Consolidated Financial Report & Dividend Announcement which are prepared on a basis other than in accordance with accounting standards. The guidance provided in Australian Securities and Investments Commission (ASIC) Regulatory Guide 230 has been followed when presenting this information.
Cash Profit
Cash profit, a non-IFRS measure, represents ANZ’s preferred measure of the result of the core business activities of the Group, enabling readers to assess Group and Divisional performance against prior periods and against peer institutions. To calculate cash profit, the Group excludes non-core items from statutory profit (refer to Definitions on pages 139 to 140 for further details). The adjustments made in arriving at cash profit are included in statutory profit which is subject to review within the context of the external auditor’s review of the Condensed Consolidated Financial Statements. Cash profit is not subject to review by the external auditor. The external auditor has informed the Audit Committee that cash profit adjustments have been determined on a consistent basis across each period presented.
This Group Results section is reported on a cash profit basis for continuing operations unless otherwise stated. For information on discontinued operations please refer to the Guide to Half Year Results on page 8.
| Half Year | Movement | |||||||||||||||||||
| Mar 20 $M |
Sep 19 $M |
Mar 19 $M |
Mar 20 v. Sep 19 |
Mar 20 v. Mar 19 | ||||||||||||||||
| Statutory profit attributable to shareholders of the Company from continuing operations |
1,635 | 3,053 | 3,243 | -46% | -50% | |||||||||||||||
| Adjustments between statutory profit and cash profit1 |
||||||||||||||||||||
| Revaluation of policy liabilities |
- | - | 77 | n/a | -100% | |||||||||||||||
| Economic hedges |
(340 | ) | (67 | ) | 185 | large | large | |||||||||||||
| Revenue and expense hedges |
120 | (79 | ) | 60 | large | 100% | ||||||||||||||
| Structured credit intermediation trades |
(2 | ) | (1 | ) | (1 | ) | 100% | 100% | ||||||||||||
| Total adjustments between statutory profit and cash profit from continuing operations | (222 | ) | (147 | ) | 321 | 51% | large | |||||||||||||
| Cash profit from continuing operations |
1,413 | 2,906 | 3,564 | -51% | -60% | |||||||||||||||
|
1. Refer to pages 71 to 75 for analysis of the adjustments between statutory profit and cash profit. |
||||||||||||||||||||
| Group performance - cash profit | Half Year | Movement | ||||||||||||||||||
| Mar 20 $M |
Sep 19 $M |
Mar 19 $M |
Mar 20 v. Sep 19 |
Mar 20 v. Mar 19 | ||||||||||||||||
| Net interest income |
7,222 | 7,040 | 7,299 | 3% | -1% | |||||||||||||||
| Other operating income |
1,357 | 2,243 | 2,447 | -40% | -45% | |||||||||||||||
| Operating income |
8,579 | 9,283 | 9,746 | -8% | -12% | |||||||||||||||
| Operating expenses |
(4,605 | ) | (4,706 | ) | (4,365 | ) | -2% | 5% | ||||||||||||
| Profit before credit impairment and income tax |
3,974 | 4,577 | 5,381 | -13% | -26% | |||||||||||||||
| Credit impairment charge |
(1,674 | ) | (402 | ) | (393 | ) | large | large | ||||||||||||
| Profit before income tax |
2,300 | 4,175 | 4,988 | -45% | -54% | |||||||||||||||
| Income tax expense |
(886 | ) | (1,263 | ) | (1,415 | ) | -30% | -37% | ||||||||||||
|
Non-controlling interests |
(1 | ) | (6 | ) | (9 | ) | -83% | -89% | ||||||||||||
| Cash profit from continuing operations |
1,413 | 2,906 | 3,564 | -51% | -60% | |||||||||||||||
| Half Year | Movement | |||||||||||||||||||
| Cash profit/(loss) by Division | Mar 20 $M |
Sep 19 $M |
Mar 19 $M |
Mar 20 v. Sep 19 |
Mar 20 v. Mar 19 | |||||||||||||||
| Australia Retail and Commercial |
1,214 | 1,492 | 1,703 | -19% | -29% | |||||||||||||||
| Institutional |
610 | 816 | 1,012 | -25% | -40% | |||||||||||||||
| New Zealand |
567 | 646 | 753 | -12% | -25% | |||||||||||||||
| Pacific |
20 | 26 | 33 | -23% | -39% | |||||||||||||||
| TSO and Group Centre |
(998 | ) | (74 | ) | 63 | large | large | |||||||||||||
| Cash profit from continuing operations |
1,413 | 2,906 | 3,564 | -51% | -60% | |||||||||||||||
20
GROUP RESULTS
Net Interest Income - continuing operations
| Half Year | Movement | |||||||||||||||||||
| Group | Mar 20 $M |
Sep 19 $M |
Mar 19 $M |
Mar 20 v. Sep 19 |
Mar 20 v. Mar 19 |
|||||||||||||||
| Cash net interest income1 |
7,222 | 7,040 | 7,299 | 3% | -1% | |||||||||||||||
| Average interest earning assets2 |
856,652 | 814,831 | 811,528 | 5% | 6% | |||||||||||||||
| Average deposits and other borrowings2 |
669,342 | 642,448 | 635,822 | 4% | 5% | |||||||||||||||
| Net interest margin (%) - cash |
1.69 | 1.72 | 1.80 | -3 bps | -11 bps | |||||||||||||||
| Group (excluding Markets business unit) |
||||||||||||||||||||
| Cash net interest income1 |
6,822 | 6,829 | 7,019 | 0% | -3% | |||||||||||||||
| Average interest earning assets2 |
576,494 | 566,907 | 563,579 | 2% | 2% | |||||||||||||||
| Average deposits and other borrowings2 |
477,861 | 462,283 | 459,478 | 3% | 4% | |||||||||||||||
| Net interest margin (%) - cash |
2.37 | 2.40 | 2.50 | -3 bps | -13 bps | |||||||||||||||
| Half Year | Movement | |||||||||||||||||||
| Cash profit net interest margin by major division1 | Mar 20 $M |
Sep 19 $M |
Mar 19 $M |
Mar 20 v. Sep 19 |
Mar 20 v. Mar 19 |
|||||||||||||||
| Australia Retail and Commercial |
||||||||||||||||||||
| Net interest margin (%) - cash |
2.65 | 2.58 | 2.61 | 7 bps | 4 bps | |||||||||||||||
| Average interest earning assets |
305,981 | 309,684 | 314,215 | -1% | -3% | |||||||||||||||
| Average deposits and other borrowings |
210,214 | 204,791 | 202,765 | 3% | 4% | |||||||||||||||
| Institutional |
||||||||||||||||||||
| Net interest margin (%) - cash |
0.78 | 0.80 | 0.85 | -2 bps | -7 bps | |||||||||||||||
| Average interest earning assets2 |
415,490 | 375,573 | 372,270 | 11% | 12% | |||||||||||||||
| Average deposits and other borrowings2 |
305,506 | 290,948 | 281,770 | 5% | 8% | |||||||||||||||
| New Zealand |
||||||||||||||||||||
| Net interest margin (%) - cash |
2.31 | 2.27 | 2.39 | 4 bps | -8 bps | |||||||||||||||
| Average interest earning assets2 |
121,955 | 118,714 | 116,201 | 3% | 5% | |||||||||||||||
| Average deposits and other borrowings2 |
90,329 | 86,970 | 86,244 | 4% | 5% | |||||||||||||||
| 1. | Includes large/notable items of -$43 million for the March 2020 half (Sep 19 half: -$98 million; Mar 19 half: $7 million). Refer to pages 13 to 16 for further details on large/notable items. Also includes the major bank levy of -$196 million for the March 2020 half (Sep 19 half: -$185 million; Mar 19 half: -$178 million). |
| 2. | Average balance sheet amounts include assets and liabilities classified as held for sale from continuing operations in the September 2019 half and the March 2019 half. |
Group net interest margin - March 2020 Half Year v March 2019 Half Year
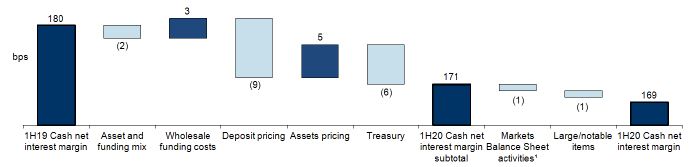
| 1. | Markets Balance Sheet activities includes the impact of discretionary liquid assets and other Balance Sheet activities. |
| • | March 2020 v March 2019 |
Net interest margin (-11 bps)
| • | Asset mix and funding mix (-2 bps): unfavourable asset mix from the impacts of customer switching from interest only to principal and interest home loans in the Australia Retail and Commercial division, unfavourable mix impacts from a higher proportion of Institutional lending, partly offset by favourable deposit mix. |
| • | Wholesale funding costs (+3 bps): favourable short term funding spreads and broadly stable long term funding costs. |
| • | Deposit pricing (-9 bps): margin compression from lower interest rates in all divisions. |
| • | Assets pricing (+5 bps): re-pricing of home loans in the Australia Retail and Commercial division, partially offset by increased competition in all divisions. |
| • | Treasury (-6 bps): lower earnings on capital and replicated deposits reflecting a lower interest rate environment. |
21
GROUP RESULTS
| • | Markets Balance Sheet activities (-1 bps): growth in lower interest margin Markets Balance Sheet trading activities and the impact of flattening yield curve. This was partially offset by higher net interest income from Rates and Balance Sheet activity. |
| • | Large/notable items (-1 bps): the impact of lease-related items in the Mar 2020 half and divested businesses in the Mar 2019 half. |
Average interest earning assets (+$45.1 billion or +6%)
| • | Average net loans and advances (+$18.7 billion or +3%): increase primarily driven by growth in Institutional lending, home loan growth in the New Zealand division, and foreign currency translation movements. |
| • | Average trading and investment securities (+$12.1 billion or +11%): increase primarily driven by higher liquid assets and trading securities in Markets and the impact of foreign currency translation movements. |
| • | Average cash and other liquids (+$14.3 billion or +13%): increase primarily driven by higher central bank cash balances, higher collateral balances and the impact of foreign currency translation movements. |
Average deposits and other borrowings (+$33.5 billion or +5%)
| • | Average deposits and other borrowings (+$33.5 billion or +5%): increase driven by growth in deposits in all divisions, but particularly in Institutional division, and the impact of foreign currency translation movements. |
Group net interest margin - March 2020 Half Year v September 2019 Half Year
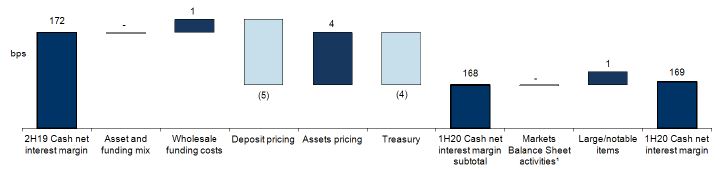
| 1. | Markets Balance Sheet activities includes the impact of discretionary liquid assets and other Balance Sheet activities. |
| • | March 2020 v September 2019 |
Net interest margin (-3 bps)
| • | Asset mix and funding mix (0 bps): unfavourable product mix from the impacts of customer switching from interest only to principal and interest home loans in the Australia Retail and Commercial division, unfavourable mix impacts from a higher proportion of Institutional lending offset by favourable deposit mix. |
| • | Wholesale funding costs (+1 bps): favourable short term funding spreads and broadly stable long term funding costs. |
| • | Deposit pricing (-5 bps): margin compression from lower rates in all divisions. |
| • | Assets pricing (+4 bps): re-pricing in Australia Retail and Commercial and New Zealand divisions, partially offset by increased competition applying to all divisions. |
| • | Treasury (-4 bps): lower earnings on capital and replicated deposits reflecting a lower interest rate environment. |
| • | Markets Balance Sheet activities (0 bps): growth in the lower margin Markets Balance Sheet trading activities offset by higher net interest income from Rates and Balance Sheet activity. |
| • | Large/notable (+1 bps): the impact of higher customer remediation in the September 2019 half. |
Average interest earning assets (+$41.8 billion or 5%)
| • | Average net loans and advances (+$14.7 billion or +2%): increase primarily driven by growth in Institutional lending, home loans in the New Zealand division, and the impact of foreign currency translation movements. This was partially offset by a reduction in lending in the Australia Retail and Commercial division. |
| • | Average trading and investment securities (+$8.1 billion or +7%): increase primarily driven by an increase in liquid assets in Markets and the impact of foreign currency translation movements. |
| • | Average cash and other liquids (+$19.0 billion or 18%): increase primarily driven by higher central bank cash balances, and the impact of foreign currency translation movements. |
Average deposits and other borrowings (+$26.9 billion or +4%)
| • | Average deposits and other borrowings (+$26.9 billion or +4%): increase driven predominantly by growth in the Institutional division, and the impact of foreign currency translation movements. |
22
GROUP RESULTS
Other Operating Income - continuing operations
| Half Year | Movement | |||||||||||||||||||
| Mar 20 $M |
Sep 19 $M |
Mar 19 $M |
Mar 20 v. Sep 19 |
Mar 20 v. Mar 19 | ||||||||||||||||
| Net fee and commission income1 |
1,135 | 1,275 | 1,218 | -11% | -7% | |||||||||||||||
| Markets other operating income |
764 | 619 | 667 | 23% | 15% | |||||||||||||||
| Share of associates’ profit1 |
135 | 131 | 131 | 3% | 3% | |||||||||||||||
| Other1,2 |
(677 | ) | 218 | 431 | large | large | ||||||||||||||
| Total cash other operating income from continuing operations3 |
1,357 | 2,243 | 2,447 | -40% | -45% | |||||||||||||||
| Half Year | Movement | |||||||||||||||||||
| Other operating income by division | Mar 20 $M |
Sep 19 $M |
Mar 19 $M |
Mar 20 v. Sep 19 |
Mar 20 v. Mar 19 | |||||||||||||||
| Australia Retail and Commercial |
595 | 696 | 651 | -15% | -9% | |||||||||||||||
| Institutional |
1,167 | 1,066 | 1,126 | 9% | 4% | |||||||||||||||
| New Zealand |
247 | 278 | 302 | -11% | -18% | |||||||||||||||
| Pacific |
50 | 54 | 50 | -7% | 0% | |||||||||||||||
| TSO and Group Centre |
(702 | ) | 149 | 318 | large | large | ||||||||||||||
| Total cash other operating income from continuing operations3 |
1,357 | 2,243 | 2,447 | -40% | -45% | |||||||||||||||
| 1. | Excluding Markets. |
| 2. | Includes foreign exchange earnings, net income from insurance business and impairment of Asian associates. |
| 3. | Includes large/notable items of -$839 million for the March 2020 half (Sep 19 half: $3 million; Mar 19 half: $231 million). Refer to items on pages 13 to 16 for further details on large/notable items. |
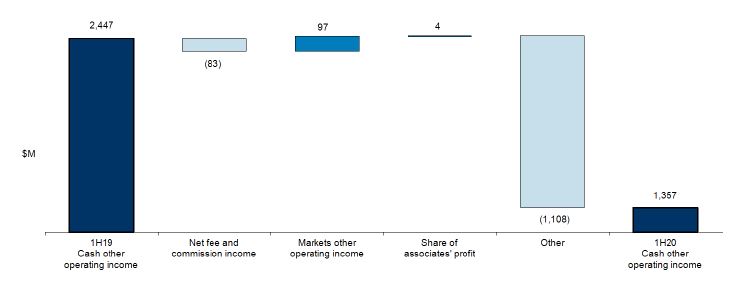
Other operating income - March 2020 Half Year v March 2019 Half Year
| Markets income | Half Year | Movement | ||||||||||||||||||
| Mar 20 $M |
Sep 19 $M |
Mar 19 $M |
Mar 20 v. Sep 19 |
Mar 20 v. Mar 19 | ||||||||||||||||
| Net interest income |
400 | 211 | 280 | 90% | 43% | |||||||||||||||
| Other operating income |
764 | 619 | 667 | 23% | 15% | |||||||||||||||
| Total cash Markets income from continuing operations |
1,164 | 830 | 947 | 40% | 23% | |||||||||||||||
23
GROUP RESULTS
| Other operating income (excluding large/notable items) | Half Year | Movement | ||||||||||||||||||
| Mar 20 $M |
Sep 19 $M |
Mar 19 $M |
Mar 20 v. Sep 19 |
Mar 20 v. Mar 19 | ||||||||||||||||
| Net fee and commission income1 |
1,164 | 1,293 | 1,244 | -10% | -6% | |||||||||||||||
| Markets other operating income |
764 | 618 | 665 | 24% | 15% | |||||||||||||||
| Share of associates’ profit1 |
135 | 131 | 131 | 3% | 3% | |||||||||||||||
| Other1,2 |
133 | 198 | 176 | -33% | -24% | |||||||||||||||
| Total cash other operating income from continuing operations |
2,196 | 2,240 | 2,216 | -2% | -1% | |||||||||||||||
| Other operating income by division (excluding large/notable items) | Half Year | Movement | ||||||||||||||||||
| Mar 20 $M |
Sep 19 $M |
Mar 19 $M |
Mar 20 v. Sep 19 |
Mar 20 v. Mar 19 | ||||||||||||||||
| Australia Retail and Commercial |
625 | 704 | 693 | -11% | -10% | |||||||||||||||
| Institutional |
1,163 | 1,064 | 1,109 | 9% | 5% | |||||||||||||||
| New Zealand |
255 | 287 | 280 | -11% | -9% | |||||||||||||||
| Pacific |
50 | 54 | 50 | -7% | 0% | |||||||||||||||
| TSO and Group Centre |
103 | 131 | 84 | -21% | 23% | |||||||||||||||
| Total cash other operating income from continuing operations |
2,196 | 2,240 | 2,216 | -2% | -1% | |||||||||||||||
| 1. | Excluding Markets. |
| 2. | Includes foreign exchange earnings and net income from insurance business. |
| • | March 2020 v March 2019 |
Other operating income decreased by $1,090 million (-45%).
Net fee and commission income (-$83 million or -7%)
| • | $56 million decrease in the Australia Retail and Commercial division was primarily driven by the full period impact of fees removed in the prior period and lower volume related fees. |
| • | $28 million decrease in the New Zealand division primarily due to an increase in commission costs and a reduction in rebates. |
| • | $1 million increase due to other small items including lower customer remediation in the March 2020 half and higher commitment fees in the Transaction Banking business, partially offset by decreases due to the impact of divested business results and the slowdown of loan syndication activities. |
Markets income (+$217 million or +23%)
| • | $48 million increase in Franchise Sales due to demand from large corporate customers and financial institutions for FX, Commodities and Rates products. |
| • | $187 million increase in Franchise Trading across all asset classes primarily attributable to improved trading conditions, increased volumes, particularly in International, and favourable derivative valuation adjustments. |
| • | $18 million decrease in Balance Sheet trading primarily attributable to cuts in the Official Cash Rate in Australia. |
Share of associates’ profit (+$4 million or +3%)
| • | $4 million increase in profits from associates of which $4 million relates to PT Panin and $5 million relates to AmBank, partially offset by a $4 million reduction following the sale of Paymark. |
Other (-$1,108 million)
| • | $815 million decrease due to the impairment of PT Panin of $220 million and AmBank of $595 million. |
| • | $259 million decrease due to gains on sale ($234 million) from One Path Life NZ and Paymark in the March 2019 half and the impact of divested business results ($25 million) in the March 2019 half. |
| • | $34 million decrease in Institutional division due to widening credit spread impacts on loans measured at fair value. |
| • | Other small items including a gain on sale of an investment security in the March 2019 half and higher customer remediation in the March 2020 half were offset by the gross up of sublease income on adoption of the new leasing standard (comparatives not restated). |
Excluding large/notable items, other operating income decreased $20 million (-1%).
24
GROUP RESULTS
| • | March 2020 v September 2019 |
Other operating income decreased by $886 million (-40%).
Net fee and commission income (-$140 million or -11%)
| • | $84 million decrease in the Australia Retail and Commercial division was primarily driven by seasonality of unsecured portfolio rebates and incentives, and lower volume related fees. |
| • | $38 million decrease in the New Zealand division due to lower insurance commissions and higher commission costs. |
| • | $18 million decrease due to other small items including the impact of divested business results and a decrease in the Institutional division due to higher merchant scheme fees in the March 2020 half. |
Markets income (+$334 million or +40%)
| • | $46 million increase in Franchise Sales due to demand from large corporate customers and financial institutions for FX, Commodities and Rates products. |
| • | $240 million increase in Franchise Trading across all asset classes. Trading conditions supported the franchise from the start of the half, and then the increase in volatility in the second quarter drove higher risk premiums, which was combined with trading volume growth across all asset classes. This was partially offset by lower derivative valuation adjustments. |
| • | $48 million increase in Balance Sheet trading driven by steepening of yield curves. |
Share of associates’ profit (+$4 million or +3%)
| • | $4 million increase in profits from associates of which a $11 million increase relates to PT Panin partially offset by a decrease of $9 million relating to AmBank. |
Other (-$895 million)
| • | $815 million decrease due to the impairment of PT Panin of $220 million and AmBank of $595 million. |
| • | $44 million decrease in the Institutional division primarily due to widening credit spread impacts on loans measured at fair value. |
| • | $27 million decrease due to dividend income from Bank of Tianjin in the September 2019 half. |
| • | $21 million decrease due to gains on sale ($18 million) from Cambodia and OnePath Life (NZ) in the September 2019 half and the impact of divested business results ($3 million) in the September 2019 half. |
| • | $12 million increase due to other smaller items including an increase from the gross up of sublease income on the adoption of the new leasing standard and higher incentive receipts, partially offset by higher customer remediation in the March 2020 half. |
Excluding large/notable items, other operating income decreased $44 million (-2%).
25
GROUP RESULTS
Operating Expenses - continuing operations
| Half Year | Movement | |||||||||||||||||||
| Mar 20 $M |
Sep 19 $M |
Mar 19 $M |
Mar 20 v. Sep 19 |
Mar 20 v. Mar 19 |
||||||||||||||||
| Personnel |
2,465 | 2,395 | 2,370 | 3% | 4% | |||||||||||||||
| Premises |
405 | 389 | 406 | 4% | 0% | |||||||||||||||
| Technology (excluding personnel) |
839 | 770 | 764 | 9% | 10% | |||||||||||||||
| Restructuring |
105 | 26 | 51 | large | large | |||||||||||||||
| Other |
791 | 1,126 | 774 | -30% | 2% | |||||||||||||||
| Total cash operating expenses from continuing operations1 |
4,605 | 4,706 | 4,365 | -2% | 5% | |||||||||||||||
| Full time equivalent staff (FTE) from continuing operations |
37,834 | 37,588 | 37,364 | 1% | 1% | |||||||||||||||
| Average full time equivalent staff (FTE) from continuing operations |
37,759 | 37,405 | 37,558 | 1% | 1% | |||||||||||||||
| Half Year | Movement | |||||||||||||||||||
| Expenses by division | Mar 20 $M |
Sep 19 $M |
Mar 19 $M |
Mar 20 v. Sep 19 |
Mar 20 v. Mar 19 |
|||||||||||||||
| Australia Retail and Commercial |
2,065 | 2,161 | 1,913 | -4% | 8% | |||||||||||||||
| Institutional |
1,290 | 1,347 | 1,320 | -4% | -2% | |||||||||||||||
| New Zealand |
690 | 674 | 612 | 2% | 13% | |||||||||||||||
| Pacific |
76 | 80 | 70 | -5% | 9% | |||||||||||||||
| TSO and Group Centre |
484 | 444 | 450 | 9% | 8% | |||||||||||||||
| Total cash operating expenses from continuing operations1 |
4,605 | 4,706 | 4,365 | -2% | 5% | |||||||||||||||
| Half Year | Movement | |||||||||||||||||||
| FTE by division | Mar 20 | Sep 19 | Mar 19 | Mar 20 v. Sep 19 |
Mar 20 v. Mar 19 |
|||||||||||||||
| Australia Retail and Commercial |
14,061 | 13,903 | 13,660 | 1% | 3% | |||||||||||||||
| Institutional |
5,350 | 5,468 | 6,085 | -2% | -12% | |||||||||||||||
| New Zealand |
6,103 | 6,121 | 6,003 | 0% | 2% | |||||||||||||||
| Pacific |
1,108 | 1,086 | 1,096 | 2% | 1% | |||||||||||||||
| TSO and Group Centre |
11,212 | 11,010 | 10,520 | 2% | 7% | |||||||||||||||
| Total FTE from continuing operations |
37,834 | 37,588 | 37,364 | 1% | 1% | |||||||||||||||
| Average FTE from continuing operations |
37,759 | 37,405 | 37,558 | 1% | 1% | |||||||||||||||
| 1. | Includes large/notable items of $250 million for the March 2020 half (Sep 19 half: $384 million; Mar 19 half: $125 million). Refer to items on pages 13 to 16 for further details on large/notable items. |
Operating expenses - March 2020 Half Year v March 2019 Half Year
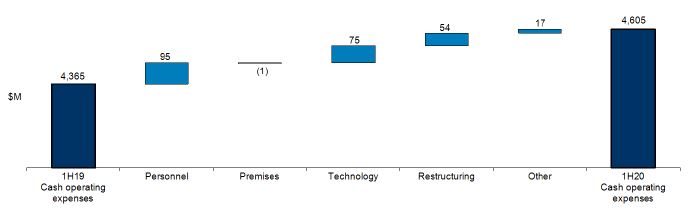
26
GROUP RESULTS
| Expenses (excluding large/notable items) | Half Year | Movement | ||||||||||||||||||
| Mar 20 $M |
Sep 19 $M |
Mar 19 $M |
Mar 20 v. Sep 19 |
Mar 20 v. Mar 19 | ||||||||||||||||
| Personnel |
2,413 | 2,341 | 2,352 | 3% | 3% | |||||||||||||||
| Premises |
379 | 387 | 403 | -2% | -6% | |||||||||||||||
| Technology (excluding personnel) |
790 | 768 | 762 | 3% | 4% | |||||||||||||||
| Restructuring |
- | - | - | n/a | n/a | |||||||||||||||
| Other |
773 | 826 | 723 | -6% | 7% | |||||||||||||||
| Total cash operating expenses from continuing operations |
4,355 | 4,322 | 4,240 | 1% | 3% | |||||||||||||||
| Expenses by division (excluding large/notable items) | Half Year | Movement | ||||||||||||||||||
| Mar 20 $M |
Sep 19 $M |
Mar 19 $M |
Mar 20 v. Sep 19 |
Mar 20 v. Mar 19 | ||||||||||||||||
| Australia Retail and Commercial |
1,887 | 1,885 | 1,858 | 0% | 2% | |||||||||||||||
| Institutional |
1,275 | 1,282 | 1,293 | -1% | -1% | |||||||||||||||
| New Zealand |
671 | 650 | 604 | 3% | 11% | |||||||||||||||
| Pacific |
74 | 73 | 70 | 1% | 6% | |||||||||||||||
| TSO and Group Centre |
448 | 432 | 415 | 4% | 8% | |||||||||||||||
| Total cash operating expenses from continuing operations |
4,355 | 4,322 | 4,240 | 1% | 3% | |||||||||||||||
| • | March 2020 v March 2019 |
Operating expenses increased by $240 million (+5%).
| • | Personnel expenses increased $95 million (+4%) largely driven by higher investment spend in the New Zealand and Australia Retail and Commercial divisions, along with wage inflation, higher customer remediation ($48 million) and adverse foreign currency translation movements. This was partially offset by lower variable remuneration and business as usual personnel expenses. |
| • | Premises expense decreased $1 million largely driven by the consolidation of our property footprint offset by a change in accounting treatment associated with the new leasing standard (comparatives not restated). |
| • | Technology expenses increased $75 million (+10%) largely as a result of a change in accounting treatment associated with the new leasing standard (comparatives not restated) and an increase in investment spend. |
| • | Restructuring expenses increased $54 million largely relating to business and property changes in the Australia Retail and Commercial division. |
| • | Other expenses increased $17 million (+2%) largely due to higher investment spend offset by lower customer remediation ($13 million). |
Excluding large/notable items, operating expenses increased $115 million (+3%).
| • | March 2020 v September 2019 |
Operating expenses decreased by $101 million (-2%).
| • | Personnel expenses increased $70 million (+3%) largely driven by wage inflation, higher customer remediation ($18 million), higher investment spend in the New Zealand and Australia Retail and Commercial divisions and adverse foreign currency translation movements. This was partially offset by lower variable remuneration and business as usual personnel expenses. |
| • | Premises expenses increased $16 million (+4%) largely as a result of a change in accounting treatment associated with the new leasing standard (comparatives not restated). This was partially offset by lower premises expense in our International network. |
| • | Technology expenses increased $69 million (+9%) largely as a result of a change in accounting treatment associated with the new leasing standard (comparatives not restated) and higher investment spend. |
| • | Restructuring expenses increased $79 million largely relating to business and property changes in the Australia Retail and Commercial division. |
| • | Other expenses decreased $335 million (-30%) largely driven by lower customer remediation ($284 million), a reduction in consulting spend and lower marketing spend which is typically higher in the September half. |
Excluding large/notable items, operating expenses increased $33 million (+1%).
27
GROUP RESULTS
Software Capitalisation - continuing operations
As at 31 March 2020, the Group’s intangible assets included $1,263 million of costs incurred to acquire and develop software. Details are presented in the table below:
| Half Year
|
Movement
|
|||||||||||||||||||||
| Mar 20 | Sep 19 | Mar 19 | Mar 20 | Mar 20 | ||||||||||||||||||
| $M | $M | $M | v. Sep 19 | v. Mar 19 | ||||||||||||||||||
| Balance at start of period |
1,323 | 1,368 | 1,421 | -3% | -7% | |||||||||||||||||
| Software capitalised during the period |
181 | 222 | 199 | -18% | -9% | |||||||||||||||||
| Amortisation during the period |
(241 | ) | (265 | ) | (252 | ) | -9% | -4% | ||||||||||||||
| Software impaired/written-off |
(2 | ) | (1 | ) | (3 | ) | 100% | -33% | ||||||||||||||
| Foreign currency translation movements |
2 | (1 | ) | 3 | large | -33% | ||||||||||||||||
| Total capitalised software from continuing operations |
1,263 | 1,323 | 1,368 | -5% | -8% | |||||||||||||||||
| Net book value by division | As at
|
Movement
|
||||||||||||||||||||
| Mar 20 | Sep 19 | Mar 19 | Mar 20 | Mar 20 | ||||||||||||||||||
| $M | $M | $M | v. Sep 19 | v. Mar 19 | ||||||||||||||||||
| Australia Retail and Commercial |
209 | 260 | 306 | -20% | -32% | |||||||||||||||||
| Institutional |
196 | 223 | 246 | -12% | -20% | |||||||||||||||||
| New Zealand |
8 | 7 | 14 | 14% | -43% | |||||||||||||||||
| TSO and Group Centre |
850 | 833 | 802 | 2% | 6% | |||||||||||||||||
| Total from continuing operations |
1,263 | 1,323 | 1,368 | -5% | -8% | |||||||||||||||||
28
GROUP RESULTS
| Credit | Risk – continuing operations |
The tables below provide information about the credit provision of the Group.
The impact and duration of COVID-19 on the global economy and how governments, businesses and consumers respond is uncertain. The Expected Credit Loss (ECL) charge for the half year and ECL provisions as at 31 March 2020 are therefore largely based on management judgement with respect to the impacts of COVID-19 on the Group’s credit exposures. The judgements and assumptions made by management are based on a variety of internal and external information, as well as the Group’s experience with respect to the performance of the portfolio under previous stressed conditions. The Group also considers applying temporary adjustments to the ECL for recent and transitory conditions applying to segments of the portfolio.
Credit impairment charge/(release)
| Collectively assessed | ||||||||||||||||||||||
|
Half Year
|
Movement | |||||||||||||||||||||
| Mar 20 | Sep 19 | Mar 19 | Mar 20 | Mar 20 | ||||||||||||||||||
| Division | $M | $M | $M | v. Sep 19 | v. Mar 19 | |||||||||||||||||
| Australia Retail and Commercial |
525 | (39 | ) | 46 | large | large | ||||||||||||||||
| Institutional |
369 | 33 | (23 | ) | large | large | ||||||||||||||||
| New Zealand |
144 | 17 | (5 | ) | large | large | ||||||||||||||||
| Pacific |
10 | (6 | ) | (6 | ) | large | large | |||||||||||||||
| TSO and Group Centre |
- | (1 | ) | 1 | -100% | -100% | ||||||||||||||||
| Total |
1,048 | 4 | 13 | large | large | |||||||||||||||||
| Individually assessed | ||||||||||||||||||||||
|
Half Year
|
Movement | |||||||||||||||||||||
| Mar 20 | Sep 19 | Mar 19 | Mar 20 | Mar 20 | ||||||||||||||||||
| Division | $M | $M | $M | v. Sep 19 | v. Mar 19 | |||||||||||||||||
| Australia Retail and Commercial |
318 | 355 | 350 | -10% | -9% | |||||||||||||||||
| Institutional |
272 | - | (12 | ) | n/a | large | ||||||||||||||||
| New Zealand |
35 | 40 | 35 | -13% | 0% | |||||||||||||||||
| Pacific |
1 | 3 | 8 | -67% | -88% | |||||||||||||||||
| TSO and Group Centre |
- | - | (1 | ) | n/a | -100% | ||||||||||||||||
| Total |
626 | 398 | 380 | 57% | 65% | |||||||||||||||||
| Total | ||||||||||||||||||||||
|
Half Year
|
Movement | |||||||||||||||||||||
| Mar 20 | Sep 19 | Mar 19 | Mar 20 | Mar 20 | ||||||||||||||||||
| Division | $M | $M | $M | v. Sep 19 | v. Mar 19 | |||||||||||||||||
| Australia Retail and Commercial |
843 | 316 | 396 | large | large | |||||||||||||||||
| Institutional |
641 | 33 | (35 | ) | large | large | ||||||||||||||||
| New Zealand |
179 | 57 | 30 | large | large | |||||||||||||||||
| Pacific |
11 | (3 | ) | 2 | large | large | ||||||||||||||||
| TSO and Group Centre |
- | (1 | ) | - | -100% | n/a | ||||||||||||||||
| Total |
1,674 | 402 | 393 | large | large | |||||||||||||||||
29
GROUP RESULTS
Credit impairment charge/(release), cont’d
| March 2020 Half Year | Collectively assessed | Individually assessed | ||||||||||||||||||||||||||||||||
|
Stage 3 - |
||||||||||||||||||||||||||||||||||
| Stage 3 - | Recoveries | |||||||||||||||||||||||||||||||||
| New and | and write- | |||||||||||||||||||||||||||||||||
| Stage 1 | Stage 2 | Stage 3 | Total | increased | backs | Total | Total | |||||||||||||||||||||||||||
| Division | $M | $M | $M | $M | $M | $M | $M | $M | ||||||||||||||||||||||||||
| Australia Retail and Commercial |
105 | 395 | 25 | 525 | 511 | (193 | ) | 318 | 843 | |||||||||||||||||||||||||
| Institutional |
203 | 177 | (11 | ) | 369 | 327 | (55 | ) | 272 | 641 | ||||||||||||||||||||||||
| New Zealand |
39 | 86 | 19 | 144 | 59 | (24 | ) | 35 | 179 | |||||||||||||||||||||||||
| Pacific |
7 | 3 | - | 10 | 3 | (2 | ) | 1 | 11 | |||||||||||||||||||||||||
| TSO and Group Centre |
- | - | - | - | - | - | - | - | ||||||||||||||||||||||||||
| Total |
354 | 661 | 33 | 1,048 | 900 | (274 | ) | 626 | 1,674 | |||||||||||||||||||||||||
| September 2019 Half Year | Collectively assessed | Individually assessed | ||||||||||||||||||||||||||||||||
|
Stage 3 - |
||||||||||||||||||||||||||||||||||
| Stage 3 - | Recoveries | |||||||||||||||||||||||||||||||||
| New and | and write- | |||||||||||||||||||||||||||||||||
| Stage 1 | Stage 2 | Stage 3 | Total | increased | backs | Total | Total | |||||||||||||||||||||||||||
| Division | $M | $M | $M | $M | $M | $M | $M | $M | ||||||||||||||||||||||||||
| Australia Retail and Commercial |
(14 | ) | (69 | ) | 44 | (39 | ) | 637 | (282 | ) | 355 | 316 | ||||||||||||||||||||||
| Institutional |
8 | 22 | 3 | 33 | 37 | (37 | ) | - | 33 | |||||||||||||||||||||||||
| New Zealand |
5 | 15 | (3 | ) | 17 | 71 | (31 | ) | 40 | 57 | ||||||||||||||||||||||||
| Pacific |
(3 | ) | (2 | ) | (1 | ) | (6 | ) | 5 | (2 | ) | 3 | (3 | ) | ||||||||||||||||||||
| TSO and Group Centre |
(1 | ) | - | - | (1 | ) | - | - | - | (1 | ) | |||||||||||||||||||||||
| Total |
(5 | ) | (34 | ) | 43 | 4 | 750 | (352 | ) | 398 | 402 | |||||||||||||||||||||||
| March 2019 Half Year | Collectively assessed |
Individually assessed | ||||||||||||||||||||||||||||||||
|
Stage 3 - |
||||||||||||||||||||||||||||||||||
| Stage 3 - | Recoveries | |||||||||||||||||||||||||||||||||
| New and | and write- | |||||||||||||||||||||||||||||||||
| Stage 1 | Stage 2 | Stage 3 | Total | increased | backs | Total | Total | |||||||||||||||||||||||||||
| Division | $M | $M | $M | $M | $M | $M | $M | $M | ||||||||||||||||||||||||||
| Australia Retail and Commercial |
(21 | ) | 43 | 24 | 46 | 536 | (186 | ) | 350 | 396 | ||||||||||||||||||||||||
| Institutional |
19 | (35 | ) | (7 | ) | (23 | ) | 18 | (30 | ) | (12 | ) | (35 | ) | ||||||||||||||||||||
| New Zealand |
(4 | ) | (5 | ) | 4 | (5 | ) | 60 | (25 | ) | 35 | 30 | ||||||||||||||||||||||
| Pacific |
(1 | ) | (4 | ) | (1 | ) | (6 | ) | 11 | (3 | ) | 8 | 2 | |||||||||||||||||||||
| TSO and Group Centre |
1 | - | - | 1 | - | (1 | ) | (1 | ) | - | ||||||||||||||||||||||||
| Total |
(6 | ) | (1 | ) | 20 | 13 | 625 | (245 | ) | 380 | 393 | |||||||||||||||||||||||
Collectively assessed credit impairment charge
| · | March 2020 v March 2019 |
The collectively assessed credit impairment charge increased by $1,035 million primarily driven by a $479 million increase in the Australia Retail and Commercial division, a $392 million increase in the Institutional division and a $149 million increase in the New Zealand division. The significant increases across all divisions are primarily due to forward-looking impact of material deterioration in the economic outlook due to the COVID-19 pandemic.
| · | March 2020 v September 2019 |
The collectively assessed credit impairment charge increased by $1,044 million primarily driven by a $564 million increase in the Australia Retail and Commercial division, a $336 million increase in the Institutional division and a $127 million increase in the New Zealand division. The significant increases across all divisions are primarily due to forward-looking impact of material deterioration in the economic outlook due to the COVID-19 pandemic.
30
GROUP RESULTS
Individually assessed credit impairment charge
| · | March 2020 v March 2019 |
The individually assessed credit impairment charge increased by $246 million primarily due to a small number of new single name impairments in the Institutional division. This was partially offset by improved mortgage delinquencies in the Australia retail portfolios combined with ongoing lower portfolio growth in the unsecured portfolio.
| · | March 2020 v September 2019 |
The individually assessed credit impairment charge increased by $228 million primarily due to a small number of new single name impairments in the Institutional division. This was partially offset by improved mortgage delinquencies in the Australia retail portfolios combined with ongoing lower portfolio growth in the unsecured portfolio.
Allowance for expected credit losses1,2
| Collectively assessed
|
||||||||||||||||||||||
|
As at
|
Movement | |||||||||||||||||||||
|
Mar 20 |
Sep 19 | Mar 19 | Mar 20 | Mar 20 | ||||||||||||||||||
| Division |
$M |
$M | $M | v. Sep 19 | v. Mar 19 | |||||||||||||||||
| Australia Retail and Commercial |
2,320 | 1,795 | 1,834 | 29% | 26% | |||||||||||||||||
| Institutional |
1,590 | 1,169 | 1,132 | 36% | 40% | |||||||||||||||||
| New Zealand |
541 | 374 | 369 | 45% | 47% | |||||||||||||||||
| Pacific |
50 | 38 | 43 | 32% | 16% | |||||||||||||||||
| Total |
4,501 | 3,376 | 3,378 | 33% | 33% | |||||||||||||||||
| Individually assessed | ||||||||||||||||||||||
|
As at
|
Movement | |||||||||||||||||||||
| Mar 20 | Sep 19 | Mar 19 | Mar 20 | Mar 20 | ||||||||||||||||||
| Division | $M
|
$M | $M | v. Sep 19 | v. Mar 19 | |||||||||||||||||
| Australia Retail and Commercial |
582 | 558 | 586 | 4% | -1% | |||||||||||||||||
| Institutional |
406 | 160 | 208 | large | 95% | |||||||||||||||||
| New Zealand |
79 | 72 | 73 | 10% | 8% | |||||||||||||||||
| Pacific |
26 | 24 | 24 | 8% | 8% | |||||||||||||||||
| Total |
1,093 | 814 | 891 | 34% | 23% | |||||||||||||||||
| Total provision
|
||||||||||||||||||||||
|
As at
|
Movement | |||||||||||||||||||||
|
Mar 20 |
Sep 19 | Mar 19 | Mar 20 | Mar 20 | ||||||||||||||||||
| Division | $M
|
$M | $M | v. Sep 19 | v. Mar 19 | |||||||||||||||||
| Australia Retail and Commercial |
2,902 | 2,353 | 2,420 | 23% | 20% | |||||||||||||||||
| Institutional |
1,996 | 1,329 | 1,340 | 50% | 49% | |||||||||||||||||
| New Zealand |
620 | 446 | 442 | 39% | 40% | |||||||||||||||||
| Pacific |
76 | 62 | 67 | 23% | 13% | |||||||||||||||||
| Total |
5,594 | 4,190 | 4,269 | 34% | 31% | |||||||||||||||||
| 1. | Includes allowance for expected credit losses for Net loans and advances – at amortised cost, Investment securities – debt securities at amortised cost and Off-balance sheet commitments - undrawn and contingent facilities. |
| 2. | Balance Sheet amounts include assets and liabilities reclassified as held for sale. |
31
GROUP RESULTS
Allowance for expected credit losses, cont’d 1,2
| As at Mar 20 | ||||||||||||||||||||||||||
| Individually | ||||||||||||||||||||||||||
| Collectively assessed | assessed | |||||||||||||||||||||||||
|
Stage 1 |
Stage 2 | Stage 3 | Total | Stage 3 | Total | |||||||||||||||||||||
| Division | $M | $M | $M | $M | $M | $M | ||||||||||||||||||||
| Australia Retail and Commercial |
474 | 1,477 | 369 | 2,320 | 582 | 2,902 | ||||||||||||||||||||
| Institutional |
1,115 | 444 | 31 | 1,590 | 406 | 1,996 | ||||||||||||||||||||
| New Zealand |
200 | 279 | 62 | 541 | 79 | 620 | ||||||||||||||||||||
| Pacific |
26 | 13 | 11 | 50 | 26 | 76 | ||||||||||||||||||||
| Total |
1,815 | 2,213 | 473 | 4,501 | 1,093 | 5,594 | ||||||||||||||||||||
| As at Sep 19 | ||||||||||||||||||||||||||
|
Individually |
||||||||||||||||||||||||||
| Collectively assessed | assessed | |||||||||||||||||||||||||
|
Stage 1 |
Stage 2 | Stage 3 | Total | Stage 3 | Total | |||||||||||||||||||||
| Division | $M | $M | $M | $M | $M | $M | ||||||||||||||||||||
| Australia Retail and Commercial |
370 | 1,082 | 343 | 1,795 | 558 | 2,353 | ||||||||||||||||||||
| Institutional |
872 | 257 | 40 | 1,169 | 160 | 1,329 | ||||||||||||||||||||
| New Zealand |
152 | 182 | 40 | 374 | 72 | 446 | ||||||||||||||||||||
| Pacific |
18 | 9 | 11 | 38 | 24 | 62 | ||||||||||||||||||||
| Total |
1,412 | 1,530 | 434 | 3,376 | 814 | 4,190 | ||||||||||||||||||||
| As at Mar 19 | ||||||||||||||||||||||||||
|
Individually |
||||||||||||||||||||||||||
| Collectively assessed | assessed | |||||||||||||||||||||||||
|
Stage 1 |
Stage 2 | Stage 3 | Total | Stage 3 | Total | |||||||||||||||||||||
| Division | $M | $M | $M | $M | $M | $M | ||||||||||||||||||||
| Australia Retail and Commercial |
384 | 1,150 | 300 | 1,834 | 586 | 2,420 | ||||||||||||||||||||
| Institutional |
859 | 234 | 39 | 1,132 | 208 | 1,340 | ||||||||||||||||||||
| New Zealand |
152 | 173 | 44 | 369 | 73 | 442 | ||||||||||||||||||||
| Pacific |
20 | 11 | 12 | 43 | 24 | 67 | ||||||||||||||||||||
| Total |
1,415 | 1,568 | 395 | 3,378 | 891 | 4,269 | ||||||||||||||||||||
| 1. | Includes allowance for expected credit losses for Net loans and advances – at amortised cost, Investment securities – debt securities at amortised cost and Off-balance sheet commitments - undrawn and contingent facilities. |
| 2. | Balance Sheet amounts include assets and liabilities reclassified as held for sale. |
32
GROUP RESULTS
Long-Run Loss Rates
Management believe that disclosure of modelled long-run historical loss rates for individually assessed provisions assists in assessing the longer term expected loss rates of the lending portfolio as it removes the volatility of reported earnings created by the use of accounting losses. The long-run loss methodology used for economic profit is an internal measure and is not based on the credit loss principles of AASB 9 Financial Instruments. In addition, given it is based on an average historical long-run loss rate it does not reflect the potential forward looking impacts associated with COVID-19.
| As at | ||||||||||||
| Long-run loss as a % of gross lending assets |
Mar 20 | Sep 19 | Mar 19 | |||||||||
| Australia Retail and Commercial division |
0.28% | 0.29% | 0.29% | |||||||||
| New Zealand division |
0.19% | 0.18% | 0.19% | |||||||||
| Institutional division |
0.25% | 0.25% | 0.27% | |||||||||
| Total Group |
0.26% | 0.26% | 0.27% | |||||||||
Gross Impaired Assets1
| As at | Movement | |||||||||||||||||||||
| Mar 20 | Sep 19 | Mar 19 | Mar 20 | Mar 20 | ||||||||||||||||||
| $M | $M | $M | v. Sep 19 | v. Mar 19 | ||||||||||||||||||
| Impaired loans2 |
2,209 | 1,711 | 1,803 | 29% | 23% | |||||||||||||||||
| Restructured items3 |
226 | 267 | 264 | -15% | -14% | |||||||||||||||||
|
Non-performing commitments and contingencies2 |
164 | 51 | 61 | large | large | |||||||||||||||||
| Gross impaired assets |
2,599 | 2,029 | 2,128 | 28% | 22% | |||||||||||||||||
| Individually assessed provisions |
||||||||||||||||||||||
| Impaired loans |
(1,055 | ) | (791 | ) | (865 | ) | 33% | 22% | ||||||||||||||
|
Non-performing commitments and contingencies |
(38 | ) | (23 | ) | (26 | ) | 65% | 46% | ||||||||||||||
| Net impaired assets |
1,506 | 1,215 | 1,237 | 24% | 22% | |||||||||||||||||
| Gross impaired assets by division |
||||||||||||||||||||||
| Australia Retail and Commercial |
1,544 | 1,468 | 1,463 | 5% | 6% | |||||||||||||||||
| Institutional |
742 | 265 | 373 | large | 99% | |||||||||||||||||
| New Zealand |
264 | 245 | 238 | 8% | 11% | |||||||||||||||||
| Pacific |
49 | 51 | 53 | -4% | -8% | |||||||||||||||||
| TSO and Group Centre |
- | - | 1 | n/a | -100% | |||||||||||||||||
| Gross impaired assets |
2,599 | 2,029 | 2,128 | 28% | 22% | |||||||||||||||||
| Gross impaired assets by size of exposure |
||||||||||||||||||||||
| Less than $10 million |
1,680 | 1,593 | 1,611 | 5% | 4% | |||||||||||||||||
| $10 million to $100 million |
349 | 247 | 328 | 41% | 6% | |||||||||||||||||
| Greater than $100 million |
570 | 189 | 189 | large | large | |||||||||||||||||
| Gross impaired assets |
2,599 | 2,029 | 2,128 | 28% | 22% | |||||||||||||||||
| 1. | Balance sheet amounts include assets and liabilities reclassified as held for sale. |
| 2. | Impaired loans and non-performing commitments and contingencies do not include exposures which are included in collectively assessed Stage 3 ECL, which comprise unsecured retail exposures greater than 90 days past due and defaulted but well secured exposures. |
| 3. | Restructured items are facilities where the original contractual terms have been modified for reasons related to the financial difficulties of the customer. Restructuring may consist of reduction of interest, principal or other payments legally due, or an extension in maturity materially beyond those typically offered to new facilities with similar risk. |
| · | March 2020 v March 2019 |
Gross impaired assets increased $471 million (22%) driven by the Institutional division ($369 million), Australia Retail and Commercial division ($81 million) and New Zealand division ($26 million). The increase in the Institutional division relates to impairments on a small number of single name exposures. The Australia Retail and Commercial division increase was driven by the implementation of a more market responsive collateral valuation methodology for the Australian home loan portfolio combined with a single name exposure in the commercial portfolio. The increase in New Zealand is driven by impairments on a small number of single name commercial exposures.
| · | March 2020 v September 2019 |
Gross impaired assets increased $570 million (28%) driven by the Institutional division ($477 million), Australia Retail and Commercial division ($76 million) and New Zealand division ($19 million). The increase in the Institutional division relates to impairments on a small number of single name exposures. The Australia Retail and Commercial division increase was driven by the implementation of a more market responsive collateral valuation methodology for the Australian home loan portfolio combined with a single name exposure in the commercial portfolio.
The Group’s individually assessed provision coverage ratio on impaired assets was 42.1% at 31 March 2020 (Sep 19: 40.1%; Mar 19: 41.9%).
33
GROUP RESULTS
New Impaired Assets1
|
Half Year
|
Movement
|
|||||||||||||||||||||
| Mar 20 | Sep 19 | Mar 19 | Mar 20 | Mar 20 | ||||||||||||||||||
| $M | $M | $M | v. Sep 19 | v. Mar 19 | ||||||||||||||||||
| Impaired loans |
1,407 | 1,070 | 857 | 31% | 64% | |||||||||||||||||
| Restructured items |
23 | 29 | 13 | -21% | 77% | |||||||||||||||||
|
Non-performing commitments and contingencies |
140 | 18 | 20 | large | large | |||||||||||||||||
| Total new impaired assets |
1,570 | 1,117 | 890 | 41% | 76% | |||||||||||||||||
| New impaired assets by division |
||||||||||||||||||||||
| Australia Retail and Commercial |
870 | 916 | 715 | -5% | 22% | |||||||||||||||||
| Institutional |
571 | 37 | 41 | large | large | |||||||||||||||||
| New Zealand |
125 | 158 | 120 | -21% | 4% | |||||||||||||||||
| Pacific |
4 | 6 | 14 | -33% | -71% | |||||||||||||||||
| TSO and Group Centre |
- | - | - | n/a | n/a | |||||||||||||||||
| Total new impaired assets |
1,570 | 1,117 | 890 | 41% | 76% | |||||||||||||||||
| 1. | Balance sheet amounts include assets and liabilities reclassified as held for sale. |
| · | March 2020 v March 2019 |
New impaired assets increased $680 million (76%) with increases in Institutional division ($530 million) related to a small number of impairments of single name exposures. Australia Retail and Commercial division increases ($155 million) driven by the implementation of a more market responsive collateral valuation methodology for the Australian home loan portfolio combined with a single name exposure in the commercial portfolio.
| · | March 2020 v September 2019 |
New impaired assets increased by $453 million (41%) with increases in Institutional division ($534 million) related to a small number of impairments of single name exposures. This was partially offset by Australia Retail and Commercial division (-$46 million) driven by ongoing lower growth in the unsecured and small business banking portfolio.
Ageing analysis of net loans and advances that are past due but not impaired1,2,3
| As at
|
Movement
|
|||||||||||||||||||||
| Mar 20 | Sep 19 | Mar 19 | Mar 20 | Mar 20 | ||||||||||||||||||
| $M | $M | $M | v. Sep 19 | v. Mar 19 | ||||||||||||||||||
| 1-29 days |
9,114 | 8,383 | 9,558 | 9% | -5% | |||||||||||||||||
| 30-59 days |
2,772 | 2,255 | 2,993 | 23% | -7% | |||||||||||||||||
| 60-89 days |
1,368 | 1,369 | 1,436 | 0% | -5% | |||||||||||||||||
| >90 days |
3,621 | 3,744 | 3,328 | -3% | 9% | |||||||||||||||||
| Total |
16,875 | 15,751 | 17,315 | 7% | -3% | |||||||||||||||||
| 1. | Balance sheet amounts include assets and liabilities reclassified as held for sale. |
| 2. | In the September 2019 half, ANZ implemented a more market responsive collateral valuation methodology for the home loan portfolio in Australia which increased the number of home loans being classified as impaired rather than past due. Comparative information was not restated for the change in methodology. |
| 3. | Excludes eligible customers that applied and were granted or are in the process of being granted a 6 month repayment deferral package provided to customers impacted by COVID-19 as at 31 March 2020. Customers who were 30 days past due or greater were not eligible for the 6 month repayment deferral packages. |
| · | March 2020 v March 2019 |
Net loans and advances past due but not impaired decreased $440 million primarily driven by Australia Retail and Commercial division home loan portfolio in the 1-29 days segment.
| · | March 2020 v September 2019 |
Net loans and advances past due but not impaired increased $1,124 million primarily driven by Australia Retail and Commercial division and New Zealand division home loan portfolio in the 1-29 days and 30-59 days segments due to seasonality.
34
GROUP RESULTS
Income Tax Expense - continuing operations
| Half Year | Movement | |||||||||||||||||||||
| Mar 20 | Sep 19 | Mar 19 | Mar 20 | Mar 20 | ||||||||||||||||||
| $M | $M | $M | v. Sep 19 | v. Mar 19 | ||||||||||||||||||
| Income tax expense on cash profit |
886 | 1,263 | 1,415 | -30% | -37% | |||||||||||||||||
| Effective tax rate (cash profit) |
38.5% | 30.3% | 28.4% | |||||||||||||||||||
| · | March 2020 v March 2019 |
The effective tax rate has increased from 28.4% to 38.5%. The increase of 1,010 bps is primarily due to the non-tax deductible impairment of investments in AmBank and PT Panin (+1,065 bps).
| · | March 2020 v September 2019 |
The effective tax rate has increased from 30.3% to 38.5%. The increase of 820 bps is primarily due to non-tax deductible impairment of investments in AmBank and PT Panin (+1,065 bps) partially offset by the impact of customer remediation (-146 bps) in the September 2019 half.
35
GROUP RESULTS
Impact of Foreign Currency Translation - continuing operations
The following tables present the Group’s cash profit results and net loans and advances neutralised for the impact of foreign currency translation movements. Comparative data has been adjusted to remove the translation impact of foreign currency movements by retranslating prior period comparatives at current period foreign exchange rates.
Cash Profit - March 2020 Half Year vs March 2019 Half Year
| Half Year | Movement | |||||||||||||||||||||||||
| Actual |
FX |
FX impact |
FX adjusted |
FX unadjusted |
FX adjusted |
|||||||||||||||||||||
| Mar 20 $M |
Mar 19 $M |
Mar 19 $M |
Mar 19 $M |
Mar 20 v. Mar 19 |
Mar 20 v. Mar 19 |
|||||||||||||||||||||
| Net interest income |
7,222 | 7,299 | 55 | 7,354 | -1% | -2% | ||||||||||||||||||||
| Other operating income |
1,357 | 2,447 | 41 | 2,488 | -45% | -45% | ||||||||||||||||||||
| Operating income |
8,579 | 9,746 | 96 | 9,842 | -12% | -13% | ||||||||||||||||||||
| Operating expenses |
(4,605) | (4,365) | (57) | (4,422) | 5% | 4% | ||||||||||||||||||||
| Profit before credit impairment and income tax |
3,974 | 5,381 | 39 | 5,420 | -26% | -27% | ||||||||||||||||||||
| Credit impairment charge |
(1,674) | (393) | 2 | (391) | large | large | ||||||||||||||||||||
| Profit before income tax |
2,300 | 4,988 | 41 | 5,029 | -54% | -54% | ||||||||||||||||||||
| Income tax expense |
(886) | (1,415) | (7) | (1,422) | -37% | -38% | ||||||||||||||||||||
|
Non-controlling interests |
(1) | (9) | (1) | (10) | -89% | -90% | ||||||||||||||||||||
| Cash profit from continuing operations |
1,413 | 3,564 | 33 | 3,597 | -60% | -61% | ||||||||||||||||||||
| Balance Sheet |
||||||||||||||||||||||||||
| Net loans and advances1 |
656,609 | 610,169 | 10,585 | 620,754 | 8% | 6% | ||||||||||||||||||||
| Cash Profit - March 2020 Half Year vs September 2019 Half Year |
||||||||||||||||||||||||||
| Half Year | Movement | |||||||||||||||||||||||||
| Actual |
FX |
FX impact |
FX adjusted |
FX unadjusted |
FX adjusted |
|||||||||||||||||||||
| Mar 20 $M | Sep 19 $M |
Sep 19 $M |
Sep 19 $M |
Mar 20 v. Sep 19 |
Mar 20 v. Sep 19 |
|||||||||||||||||||||
| Net interest income |
7,222 | 7,040 | 29 | 7,069 | 3% | 2% | ||||||||||||||||||||
| Other operating income |
1,357 | 2,243 | 22 | 2,265 | -40% | -40% | ||||||||||||||||||||
| Operating income |
8,579 | 9,283 | 51 | 9,334 | -8% | -8% | ||||||||||||||||||||
| Operating expenses |
(4,605) | (4,706) | (30) | (4,736) | -2% | -3% | ||||||||||||||||||||
| Profit before credit impairment and income tax |
3,974 | 4,577 | 21 | 4,598 | -13% | -14% | ||||||||||||||||||||
| Credit impairment charge |
(1,674) | (402) | (2) | (404) | large | large | ||||||||||||||||||||
| Profit before income tax |
2,300 | 4,175 | 19 | 4,194 | -45% | -45% | ||||||||||||||||||||
| Income tax expense |
(886) | (1,263) | (6) | (1,269) | -30% | -30% | ||||||||||||||||||||
|
Non-controlling interests |
(1) | (6) | - | (6) | -83% | -83% | ||||||||||||||||||||
| Cash profit from continuing operations |
1,413 | 2,906 | 13 | 2,919 | -51% | -52% | ||||||||||||||||||||
| Balance Sheet |
||||||||||||||||||||||||||
| Net loans and advances1 |
656,609 | 615,258 | 11,760 | 627,018 | 7% | 5% | ||||||||||||||||||||
| 1. | Balance sheet amounts include assets and liabilities reclassified as held for sale from continuing and discontinued operations. |
36
GROUP RESULTS
Earnings Related Hedges – continuing operations
Where it is considered appropriate, the Group takes out economic hedges against larger foreign exchange denominated revenue streams (primarily New Zealand Dollar, US Dollar and US Dollar correlated). New Zealand Dollar exposure relates to the New Zealand geography and USD exposures relate to Asia, Pacific, Europe & America. Details of these hedges are set out below.
| Half Year | ||||||||||||
| NZD Economic hedges | Mar 20 $M |
Sep 19 $M |
Mar 19 $M |
|||||||||
| Net open NZD position (notional principal)1 |
3,165 | 3,451 | 3,361 | |||||||||
| Amount taken to income (pre-tax statutory basis)2 |
(156) | 115 | (105) | |||||||||
| Amount taken to income (pre-tax cash basis)3 |
(13) | (18) | (25) | |||||||||
| USD Economic hedges |
||||||||||||
| Net open USD position (notional principal)1 |
662 | 769 | 561 | |||||||||
| Amount taken to income (pre-tax statutory basis)2 |
(39) | (37) | (2) | |||||||||
| Amount taken to income (pre-tax cash basis)3 |
(15) | (8) | - | |||||||||
| 1. | Value in AUD at contracted rate. |
| 2. | Unrealised valuation movement plus realised revenue from matured or closed out hedges. |
| 3. | Realised revenue from closed out hedges. |
As at 31 March 2020, the following hedges were in place to partially hedge future earnings against adverse movements in exchange rates:
| • | NZD 3.3 billion at a forward rate of approximately NZD 1.05/AUD. |
| • | USD 0.4 billion at a forward rate of approximately USD 0.67/AUD. |
During the March 2020 half:
| • | NZD 1.1 billion of economic hedges matured and a realised loss of $13 million (pre-tax) was recorded in cash profit. |
| • | USD 0.2 billion of economic hedges matured and a realised loss of $15 million (pre-tax) was recorded in cash profit. |
| • | An unrealised loss of $167 million (pre-tax) on the outstanding NZD and USD economic hedges were recorded in the statutory Income Statement during the year. This unrealised loss has been treated as an adjustment to statutory profit in calculating cash profit as these are hedges of future NZD and USD revenues. |
Earnings per Share - continuing operations
| Half Year | Movement | |||||||||||||||||||||
| Mar 20 | Sep 19 | Mar 19 | Mar 20 v. Sep 19 |
Mar 20 v. Mar 19 |
||||||||||||||||||
| Cash earnings per share (cents) from continuing operations |
||||||||||||||||||||||
| Basic |
49.9 | 102.7 | 124.8 | -51% | -60% | |||||||||||||||||
| Diluted |
47.5 | 98.7 | 118.4 | -52% | -60% | |||||||||||||||||
| Cash weighted average number of ordinary shares (M)1 |
||||||||||||||||||||||
| Basic |
2,830.6 | 2,829.3 | 2,856.9 | 0% | -1% | |||||||||||||||||
| Diluted |
3,238.6 | 3,075.5 | 3,125.8 | 5% | 4% | |||||||||||||||||
| Cash profit from continuing operations ($M) |
1,413 | 2,906 | 3,564 | -51% | -60% | |||||||||||||||||
| Cash profit from continuing operations used in calculating diluted cash earnings per share ($M) |
1,537 | 3,037 | 3,701 | -49% | -58% | |||||||||||||||||
| 1. | Cash weighted average number of ordinary shares for the comparative periods includes ANZ shares previously held in Wealth Australia discontinued operations as treasury shares. These shares ceased to be treasury shares on completion of the successor fund transfer on 13 April 2019 in preparation for the disposal of discontinued operations. |
37
GROUP RESULTS
Dividends - continuing operations
| Half Year | Movement | |||||||||||||||||||
| Dividend per ordinary share (cents) - continuing operations | Mar 20 | Mar 20 | ||||||||||||||||||
| Mar 20 | Sep 19 | Mar 19 | v. Sep 19 | v. Mar 19 | ||||||||||||||||
| Interim |
||||||||||||||||||||
| - fully franked1,2,3 |
TBD | N/A | 80 | |||||||||||||||||
| - partially franked1 |
TBD | N/A | N/A | |||||||||||||||||
| Final (partially franked)3,4 |
N/A | 80 | N/A | |||||||||||||||||
| Total |
TBD | 80 | 80 | |||||||||||||||||
| Ordinary share dividends used in payout ratio ($M)5 |
TBD | 2,268 | 2,267 | |||||||||||||||||
| Cash profit from continuing operations ($M) |
1,413 | 2,906 | 3,564 | -51% | -60% | |||||||||||||||
| Ordinary share dividend payout ratio (cash basis)5 |
TBD | 78.0% | 63.6% | |||||||||||||||||
| 1. | The decision on the payment of a 2020 interim dividend has been deferred until the economic outlook is clearer and an update will be provided at the August 2020 market update. |
| 2. | Fully franked for Australian tax purposes (30% tax rate) for the 2019 interim dividend. |
| 3. | Carries New Zealand imputation credits of NZD 9 cents for the 2019 interim and final dividend. |
| 4. | Partially franked at 70% for Australian tax purposes (30% tax rate). |
| 5. | The dividend payout ratio for the March 2020 half will be determined when the decision on the 2020 interim dividend has been made. Dividend payout ratios for the September 2019 half and March 2019 half were calculated using actual dividend paid of $2,268 million and $2,267 million respectively. |
With consideration to the current uncertainties in the economic outlook and the letter issued by the Australian Prudential Regulation Authority (APRA) to all Authorised Deposit Taking Institutions (ADIs) on 7 April 2020, on capital management and the ongoing Coronavirus (COVID-19) pandemic, the ANZ board has deferred the decision on the payment of a 2020 interim dividend until the economic outlook is clearer. Decisions in relation to the Dividend Reinvestment Plan and Bonus Option Plan will also be made at that time as applicable.
The Board will continue to deliberate and an update will be provided at the August 2020 market update.
38
GROUP RESULTS
Condensed Balance Sheet - including discontinued operations
| As at
|
Movement
|
|||||||||||||||||||
| Assets |
Mar 20 |
Sep 19 | Mar 19 | Mar 20 | Mar 20 | |||||||||||||||
| $B | $B | $B | v. Sep 19 | v. Mar 19 | ||||||||||||||||
| Cash / Settlement balances owed to ANZ / Collateral paid |
166.8 | 100.3 | 109.9 | 66% | 52% | |||||||||||||||
| Trading and investment securities |
135.0 | 126.9 | 121.8 | 6% | 11% | |||||||||||||||
| Derivative financial instruments |
173.7 | 120.7 | 79.4 | 44% | large | |||||||||||||||
| Net loans and advances |
656.6 | 615.3 | 609.3 | 7% | 8% | |||||||||||||||
| Assets held for sale |
- | 1.8 | 43.5 | -100% | -100% | |||||||||||||||
| Other |
17.9 | 16.1 | 16.4 | 11% | 9% | |||||||||||||||
| Total assets |
1,150.0 | 981.1 | 980.3 | 17% | 17% | |||||||||||||||
| Liabilities |
||||||||||||||||||||
| Settlement balances owed by ANZ / Collateral received |
39.8 | 18.8 | 18.1 | large | large | |||||||||||||||
| Deposits and other borrowings |
726.9 | 637.7 | 635.0 | 14% | 14% | |||||||||||||||
| Derivative financial instruments |
167.4 | 121.0 | 80.9 | 38% | large | |||||||||||||||
| Liabilities held for sale |
- | 2.1 | 46.6 | -100% | -100% | |||||||||||||||
| Debt issuances |
140.2 | 129.7 | 129.7 | 8% | 8% | |||||||||||||||
| Other |
14.3 | 11.0 | 10.0 | 30% | 43% | |||||||||||||||
| Total liabilities |
1,088.6 | 920.3 | 920.3 | 18% | 18% | |||||||||||||||
| Total equity |
61.4 | 60.8 | 60.0 | 1% | 2% | |||||||||||||||
| · | March 2020 v March 2019 |
| · | Cash/Settlement balances owed to ANZ/Collateral paid increased $56.9 billion (+52%) driven by an increase in balances with central banks in Markets, increased overnight bank deposits in Treasury, increase in short term reverse repurchase agreements in Markets and Treasury, increase in collateral paid associated with higher derivative liability position and foreign currency translation movements. |
| · | Trading and investment securities increased $13.2 billion (+11%) driven by an increase in liquid assets in Markets and the impact of foreign currency translation movements. |
| · | Derivative financial assets and liabilities increased $94.3 billion and $86.5 billion respectively as interest rate and foreign exchange movements resulted in higher derivative volumes and fair values, particularly in interest rate and foreign exchange swap products. |
| · | Net loans and advances increased $47.3 billion (+8%), driven by lending growth in the Institutional division (+$39.3 billion), growth in home loans in the New Zealand division (+$4.6 billion) and the impact of foreign currency translation movements, partially offset by the decrease in Australia Retail and Commercial division (-$6.8 billion) across home loans and unsecured portfolios. |
| · | Assets and liabilities held for sale decreased $43.5 billion (-100%) and $46.6 billion (-100%) respectively driven by the sale completion of the life insurance business to IOOF and Zurich, Cambodia JV and PNG Retail, Commercial and SME. |
| · | Settlement balances owed by ANZ/Collateral received increased $21.7 billion driven by higher cash clearing account balances in the Institutional division, an increase in collateral received associated with higher derivative asset position and foreign currency translation movements. |
| · | Deposits and other borrowings increased $91.9 billion (+14%) driven by increased customer deposits in the Institutional division (+$37.5 billion), Australia Retail and Commercial division (+$9.6 billion) and New Zealand division (+$4.4 billion), an increase in deposits from banks and repurchase agreements (+$10.9 billion), an increase in commercial paper issued (+$6.3 billion) and the impact of foreign currency translation movements. This was partially offset by reduction in certificates of deposit (-$6.2 billion). |
| · | Debt issuances increased $10.5 billion (+8%) driven by senior debt issuances and the impact of foreign currency translation movements. |
| · | March 2020 v September 2019 |
| · | Cash/Settlement balances owed to ANZ/Collateral paid increased $66.5 billion (+66%) driven by an increase in balances with central banks in Markets, increased overnight bank deposits in Treasury, increase in short term reverse repurchase agreements in Markets and Treasury, increase in collateral paid associated with higher derivative liability position and foreign currency translation movements. |
| · | Trading and investment securities increased $8.1 billion (+6%) driven by an increase in liquid assets in Markets and the impact of foreign currency translation movements. |
| · | Derivative financial assets and liabilities increased $53.0 billion (+44%) and $46.4 billion (+38%) respectively as interest rate and foreign exchange movements resulted in higher derivative volumes and fair values, particularly in interest rate and foreign exchange swap products. |
| · | Net loans and advances increased $41.3 billion (+7%), driven by lending growth in the Institutional division (+$29.2 billion), growth in home loans in the New Zealand division (+$2.8 billion) and the impact of foreign currency translation movements, partially offset by the decrease in Australia Retail and Commercial division (-$2.1 billion) across home loans and unsecured portfolios. |
| · | Settlement balances owed by ANZ/Collateral received increased $21.0 billion driven by higher cash clearing account balances in the Institutional division, an increase in collateral received associated with higher derivative asset position and foreign currency translation movements. |
| · | Deposits and other borrowings increased $89.2 billion (+14%) driven by increased customer deposits in the Institutional division (+$29.2 billion), Australia Retail and Commercial division (+$5.0 billion) and New Zealand division (+$3.5 billion), an increase in deposits from banks and repurchase agreements (+$20.2 billion), an increase in commercial paper issued (+$9.8 billion) and the impact of foreign currency translation movements. |
| · | Debt issuances increased $10.5 billion (+8%) driven by senior debt issuances and the impact of foreign currency translation movements. |
39
GROUP RESULTS
Liquidity Risk - including discontinued operations
Liquidity risk is the risk that the Group is unable to meet its payment obligations as they fall due, including repaying depositors or maturing wholesale debt, or that the Group has insufficient capacity to fund increases in assets. The timing mismatch of cash flows and the related liquidity risk is inherent in all banking operations and is closely monitored by the Group and managed in accordance with the risk appetite set by the Board.
The Group’s approach to liquidity risk management incorporates two key components:
| · | Scenario modelling of funding sources |
ANZ’s liquidity risk appetite is defined by the ability to meet a range of regulatory requirements and internal liquidity metrics mandated by the Board. The metrics cover a range of scenarios of varying duration and level of severity. The objective of this framework is to:
| · | Provide protection against shorter term extreme market dislocation and stress. |
| · | Maintain structural strength in the balance sheet by ensuring that an appropriate amount of longer-term assets are funded with longer-term funding. |
| · | Ensure that no undue timing concentrations exist in the Group’s funding profile. |
A key component of this framework is the Liquidity Coverage Ratio (LCR), which is a severe short term liquidity stress scenario mandated by banking regulators including APRA. As part of meeting LCR requirements, ANZ has a Committed Liquidity Facility (CLF) with the Reserve Bank of Australia (RBA). The CLF has been established to offset the shortage of available High Quality Liquid Assets (HQLA) in Australia and provides an alternative form of contingent liquidity. The total amount of the CLF available to a qualifying Authorised Deposit-taking Institution (ADI) is set annually by APRA. From 1 January 2020, ANZ’s CLF is $35.7 billion (2019 calendar year end: $48.0 billion).
| · | Liquid assets |
The Group holds a portfolio of high quality unencumbered liquid assets in order to protect the Group’s liquidity position in a severely stressed environment, as well as to meet regulatory requirements. High Quality Liquid Assets comprise three categories, with the definitions consistent with Basel 3 LCR:
| · | Highest-quality liquid assets (HQLA1): Cash, highest credit quality government, central bank or public sector securities eligible for repurchase with central banks to provide same-day liquidity. |
| · | High-quality liquid assets (HQLA2): High credit quality government, central bank or public sector securities, high quality corporate debt securities and high quality covered bonds eligible for repurchase with central banks to provide same-day liquidity. |
| · | Alternative liquid assets (ALA): Assets qualifying as collateral for the CLF and other eligible securities listed by the Reserve Bank of New Zealand (RBNZ). |
The Group monitors and manages the size and composition of its liquid assets portfolio on an ongoing basis in line with regulatory requirements and the risk appetite set by the Board.
COVID-19 has impacted the normal operations of financial markets including funding markets, however the actions of governments globally and central banks including; the RBA, RBNZ and the US Federal Reserve have provided significant liquidity support to the system and financial markets generally.ANZ’s liquidity measures have remained above management targets throughout this period and have strengthened further following the actions of central banks.
| Half Year Average | Movement | |||||||||||||||||||||
| Mar 20 $B |
Sep 19 $B |
Mar 19 $B |
Mar 20 v. Sep 19 |
Mar 20 v. Mar 19 |
||||||||||||||||||
| Market Values Post Discount1 |
||||||||||||||||||||||
| HQLA1 |
159.3 | 131.5 | 134.5 | 21% | 18% | |||||||||||||||||
| HQLA2 |
9.6 | 9.5 | 7.6 | 1% | 26% | |||||||||||||||||
| Internal Residential Mortgage Backed Securities |
27.7 | 34.5 | 34.2 | -20% | -19% | |||||||||||||||||
| Other ALA2 |
12.8 | 12.2 | 12.9 | 5% | -1% | |||||||||||||||||
| Total liquid assets |
209.4 | 187.7 | 189.2 | 12% | 11% | |||||||||||||||||
| Cash flows modelled under stress scenario |
||||||||||||||||||||||
| Cash outflows |
191.9 | 176.6 | 176.3 | 9% | 9% | |||||||||||||||||
| Cash inflows |
41.2 | 45.4 | 38.6 | -9% | 7% | |||||||||||||||||
| Net cash outflows |
150.7 | 131.2 | 137.7 | 15% | 9% | |||||||||||||||||
| Liquidity Coverage Ratio3 |
139% | 143% | 137% | -4% | 2% | |||||||||||||||||
| 1. | Half year average basis, calculated as prescribed per APRA Prudential Regulatory Standard (APS 210 Liquidity) and consistent with APS 330 requirements. |
| 2. | Comprised of assets qualifying as collateral for the CLF, excluding internal residential mortgage backed securities, up to approved facility limit; and any liquid assets contained in the RBNZ’s Liquidity Policy - Annex: Liquidity Assets - Prudential Supervision Department Document BS13A12. |
| 3. | All currency Level 2 LCR. |
40
GROUP RESULTS
Funding - including discontinued operations
ANZ targets a diversified funding base, avoiding undue concentrations by investor type, maturity, market source and currency.
$11.9 billion of term wholesale debt with a remaining term greater than one year as at 31 March 2020 was issued during the half year ended 31 March 2020.
The following table shows the Group’s total funding composition:
| As at | Movement | |||||||||||||||||||
|
Mar 20 |
Sep 19 | Mar 19 | Mar 20 | Mar 20 | ||||||||||||||||
| $B | $B | $B | v. Sep 19 | v. Mar 19 | ||||||||||||||||
| Customer deposits and other liabilities |
||||||||||||||||||||
| Australia Retail and Commercial |
213.0 | 208.0 | 203.4 | 2% | 5% | |||||||||||||||
| Institutional |
258.5 | 217.3 | 205.4 | 19% | 26% | |||||||||||||||
| New Zealand |
91.2 | 83.4 | 85.4 | 9% | 7% | |||||||||||||||
| Pacific |
3.8 | 3.5 | 3.5 | 9% | 9% | |||||||||||||||
| TSO and Group Centre1 |
- | (0.4 | ) | (4.3 | ) | -100% | -100% | |||||||||||||
| Customer deposits |
566.5 | 511.8 | 493.4 | 11% | 15% | |||||||||||||||
| Other funding liabilities2,3 |
11.1 | 9.6 | 8.6 | 16% | 29% | |||||||||||||||
| Total customer liabilities (funding) |
577.6 | 521.4 | 502.0 | 11% | 15% | |||||||||||||||
| Wholesale funding |
||||||||||||||||||||
| Debt issuances |
119.1 | 113.1 | 113.4 | 5% | 5% | |||||||||||||||
| Subordinated debt |
21.1 | 16.6 | 16.3 | 27% | 29% | |||||||||||||||
| Certificates of deposit |
37.9 | 36.6 | 43.6 | 4% | -13% | |||||||||||||||
| Commercial paper |
21.8 | 11.7 | 14.7 | 86% | 48% | |||||||||||||||
| Other wholesale borrowings4,5 |
130.0 | 92.3 | 100.1 | 41% | 30% | |||||||||||||||
| Total wholesale funding |
329.9 | 270.3 | 288.1 | 22% | 15% | |||||||||||||||
| Shareholders’ equity |
61.4 | 60.8 | 60.0 | 1% | 2% | |||||||||||||||
| Total funding |
968.9 | 852.5 | 850.1 | 14% | 14% | |||||||||||||||
| 1. | Includes term deposits, other deposits and an adjustment recognised in prior periods in Group Centre to eliminate Wealth Australia discontinued operations investments in ANZ deposit products. |
| 2. | Includes interest accruals, payables and other liabilities, provisions and net tax provisions, excluding other liabilities in Wealth Australia discontinued operations. |
| 3. | Excludes liability for acceptances as they do not provide net funding. |
| 4. | Includes borrowings from banks, securities sold under repurchase agreements, net derivative balances, special purpose vehicles and other borrowings. |
| 5. | Includes RBA open repurchase arrangement netted down by the exchange settlement account cash balance. |
Net Stable Funding Ratio
The following table shows the Level 2 Net Stable Funding Ratio (NSFR) composition:
| As at | Movement | |||||||||||||||||||
|
Mar 20 |
Sep 19 | Mar 19 | Mar 20 | Mar 20 | ||||||||||||||||
| $B | $B | $B | v. Sep 19 | v. Mar 19 | ||||||||||||||||
| Required Stable Funding1 |
||||||||||||||||||||
| Retail & small and medium enterprises, corporate loans <35% risk weight2 |
187.4 | 182.2 | 182.9 | 3% | 2% | |||||||||||||||
| Retail & small and medium enterprises, corporate loans >35% risk weight2 |
193.2 | 180.7 | 189.1 | 7% | 2% | |||||||||||||||
| Other lending3 |
26.9 | 27.6 | 23.2 | -3% | 16% | |||||||||||||||
| Liquid assets |
16.0 | 12.4 | 10.7 | 29% | 50% | |||||||||||||||
| Other assets4 |
45.3 | 40.0 | 40.2 | 13% | 13% | |||||||||||||||
| Total Required Stable Funding |
468.8 | 442.9 | 446.1 | 6% | 5% | |||||||||||||||
| Available Stable Funding1 |
||||||||||||||||||||
| Retail & small and medium enterprise customer deposits |
257.3 | 241.3 | 236.6 | 7% | 9% | |||||||||||||||
| Corporate, public sector entities & operational deposits |
110.0 | 93.5 | 91.5 | 18% | 20% | |||||||||||||||
| Central bank & other financial institution deposits |
5.5 | 6.2 | 6.1 | -11% | -10% | |||||||||||||||
| Term funding |
95.8 | 95.6 | 101.2 | 0% | -5% | |||||||||||||||
| Short term funding & other liabilities |
1.4 | 2.0 | 3.7 | -30% | -62% | |||||||||||||||
| Capital |
82.1 | 76.9 | 73.9 | 7% | 11% | |||||||||||||||
| Total Available Stable Funding |
552.1 | 515.5 | 513.0 | 7% | 8% | |||||||||||||||
| Net Stable Funding Ratio |
118% | 116% | 115% | 2% | 3% | |||||||||||||||
| 1. | NSFR factored balance as per APRA Prudential Regulatory Standard APS 210 Liquidity. |
| 2. | Risk weighting as per APRA Prudential Regulatory Standard APS 112 Capital Adequacy: Standardised Approach to Credit Risk. |
| 3. | Includes financial institution and central bank loans. |
| 4. | Includes off-balance sheet items, net derivatives and other assets. |
41
GROUP RESULTS
Capital Management - including discontinued operations
| As at
|
||||||||||||||||||||||||||
|
APRA Basel 3
|
Internationally Comparable Basel 31
|
|||||||||||||||||||||||||
|
Mar 20 |
Sep 19 |
Mar 19 |
Mar 20 |
Sep 19 |
Mar 19 |
|||||||||||||||||||||
| Capital Ratios (Level 2) |
||||||||||||||||||||||||||
| Common Equity Tier 1 |
10.8% | 11.4% | 11.5% | 15.5% | 16.4% | 16.9% | ||||||||||||||||||||
| Tier 1 |
12.5% | 13.2% | 13.4% | 17.8% | 18.8% | 19.3% | ||||||||||||||||||||
| Total capital |
15.5% | 15.3% | 15.3% | 21.5% | 21.4% | 21.7% | ||||||||||||||||||||
| Risk weighted assets ($B) |
449.0 | 417.0 | 396.3 | 353.7 | 330.4 | 310.9 | ||||||||||||||||||||
| 1. | Internationally Comparable methodology aligns with APRA’s information paper entitled “International Capital Comparison Study” (13 July 2015). |
APRA Basel 3 Common Equity Tier 1 (CET1 ratio) - March 2020 v September 2019
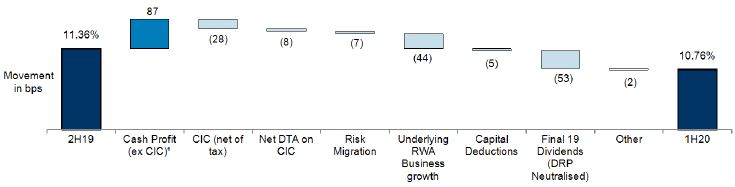
| 1. | Excludes large/notable items for the purposes of Regulatory Capital Management attribution which are included in ‘other’ with the exception of Asian associate impairments which are nil impact to capital since it results in an equivalent reduction in capital deductions. Refer to pages 13 to 16. |
| · | March 2020 v September 2019 |
ANZ’s CET1 ratio decreased 60 bps to 10.8% during the March 2020 half. Key drivers of the movement in the CET1 ratio were:
| · | Cash NPAT (excluding large/notable items and credit impairment charge or CIC) increased the CET1 ratio by +87 bps |
| · | The above however was offset by : |
| · | The impact from increases in CIC including the associated deferred tax assets (DTA) increase, along with the impact of RWA risk migration, which totalled -43 bps. These increases were primarily driven by the COVID-19 impact. |
| · | Higher underlying RWA usage (excluding foreign currency translation movements, regulatory changes and other one-offs) from strong lending growth, mainly within the Institutional division. |
| · | Capital deductions reduced the CET1 ratio by -5 bps, representing the movements in retained earnings in deconsolidated entities, capitalised software and other intangible movements during the half. |
| · | Payment of the September 2019 final dividend (net of BOP issuance, neutralised DRP) which reduced the CET1 ratio by 53 bps. |
| · | Other impacts of -2 bps. This included the capital benefits from sale of the Pension and Investment business to IOOF (+19 bps), but was more than offset by the impacts from net increase in RWA imposts (-5 bps) which included the implementation of AASB 16, large/notable adjustments (-7 bps) and various other movements (-9 bps). |
| Total Risk Weighted Assets | As at
|
Movement
|
||||||||||||||||||||
|
Mar 20 $B |
Sep 19 $B |
Mar 19 $B |
Mar 20 v. Sep 19 |
Mar 20 v. Mar 19 |
||||||||||||||||||
| Credit RWA |
386.0 | 358.1 | 345.5 | 8% | 12% | |||||||||||||||||
| Market risk and IRRBB RWA |
15.1 | 12.3 | 13.1 | 22% | 15% | |||||||||||||||||
| Operational RWA |
47.9 | 46.6 | 37.7 | 3% | 27% | |||||||||||||||||
| Total RWA |
449.0 | 417.0 | 396.3 | 8% | 13% | |||||||||||||||||
42
GROUP RESULTS
Total Risk Weighted Assets (RWA) - March 2020 v September 2019
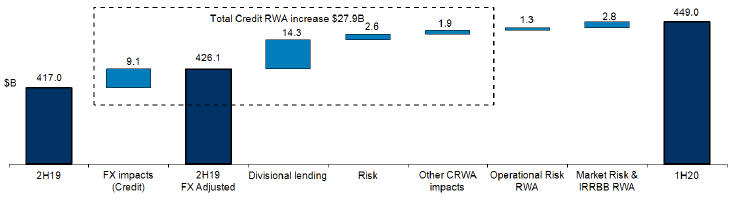
| · | March 2020 v September 2019 |
Total RWA increased by $32.0 billion. Excluding the impact of foreign currency translation movements and other non-recurring CRWA changes, underlying CRWAs (divisional lending and risk migration) increased by $16.9 billion, mainly driven by lending growth in the Institutional division. Other CRWA changes are mainly net impacts from RWA imposts including the impacts from implementation of AASB 16. The total increase in non-CRWA was $4.1 billion, of which of $2.8 billion mainly reflects increase in Market Risk RWA as a result of increased market volatility and IRRBB RWA due to a deterioration in embedded gains. The increase in Operational Risk RWA of $1.3 billion is due to impacts of foreign exchange movements.
APRA to Internationally Comparable1 Common Equity Tier 1 (CET1 ratio) as at 31 March 2020
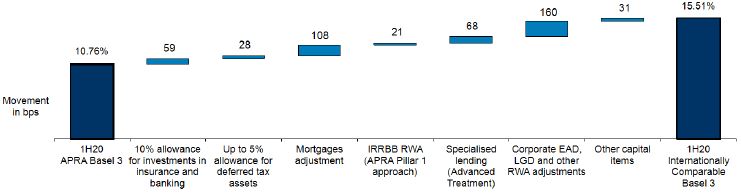
| 1. | ANZ’s interpretation of the regulations documented in the Basel Committee publications: “Basel 3: A global regulatory framework for more resilient banks and banking systems” (June 2011) and “International Convergence of Capital Measurement and Capital Standards” (June 2006). Also includes differences identified in APRA’s information paper entitled “International Capital Comparison Study” (13 July 2015). |
The above provides a reconciliation of the CET1 ratio under APRA’s Basel 3 prudential capital standards to Internationally Comparable Basel 3 standards. APRA views the Basel 3 reforms as a minimum requirement and hence has not incorporated some of the concessions proposed in the Basel 3 rules and has also set higher requirements in other areas. As a result, Australian banks’ Basel 3 reported capital ratios will not be directly comparable with international peers. The International Comparable Basel 3 CET1 ratio incorporates differences between APRA and both the Basel Committee Basel 3 framework (including differences identified in the March 2014 Basel Committee’s Regulatory Consistency Assessment Programme (RCAP) on Basel 3 implementation in Australia) and its application in major offshore jurisdictions.
The material differences between APRA Basel 3 and Internationally Comparable Basel 3 ratios include:
Deductions
| · | Investments in insurance and banking associates - APRA requires full deduction against CET1. On an Internationally Comparable basis, these investments are subject to a concessional threshold before a deduction is required. |
| · | Deferred tax assets - A full deduction is required from CET1 for deferred tax assets (DTA) relating to temporary differences. On an Internationally Comparable basis, this is first subject to a concessional threshold before the deduction is required. |
Risk Weighted Assets (RWA)
| · | Mortgages RWA - APRA imposes a floor of 20% on the downturn Loss Given Default (LGD) used in credit RWA calculations for residential mortgages. The Internationally Comparable Basel 3 framework requires a downturn LGD floor of 10%. Additionally, from July 2016, APRA requires a higher correlation factor than the Basel framework. |
| · | IRRBB RWA - APRA requires inclusion of Interest Rate Risk in the Banking Book (IRRBB) within the RWA base for the CET1 ratio calculation. This is not required on an Internationally Comparable basis. |
| · | Specialised lending - APRA requires the supervisory slotting approach to be used in determining credit RWA for specialised lending exposures. The Internationally Comparable basis allows for the advanced internal ratings based approach to be used when calculating RWA for these exposures. |
| · | Unsecured Corporate Lending LGD - an adjustment to align ANZ’s unsecured corporate lending LGD to 45% to be consistent with banks in other jurisdictions. The 45% LGD rate is also used in the Foundation Internal Ratings-Based approach (FIRB). |
| · | Undrawn Corporate Lending Exposure at Default (EAD) - an adjustment to ANZ’s credit conversion factors (CCF) for undrawn corporate loan commitments to 75% (used in FIRB approach) to align with banks in other jurisdictions. |
43
GROUP RESULTS
Leverage Ratio - including discontinued operations
At 31 March 2020, the Group’s APRA Leverage Ratio was 5.0% which is above the 3.5% APRA proposed minimum for internal ratings-based approach ADI (IRB ADI) which includes ANZ. The following table summarises the Group’s Leverage Ratio calculation:
| As at | Movement | |||||||||||||||||||
| Mar 20 | Sep 19 | Mar 19 | Mar 20 | Mar 20 | ||||||||||||||||
| $M | $M | $M | v. Sep 19 | v. Mar 19 | ||||||||||||||||
| Tier 1 Capital (net of capital deductions) |
56,295 | 55,221 | 53,075 | 2% | 6% | |||||||||||||||
| On-balance sheet exposures (excluding derivatives and securities financing transaction exposures) |
899,411 | 810,644 | 810,915 | 11% | 11% | |||||||||||||||
| Derivative exposures |
42,868 | 34,258 | 31,439 | 25% | 36% | |||||||||||||||
| Securities financing transaction exposures |
67,443 | 36,923 | 37,287 | 83% | 81% | |||||||||||||||
| Other off-balance sheet exposures |
114,677 | 107,400 | 105,942 | 7% | 8% | |||||||||||||||
| Total exposure measure |
1,124,399 | 989,225 | 985,583 | 14% | 14% | |||||||||||||||
| APRA Leverage Ratio |
5.0% | 5.6% | 5.4% | |||||||||||||||||
| Internationally Comparable Leverage Ratio |
5.6% | 6.2% | 6.0% | |||||||||||||||||
| • | March 2020 v September 2019 |
APRA leverage ratio decreased 57 bps during the half. Key drivers of the movement were:
| • | On balance sheet exposures growth primarily from higher liquids and loan growth in the Institutional business (-32 bps). |
| • | Growth in securities financing transactions further decreased the leverage ratio by 15 bps. |
| • | Increase in derivatives exposures and non-market other off-balance sheet exposures reduced the leverage ratio by 6 bps. |
| • | Net other impacts of -4 bps. This included the benefits from sale of the Pension and Investment business to IOOF (+8 bps) but is more than offset by impacts from increased deferred tax assets (-4 bps), large and notable adjustments (-3 bps), impact from implementation of AASB 16 (-2 bps) and other items (-3 bps). |
44
GROUP RESULTS
Capital Management – Other Developments
| • | Capital Requirements – Unquestionably Strong |
The Australian Government completed a comprehensive inquiry into Australia’s financial system in 2014 which included a number of key recommendations that may have an impact on regulatory capital levels. APRA initiatives in support of the recommendations are:
| • | In July 2017, APRA released an information paper outlining its assessment on the additional capital required for the Australian banking sector to be considered ‘unquestionably strong’ as originally outlined in the FSI final report in December 2014. APRA indicated that “in the case of the four major Australian banks, this equated to a benchmark CET1 capital ratio, under the current capital adequacy framework, of at least 10.5 percent from 1 January 2020”. |
| • | APRA is consulting on a number of proposals in relation to risk-weighting framework revisions to credit risk, operational risk, market risk and interest rate risk in the banking book requirements. While the final forms of these proposals is not yet determined, the Group expects the implementation of any revisions to the current requirements will result in further changes to the risk weighting framework for certain asset classes and other risk types (such as market and operational risk). APRA has announced that it does not expect that the changes to the risk weights will necessitate further increases in capital for ADIs, although this could vary by ADIs depending on the final requirements. |
| • | APRA released a discussion paper in August 2018 on adjustments to the overall design of the capital framework to improve transparency, international comparability and flexibility of the ADIs capital framework. The focus of the proposals is on the presentation of the capital ratios to facilitate comparability whilst recognising the relative capital strength of ADIs and measures to enhance supervisory flexibility in times of financial stress. |
APRA’s consultation for the above is ongoing. In response to the challenging economic environment resulting from the COVID-19 disruptions, APRA has:
| • | Announced a temporary change to its expectations with regards to ADIs maintaining bank capital ratios at the Unquestionably Strong benchmark of 10.5% for CET1. During the period of disruption, APRA would not be concerned if ADIs are not meeting this benchmark as the current large buffers may be needed to facilitate ongoing lending to the Australian economy. |
| • | Deferred its scheduled implementation of changes to ADIs risk-weighting framework by one year. The majority of the capital reforms were initially due for implementation on 1 January 2022, but these have now been revised to 1 January 2023. The deferral also includes APRA proposals on improving transparency, international comparability and flexibility of the ADIs capital framework. |
Given the number of items that are yet to be finalised by APRA, the final outcome of the FSI including any further changes to APRA’s prudential standards or other impacts on the Group remains uncertain.
| • | APRA Guidance on Capital Management |
As a result of the COVID-19 disruption, on 7 April 2020, APRA wrote to ADIs and provided additional guidance to ADIs on the factors to consider when making decisions on discretionary capital distributions such as the Group’s ordinary share dividend. APRA has also indicated that during the period of the disruption (and at least in the next two months from the date of the guidance), APRA expects ADIs to seriously consider deferring decisions on the appropriate level of dividends until the outlook is clearer. However, where a Board is confident that they are able to approve a dividend before this, on the basis of robust stress testing results that have been discussed with APRA, this should nevertheless be at a materially reduced level. Dividend payments should be offset to the extent possible through the use of dividend reinvestment plans and other capital management initiatives.
| • | APRA Total Loss Absorbing Capacity Requirements |
In July 2019, APRA announced its decision on loss-absorbing capacity in which it will require domestic systemically important banks (D-SIBs), including ANZ, to increase their Total Capital by 3% of risk-weighted assets by January 2024. Based on ANZ’s capital position as at 31 March 2020, this represents an incremental increase in the Total Capital requirement of approximately $9 billion, with an equivalent decrease in other senior funding. APRA has stated that it anticipates that D-SIBs would satisfy the requirement predominantly with Tier 2 capital.
| • | Revisions to Related Entities Framework |
APRA announced in August 2019 that it will implement its proposal to reduce limits for Australian ADIs’ exposure to related entities, reducing limits from 50% of Level 1 Total capital to 25% of Level 1 Tier 1 capital. As exposures are measured net of capital deductions, the proposed changes to APRA’s capital regulations (contained in APS111 below) would affect the measurement of ADIs exposures. On the basis that the APS111 revisions are implemented as currently proposed, the reduction in the above limits is not expected to have a material impact on ANZ and its subsidiaries. The implementation date for changes to the related entities framework has been deferred by APRA to 1 January 2022 (12 month deferral from initial implementation date of 1 January 2021).
45
GROUP RESULTS
| • | Revisions to APS111 Capital Adequacy |
In October 2019, APRA released a discussion paper on draft revisions to the prudential standards APS111 Capital Adequacy: Measurement of Capital for consultation. The most material change from APRA’s proposal is in relation to the treatment of capital investments for each banking and insurance subsidiary at Level 1 with the tangible component of the investment changing from 400% risk weighting to:
| • | 250% risk weighting up to an amount equal to 10% of ANZ’s net Level 1 Common Equity Tier 1 (CET1); and |
| • | the remainder of the investment will be treated as a CET1 capital deduction. |
ANZ is reviewing the implications for its current investments. The net impact on the Group is unclear and will depend upon a number of factors including the capitalisation of the affected subsidiaries at the time of implementation, the final form of the prudential standard, as well as the effect of management actions being pursued that have the potential to materially offset the impact of these proposals. Based on ANZ’s current investment in its affected subsidiaries and in the absence of any offsetting management actions, the above proposals implies a reduction in ANZ’s Level 1 CET1 capital ratio of up to approximately $2.5bn (~75 basis points). However, ANZ believes that this outcome is unlikely and, post implementation of management actions, the net capital impact could be minimal. There is no impact on ANZ’s Level 2 CET1 capital ratio arising from these proposed changes. The proposed implementation date of 1 January 2021 for these changes is currently under review by APRA in line with their announcements to suspend public consultation on revisions to prudential standards that are currently underway or upcoming, with no plans for recommencement before 30 September 2020.
| • | The Reserve Bank of New Zealand (RBNZ) review of capital requirements |
On 5 December 2019, ANZBGL provided an update on the impacts of the release of RBNZ’s final capital requirements. The key changes to the RBNZ final capital requirements relative to the consultation paper:
| • | No change in total Tier 1 capital required for ANZ New Zealand of 16%, the transition period is longer at seven years, and there is a reduced impact on CET1 capital for the Group; |
| • | A greater proportion of the increase is in AT1 capital (2.5% compared to the initial proposal of 1.5%), decreasing the amount of CET1 capital required; and |
| • | Redeemable preference shares are allowable as AT1 capital. It is anticipated that ANZ New Zealand will be able to refinance existing internal AT1 securities to external counterparties. |
At the time of the RBNZ announcement the net impact on the Group is an increase in CET1 capital of approximately A$3.0 billion by July 2027 over the seven year transition period (based on the Group’s 30 September 2019 balance sheet), which includes an approximately A$1.0 billion management buffer.
The RBNZ has delayed the commencement date of the increased capital requirements by 12 months to 1 July 2021 (from 1 July 2020) in response to the uncertainties from the COVID-19 pandemic.
| • | RBNZ announcement on actions to support the banking system |
With effect from 2 April 2020, the RBNZ amended ANZ New Zealand’s Conditions of Registration to (among other things) prohibit ANZ New Zealand from making distributions other than discretionary payments payable to holders of Additional Tier 1 capital instruments. This restriction applies to all New Zealand-incorporated banks, and is intended to support the stability of the financial system during the COVID-19 pandemic. These requirements prevent ANZ New Zealand from redeeming its NZ$500 million Capital Notes in May 2020, although ANZ New Zealand can continue making coupon payments on those Capital Notes. The terms of the Capital Notes provide for their conversion into a variable number of ANZBGL shares in May 2020 (ANZ New Zealand option) or May 2022 subject to certain conditions. Conversion would result in an increase in the Group’s CET1 capital (~12bps at Level 2). ANZ New Zealand has announced that it will not be exercising its option to convert in May 2020.
46
DIVISIONAL RESULTS
| CONTENTS | Page | |||
| Divisional Performance - continuing operations |
48 | |||
| Australia Retail and Commercial - continuing operations |
53 | |||
| Institutional - continuing operations |
57 | |||
| New Zealand - continuing operations |
64 | |||
| Pacific - continuing operations |
69 | |||
| Technology, Services & Operations (TSO) and Group Centre - continuing operations |
69 | |||
47
DIVISIONAL RESULTS
Divisional Performance - continuing operations
The Group operates on a divisional structure with five continuing divisions: Australia Retail and Commercial, Institutional, New Zealand, Pacific, and Technology, Services & Operations (TSO) and Group Centre. For further information on the composition of divisions, refer to the Definitions on page 141.
The Divisional Results section is reported on a cash profit basis for continuing operations. For information on discontinued operations please refer to the Guide to Half Year Results on page 8.
The divisions reported are consistent with internal reporting provided to the chief operating decision maker, being the Chief Executive Officer.
48
DIVISIONAL RESULTS
Cash profit by division - March 2020 Half Year v March 2019 Half Year
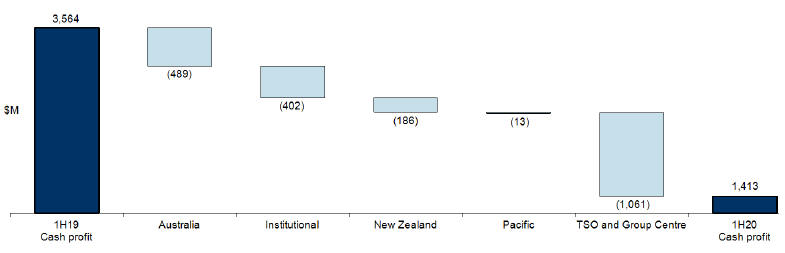
| March 2020 Half Year | Australia Retail and |
Institutional $M |
New Zealand $M |
Pacific $M |
TSO and Group Centre $M |
Group $M |
||||||||||||||||||
| Net interest income |
4,048 | 1,624 | 1,410 | 65 | 75 | 7,222 | ||||||||||||||||||
| Other operating income |
595 | 1,167 | 247 | 50 | (702 | ) | 1,357 | |||||||||||||||||
| Operating income |
4,643 | 2,791 | 1,657 | 115 | (627 | ) | 8,579 | |||||||||||||||||
| Operating expenses |
(2,065 | ) | (1,290 | ) | (690 | ) | (76 | ) | (484 | ) | (4,605 | ) | ||||||||||||
| Profit before credit impairment and income tax |
2,578 | 1,501 | 967 | 39 | (1,111 | ) | 3,974 | |||||||||||||||||
| Credit impairment (charge)/release |
(843 | ) | (641 | ) | (179 | ) | (11 | ) | - | (1,674 | ) | |||||||||||||
| Profit/(Loss) before income tax |
1,735 | 860 | 788 | 28 | (1,111 | ) | 2,300 | |||||||||||||||||
| Income tax expense and non-controlling interests |
(521 | ) | (250 | ) | (221 | ) | (8 | ) | 113 | (887 | ) | |||||||||||||
| Cash profit/(loss) from continuing operations |
1,214 | 610 | 567 | 20 | (998 | ) | 1,413 | |||||||||||||||||
| March 2019 Half Year | Australia Retail and $M |
Institutional $M |
New Zealand $M |
Pacific $M |
TSO and Group Centre $M |
Group $M |
||||||||||||||||||
| Net interest income |
4,092 | 1,579 | 1,385 | 68 | 175 | 7,299 | ||||||||||||||||||
| Other operating income |
651 | 1,126 | 302 | 50 | 318 | 2,447 | ||||||||||||||||||
| Operating income |
4,743 | 2,705 | 1,687 | 118 | 493 | 9,746 | ||||||||||||||||||
| Operating expenses |
(1,913 | ) | (1,320 | ) | (612 | ) | (70 | ) | (450 | ) | (4,365 | ) | ||||||||||||
| Profit before credit impairment and income tax |
2,830 | 1,385 | 1,075 | 48 | 43 | 5,381 | ||||||||||||||||||
| Credit impairment (charge)/release |
(396 | ) | 35 | (30 | ) | (2 | ) | - | (393 | ) | ||||||||||||||
| Profit/(Loss) before income tax |
2,434 | 1,420 | 1,045 | 46 | 43 | 4,988 | ||||||||||||||||||
| Income tax expense and non-controlling interests |
(731 | ) | (408 | ) | (292 | ) | (13 | ) | 20 | (1,424 | ) | |||||||||||||
| Cash profit/(loss) from continuing operations |
1,703 | 1,012 | 753 | 33 | 63 | 3,564 | ||||||||||||||||||
| March 2020 Half Year vs March 2019 Half Year | ||||||||||||||||||||||||
| Australia Retail and |
Institutional | New Zealand | Pacific | TSO and Group Centre |
Group | |||||||||||||||||||
| Net interest income |
-1% | 3% | 2% | -4% | -57% | -1% | ||||||||||||||||||
| Other operating income |
-9% | 4% | -18% | 0% | large | -45% | ||||||||||||||||||
| Operating income |
-2% | 3% | -2% | -3% | large | -12% | ||||||||||||||||||
| Operating expenses |
8% | -2% | 13% | 9% | 8% | 5% | ||||||||||||||||||
| Profit before credit impairment and income tax |
-9% | 8% | -10% | -19% | large | -26% | ||||||||||||||||||
| Credit impairment charge/(release) |
large | large | large | large | n/a | large | ||||||||||||||||||
| Profit/(Loss) before income tax |
-29% | -39% | -25% | -39% | large | -54% | ||||||||||||||||||
| Income tax expense and non-controlling interests |
-29% | -39% | -24% | -38% | large | -38% | ||||||||||||||||||
| Cash profit/(loss) from continuing operations |
-29% | -40% | -25% | -39% | large | -60% | ||||||||||||||||||
49
DIVISIONAL RESULTS
Cash profit by division - March 2020 Half Year v September 2019 Half Year
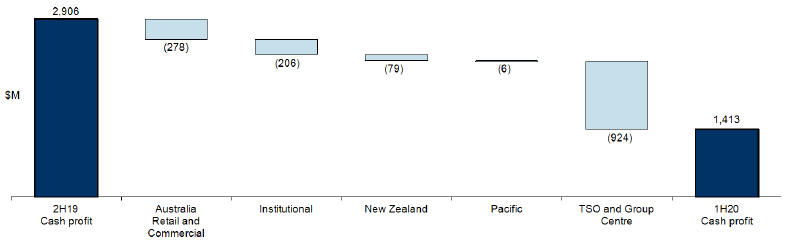
| March 2020 Half Year | Australia Retail and |
Institutional $M |
New Zealand $M |
Pacific $M |
TSO and Group Centre $M |
Group $M |
||||||||||||||||||
| Net interest income |
4,048 | 1,624 | 1,410 | 65 | 75 | 7,222 | ||||||||||||||||||
| Other operating income |
595 | 1,167 | 247 | 50 | (702 | ) | 1,357 | |||||||||||||||||
| Operating income |
4,643 | 2,791 | 1,657 | 115 | (627 | ) | 8,579 | |||||||||||||||||
| Operating expenses |
(2,065 | ) | (1,290 | ) | (690 | ) | (76 | ) | (484 | ) | (4,605 | ) | ||||||||||||
| Profit before credit impairment and income tax |
2,578 | 1,501 | 967 | 39 | (1,111 | ) | 3,974 | |||||||||||||||||
| Credit impairment (charge)/release |
(843 | ) | (641 | ) | (179 | ) | (11 | ) | - | (1,674 | ) | |||||||||||||
| Profit/(Loss) before income tax |
1,735 | 860 | 788 | 28 | (1,111 | ) | 2,300 | |||||||||||||||||
| Income tax expense and non-controlling interests |
(521 | ) | (250 | ) | (221 | ) | (8 | ) | 113 | (887 | ) | |||||||||||||
| Cash profit/(loss) from continuing operations |
1,214 | 610 | 567 | 20 | (998 | ) | 1,413 | |||||||||||||||||
| September 2019 Half Year | Australia Retail and $M |
Institutional $M |
New Zealand $M |
Pacific $M |
TSO and Group Centre $M |
Group $M |
||||||||||||||||||
| Net interest income |
4,000 | 1,501 | 1,351 | 60 | 128 | 7,040 | ||||||||||||||||||
| Other operating income |
696 | 1,066 | 278 | 54 | 149 | 2,243 | ||||||||||||||||||
| Operating income |
4,696 | 2,567 | 1,629 | 114 | 277 | 9,283 | ||||||||||||||||||
| Operating expenses |
(2,161 | ) | (1,347 | ) | (674 | ) | (80 | ) | (444 | ) | (4,706 | ) | ||||||||||||
| Profit before credit impairment and income tax |
2,535 | 1,220 | 955 | 34 | (167 | ) | 4,577 | |||||||||||||||||
| Credit impairment (charge)/release |
(316 | ) | (33 | ) | (57 | ) | 3 | 1 | (402 | ) | ||||||||||||||
| Profit/(Loss) before income tax |
2,219 | 1,187 | 898 | 37 | (166 | ) | 4,175 | |||||||||||||||||
| Income tax expense and non-controlling interests |
(727 | ) | (371 | ) | (252 | ) | (11 | ) | 92 | (1,269 | ) | |||||||||||||
| Cash profit/(loss) from continuing operations |
1,492 | 816 | 646 | 26 | (74 | ) | 2,906 | |||||||||||||||||
| March 2020 Half Year vs September 2019 Half Year | ||||||||||||||||||||||||
| Australia Retail and |
Institutional | New Zealand | Pacific | TSO and Group Centre |
Group | |||||||||||||||||||
| Net interest income |
1% | 8% | 4% | 8% | -41% | 3% | ||||||||||||||||||
| Other operating income |
-15% | 9% | -11% | -7% | large | -40% | ||||||||||||||||||
| Operating income |
-1% | 9% | 2% | 1% | large | -8% | ||||||||||||||||||
| Operating expenses |
-4% | -4% | 2% | -5% | 9% | -2% | ||||||||||||||||||
| Profit before credit impairment and income tax |
2% | 23% | 1% | 15% | large | -13% | ||||||||||||||||||
| Credit impairment charge/(release) |
large | large | large | large | -100% | large | ||||||||||||||||||
| Profit/(Loss) before income tax |
-22% | -28% | -12% | -24% | large | -45% | ||||||||||||||||||
| Income tax expense and non-controlling interests |
-28% | -33% | -12% | -27% | 23% | -30% | ||||||||||||||||||
| Cash profit/(loss) from continuing operations |
-19% | -25% | -12% | -23% | large | -51% | ||||||||||||||||||
50
DIVISIONAL RESULTS
Cash profit by division (excluding large/notable items1) - March 2020 Half Year v March 2019 Half Year
The Group cash profit results include a number of items collectively referred to as large/notable items. While these items form part of cash profit they have been excluded from the tables below given their nature and significance.
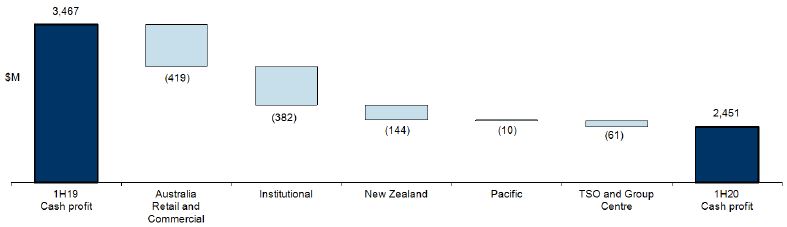
| 1. | Refer to pages 13 to 16 for a description of large/notable items. |
| March 2020 Half Year | Australia Retail and Commercial $M |
Institutional $M |
New Zealand $M |
Pacific $M |
TSO and Group Centre $M |
Group $M |
||||||||||||||||||
| Net interest income |
4,058 | 1,628 | 1,423 | 67 | 89 | 7,265 | ||||||||||||||||||
| Other operating income |
625 | 1,163 | 255 | 50 | 103 | 2,196 | ||||||||||||||||||
| Operating income |
4,683 | 2,791 | 1,678 | 117 | 192 | 9,461 | ||||||||||||||||||
| Operating expenses |
(1,887 | ) | (1,275 | ) | (671 | ) | (74 | ) | (448 | ) | (4,355 | ) | ||||||||||||
| Profit before credit impairment and income tax |
2,796 | 1,516 | 1,007 | 43 | (256 | ) | 5,106 | |||||||||||||||||
| Credit impairment (charge)/release |
(843 | ) | (641 | ) | (179 | ) | (11 | ) | - | (1,674 | ) | |||||||||||||
| Profit/(Loss) before income tax |
1,953 | 875 | 828 | 32 | (256 | ) | 3,432 | |||||||||||||||||
| Income tax expense and non-controlling interests |
(586 | ) | (253 | ) | (233 | ) | (9 | ) | 100 | (981 | ) | |||||||||||||
| Cash profit/(loss) from continuing operations |
1,367 | 622 | 595 | 23 | (156 | ) | 2,451 | |||||||||||||||||
| March 2019 Half Year | Australia Retail and Commercial $M |
Institutional $M |
New Zealand $M |
Pacific $M |
TSO and Group Centre $M |
Group $M |
||||||||||||||||||
| Net interest income |
4,114 | 1,548 | 1,381 | 68 | 181 | 7,292 | ||||||||||||||||||
| Other operating income |
693 | 1,109 | 280 | 50 | 84 | 2,216 | ||||||||||||||||||
| Operating income |
4,807 | 2,657 | 1,661 | 118 | 265 | 9,508 | ||||||||||||||||||
| Operating expenses |
(1,858 | ) | (1,293 | ) | (604 | ) | (70 | ) | (415 | ) | (4,240 | ) | ||||||||||||
| Profit before credit impairment and income tax |
2,949 | 1,364 | 1,057 | 48 | (150 | ) | 5,268 | |||||||||||||||||
| Credit impairment (charge)/release |
(396 | ) | 34 | (30 | ) | (2 | ) | - | (394 | ) | ||||||||||||||
| Profit/(Loss) before income tax |
2,553 | 1,398 | 1,027 | 46 | (150 | ) | 4,874 | |||||||||||||||||
| Income tax expense and non-controlling interests |
(767 | ) | (394 | ) | (288 | ) | (13 | ) | 55 | (1,407 | ) | |||||||||||||
| Cash profit/(loss) from continuing operations |
1,786 | 1,004 | 739 | 33 | (95 | ) | 3,467 | |||||||||||||||||
| March 2020 Half Year vs March 2019 Half Year |
|
|||||||||||||||||||||||
| Australia Retail and Commercial |
Institutional | New Zealand | Pacific | TSO and Group Centre |
Group | |||||||||||||||||||
| Net interest income |
-1% | 5% | 3% | -1% | -51% | 0% | ||||||||||||||||||
| Other operating income |
-10% | 5% | -9% | 0% | 23% | -1% | ||||||||||||||||||
| Operating income |
-3% | 5% | 1% | -1% | -28% | 0% | ||||||||||||||||||
| Operating expenses |
2% | -1% | 11% | 6% | 8% | 3% | ||||||||||||||||||
| Profit before credit impairment and income tax |
-5% | 11% | -5% | -10% | 71% | -3% | ||||||||||||||||||
| Credit impairment charge/(release) |
large | large | large | large | n/a | large | ||||||||||||||||||
| Profit/(Loss) before income tax |
-24% | -37% | -19% | -30% | 71% | -30% | ||||||||||||||||||
| Income tax expense and non-controlling interests |
-24% | -36% | -19% | -31% | 82% | -30% | ||||||||||||||||||
| Cash profit/(loss) from continuing operations |
-23% | -38% | -19% | -30% | 64% | -29% | ||||||||||||||||||
51
DIVISIONAL RESULTS
Cash profit by division (excluding large/notable items1) - March 2020 Half Year v September 2019 Half Year
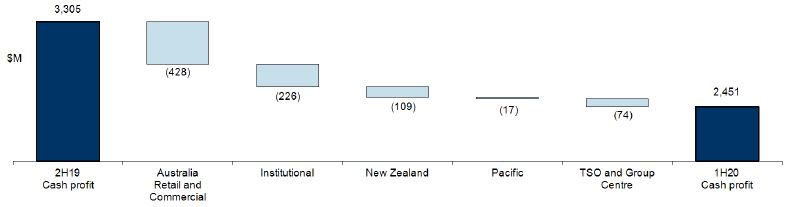
| 1. | Refer to pages 13 to 16 for a description of large/notable items. |
| March 2020 Half Year | Australia Retail and Commercial $M |
Institutional $M |
New Zealand $M |
Pacific $M |
TSO and Group Centre $M |
Group $M |
||||||||||||||||||
| Net interest income |
4,058 | 1,628 | 1,423 | 67 | 89 | 7,265 | ||||||||||||||||||
| Other operating income |
625 | 1,163 | 255 | 50 | 103 | 2,196 | ||||||||||||||||||
| Operating income |
4,683 | 2,791 | 1,678 | 117 | 192 | 9,461 | ||||||||||||||||||
| Operating expenses |
(1,887 | ) | (1,275 | ) | (671 | ) | (74 | ) | (448 | ) | (4,355 | ) | ||||||||||||
| Profit before credit impairment and income tax |
2,796 | 1,516 | 1,007 | 43 | (256 | ) | 5,106 | |||||||||||||||||
| Credit impairment (charge)/release |
(843 | ) | (641 | ) | (179 | ) | (11 | ) | - | (1,674 | ) | |||||||||||||
| Profit/(Loss) before income tax |
1,953 | 875 | 828 | 32 | (256 | ) | 3,432 | |||||||||||||||||
| Income tax expense and non-controlling interests |
(586 | ) | (253 | ) | (233 | ) | (9 | ) | 100 | (981 | ) | |||||||||||||
| Cash profit/(loss) from continuing operations |
1,367 | 622 | 595 | 23 | (156 | ) | 2,451 | |||||||||||||||||
| September 2019 Half Year | Australia Retail and Commercial $M |
Institutional $M |
New Zealand $M |
Pacific $M |
TSO and Group Centre $M |
Group $M |
||||||||||||||||||
| Net interest income |
4,064 | 1,477 | 1,399 | 67 | 131 | 7,138 | ||||||||||||||||||
| Other operating income |
704 | 1,064 | 287 | 54 | 131 | 2,240 | ||||||||||||||||||
| Operating income |
4,768 | 2,541 | 1,686 | 121 | 262 | 9,378 | ||||||||||||||||||
| Operating expenses |
(1,885 | ) | (1,282 | ) | (650 | ) | (73 | ) | (432 | ) | (4,322 | ) | ||||||||||||
| Profit before credit impairment and income tax |
2,883 | 1,259 | 1,036 | 48 | (170 | ) | 5,056 | |||||||||||||||||
| Credit impairment (charge)/release |
(316 | ) | (31 | ) | (57 | ) | 3 | 1 | (400 | ) | ||||||||||||||
| Profit/(Loss) before income tax |
2,567 | 1,228 | 979 | 51 | (169 | ) | 4,656 | |||||||||||||||||
| Income tax expense and non-controlling interests |
(772 | ) | (380 | ) | (275 | ) | (11 | ) | 87 | (1,351 | ) | |||||||||||||
| Cash profit/(loss) from continuing operations |
1,795 | 848 | 704 | 40 | (82 | ) | 3,305 | |||||||||||||||||
| March 2020 Half Year vs September 2019 Half Year | ||||||||||||||||||||||||
| Australia Retail and Commercial |
Institutional | New Zealand | Pacific | TSO and Group Centre |
Group | |||||||||||||||||||
| Net interest income |
0% | 10% | 2% | 0% | -32% | 2% | ||||||||||||||||||
| Other operating income |
-11% | 9% | -11% | -7% | -21% | -2% | ||||||||||||||||||
| Operating income |
-2% | 10% | 0% | -3% | -27% | 1% | ||||||||||||||||||
| Operating expenses |
0% | -1% | 3% | 1% | 4% | 1% | ||||||||||||||||||
| Profit before credit impairment and income tax |
-3% | 20% | -3% | -10% | 51% | 1% | ||||||||||||||||||
| Credit impairment (charge)/release |
large | large | large | large | -100% | large | ||||||||||||||||||
| Profit/(Loss) before income tax |
-24% | -29% | -15% | -37% | 51% | -26% | ||||||||||||||||||
| Income tax expense and non-controlling interests |
-24% | -33% | -15% | -18% | 15% | -27% | ||||||||||||||||||
| Cash profit/(loss) from continuing operations |
-24% | -27% | -15% | -43% | 90% | -26% | ||||||||||||||||||
52
DIVISIONAL RESULTS
Australia Retail and Commercial – continuing operations
Mark Hand
Divisional performance was impacted by a number of large/notable items. Refer to pages 13 to 16 and pages 51 to 52 for details.
| Half Year | Movement | |||||||||||||||||||||||
| Mar 20 $M |
Sep 19 $M |
Mar 19 $M |
Mar 20 v. Sep 19 |
Mar 20 v. Mar 19 |
||||||||||||||||||||
| Net interest income |
4,048 | 4,000 | 4,092 | 1% | -1% | |||||||||||||||||||
| Other operating income |
595 | 696 | 651 | -15% | -9% | |||||||||||||||||||
| Operating income |
4,643 | 4,696 | 4,743 | -1% | -2% | |||||||||||||||||||
| Operating expenses |
(2,065 | ) | (2,161 | ) | (1,913 | ) | -4% | 8% | ||||||||||||||||
| Profit before credit impairment and income tax |
2,578 | 2,535 | 2,830 | 2% | -9% | |||||||||||||||||||
| Credit impairment charge |
(843 | ) | (316 | ) | (396 | ) | large | large | ||||||||||||||||
| Profit before income tax |
1,735 | 2,219 | 2,434 | -22% | -29% | |||||||||||||||||||
| Income tax expense and non-controlling interests |
(521 | ) | (727 | ) | (731 | ) | -28% | -29% | ||||||||||||||||
| Cash profit |
1,214 | 1,492 | 1,703 | -19% | -29% | |||||||||||||||||||
| Balance Sheet |
||||||||||||||||||||||||
| Net loans and advances |
329,812 | 331,871 | 336,584 | -1% | -2% | |||||||||||||||||||
| Other external assets |
3,836 | 4,350 | 4,151 | -12% | -8% | |||||||||||||||||||
| External assets |
333,648 | 336,221 | 340,735 | -1% | -2% | |||||||||||||||||||
| Customer deposits |
212,990 | 208,005 | 203,366 | 2% | 5% | |||||||||||||||||||
| Other external liabilities |
9,478 | 9,610 | 9,665 | -1% | -2% | |||||||||||||||||||
| External liabilities |
222,468 | 217,615 | 213,031 | 2% | 4% | |||||||||||||||||||
| Risk weighted assets |
161,758 | 162,060 | 159,310 | 0% | 2% | |||||||||||||||||||
| Average gross loans and advances |
333,617 | 336,302 | 341,282 | -1% | -2% | |||||||||||||||||||
| Average deposits and other borrowings |
210,214 | 204,791 | 202,765 | 3% | 4% | |||||||||||||||||||
| Ratios |
||||||||||||||||||||||||
| Return on average assets |
0.72% | 0.88% | 0.99% | |||||||||||||||||||||
| Net interest margin |
2.65% | 2.58% | 2.61% | |||||||||||||||||||||
| Operating expenses to operating income |
44.5% | 46.0% | 40.3% | |||||||||||||||||||||
| Operating expenses to average assets |
1.23% | 1.28% | 1.12% | |||||||||||||||||||||
| Individually assessed credit impairment charge/(release) |
318 | 355 | 350 | -10% | -9% | |||||||||||||||||||
| Individually assessed credit impairment charge/(release) as a % of average GLA1 |
0.19% | 0.21% | 0.21% | |||||||||||||||||||||
| Collectively assessed credit impairment charge/(release) |
525 | (39 | ) | 46 | large | large | ||||||||||||||||||
| Collectively assessed credit impairment charge/(release) as a % of average GLA1 |
0.31% | (0.02% | ) | 0.03% | ||||||||||||||||||||
| Gross impaired assets |
1,544 | 1,468 | 1,463 | 5% | 6% | |||||||||||||||||||
| Gross impaired assets as a % of GLA |
0.46% | 0.44% | 0.43% | |||||||||||||||||||||
| Total full time equivalent staff (FTE) |
14,061 | 13,903 | 13,660 | 1% | 3% | |||||||||||||||||||
| 1. | Credit impairment charge used in the ratio relates to gross loans and advances and off-balance sheet commitments - undrawn and contingent liabilities. |
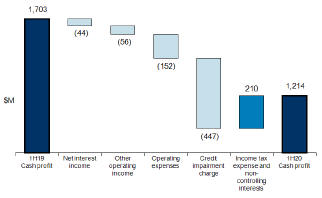
53
DIVISIONAL RESULTS
Australia Retail and Commercial – continuing operations
Mark Hand
| Individually assessed credit impairment charge/(release) | Half Year | Movement | ||||||||||||||||||||||
| Mar 20 $M |
Sep 19 $M |
Mar 19 $M |
Mar 20 v. Sep 19 |
Mar 20 v. Mar 19 |
||||||||||||||||||||
| Retail |
156 | 186 | 195 | -16% | -20% | |||||||||||||||||||
| Home Loans |
28 | 36 | 45 | -22% | -38% | |||||||||||||||||||
| Cards and Personal Loans |
122 | 144 | 147 | -15% | -17% | |||||||||||||||||||
| Deposits and Payments1 |
6 | 6 | 3 | 0% | 100% | |||||||||||||||||||
| Commercial |
162 | 169 | 155 | -4% | 5% | |||||||||||||||||||
| Business Banking |
72 | 73 | 57 | -1% | 26% | |||||||||||||||||||
| Small Business Banking |
90 | 96 | 98 | -6% | -8% | |||||||||||||||||||
| Individually assessed credit impairment charge/(release) |
318 | 355 | 350 | -10% | -9% | |||||||||||||||||||
| Collectively assessed credit impairment charge/(release) | Half Year | Movement | ||||||||||||||||||||||
| Mar 20 $M |
Sep 19 $M |
Mar 19 $M |
Mar 20 v. Sep 19 |
Mar 20 v. Mar 19 |
||||||||||||||||||||
| Retail |
275 | (24 | ) | 35 | large | large | ||||||||||||||||||
| Home Loans |
239 | 35 | 49 | large | large | |||||||||||||||||||
| Cards and Personal Loans |
34 | (57 | ) | (16 | ) | large | large | |||||||||||||||||
| Deposits and Payments1 |
2 | (2 | ) | 2 | large | 0% | ||||||||||||||||||
| Commercial |
250 | (15 | ) | 11 | large | large | ||||||||||||||||||
| Business Banking |
137 | (15 | ) | 4 | large | large | ||||||||||||||||||
| Small Business Banking |
113 | (3 | ) | 5 | large | large | ||||||||||||||||||
| Private Bank |
- | 3 | 2 | -100% | -100% | |||||||||||||||||||
| Collectively assessed credit impairment charge/(release) |
525 | (39 | ) | 46 | large | large | ||||||||||||||||||
| Net loans and advances | As at | Movement | ||||||||||||||||||||||
| Mar 20 $M |
Sep 19 $M |
Mar 19 $M |
Mar 20 v. Sep 19 |
Mar 20 v. Mar 19 |
||||||||||||||||||||
| Retail |
272,696 | 274,797 | 279,483 | -1% | -2% | |||||||||||||||||||
| Home Loans |
263,580 | 264,981 | 269,020 | -1% | -2% | |||||||||||||||||||
| Cards and Personal Loans |
8,370 | 8,958 | 9,574 | -7% | -13% | |||||||||||||||||||
| Deposits and Payments1 |
61 | 69 | 42 | -12% | 45% | |||||||||||||||||||
| Advice |
685 | 789 | 847 | -13% | -19% | |||||||||||||||||||
| Commercial |
57,116 | 57,074 | 57,101 | 0% | 0% | |||||||||||||||||||
| Business Banking |
41,759 | 41,275 | 40,805 | 1% | 2% | |||||||||||||||||||
| Small Business Banking |
13,030 | 13,803 | 14,265 | -6% | -9% | |||||||||||||||||||
| Private Bank |
2,327 | 1,996 | 2,031 | 17% | 15% | |||||||||||||||||||
| Net loans and advances |
329,812 | 331,871 | 336,584 | -1% | -2% | |||||||||||||||||||
| Customer deposits | As at | Movement | ||||||||||||||||||||||
| Mar 20 $M |
Sep 19 $M |
Mar 19 $M |
Mar 20 v. Sep 19 |
Mar 20 v. Mar 19 |
||||||||||||||||||||
| Retail |
123,435 | 120,880 | 117,374 | 2% | 5% | |||||||||||||||||||
| Home Loans2 |
28,133 | 27,078 | 26,915 | 4% | 5% | |||||||||||||||||||
| Cards and Personal Loans |
254 | 265 | 240 | -4% | 6% | |||||||||||||||||||
| Deposits and Payments |
95,048 | 93,537 | 90,219 | 2% | 5% | |||||||||||||||||||
| Commercial |
89,555 | 87,125 | 85,992 | 3% | 4% | |||||||||||||||||||
| Business Banking |
20,630 | 19,731 | 19,797 | 5% | 4% | |||||||||||||||||||
| Small Business Banking |
43,773 | 41,799 | 40,614 | 5% | 8% | |||||||||||||||||||
| Private Bank |
25,152 | 25,595 | 25,581 | -2% | -2% | |||||||||||||||||||
| Customer deposits |
212,990 | 208,005 | 203,366 | 2% | 5% | |||||||||||||||||||
| 1. | Net loans and advances for the deposits and payments business represent amounts in overdraft. |
| 2. | Customer deposit amounts for the home loans business represent balances in offset accounts. |
54
DIVISIONAL RESULTS
Australia Retail and Commercial – continuing operations
Mark Hand
| March 2020 Half Year | Retail $M |
Commercial $M |
Total $M |
|||||||||
| Net interest income |
2,754 | 1,294 | 4,048 | |||||||||
| Other operating income |
385 | 210 | 595 | |||||||||
| Operating income |
3,139 | 1,504 | 4,643 | |||||||||
| Operating expenses |
(1,403 | ) | (662 | ) | (2,065 | ) | ||||||
| Profit before credit impairment and income tax |
1,736 | 842 | 2,578 | |||||||||
| Credit impairment (charge)/release |
(431 | ) | (412 | ) | (843 | ) | ||||||
| Profit before income tax |
1,305 | 430 | 1,735 | |||||||||
| Income tax expense and non-controlling interests |
(392 | ) | (129 | ) | (521 | ) | ||||||
| Cash profit |
913 | 301 | 1,214 | |||||||||
| Individually assessed credit impairment charge/(release) |
156 | 162 | 318 | |||||||||
| Collectively assessed credit impairment charge/(release) |
275 | 250 | 525 | |||||||||
| Net loans and advances |
272,696 | 57,116 | 329,812 | |||||||||
| Customer deposits |
123,435 | 89,555 | 212,990 | |||||||||
| Risk weighted assets |
108,238 | 53,520 | 161,758 | |||||||||
| March 2019 Half Year |
||||||||||||
| Net interest income |
2,739 | 1,353 | 4,092 | |||||||||
| Other operating income |
425 | 226 | 651 | |||||||||
| Operating income |
3,164 | 1,579 | 4,743 | |||||||||
| Operating expenses |
(1,289 | ) | (624 | ) | (1,913 | ) | ||||||
| Profit before credit impairment and income tax |
1,875 | 955 | 2,830 | |||||||||
| Credit impairment (charge)/release |
(230 | ) | (166 | ) | (396 | ) | ||||||
| Profit before income tax |
1,645 | 789 | 2,434 | |||||||||
| Income tax expense and non-controlling interests |
(493 | ) | (238 | ) | (731 | ) | ||||||
| Cash profit |
1,152 | 551 | 1,703 | |||||||||
| Individually assessed credit impairment charge/(release) |
195 | 155 | 350 | |||||||||
| Collectively assessed credit impairment charge/(release) |
35 | 11 | 46 | |||||||||
| Net loans and advances |
279,483 | 57,101 | 336,584 | |||||||||
| Customer deposits |
117,374 | 85,992 | 203,366 | |||||||||
| Risk weighted assets |
107,288 | 52,022 | 159,310 | |||||||||
| March 2020 Half Year vs March 2019 Half Year |
||||||||||||
| Net interest income |
1% | -4% | -1% | |||||||||
| Other operating income |
-9% | -7% | -9% | |||||||||
| Operating income |
-1% | -5% | -2% | |||||||||
| Operating expenses |
9% | 6% | 8% | |||||||||
| Profit before credit impairment and income tax |
-7% | -12% | -9% | |||||||||
| Credit impairment (charge)/release |
87% | large | large | |||||||||
| Profit before income tax |
-21% | -46% | -29% | |||||||||
| Income tax expense and non-controlling interests |
-20% | -46% | -29% | |||||||||
| Cash profit |
-21% | -45% | -29% | |||||||||
| Individually assessed credit impairment charge/(release) |
-20% | 5% | -9% | |||||||||
| Collectively assessed credit impairment charge/(release) |
large | large | large | |||||||||
| Net loans and advances |
-2% | 0% | -2% | |||||||||
| Customer deposits |
5% | 4% | 5% | |||||||||
| Risk weighted assets |
1% | 3% | 2% | |||||||||
55
DIVISIONAL RESULTS
Australia Retail and Commercial – continuing operations
Mark Hand
| March 2020 Half Year | Retail $M | Commercial $M |
Total $M |
|||||||||
| Net interest income |
2,754 | 1,294 | 4,048 | |||||||||
| Other operating income |
385 | 210 | 595 | |||||||||
| Operating income |
3,139 | 1,504 | 4,643 | |||||||||
| Operating expenses |
(1,403 | ) | (662 | ) | (2,065 | ) | ||||||
| Profit before credit impairment and income tax |
1,736 | 842 | 2,578 | |||||||||
| Credit impairment (charge)/release |
(431 | ) | (412 | ) | (843 | ) | ||||||
| Profit before income tax |
1,305 | 430 | 1,735 | |||||||||
| Income tax expense and non-controlling interests |
(392 | ) | (129 | ) | (521 | ) | ||||||
| Cash profit |
913 | 301 | 1,214 | |||||||||
| Individually assessed credit impairment charge/(release) |
156 | 162 | 318 | |||||||||
| Collectively assessed credit impairment charge/(release) |
275 | 250 | 525 | |||||||||
| Net loans and advances |
272,696 | 57,116 | 329,812 | |||||||||
| Customer deposits |
123,435 | 89,555 | 212,990 | |||||||||
| Risk weighted assets |
108,238 | 53,520 | 161,758 | |||||||||
| September 2019 Half Year |
||||||||||||
| Net interest income |
2,774 | 1,226 | 4,000 | |||||||||
| Other operating income |
460 | 236 | 696 | |||||||||
| Operating income |
3,234 | 1,462 | 4,696 | |||||||||
| Operating expenses |
(1,585 | ) | (576 | ) | (2,161 | ) | ||||||
| Profit before credit impairment and income tax |
1,649 | 886 | 2,535 | |||||||||
| Credit impairment (charge)/release |
(162 | ) | (154 | ) | (316 | ) | ||||||
| Profit before income tax |
1,487 | 732 | 2,219 | |||||||||
| Income tax expense and non-controlling interests |
(507 | ) | (220 | ) | (727 | ) | ||||||
| Cash profit |
980 | 512 | 1,492 | |||||||||
| Individually assessed credit impairment charge/(release) |
186 | 169 | 355 | |||||||||
| Collectively assessed credit impairment charge/(release) |
(24 | ) | (15 | ) | (39 | ) | ||||||
| Net loans and advances |
274,797 | 57,074 | 331,871 | |||||||||
| Customer deposits |
120,880 | 87,125 | 208,005 | |||||||||
| Risk weighted assets |
109,168 | 52,892 | 162,060 | |||||||||
| March 2020 Half Year vs September 2019 Half Year |
||||||||||||
| Net interest income |
-1% | 6% | 1% | |||||||||
| Other operating income |
-16% | -11% | -15% | |||||||||
| Operating income |
-3% | 3% | -1% | |||||||||
| Operating expenses |
-11% | 15% | -4% | |||||||||
| Profit before credit impairment and income tax |
5% | -5% | 2% | |||||||||
| Credit impairment (charge)/release |
large | large | large | |||||||||
| Profit before income tax |
-12% | -41% | -22% | |||||||||
| Income tax expense and non-controlling interests |
-23% | -41% | -28% | |||||||||
| Cash profit |
-7% | -41% | -19% | |||||||||
| Individually assessed credit impairment charge/(release) |
-16% | -4% | -10% | |||||||||
| Collectively assessed credit impairment charge/(release) |
large | large | large | |||||||||
| Net loans and advances |
-1% | 0% | -1% | |||||||||
| Customer deposits |
2% | 3% | 2% | |||||||||
| Risk weighted assets |
-1% | 1% | 0% | |||||||||
56
DIVISIONAL RESULTS
Institutional - continuing operations
Mark Whelan
Divisional performance was impacted by a number of large/notable items. Refer to pages 13 to 16 and pages 51 to 52 for details.
| Half Year | Movement | |||||||||||||||||||||
| Mar 20 $M |
Sep 19 $M |
Mar 19 $M |
Mar 20 v. Sep 19 |
Mar 20 v. Mar 19 |
||||||||||||||||||
| Net interest income |
1,624 | 1,501 | 1,579 | 8% | 3% | |||||||||||||||||
| Other operating income |
1,167 | 1,066 | 1,126 | 9% | 4% | |||||||||||||||||
| Operating income |
2,791 | 2,567 | 2,705 | 9% | 3% | |||||||||||||||||
| Operating expenses |
(1,290 | ) | (1,347 | ) | (1,320 | ) | -4% | -2% | ||||||||||||||
| Profit before credit impairment and income tax |
1,501 | 1,220 | 1,385 | 23% | 8% | |||||||||||||||||
| Credit impairment (charge)/release |
(641 | ) | (33 | ) | 35 | large | large | |||||||||||||||
| Profit before income tax |
860 | 1,187 | 1,420 | -28% | -39% | |||||||||||||||||
| Income tax expense and non-controlling interests |
(250 | ) | (371 | ) | (408 | ) | -33% | -39% | ||||||||||||||
| Cash profit |
610 | 816 | 1,012 | -25% | -40% | |||||||||||||||||
| Balance Sheet1 |
||||||||||||||||||||||
| Net loans and advances |
199,410 | 164,526 | 152,548 | 21% | 31% | |||||||||||||||||
| Other external assets |
461,548 | 346,094 | 307,198 | 33% | 50% | |||||||||||||||||
| External assets |
660,958 | 510,620 | 459,746 | 29% | 44% | |||||||||||||||||
| Customer deposits |
258,517 | 217,259 | 205,364 | 19% | 26% | |||||||||||||||||
| Other deposits and borrowings |
96,639 | 73,412 | 79,148 | 32% | 22% | |||||||||||||||||
| Deposits and other borrowings |
355,156 | 290,671 | 284,512 | 22% | 25% | |||||||||||||||||
| Other external liabilities |
229,611 | 157,505 | 119,353 | 46% | 92% | |||||||||||||||||
| External liabilities |
584,767 | 448,176 | 403,865 | 30% | 45% | |||||||||||||||||
| Risk weighted assets |
207,028 | 181,088 | 167,406 | 14% | 24% | |||||||||||||||||
| Average gross loans and advances |
175,366 | 159,355 | 153,982 | 10% | 14% | |||||||||||||||||
| Average deposits and other borrowings |
305,506 | 290,948 | 281,770 | 5% | 8% | |||||||||||||||||
| Ratios1 |
||||||||||||||||||||||
| Return on average assets |
0.23% | 0.33% | 0.44% | |||||||||||||||||||
| Net interest margin |
0.78% | 0.80% | 0.85% | |||||||||||||||||||
| Net interest margin (excluding Markets) |
1.81% | 2.02% | 2.10% | |||||||||||||||||||
| Operating expenses to operating income |
46.2% | 52.5% | 48.8% | |||||||||||||||||||
| Operating expenses to average assets |
0.48% | 0.54% | 0.58% | |||||||||||||||||||
| Individually assessed credit impairment charge/(release) |
272 | - | (12 | ) | n/a | large | ||||||||||||||||
| Individually assessed credit impairment charge/(release) as a % of average GLA2 |
0.31% | 0.00% | (0.02% | ) | ||||||||||||||||||
| Collectively assessed credit impairment charge/(release) |
369 | 33 | (23 | ) | large | large | ||||||||||||||||
| Collectively assessed credit impairment charge/(release) as a % of average GLA2 |
0.42% | 0.04% | (0.03% | ) | ||||||||||||||||||
| Gross impaired assets |
742 | 265 | 373 | large | 99% | |||||||||||||||||
| Gross impaired assets as a % of GLA |
0.37% | 0.16% | 0.24% | |||||||||||||||||||
| Total full time equivalent staff (FTE) |
5,350 | 5,468 | 6,085 | -2% | -12% | |||||||||||||||||
| 1. | Balance Sheet amounts include assets and liabilities reclassified as held for sale from continuing operations. |
| 2. | Credit impairment charge used in the ratio relates to gross loans and advances and off-balance sheet commitments - undrawn and contingent liabilities. |
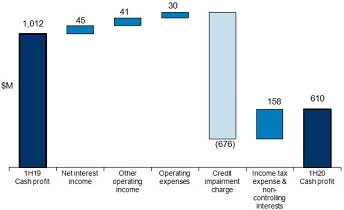
57
DIVISIONAL RESULTS
Institutional - continuing operations
Mark Whelan
Institutional by Geography1
| Half Year |
Movement | |||||||||||||||||||||||
| Australia | Mar 20 $M |
Sep 19 $M |
Mar 19 $M |
Mar 20 v. Sep 19 |
Mar 20 v. Mar 19 |
|||||||||||||||||||
| Net interest income |
920 | 832 | 874 | 11% | 5% | |||||||||||||||||||
| Other operating income |
392 | 518 | 484 | -24% | -19% | |||||||||||||||||||
| Operating income |
1,312 | 1,350 | 1,358 | -3% | -3% | |||||||||||||||||||
| Operating expenses |
(584 | ) | (601 | ) | (606 | ) | -3% | -4% | ||||||||||||||||
| Profit before credit impairment and income tax |
728 | 749 | 752 | -3% | -3% | |||||||||||||||||||
| Credit impairment (charge)/release |
(274 | ) | (15 | ) | 5 | large | large | |||||||||||||||||
| Profit before income tax |
454 | 734 | 757 | -38% | -40% | |||||||||||||||||||
| Income tax expense and non-controlling interests |
(138 | ) | (221 | ) | (227 | ) | -38% | -39% | ||||||||||||||||
| Cash profit |
316 | 513 | 530 | -38% | -40% | |||||||||||||||||||
| Individually assessed credit impairment charge/(release) |
50 | (11 | ) | (1 | ) | large | large | |||||||||||||||||
| Collectively assessed credit impairment charge/(release) |
224 | 26 | (4 | ) | large | large | ||||||||||||||||||
| Net loans and advances |
115,637 | 97,583 | 84,653 | 19% | 37% | |||||||||||||||||||
| Customer deposits |
90,648 | 75,973 | 71,623 | 19% | 27% | |||||||||||||||||||
| Risk weighted assets |
103,240 | 93,090 | 84,617 | 11% | 22% | |||||||||||||||||||
| Asia, Pacific, Europe, and America |
||||||||||||||||||||||||
| Net interest income |
536 | 503 | 546 | 7% | -2% | |||||||||||||||||||
| Other operating income |
698 | 419 | 535 | 67% | 30% | |||||||||||||||||||
| Operating income |
1,234 | 922 | 1,081 | 34% | 14% | |||||||||||||||||||
| Operating expenses |
(615 | ) | (624 | ) | (633 | ) | -1% | -3% | ||||||||||||||||
| Profit before credit impairment and income tax |
619 | 298 | 448 | large | 38% | |||||||||||||||||||
| Credit impairment (charge)/release |
(325 | ) | (12 | ) | 31 | large | large | |||||||||||||||||
| Profit before income tax |
294 | 286 | 479 | 3% | -39% | |||||||||||||||||||
| Income tax expense and non-controlling interests |
(81 | ) | (103 | ) | (129 | ) | -21% | -37% | ||||||||||||||||
| Cash profit |
213 | 183 | 350 | 16% | -39% | |||||||||||||||||||
| Individually assessed credit impairment charge/(release) |
215 | 15 | (6 | ) | large | large | ||||||||||||||||||
| Collectively assessed credit impairment charge/(release) |
110 | (3 | ) | (25 | ) | large | large | |||||||||||||||||
| Net loans and advances |
76,849 | 60,208 | 60,457 | 28% | 27% | |||||||||||||||||||
| Customer deposits |
148,602 | 123,468 | 116,080 | 20% | 28% | |||||||||||||||||||
| Risk weighted assets |
89,491 | 74,997 | 71,248 | 19% | 26% | |||||||||||||||||||
| New Zealand |
||||||||||||||||||||||||
| Net interest income |
168 | 166 | 159 | 1% | 6% | |||||||||||||||||||
| Other operating income |
77 | 129 | 107 | -40% | -28% | |||||||||||||||||||
| Operating income |
245 | 295 | 266 | -17% | -8% | |||||||||||||||||||
| Operating expenses |
(91 | ) | (122 | ) | (81 | ) | -25% | 12% | ||||||||||||||||
| Profit before credit impairment and income tax |
154 | 173 | 185 | -11% | -17% | |||||||||||||||||||
| Credit impairment (charge)/release |
(42 | ) | (6 | ) | (1 | ) | large | large | ||||||||||||||||
| Profit before income tax |
112 | 167 | 184 | -33% | -39% | |||||||||||||||||||
| Income tax expense and non-controlling interests |
(31 | ) | (47 | ) | (52 | ) | -34% | -40% | ||||||||||||||||
| Cash profit |
81 | 120 | 132 | -33% | -39% | |||||||||||||||||||
| Individually assessed credit impairment charge/(release) |
7 | (4 | ) | (5 | ) | large | large | |||||||||||||||||
| Collectively assessed credit impairment charge/(release) |
35 | 10 | 6 | large | large | |||||||||||||||||||
| Net loans and advances |
6,924 | 6,735 | 7,438 | 3% | -7% | |||||||||||||||||||
| Customer deposits |
19,267 | 17,818 | 17,661 | 8% | 9% | |||||||||||||||||||
| Risk weighted assets |
14,297 | 13,001 | 11,541 | 10% | 24% | |||||||||||||||||||
| 1. | Balance Sheet amounts include assets and liabilities reclassified as held for sale from continuing operations. |
58
DIVISIONAL RESULTS
Institutional - continuing operations
Mark Whelan
| Individually assessed credit impairment charge/(release) | Half Year | Movement | ||||||||||||||||||
| Mar 20 $M |
Sep 19 $M |
Mar 19 $M |
Mar 20 v. Sep 19 |
Mar 20 v. Mar 19 |
||||||||||||||||
| Transaction Banking |
227 | (6 | ) | (3 | ) | large | large | |||||||||||||
| Loans & Specialised Finance |
46 | 4 | (10 | ) | large | large | ||||||||||||||
| Markets |
(1 | ) | - | - | n/a | n/a | ||||||||||||||
| Central Functions |
- | 2 | 1 | -100% | -100% | |||||||||||||||
| Individually assessed credit impairment charge/(release) |
272 | - | (12 | ) | n/a | large | ||||||||||||||
| Collectively assessed credit impairment charge/(release) | Half Year | Movement | ||||||||||||||||||
| Mar 20 $M |
Sep 19 $M |
Mar 19 $M |
Mar 20 v. Sep 19 |
Mar 20 v. Mar 19 |
||||||||||||||||
| Transaction Banking |
52 | 10 | 6 | large | large | |||||||||||||||
| Loans & Specialised Finance |
312 | 12 | (22 | ) | large | large | ||||||||||||||
| Markets |
5 | 11 | (6 | ) | -55% | large | ||||||||||||||
| Central Functions |
- | - | (1 | ) | n/a | -100% | ||||||||||||||
| Collectively assessed credit impairment charge/(release) |
369 | 33 | (23 | ) | large | large | ||||||||||||||
| Net loans and advances1 | As at | Movement | ||||||||||||||||||
| Mar 20 $M |
Sep 19 $M |
Mar 19 $M |
Mar 20 v. Sep 19 |
Mar 20 v. Mar 19 |
||||||||||||||||
| Transaction Banking |
22,023 | 19,495 | 18,200 | 13% | 21% | |||||||||||||||
| Loans & Specialised Finance |
128,585 | 110,554 | 107,761 | 16% | 19% | |||||||||||||||
| Markets |
48,714 | 34,473 | 25,902 | 41% | 88% | |||||||||||||||
| Central Functions |
88 | 4 | 685 | large | -87% | |||||||||||||||
| Net loans and advances |
199,410 | 164,526 | 152,548 | 21% | 31% | |||||||||||||||
| Customer deposits1 | As at | Movement | ||||||||||||||||||
| Mar 20 $M |
Sep 19 $M |
Mar 19 $M |
Mar 20 v. Sep 19 |
Mar 20 v. Mar 19 |
||||||||||||||||
| Transaction Banking |
124,159 | 101,766 | 99,479 | 22% | 25% | |||||||||||||||
| Loans & Specialised Finance |
971 | 1,013 | 925 | -4% | 5% | |||||||||||||||
| Markets |
131,277 | 112,471 | 102,411 | 17% | 28% | |||||||||||||||
| Central Functions |
2,110 | 2,009 | 2,549 | 5% | -17% | |||||||||||||||
| Customer deposits |
258,517 | 217,259 | 205,364 | 19% | 26% | |||||||||||||||
| 1. | Balance Sheet amounts include assets and liabilities reclassified as held for sale from continuing operations. |
59
DIVISIONAL RESULTS
Institutional - continuing operations
Mark Whelan
| March 2020 Half Year | Transaction Banking $M |
Loans & Specialised Finance $M |
Markets $M |
Central Functions $M |
Total $M |
|||||||||||||||
| Net interest income |
456 | 754 | 400 | 14 | 1,624 | |||||||||||||||
| Other operating income |
356 | 31 | 764 | 16 | 1,167 | |||||||||||||||
| Operating income |
812 | 785 | 1,164 | 30 | 2,791 | |||||||||||||||
| Operating expenses |
(404 | ) | (301 | ) | (561 | ) | (24 | ) | (1,290 | ) | ||||||||||
| Profit/(Loss) before credit impairment and income tax |
408 | 484 | 603 | 6 | 1,501 | |||||||||||||||
| Credit impairment (charge)/release |
(279 | ) | (358 | ) | (4 | ) | - | (641 | ) | |||||||||||
| Profit/(Loss) before income tax |
129 | 126 | 599 | 6 | 860 | |||||||||||||||
| Income tax expense and non-controlling interests |
(68 | ) | (34 | ) | (134 | ) | (14 | ) | (250 | ) | ||||||||||
| Cash profit/(loss) |
61 | 92 | 465 | (8 | ) | 610 | ||||||||||||||
| Individually assessed credit impairment charge/(release) |
227 | 46 | (1 | ) | - | 272 | ||||||||||||||
| Collectively assessed credit impairment charge/(release) |
52 | 312 | 5 | - | 369 | |||||||||||||||
| Net loans and advances |
22,023 | 128,585 | 48,714 | 88 | 199,410 | |||||||||||||||
| Customer deposits |
124,159 | 971 | 131,277 | 2,110 | 258,517 | |||||||||||||||
| Risk weighted assets |
29,036 | 109,823 | 67,691 | 478 | 207,028 | |||||||||||||||
| March 2019 Half Year1 |
||||||||||||||||||||
| Net interest income |
531 | 742 | 280 | 26 | 1,579 | |||||||||||||||
| Other operating income |
363 | 77 | 667 | 19 | 1,126 | |||||||||||||||
| Operating income |
894 | 819 | 947 | 45 | 2,705 | |||||||||||||||
| Operating expenses |
(406 | ) | (322 | ) | (550 | ) | (42 | ) | (1,320 | ) | ||||||||||
| Profit/(Loss) before credit impairment and income tax |
488 | 497 | 397 | 3 | 1,385 | |||||||||||||||
| Credit impairment (charge)/release |
(3 | ) | 32 | 6 | - | 35 | ||||||||||||||
| Profit/(Loss) before income tax |
485 | 529 | 403 | 3 | 1,420 | |||||||||||||||
| Income tax expense and non-controlling interests |
(133 | ) | (142 | ) | (120 | ) | (13 | ) | (408 | ) | ||||||||||
| Cash profit |
352 | 387 | 283 | (10 | ) | 1,012 | ||||||||||||||
| Individually assessed credit impairment charge/(release) |
(3 | ) | (10 | ) | - | 1 | (12 | ) | ||||||||||||
| Collectively assessed credit impairment charge/(release) |
6 | (22 | ) | (6 | ) | (1 | ) | (23 | ) | |||||||||||
| Net loans and advances |
18,200 | 107,761 | 25,902 | 685 | 152,548 | |||||||||||||||
| Customer deposits |
99,479 | 925 | 102,411 | 2,549 | 205,364 | |||||||||||||||
| Risk weighted assets |
25,475 | 93,198 | 47,902 | 831 | 167,406 | |||||||||||||||
| March 2020 Half Year vs March 2019 Half Year |
||||||||||||||||||||
| Net interest income |
-14% | 2% | 43% | -46% | 3% | |||||||||||||||
| Other operating income |
-2% | -60% | 15% | -16% | 4% | |||||||||||||||
| Operating income |
-9% | -4% | 23% | -33% | 3% | |||||||||||||||
| Operating expenses |
0% | -7% | 2% | -43% | -2% | |||||||||||||||
| Profit/(Loss) before credit impairment and income tax |
-16% | -3% | 52% | 100% | 8% | |||||||||||||||
| Credit impairment (charge)/release |
large | large | large | n/a | large | |||||||||||||||
| Profit/(Loss) before income tax |
-73% | -76% | 49% | 100% | -39% | |||||||||||||||
| Income tax expense and non-controlling interests |
-49% | -76% | 12% | 9% | -39% | |||||||||||||||
| Cash profit/(loss) |
-83% | -76% | 64% | -18% | -40% | |||||||||||||||
| Individually assessed credit impairment charge/(release) |
large | large | n/a | -100% | large | |||||||||||||||
| Collectively assessed credit impairment charge/(release) |
large | large | large | -100% | large | |||||||||||||||
| Net loans and advances |
21% | 19% | 88% | -87% | 31% | |||||||||||||||
| Customer deposits |
25% | 5% | 28% | -17% | 26% | |||||||||||||||
| Risk weighted assets |
14% | 18% | 41% | -42% | 24% | |||||||||||||||
| 1. | Balance Sheet amounts include assets and liabilities reclassified as held for sale from continuing operations. |
60
DIVISIONAL RESULTS
Institutional - continuing operations
Mark Whelan
| March 2020 Half Year | Transaction $M |
Loans & $M |
Markets $M |
Central $M |
Total $M |
|||||||||||||||
| Net interest income |
456 | 754 | 400 | 14 | 1,624 | |||||||||||||||
| Other operating income |
356 | 31 | 764 | 16 | 1,167 | |||||||||||||||
| Operating income |
812 | 785 | 1,164 | 30 | 2,791 | |||||||||||||||
| Operating expenses |
(404 | ) | (301 | ) | (561 | ) | (24 | ) | (1,290 | ) | ||||||||||
| Profit/(Loss) before credit impairment and income tax |
408 | 484 | 603 | 6 | 1,501 | |||||||||||||||
| Credit impairment (charge)/release |
(279 | ) | (358 | ) | (4 | ) | - | (641 | ) | |||||||||||
| Profit/(Loss) before income tax |
129 | 126 | 599 | 6 | 860 | |||||||||||||||
| Income tax expense and non-controlling interests |
(68 | ) | (34 | ) | (134 | ) | (14 | ) | (250 | ) | ||||||||||
| Cash profit/(loss) |
61 | 92 | 465 | (8 | ) | 610 | ||||||||||||||
| Individually assessed credit impairment charge/(release) |
227 | 46 | (1 | ) | - | 272 | ||||||||||||||
| Collectively assessed credit impairment charge/(release) |
52 | 312 | 5 | - | 369 | |||||||||||||||
| Net loans and advances |
22,023 | 128,585 | 48,714 | 88 | 199,410 | |||||||||||||||
| Customer deposits |
124,159 | 971 | 131,277 | 2,110 | 258,517 | |||||||||||||||
| Risk weighted assets |
29,036 | 109,823 | 67,691 | 478 | 207,028 | |||||||||||||||
| September 2019 Half Year |
||||||||||||||||||||
| Net interest income |
524 | 740 | 211 | 26 | 1,501 | |||||||||||||||
| Other operating income |
361 | 72 | 619 | 14 | 1,066 | |||||||||||||||
| Operating income |
885 | 812 | 830 | 40 | 2,567 | |||||||||||||||
| Operating expenses |
(407 | ) | (315 | ) | (545 | ) | (80 | ) | (1,347 | ) | ||||||||||
| Profit/(Loss) before credit impairment and income tax |
478 | 497 | 285 | (40 | ) | 1,220 | ||||||||||||||
| Credit impairment (charge)/release |
(4 | ) | (16 | ) | (11 | ) | (2 | ) | (33 | ) | ||||||||||
| Profit/(Loss) before income tax |
474 | 481 | 274 | (42 | ) | 1,187 | ||||||||||||||
| Income tax expense and non-controlling interests |
(131 | ) | (132 | ) | (88 | ) | (20 | ) | (371 | ) | ||||||||||
| Cash profit/(loss) |
343 | 349 | 186 | (62 | ) | 816 | ||||||||||||||
| Individually assessed credit impairment charge/(release) |
(6 | ) | 4 | - | 2 | - | ||||||||||||||
| Collectively assessed credit impairment charge/(release) |
10 | 12 | 11 | - | 33 | |||||||||||||||
| Net loans and advances |
19,495 | 110,554 | 34,473 | 4 | 164,526 | |||||||||||||||
| Customer deposits |
101,766 | 1,013 | 112,471 | 2,009 | 217,259 | |||||||||||||||
| Risk weighted assets |
26,120 | 97,361 | 57,373 | 234 | 181,088 | |||||||||||||||
| March 2020 Half Year vs September 2019 Half Year |
||||||||||||||||||||
| Net interest income |
-13% | 2% | 90% | -46% | 8% | |||||||||||||||
| Other operating income |
-1% | -57% | 23% | 14% | 9% | |||||||||||||||
| Operating income |
-8% | -3% | 40% | -25% | 9% | |||||||||||||||
| Operating expenses |
-1% | -4% | 3% | -70% | -4% | |||||||||||||||
| Profit/(Loss) before credit impairment and income tax |
-15% | -3% | large | large | 23% | |||||||||||||||
| Credit impairment (charge)/release |
large | large | -64% | -100% | large | |||||||||||||||
| Profit/(Loss) before income tax |
-73% | -74% | large | large | -28% | |||||||||||||||
| Income tax expense and non-controlling interests |
-48% | -74% | 52% | -29% | -33% | |||||||||||||||
| Cash profit/(loss) |
-82% | -74% | large | -87% | -25% | |||||||||||||||
| Individually assessed credit impairment charge/(release) |
large | large | n/a | -100% | n/a | |||||||||||||||
| Collectively assessed credit impairment charge/(release) |
large | large | -55% | n/a | large | |||||||||||||||
| Net loans and advances |
13% | 16% | 41% | large | 21% | |||||||||||||||
| Customer deposits |
22% | -4% | 17% | 5% | 19% | |||||||||||||||
| Risk weighted assets |
11% | 13% | 18% | large | 14% | |||||||||||||||
61
DIVISIONAL RESULTS
Institutional - continuing operations
Mark Whelan
Analysis of Markets operating income1
| Half Year | Movement | |||||||||||||||||||||||
| Composition of Markets operating income by business activity | Mar 20 $M |
Sep 19 $M |
Mar 19 $M |
Mar 20 v. Sep 19 |
Mar 20 v. Mar 19 |
|||||||||||||||||||
| Franchise Sales2 |
513 | 467 | 465 | 10% | 10% | |||||||||||||||||||
| Franchise Trading3 |
413 | 173 | 226 | large | 83% | |||||||||||||||||||
| Balance Sheet4 |
238 | 190 | 256 | 25% | -7% | |||||||||||||||||||
| Markets operating income |
1,164 | 830 | 947 | 40% | 23% | |||||||||||||||||||
| Includes: |
||||||||||||||||||||||||
| Derivative valuation adjustments |
24 | 48 | (10 | ) | -50% | large | ||||||||||||||||||
| 1. | Markets operating income includes net interest income and other operating income. |
| 2. | Franchise Sales represents direct client flow business on core products such as fixed income, foreign exchange, commodities and capital markets. |
| 3. | Franchise Trading primarily represents management of the Group’s strategic positions and those taken as part of direct client sales flow. Franchise Trading also includes the impact of valuation adjustments made when determining the fair value of derivatives (includes credit and funding adjustments, bid-offer adjustments and associated hedges). |
| 4. | Balance Sheet represents hedging of interest rate risk on the Group’s loan and deposit books and the management of the Group’s liquidity portfolio. |
| Half Year | Movement | |||||||||||||||||||||||
| Composition of Markets operating income by geography | Mar 20 $M |
Sep 19 $M |
Mar 19 $M |
Mar 20 v. Sep 19 |
Mar 20 v. Mar 19 |
|||||||||||||||||||
| Australia |
325 | 292 | 312 | 11% | 4% | |||||||||||||||||||
| Asia, Pacific, Europe & America |
740 | 390 | 507 | 90% | 46% | |||||||||||||||||||
| New Zealand |
99 | 148 | 128 | -33% | -23% | |||||||||||||||||||
| Markets operating income |
1,164 | 830 | 947 | 40% | 23% | |||||||||||||||||||
62
DIVISIONAL RESULTS
Institutional - continuing operations
Mark Whelan
Market risk
Traded market risk
Below are aggregate Value at Risk (VaR) exposures at 99% confidence level covering both physical and derivatives trading positions for the Bank’s principal trading centres.
99% confidence level (1 day holding period)
| As at | High for period |
Low for period |
Avg for period |
As at | High for year |
Low for year |
Avg for year |
|||||||||||||||||||||||||||||
| Mar 20 $M |
Mar 20 $M |
Mar 20 $M |
Mar 20 $M |
Sep 19 $M |
Sep 19 $M |
Sep 19 $M |
Sep 19 $M |
|||||||||||||||||||||||||||||
| Value at Risk at 99% confidence |
||||||||||||||||||||||||||||||||||||
| Foreign exchange |
2.7 | 6.1 | 1.2 | 2.8 | 1.4 | 9.5 | 1.2 | 4.1 | ||||||||||||||||||||||||||||
| Interest rate |
4.5 | 8.5 | 3.3 | 5.0 | 3.6 | 10.4 | 3.6 | 5.8 | ||||||||||||||||||||||||||||
| Credit |
3.1 | 5.5 | 1.8 | 4.2 | 5.1 | 5.4 | 1.2 | 3.1 | ||||||||||||||||||||||||||||
| Commodities |
1.4 | 3.4 | 1.3 | 2.2 | 1.6 | 3.9 | 1.4 | 2.2 | ||||||||||||||||||||||||||||
| Equity |
- | - | - | - | - | - | - | - | ||||||||||||||||||||||||||||
| Diversification benefit |
(4.2 | ) | n/a | n/a | (6.5 | ) | (5.5 | ) | n/a | n/a | (7.2 | ) | ||||||||||||||||||||||||
| Total VaR |
7.5 | 10.8 | 5.7 | 7.7 | 6.2 | 13.4 | 5.1 | 8.0 | ||||||||||||||||||||||||||||
|
Non-traded interest rate risk
Non-traded interest rate risk is managed by Markets and relates to the potential adverse impact of changes in market interest rates on future net interest income for the Group. Interest rate risk is reported using various techniques including VaR and scenario analysis based on a 1% shock.
99% confidence level (1 day holding period)
|
| |||||||||||||||||||||||||||||||||||
| As at | High for period |
Low for period |
Avg for period |
As at | High for year |
Low for year |
Avg for year |
|||||||||||||||||||||||||||||
| Mar 20 $M |
Mar 20 $M |
Mar 20 $M |
Mar 20 $M |
Sep 19 $M |
Sep 19 $M |
Sep 19 $M |
Sep 19 $M |
|||||||||||||||||||||||||||||
| Value at Risk at 99% confidence |
||||||||||||||||||||||||||||||||||||
| Australia |
21.5 | 26.6 | 18.8 | 23.0 | 22.7 | 22.7 | 16.4 | 18.9 | ||||||||||||||||||||||||||||
| New Zealand |
11.4 | 11.4 | 9.4 | 10.2 | 9.6 | 9.6 | 7.1 | 8.0 | ||||||||||||||||||||||||||||
| Asia, Pacific, Europe & America |
21.5 | 23.0 | 17.8 | 20.1 | 17.6 | 17.7 | 12.9 | 16.1 | ||||||||||||||||||||||||||||
| Diversification benefit |
(21.2 | ) | n/a | n/a | (21.2 | ) | (17.8 | ) | n/a | n/a | (14.8 | ) | ||||||||||||||||||||||||
| Total VaR |
33.2 | 33.2 | 31.5 | 32.1 | 32.1 | 32.1 | 25.2 | 28.2 | ||||||||||||||||||||||||||||
Impact of 1% rate shock on the next 12 months’ net interest income margin
| As at | ||||||||
| Mar 20 | Sep 19 | |||||||
| As at period end |
1.09% | 1.19% | ||||||
| Maximum exposure |
1.56% | 1.19% | ||||||
| Minimum exposure |
0.60% | 0.33% | ||||||
| Average exposure (in absolute terms) |
1.06% | 0.69% | ||||||
63
DIVISIONAL RESULTS
New Zealand - continuing operations
Antonia Watson
Divisional performance was impacted by a number of large/notable items. Refer to pages 13 to 16 and pages 51 to 52 for details (in AUD).
Table reflects NZD for New Zealand (AUD results shown on page 68)
| Half Year | Movement | |||||||||||||||||||
| Mar 20 NZD M |
Sep 19 NZD M |
Mar 19 NZD M |
Mar 20 v. Sep 19 |
Mar 20 v. Mar 19 |
||||||||||||||||
| Net interest income |
1,479 | 1,428 | 1,464 | 4% | 1% | |||||||||||||||
| Other operating income |
259 | 294 | 300 | -12% | -14% | |||||||||||||||
| Net income from insurance business1 |
- | - | 19 | n/a | -100% | |||||||||||||||
| Operating income |
1,738 | 1,722 | 1,783 | 1% | -3% | |||||||||||||||
| Operating expenses |
(724 | ) | (713 | ) | (647 | ) | 2% | 12% | ||||||||||||
| Profit before credit impairment and income tax |
1,014 | 1,009 | 1,136 | 0% | -11% | |||||||||||||||
| Credit impairment (charge)/release |
(188 | ) | (61 | ) | (31 | ) | large | large | ||||||||||||
| Profit before income tax |
826 | 948 | 1,105 | -13% | -25% | |||||||||||||||
| Income tax expense and non-controlling interests |
(232 | ) | (265 | ) | (309 | ) | -12% | -25% | ||||||||||||
| Cash profit |
594 | 683 | 796 | -13% | -25% | |||||||||||||||
| Balance Sheet |
||||||||||||||||||||
| Net loans and advances |
128,560 | 125,991 | 124,025 | 2% | 4% | |||||||||||||||
| Other external assets |
4,690 | 3,983 | 3,549 | 18% | 32% | |||||||||||||||
| External assets |
133,250 | 129,974 | 127,574 | 3% | 4% | |||||||||||||||
| Customer deposits |
93,626 | 90,004 | 89,096 | 4% | 5% | |||||||||||||||
| Other deposits and borrowings |
4,456 | 2,461 | 2,240 | 81% | 99% | |||||||||||||||
| Deposits and other borrowings |
98,082 | 92,465 | 91,336 | 6% | 7% | |||||||||||||||
| Other external liabilities |
28,088 | 25,377 | 23,555 | 11% | 19% | |||||||||||||||
| External liabilities |
126,170 | 117,842 | 114,891 | 7% | 10% | |||||||||||||||
| Risk weighted assets |
72,412 | 70,727 | 62,260 | 2% | 16% | |||||||||||||||
| Average gross loans and advances |
127,968 | 125,521 | 123,000 | 2% | 4% | |||||||||||||||
| Average deposits and other borrowings |
94,740 | 91,898 | 91,231 | 3% | 4% | |||||||||||||||
| Net funds management income |
113 | 109 | 113 | 4% | 0% | |||||||||||||||
| Funds under management |
32,504 | 34,145 | 31,403 | -5% | 4% | |||||||||||||||
| Average funds under management |
34,472 | 32,726 | 30,389 | 5% | 13% | |||||||||||||||
| Ratios |
||||||||||||||||||||
| Return on average assets |
0.90% | 1.06% | 1.26% | |||||||||||||||||
| Net interest margin |
2.31% | 2.27% | 2.39% | |||||||||||||||||
| Operating expenses to operating income |
41.7% | 41.4% | 36.3% | |||||||||||||||||
| Operating expenses to average assets |
1.10% | 1.10% | 1.03% | |||||||||||||||||
| Individually assessed credit impairment charge/(release) |
37 | 42 | 37 | -12% | 0% | |||||||||||||||
| Individually assessed credit impairment charge/(release) as a % of average GLA2 |
0.06% | 0.07% | 0.06% | |||||||||||||||||
| Collectively assessed credit impairment charge/(release) |
151 | 19 | (6 | ) | large | large | ||||||||||||||
| Collectively assessed credit impairment charge/(release) as a % of average GLA2 |
0.24% | 0.03% | (0.01% | ) | ||||||||||||||||
| Gross impaired assets |
271 | 265 | 249 | 2% | 9% | |||||||||||||||
| Gross impaired assets as a % of GLA |
0.21% | 0.21% | 0.20% | |||||||||||||||||
| Total full time equivalent staff (FTE) |
6,103 | 6,121 | 6,003 | 0% | 2% | |||||||||||||||
| 1. | Relates to OnePath Life (NZ) Limited, a controlled entity, which was sold on 30 November 2018. |
| 2. | Credit impairment charge used in the ratio relates to gross loans and advances and off-balance sheet commitments - undrawn and contingent liabilities. |
Performance March 2020 v March 2019
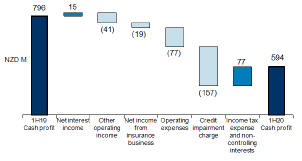
64
DIVISIONAL RESULTS
New Zealand - continuing operations
Antonia Watson
| Individually assessed credit impairment charge/(release) | Half Year | Movement | ||||||||||||||||||
| Mar 20 NZD M |
Sep 19 NZD M |
Mar 19 NZD M |
Mar 20 v. Sep 19 |
Mar 20 v. Mar 19 |
||||||||||||||||
| Retail |
20 | 23 | 24 | -13% | -17% | |||||||||||||||
| Home Loans |
2 | 1 | - | -100% | - | |||||||||||||||
| Other |
18 | 22 | 24 | -18% | -25% | |||||||||||||||
| Commercial |
17 | 19 | 13 | -11% | 31% | |||||||||||||||
| Individually assessed credit impairment charge/(release) |
37 | 42 | 37 | -12% | 0% | |||||||||||||||
| Collectively assessed credit impairment charge/(release) | Half Year | Movement | ||||||||||||||||||
| Mar 20 NZD M |
Sep 19 NZD M |
Mar 19 NZD M |
Mar 20 v. Sep 19 |
Mar 20 v. Mar 19 |
||||||||||||||||
| Retail |
62 | (7 | ) | 5 | large | large | ||||||||||||||
| Home Loans |
50 | 2 | 4 | large | large | |||||||||||||||
| Other |
12 | (9 | ) | 1 | large | large | ||||||||||||||
| Commercial |
89 | 26 | (11 | ) | large | large | ||||||||||||||
| Collectively assessed credit impairment charge/(release) |
151 | 19 | (6 | ) | large | large | ||||||||||||||
| Net loans and advances | As at | Movement | ||||||||||||||||||
| Mar 20 NZD M |
Sep 19 NZD M |
Mar 19 NZD M |
Mar 20 v. Sep 19 |
Mar 20 v. Mar 19 |
||||||||||||||||
| Retail |
85,001 | 82,527 | 81,108 | 3% | 5% | |||||||||||||||
| Home Loans |
82,253 | 79,475 | 77,851 | 3% | 6% | |||||||||||||||
| Other |
2,748 | 3,052 | 3,257 | -10% | -16% | |||||||||||||||
| Commercial |
43,559 | 43,464 | 42,917 | 0% | 1% | |||||||||||||||
| Net loans and advances |
128,560 | 125,991 | 124,025 | 2% | 4% | |||||||||||||||
| Customer deposits | As at | Movement | ||||||||||||||||||
| Mar 20 NZD M |
Sep 19 NZD M |
Mar 19 NZD M |
Mar 20 v. Sep 19 |
Mar 20 v. Mar 19 |
||||||||||||||||
| Retail |
76,408 | 73,866 | 71,882 | 3% | 6% | |||||||||||||||
| Commercial |
17,218 | 16,138 | 17,214 | 7% | 0% | |||||||||||||||
| Customer deposits |
93,626 | 90,004 | 89,096 | 4% | 5% | |||||||||||||||
65
DIVISIONAL RESULTS
New Zealand - continuing operations
Antonia Watson
| March 2020 Half Year | Retail NZD M |
Commercial NZD M |
Central Functions NZD M |
Total NZD M |
||||||||||||
| Net interest income |
922 | 549 | 8 | 1,479 | ||||||||||||
| Other operating income |
254 | 5 | - | 259 | ||||||||||||
| Net income from insurance business1 |
- | - | - | - | ||||||||||||
| Operating income |
1,176 | 554 | 8 | 1,738 | ||||||||||||
| Operating expenses |
(574 | ) | (146 | ) | (4 | ) | (724 | ) | ||||||||
| Profit before credit impairment and income tax |
602 | 408 | 4 | 1,014 | ||||||||||||
| Credit impairment (charge)/release |
(82 | ) | (106 | ) | - | (188 | ) | |||||||||
| Profit before income tax |
520 | 302 | 4 | 826 | ||||||||||||
| Income tax expense and non-controlling interests |
(146 | ) | (85 | ) | (1 | ) | (232 | ) | ||||||||
| Cash profit |
374 | 217 | 3 | 594 | ||||||||||||
| Individually assessed credit impairment charge/(release) |
20 | 17 | - | 37 | ||||||||||||
| Collectively assessed credit impairment charge/(release) |
62 | 89 | - | 151 | ||||||||||||
| Net loans and advances |
85,001 | 43,559 | - | 128,560 | ||||||||||||
| Customer deposits |
76,408 | 17,218 | - | 93,626 | ||||||||||||
| Risk weighted assets |
37,200 | 33,914 | 1,298 | 72,412 | ||||||||||||
| March 2019 Half Year |
||||||||||||||||
| Net interest income |
940 | 517 | 7 | 1,464 | ||||||||||||
| Other operating income |
291 | 10 | (1 | ) | 300 | |||||||||||
| Net income from insurance business1 |
19 | - | - | 19 | ||||||||||||
| Operating income |
1,250 | 527 | 6 | 1,783 | ||||||||||||
| Operating expenses |
(514 | ) | (128 | ) | (5 | ) | (647 | ) | ||||||||
| Profit before credit impairment and income tax |
736 | 399 | 1 | 1,136 | ||||||||||||
| Credit impairment (charge)/release |
(29 | ) | (2 | ) | - | (31 | ) | |||||||||
| Profit before income tax |
707 | 397 | 1 | 1,105 | ||||||||||||
| Income tax expense and non-controlling interests |
(197 | ) | (111 | ) | (1 | ) | (309 | ) | ||||||||
| Cash profit |
510 | 286 | - | 796 | ||||||||||||
| Individually assessed credit impairment charge/(release) |
24 | 13 | - | 37 | ||||||||||||
| Collectively assessed credit impairment charge/(release) |
5 | (11 | ) | - | (6 | ) | ||||||||||
| Net loans and advances |
81,108 | 42,917 | - | 124,025 | ||||||||||||
| Customer deposits |
71,882 | 17,214 | - | 89,096 | ||||||||||||
| Risk weighted assets |
29,897 | 31,344 | 1,019 | 62,260 | ||||||||||||
| March 2020 Half Year vs March 2019 Half Year |
||||||||||||||||
| Net interest income |
-2% | 6% | 14% | 1% | ||||||||||||
| Other operating income |
-13% | -50% | -100% | -14% | ||||||||||||
| Net income from insurance business1 |
-100% | n/a | n/a | -100% | ||||||||||||
| Operating income |
-6% | 5% | 33% | -3% | ||||||||||||
| Operating expenses |
12% | 14% | -20% | 12% | ||||||||||||
| Profit before credit impairment and income tax |
-18% | 2% | large | -11% | ||||||||||||
| Credit impairment (charge)/release |
large | large | n/a | large | ||||||||||||
| Profit before income tax |
-26% | -24% | large | -25% | ||||||||||||
| Income tax expense and non-controlling interests |
-26% | -23% | 0% | -25% | ||||||||||||
| Cash profit |
-27% | -24% | n/a | -25% | ||||||||||||
| Individually assessed credit impairment charge/(release) |
-17% | 31% | n/a | 0% | ||||||||||||
| Collectively assessed credit impairment charge/(release) |
large | large | n/a | large | ||||||||||||
| Net loans and advances |
5% | 1% | n/a | 4% | ||||||||||||
| Customer deposits |
6% | 0% | n/a | 5% | ||||||||||||
| Risk weighted assets |
24% | 8% | 27% | 16% | ||||||||||||
| 1. | Relates to OnePath Life (NZ) Limited, a controlled entity, which was sold on 30 November 2018. |
66
DIVISIONAL RESULTS
New Zealand - continuing operations
Antonia Watson
| March 2020 Half Year | Retail NZD M |
Commercial NZD M |
Central Functions NZD M |
Total NZD M |
||||||||||||
| Net interest income |
922 | 549 | 8 | 1,479 | ||||||||||||
| Other operating income |
254 | 5 | - | 259 | ||||||||||||
| Operating income |
1,176 | 554 | 8 | 1,738 | ||||||||||||
| Operating expenses |
(574 | ) | (146 | ) | (4 | ) | (724 | ) | ||||||||
| Profit/(Loss) before credit impairment and income tax |
602 | 408 | 4 | 1,014 | ||||||||||||
| Credit impairment (charge)/release |
(82 | ) | (106 | ) | - | (188 | ) | |||||||||
| Profit/(Loss) before income tax |
520 | 302 | 4 | 826 | ||||||||||||
| Income tax expense and non-controlling interests |
(146 | ) | (85 | ) | (1 | ) | (232 | ) | ||||||||
| Cash profit/(Loss) |
374 | 217 | 3 | 594 | ||||||||||||
| Individually assessed credit impairment charge/(release) |
20 | 17 | - | 37 | ||||||||||||
| Collectively assessed credit impairment charge/(release) |
62 | 89 | - | 151 | ||||||||||||
| Net loans and advances |
85,001 | 43,559 | - | 128,560 | ||||||||||||
| Customer deposits |
76,408 | 17,218 | - | 93,626 | ||||||||||||
| Risk weighted assets |
37,200 | 33,914 | 1,298 | 72,412 | ||||||||||||
| September 2019 Half Year |
||||||||||||||||
| Net interest income |
881 | 540 | 7 | 1,428 | ||||||||||||
| Other operating income |
287 | 7 | - | 294 | ||||||||||||
| Operating income |
1,168 | 547 | 7 | 1,722 | ||||||||||||
| Operating expenses |
(564 | ) | (146 | ) | (3 | ) | (713 | ) | ||||||||
| Profit/(Loss) before credit impairment and income tax |
604 | 401 | 4 | 1,009 | ||||||||||||
| Credit impairment (charge)/release |
(16 | ) | (45 | ) | - | (61 | ) | |||||||||
| Profit/(Loss) before income tax |
588 | 356 | 4 | 948 | ||||||||||||
| Income tax expense and non-controlling interests |
(164 | ) | (100 | ) | (1 | ) | (265 | ) | ||||||||
| Cash profit/(Loss) |
424 | 256 | 3 | 683 | ||||||||||||
| Individually assessed credit impairment charge/(release) |
23 | 19 | - | 42 | ||||||||||||
| Collectively assessed credit impairment charge/(release) |
(7 | ) | 26 | - | 19 | |||||||||||
| Net loans and advances |
82,527 | 43,464 | - | 125,991 | ||||||||||||
| Customer deposits |
73,866 | 16,138 | - | 90,004 | ||||||||||||
| Risk weighted assets |
36,645 | 33,153 | 929 | 70,727 | ||||||||||||
| March 2020 Half Year vs September 2019 Half Year |
||||||||||||||||
| Net interest income |
5% | 2% | 14% | 4% | ||||||||||||
| Other operating income |
-11% | -29% | n/a | -12% | ||||||||||||
| Operating income |
1% | 1% | 14% | 1% | ||||||||||||
| Operating expenses |
2% | 0% | 33% | 2% | ||||||||||||
| Profit/(Loss) before credit impairment and income tax |
0% | 2% | 0% | 0% | ||||||||||||
| Credit impairment (charge)/release |
large | large | n/a | large | ||||||||||||
| Profit/(Loss) before income tax |
-12% | -15% | 0% | -13% | ||||||||||||
| Income tax expense and non-controlling interests |
-11% | -15% | 0% | -12% | ||||||||||||
| Cash profit/(Loss) |
-12% | -15% | 0% | -13% | ||||||||||||
| Individually assessed credit impairment charge/(release) |
-13% | -11% | n/a | -12% | ||||||||||||
| Collectively assessed credit impairment charge/(release) |
large | large | n/a | large | ||||||||||||
| Net loans and advances |
3% | 0% | n/a | 2% | ||||||||||||
| Customer deposits |
3% | 7% | n/a | 4% | ||||||||||||
| Risk weighted assets |
2% | 2% | 40% | 2% | ||||||||||||
67
DIVISIONAL RESULTS
New Zealand - continuing operations
Antonia Watson
Table reflects AUD for New Zealand
NZD results shown on page 64
| Half Year | Movement | |||||||||||||||||||
| Mar 20 $M |
Sep 19 $M |
Mar 19 $M |
Mar 20 v. Sep 19 |
Mar 20 v. Mar 19 |
||||||||||||||||
| Net interest income |
1,410 | 1,351 | 1,385 | 4% | 2% | |||||||||||||||
| Other operating income |
247 | 278 | 284 | -11% | -13% | |||||||||||||||
| Net income from insurance business1 |
- | - | 18 | n/a | -100% | |||||||||||||||
| Operating income |
1,657 | 1,629 | 1,687 | 2% | -2% | |||||||||||||||
| Operating expenses |
(690 | ) | (674 | ) | (612 | ) | 2% | 13% | ||||||||||||
| Profit before credit impairment and income tax |
967 | 955 | 1,075 | 1% | -10% | |||||||||||||||
| Credit impairment (charge)/release |
(179 | ) | (57 | ) | (30 | ) | large | large | ||||||||||||
| Profit before income tax |
788 | 898 | 1,045 | -12% | -25% | |||||||||||||||
| Income tax expense and non-controlling interests |
(221 | ) | (252 | ) | (292 | ) | -12% | -24% | ||||||||||||
| Cash profit |
567 | 646 | 753 | -12% | -25% | |||||||||||||||
| Consisting of: |
||||||||||||||||||||
| Retail |
357 | 401 | 482 | -11% | -26% | |||||||||||||||
| Commercial |
207 | 242 | 271 | -14% | -24% | |||||||||||||||
| Central Functions |
3 | 3 | - | 0% | n/a | |||||||||||||||
| Cash profit |
567 | 646 | 753 | -12% | -25% | |||||||||||||||
| Balance Sheet |
||||||||||||||||||||
| Net loans and advances |
125,195 | 116,729 | 118,841 | 7% | 5% | |||||||||||||||
| Other external assets |
4,567 | 3,690 | 3,401 | 24% | 34% | |||||||||||||||
| External assets |
129,762 | 120,419 | 122,242 | 8% | 6% | |||||||||||||||
| Customer deposits |
91,175 | 83,387 | 85,372 | 9% | 7% | |||||||||||||||
| Other deposits and borrowings |
4,339 | 2,280 | 2,146 | 90% | large | |||||||||||||||
| Deposits and other borrowings |
95,514 | 85,667 | 87,518 | 11% | 9% | |||||||||||||||
| Other external liabilities |
27,353 | 23,512 | 22,571 | 16% | 21% | |||||||||||||||
| External liabilities |
122,867 | 109,179 | 110,089 | 13% | 12% | |||||||||||||||
| Risk weighted assets |
70,516 | 65,527 | 59,658 | 8% | 18% | |||||||||||||||
| Average gross loans and advances |
122,011 | 118,789 | 116,278 | 3% | 5% | |||||||||||||||
| Average deposits and other borrowings |
90,329 | 86,970 | 86,244 | 4% | 5% | |||||||||||||||
| Net funds management income |
107 | 103 | 107 | 4% | 0% | |||||||||||||||
| Funds under management |
31,653 | 31,633 | 30,090 | 0% | 5% | |||||||||||||||
| Average funds under management |
32,868 | 30,970 | 29,119 | 6% | 13% | |||||||||||||||
| Ratios |
||||||||||||||||||||
| Return on average assets |
0.90% | 1.06% | 1.26% | |||||||||||||||||
| Net interest margin |
2.31% | 2.27% | 2.39% | |||||||||||||||||
| Operating expenses to operating income |
41.7% | 41.4% | 36.3% | |||||||||||||||||
| Operating expenses to average assets |
1.10% | 1.10% | 1.03% | |||||||||||||||||
| Individually assessed credit impairment charge/(release) |
35 | 40 | 35 | -13% | 0% | |||||||||||||||
| Individually assessed credit impairment charge/(release) as a % of average GLA2 |
0.06% | 0.07% | 0.06% | |||||||||||||||||
| Collectively assessed credit impairment charge/(release) |
144 | 17 | (5 | ) | large | large | ||||||||||||||
| Collectively assessed credit impairment charge/(release) as a % of average GLA2 |
0.24% | 0.03% | (0.01% | ) | ||||||||||||||||
| Gross impaired assets |
264 | 245 | 238 | 8% | 11% | |||||||||||||||
| Gross impaired assets as a % of GLA |
0.21% | 0.21% | 0.20% | |||||||||||||||||
| Total full time equivalent staff (FTE) |
6,103 | 6,121 | 6,003 | 0% | 2% | |||||||||||||||
| 1. | Relates to OnePath Life (NZ) Limited, a controlled entity, which was sold on 30 November 2018. |
| 2. | Credit impairment charge used in the ratio relates to gross loans and advances and off-balance sheet commitments - undrawn and contingent liabilities. |
68
DIVISIONAL RESULTS
Pacific - continuing operations
Antonia Watson
Divisional performance was impacted by a number of large/notable items. Refer to pages 13 to 16 and pages 51 to 52 for details of these items.
| Half Year | Movement | |||||||||||||||||||
| Mar 20 $M |
Sep 19 $M |
Mar 19 $M |
Mar 20 v. Sep 19 |
Mar 20 v. Mar 19 |
||||||||||||||||
| Net interest income |
65 | 60 | 68 | 8% | -4% | |||||||||||||||
| Other operating income |
50 | 54 | 50 | -7% | 0% | |||||||||||||||
| Operating income |
115 | 114 | 118 | 1% | -3% | |||||||||||||||
| Operating expenses |
(76 | ) | (80 | ) | (70 | ) | -5% | 9% | ||||||||||||
| Profit/(Loss) before credit impairment and income tax |
39 | 34 | 48 | 15% | -19% | |||||||||||||||
| Credit impairment (charge)/release |
(11 | ) | 3 | (2 | ) | large | large | |||||||||||||
| Profit/(Loss) before income tax |
28 | 37 | 46 | -24% | -39% | |||||||||||||||
| Income tax expense and non-controlling interests |
(8 | ) | (11 | ) | (13 | ) | -27% | -38% | ||||||||||||
| Cash profit/(loss) |
20 | 26 | 33 | -23% | -39% | |||||||||||||||
| Balance Sheet |
||||||||||||||||||||
| Net loans and advances |
2,176 | 2,120 | 2,135 | 3% | 2% | |||||||||||||||
| Customer deposits |
3,845 | 3,546 | 3,474 | 8% | 11% | |||||||||||||||
| Risk weighted assets |
3,547 | 3,400 | 3,840 | 4% | -8% | |||||||||||||||
| Total full time equivalent staff (FTE) |
1,108 | 1,086 | 1,096 | 2% | 1% | |||||||||||||||
|
TSO and Group Centre - continuing operations
Divisional performance was impacted by a number of large/notable items. Refer to pages 13 to 16 and pages 51 to 52 for details of these items.
|
| |||||||||||||||||||
| Half Year | Movement | |||||||||||||||||||
| Mar 20 $M |
Sep 19 $M |
Mar 19 $M |
Mar 20 v. Sep 19 |
Mar 20 v. Mar 19 |
||||||||||||||||
| Share of associates profit |
135 | 133 | 126 | 2% | 7% | |||||||||||||||
| Operating income (other)1 |
(762 | ) | 144 | 367 | large | large | ||||||||||||||
| Operating income |
(627 | ) | 277 | 493 | large | large | ||||||||||||||
| Operating expenses2 |
(484 | ) | (444 | ) | (450 | ) | 9% | 8% | ||||||||||||
| Profit/(Loss) before credit impairment and income tax |
(1,111 | ) | (167 | ) | 43 | large | large | |||||||||||||
| Credit impairment (charge)/release |
- | 1 | - | -100% | n/a | |||||||||||||||
| Profit/(Loss) before income tax |
(1,111 | ) | (166 | ) | 43 | large | large | |||||||||||||
| Income tax benefit and non-controlling interests |
113 | 92 | 20 | 23% | large | |||||||||||||||
| Cash profit/(loss) |
(998 | ) | (74 | ) | 63 | large | large | |||||||||||||
| Risk weighted assets |
5,752 | 4,501 | 5,607 | 28% | 3% | |||||||||||||||
| Total full time equivalent staff (FTE) |
11,212 | 11,010 | 10,520 | 2% | 7% | |||||||||||||||
| 1. | Includes the impairment of Asian associates of $815 million in the March 2020 half. The September 2019 half included the gain on sale from divestments of $18 million (Mar 19 half: $234 million). |
| 2. | Includes large/notable items of $36 million in the March 2020 half (Sep 19 half: $12 million; Mar 19 half: $26 million). |
69
DIVISIONAL RESULTS
This page has been left blank intentionally
70
PROFIT RECONCILIATION
| CONTENTS | Page | |||
| Adjustments between statutory profit and cash profit |
72 | |||
| Explanation of adjustments between statutory profit and cash profit - continuing operations |
72 | |||
| Explanation of adjustments between statutory profit and cash profit - discontinued operations |
73 | |||
| Reconciliation of statutory profit to cash profit |
75 | |||
71
PROFIT RECONCILIATION
Non-IFRS information
The Group provides additional measures of performance in the Consolidated Financial Report & Dividend Announcement which are prepared on a basis other than in accordance with accounting standards. The guidance provided in ASIC’s Regulatory Guide 230 has been followed when presenting this information.
Adjustments between statutory profit and cash profit
Cash profit represents ANZ’s preferred measure of the result of the core business activities of the Group, enabling readers to assess Group and Divisional performance against prior periods and against peer institutions. To calculate cash profit, the Group excludes non-core items from statutory profit (refer to Definitions on pages 139 to 140 for further details). The adjustments made in arriving at cash profit are included in statutory profit which is subject to review within the context of the external auditor’s review of the Condensed Consolidated Financial Statements. Cash profit is not subject to review by the external auditor. The external auditor has informed the Audit Committee that cash profit adjustments have been determined on a consistent basis across each period presented.
| Half Year | Movement | |||||||||||||||||||
| Mar 20 | Sep 19 | Mar 19 | Mar 20 | Mar 20 | ||||||||||||||||
| $M | $M | $M | v. Sep 19 | v. Mar 19 | ||||||||||||||||
| Statutory profit attributable to shareholders of the Company from continuing operations |
1,635 | 3,053 | 3,243 | -46% | -50% | |||||||||||||||
| Adjustments between statutory profit and cash profit from continuing operations |
||||||||||||||||||||
| Revaluation of policy liabilities |
- | - | 77 | n/a | -100% | |||||||||||||||
| Economic hedges |
(340 | ) | (67 | ) | 185 | large | large | |||||||||||||
| Revenue and expense hedges |
120 | (79 | ) | 60 | large | 100% | ||||||||||||||
| Structured credit intermediation trades |
(2 | ) | (1 | ) | (1 | ) | 100% | 100% | ||||||||||||
| Total adjustments between statutory profit and cash profit from continuing operations |
(222 | ) | (147 | ) | 321 | 51% | large | |||||||||||||
| Cash profit from continuing operations |
1,413 | 2,906 | 3,564 | -51% | -60% | |||||||||||||||
| Statutory loss attributable to shareholders of the Company from discontinued operations |
(90 | ) | (273 | ) | (70 | ) | -67% | 29% | ||||||||||||
| Adjustments between statutory profit and cash profit from discontinued operations |
||||||||||||||||||||
| Treasury shares adjustment |
- | 7 | (18 | ) | -100% | -100% | ||||||||||||||
| Revaluation of policy liabilities |
- | 7 | 38 | -100% | -100% | |||||||||||||||
| Total adjustments between statutory profit and cash profit from discontinued operations |
- | 14 | 20 | -100% | -100% | |||||||||||||||
| Cash loss from discontinued operations |
(90 | ) | (259 | ) | (50 | ) | -65% | 80% | ||||||||||||
|
|
||||||||||||||||||||
| Cash profit |
1,323 | 2,647 | 3,514 | -50% | -62% | |||||||||||||||
Explanation of adjustments between statutory profit and cash profit - continuing operations
| • | Revaluation of policy liabilities – OnePath Life (NZ) |
When calculating policy liabilities, the projected future cash flows on insurance contracts are discounted to reflect the present value of the obligation, with the impact of changes in the market discount rate each period being reflected in the Income Statement. ANZ includes the impact on the remeasurement of insurance contracts attributable to changes in market discount rates as an adjustment to statutory profit to remove the volatility attributable to changes in market interest rates which revert to zero over the life of insurance contracts. With the sale completion of OnePath Life (NZ) Ltd in the March 2019 half, this adjustment is no longer required.
| • | Economic and revenue and expense hedges |
The Group enters into economic hedges to manage its interest rate and foreign exchange risk which, in accordance with accounting standards, result in fair value gains and losses being recognised within the Income Statement. ANZ removes the fair value adjustments from cash profit since the profit or loss resulting from the hedge transactions will reverse over time to match with the profit or loss from the economically hedged item as part of cash profit. This includes gains and losses arising from approved classes of derivatives not designated in accounting hedge relationships but which are considered to be economic hedges, including hedges of larger foreign exchange denominated revenue and expense streams, primarily NZD and USD (and USD correlated), as well as ineffectiveness from designated accounting hedges.
Economic hedges comprise:
| • | Funding related swaps (primarily cross currency interest rate swaps) used to convert the proceeds of foreign currency debt issuances into floating rate Australian dollar and New Zealand dollar debt. As these swaps do not qualify for hedge accounting, movements in the fair values are recorded in the Income Statement. The main drivers of these fair values are currency basis spreads and Australian dollar and New Zealand dollar fluctuations against other major funding currencies. |
| • | Economic hedges of select structured finance and specialised leasing transactions that do not qualify for hedge accounting. The main drivers of these fair value adjustments are movements in the Australian and New Zealand term structure of interest rates. |
| • | Ineffectiveness from designated accounting hedge relationships. |
72
PROFIT RECONCILIATION
In the March 2020 half, the majority of the gain on economic hedges adjusted from cash profit relates to funding related swaps, principally from widening basis spreads on AUD/USD and NZD/USD currency pairs and from the weakening of both the AUD and NZD against USD.
The loss on revenue and expense hedges adjusted from cash profit in the March 2020 half was mainly due to the weakening of AUD against the USD and NZD.
|
|
||||||||||||||||||||
| Half Year | Movement | |||||||||||||||||||
| Mar 20 | Sep 19 | Mar 19 | Mar 20 | Mar 20 | ||||||||||||||||
| $M | $M | $M | v. Sep 19 | v. Mar 19 | ||||||||||||||||
| Economic hedges |
(480 | ) | (96 | ) | 260 | large | large | |||||||||||||
| Revenue and expense hedges |
169 | (111 | ) | 85 | large | 99% | ||||||||||||||
| Increase/(decrease) to cash profit before tax |
(311 | ) | (207 | ) | 345 | 50% | large | |||||||||||||
| Increase/(decrease) to cash profit after tax |
(220 | ) | (146 | ) | 245 | 51% | large | |||||||||||||
| • | Structured credit intermediation trades |
ANZ entered into a series of structured credit intermediation trades prior to the Global Financial Crisis with eight US financial guarantors. This involved selling credit default swaps (CDSs) as protection over specific debt structures and purchasing CDS protection over the same structures. ANZ has subsequently exited its positions with six US financial guarantors and is monitoring the remaining two portfolios with a view to reducing the exposures when ANZ deems it cost effective relative to the perceived risk associated with a specific trade or counterparty.
The notional value of outstanding bought and sold CDSs at 31 March 2020 amounted to $0.4 billion (Sep 19: $0.3 billion; Mar 19: $0.3 billion). While both the bought and sold CDSs are measured at fair value through profit and loss, the associated fair value movements do not fully offset due to the impact of credit risk on the bought CDSs which is driven by market movements in credit spreads and AUD/USD and NZD/USD rates. The fair value of the CDSs (excluding CVA) is $17 million (Sep 19: $19 million; Mar 19: $20 million) with CVA on the bought protection of $0.7 million (Sep 19: $3 million; Mar 19: $4 million).
The profit and loss associated with the bought and sold protection is included as an adjustment to cash profit as it relates to a legacy business where, unless terminated early, the fair value movements are expected to reverse to zero in future periods.
| • | Credit risk on impaired derivatives (nil profit after tax impact) |
Derivative credit valuation adjustments on defaulted and impaired derivatives exposures are reclassified to cash credit impairment charges to reflect the manner in which the defaulted and impaired derivatives are managed.
Explanation of adjustments between statutory profit and cash profit - discontinued operations
| • | Treasury shares adjustment |
ANZ shares held by the Group in Wealth Australia discontinued operations are deemed to be Treasury shares for accounting purposes. Dividends and realised and unrealised gains and losses from these shares are reversed as they are not permitted to be recognised as income for statutory reporting purposes. In deriving cash profit, these earnings are included to ensure there is no asymmetrical impact on the Group’s profits because the Treasury shares are held to support policy liabilities which are revalued through the Income Statement. With the sale completion of the life insurance business to Zurich in the September 2019 half, there are no further ANZ shares held by the Group in Wealth Australia discontinued operations (Mar 19: 15.5 million shares).
| • | Revaluation of policy liabilities - Wealth Australia discontinued operations |
When calculating policy liabilities, the projected future cash flows on insurance contracts are discounted to reflect the present value of the obligation, with the impact of changes in the market discount rate each period being reflected in the Income Statement. ANZ includes the impact on the remeasurement of the insurance contract attributable to changes in market discount rates as an adjustment to statutory profit to remove the volatility attributable to changes in market interest rates which reverts to zero over the life of the insurance contract. With the sale completion of the life insurance business to Zurich in the September 2019 half, this adjustment is no longer required.
| • | Policyholders tax gross up (nil profit after tax impact) |
For statutory reporting purposes, policyholders income tax and other related taxes paid on behalf of policyholders are included in both other operating income and the Group’s income tax expense. The gross up of $101 million income tax recoveries for the March 2020 half (Sep 19 half: nil; Mar 19 half: $19 million income tax paid) has been excluded from discontinued cash results as it does not reflect the underlying performance of the business which is assessed on a net of policyholders tax basis.
73
PROFIT RECONCILIATION
| Adjustments to statutory profit | ||||||||||||||||||||||||||||||||||||
| Statutory profit
$M |
Treasury shares adjustment
$M |
Revaluation of policy liabilities
$M |
Economic hedges
$M |
Revenue and expense hedges
$M |
Structured credit intermediation trades
$M |
Credit risk on impaired derivatives
$M |
Total adjustments to statutory profit
$M |
Cash profit
$M |
||||||||||||||||||||||||||||
| March 2020 Half Year |
||||||||||||||||||||||||||||||||||||
| Net interest income |
7,222 | - | - | - | - | - | - | - | 7,222 | |||||||||||||||||||||||||||
| Net income from insurance business |
47 | - | - | - | - | - | - | - | 47 | |||||||||||||||||||||||||||
| Other |
1,624 | - | - | (480 | ) | 169 | (3 | ) | - | (314 | ) | 1,310 | ||||||||||||||||||||||||
| Other operating income |
1,671 | - | - | (480 | ) | 169 | (3 | ) | - | (314 | ) | 1,357 | ||||||||||||||||||||||||
| Operating income |
8,893 | - | - | (480 | ) | 169 | (3 | ) | - | (314 | ) | 8,579 | ||||||||||||||||||||||||
| Operating expenses |
(4,605 | ) | - | - | - | - | - | - | - | (4,605 | ) | |||||||||||||||||||||||||
| Profit before credit impairment and tax |
4,288 | - | - | (480 | ) | 169 | (3 | ) | - | (314 | ) | 3,974 | ||||||||||||||||||||||||
| Credit impairment charge |
(1,674 | ) | - | - | - | - | - | - | - | (1,674 | ) | |||||||||||||||||||||||||
| Profit before income tax |
2,614 | - | - | (480 | ) | 169 | (3 | ) | - | (314 | ) | 2,300 | ||||||||||||||||||||||||
| Income tax expense |
(978 | ) | - | - | 140 | (49 | ) | 1 | - | 92 | (886 | ) | ||||||||||||||||||||||||
|
Non-controlling interests |
(1 | ) | - | - | - | - | - | - | - | (1 | ) | |||||||||||||||||||||||||
| Profit after tax from continuing operations |
1,635 | - | - | (340 | ) | 120 | (2 | ) | - | (222 | ) | 1,413 | ||||||||||||||||||||||||
| Profit/(Loss) after tax from discontinued operations |
(90 | ) | - | - | - | - | - | - | - | (90 | ) | |||||||||||||||||||||||||
| Profit after tax |
1,545 | - | - | (340 | ) | 120 | (2 | ) | - | (222 | ) | 1,323 | ||||||||||||||||||||||||
| September 2019 Half Year |
||||||||||||||||||||||||||||||||||||
| Net interest income |
7,040 | - | - | - | - | - | - | - | 7,040 | |||||||||||||||||||||||||||
| Net income from insurance business |
49 | - | - | - | - | - | - | - | 49 | |||||||||||||||||||||||||||
| Other |
2,403 | - | - | (96 | ) | (111 | ) | (2 | ) | - | (209 | ) | 2,194 | |||||||||||||||||||||||
| Other operating income |
2,452 | - | - | (96 | ) | (111 | ) | (2 | ) | - | (209 | ) | 2,243 | |||||||||||||||||||||||
| Operating income |
9,492 | - | - | (96 | ) | (111 | ) | (2 | ) | - | (209 | ) | 9,283 | |||||||||||||||||||||||
| Operating expenses |
(4,706 | ) | - | - | - | - | - | - | - | (4,706 | ) | |||||||||||||||||||||||||
| Profit before credit impairment and tax |
4,786 | - | - | (96 | ) | (111 | ) | (2 | ) | - | (209 | ) | 4,577 | |||||||||||||||||||||||
| Credit impairment charge |
(402 | ) | - | - | - | - | - | - | - | (402 | ) | |||||||||||||||||||||||||
| Profit before income tax |
4,384 | - | - | (96 | ) | (111 | ) | (2 | ) | - | (209 | ) | 4,175 | |||||||||||||||||||||||
| Income tax expense |
(1,325 | ) | - | - | 29 | 32 | 1 | - | 62 | (1,263 | ) | |||||||||||||||||||||||||
|
Non-controlling interests |
(6 | ) | - | - | - | - | - | - | - | (6 | ) | |||||||||||||||||||||||||
| Profit after tax from continuing operations |
3,053 | - | - | (67 | ) | (79 | ) | (1 | ) | - | (147 | ) | 2,906 | |||||||||||||||||||||||
| Profit/(Loss) after tax from discontinued operations |
(273 | ) | 7 | 7 | - | - | - | - | 14 | (259 | ) | |||||||||||||||||||||||||
| Profit after tax |
2,780 | 7 | 7 | (67 | ) | (79 | ) | (1 | ) | - | (133 | ) | 2,647 | |||||||||||||||||||||||
74
PROFIT RECONCILIATION
| Adjustments to statutory profit | ||||||||||||||||||||||||||||||||||||
| Statutory profit
$M |
Treasury shares adjustment
$M |
Revaluation of policy liabilities
$M |
Economic hedges
$M |
Revenue and expense hedges
$M |
Structured credit intermediation trades
$M |
Credit risk on impaired derivatives
$M |
Total adjustments to statutory profit
$M |
Cash profit
$M |
||||||||||||||||||||||||||||
| March 2019 Half Year |
||||||||||||||||||||||||||||||||||||
| Net interest income |
7,299 | - | - | - | - | - | - | - | 7,299 | |||||||||||||||||||||||||||
| Net income from insurance business |
77 | - | (7 | ) | - | - | - | - | (7 | ) | 70 | |||||||||||||||||||||||||
| Other |
1,917 | - | 115 | 260 | 85 | (1 | ) | 1 | 460 | 2,377 | ||||||||||||||||||||||||||
| Other operating income |
1,994 | - | 108 | 260 | 85 | (1 | ) | 1 | 453 | 2,447 | ||||||||||||||||||||||||||
| Operating income |
9,293 | - | 108 | 260 | 85 | (1 | ) | 1 | 453 | 9,746 | ||||||||||||||||||||||||||
| Operating expenses |
(4,365 | ) | - | - | - | - | - | - | - | (4,365 | ) | |||||||||||||||||||||||||
| Profit before credit impairment and tax |
4,928 | - | 108 | 260 | 85 | (1 | ) | 1 | 453 | 5,381 | ||||||||||||||||||||||||||
| Credit impairment charge |
(392 | ) | - | - | - | - | - | (1 | ) | (1 | ) | (393 | ) | |||||||||||||||||||||||
| Profit before income tax |
4,536 | - | 108 | 260 | 85 | (1 | ) | - | 452 | 4,988 | ||||||||||||||||||||||||||
| Income tax expense |
(1,284 | ) | - | (31 | ) | (75 | ) | (25 | ) | - | - | (131 | ) | (1,415 | ) | |||||||||||||||||||||
|
Non-controlling interests |
(9 | ) | - | - | - | - | - | - | - | (9 | ) | |||||||||||||||||||||||||
| Profit after tax from continuing operations |
3,243 | - | 77 | 185 | 60 | (1 | ) | - | 321 | 3,564 | ||||||||||||||||||||||||||
| Profit/(Loss) after tax from discontinued operations |
(70 | ) | (18 | ) | 38 | - | - | - | - | 20 | (50 | ) | ||||||||||||||||||||||||
| Profit after tax |
3,173 | (18 | ) | 115 | 185 | 60 | (1 | ) | - | 341 | 3,514 | |||||||||||||||||||||||||
75
PROFIT RECONCILIATION
This page has been left blank intentionally
76
CONDENSED CONSOLIDATED FINANCIAL STATEMENTS - TABLE OF CONTENTS
| CONTENTS | Page | |||
| Condensed Consolidated Income Statement |
79 | |||
| Condensed Consolidated Statement of Comprehensive Income |
80 | |||
| Condensed Consolidated Balance Sheet |
81 | |||
| Condensed Consolidated Cash Flow Statement |
82 | |||
| Condensed Consolidated Statement of Changes in Equity |
83 | |||
| Notes to Condensed Consolidated Financial Statements |
84 | |||
| Directors’ Declaration |
122 | |||
| Auditor’s Review Report and Independence Declaration |
124 | |||
77
DIRECTORS’ REPORT
The Directors present their report on the Condensed Consolidated Financial Statements for the half year ended 31 March 2020.
Directors
The names of the Directors of the Company who held office during and since the end of the half year are:
| Mr DM Gonski, AC | Chairman | |
| Mr SC Elliott | Director and Chief Executive Officer | |
| Ms IR Atlas, AO | Director | |
| Ms PJ Dwyer | Director | |
| Ms SJ Halton, AO PSM | Director | |
| Mr GR Liebelt | Director | |
| Rt Hon Sir JP Key, GNZM AC | Director | |
| Mr JT MacFarlane | Director | |
| Mr P O’Sullivan | Director, appointed 4 November 2019 | |
Result
The consolidated profit attributable to shareholders of the Company was $1,545 million, and consolidated profit attributable to shareholders of the Company from continuing operations was $1,635 million. Further details are contained in Group Results on pages 19 to 46 which forms part of this report, and in the Condensed Consolidated Financial Statements.
Review of operations
A review of the operations of the Group during the half year and the results of those operations are contained in the Group Results on pages 19 to 46 which forms part of this report.
Lead auditor’s independence declaration
The lead auditor’s independence declaration given under section 307C of the Corporations Act 2001 (as amended) is set out on page 125 which forms part of this report.
Rounding of amounts
The amounts contained in these Condensed Consolidated Financial Statements have been rounded to the nearest million dollars, except where otherwise indicated, as permitted by ASIC Corporations Instrument 2016/191.
Significant events since balance date
With effect from 2 April 2020, the Reserve Bank of New Zealand (RBNZ) amended the conditions of registration for ANZ Bank New Zealand Limited (ANZ Bank NZ), a New Zealand subsidiary of ANZ Banking Group Limited (ANZBGL) to (among other things) prohibit ANZ Bank NZ from making distributions other than discretionary payments payable to holders of Additional Tier 1 capital instruments. These amendments were also applied to other locally incorporated banks in New Zealand to further support the stability of the New Zealand banking financial system during this period of economic uncertainty. These requirements prevent ANZ Bank NZ from redeeming its NZ$500 million Capital Notes in May 2020, although it can continue making coupon payments on those Capital Notes. As ANZ Bank NZ has announced that it will not be exercising its option to convert in May 2020, the terms of the Capital Notes provide for their conversion into a variable number of ANZBGL shares in May 2022 subject to certain conditions (refer to note 13). Conversion would result in an increase in the Group’s CET1 capital (~12 bps) at Level 2. The amendments will also prevent ANZ Bank NZ from paying dividends to ANZBGL.
Other than the matter above there have been no other significant events from 31 March 2020 to the date of signing this report that have not been adjusted or disclosed.
Signed in accordance with a resolution of the Directors.
|
David M Gonski, AC Chairman |
Shayne C Elliott Director | |
| 29 April 2020 | ||


78
CONDENSED CONSOLIDATED INCOME STATEMENT
Australia and New Zealand Banking Group Limited
| Half Year | Movement | |||||||||||||||||||||||||
| Note |
Mar 20 $M |
Sep 19 $M |
Mar 19 $M |
Mar 20 v. Sep 19 |
Mar 20 v. Mar 19 |
|||||||||||||||||||||
| Interest income |
13,800 | 15,107 | 15,970 | -9% | -14% | |||||||||||||||||||||
| Interest expense |
(6,578 | ) | (8,067 | ) | (8,671 | ) | -18% | -24% | ||||||||||||||||||
| Net interest income |
2 | 7,222 | 7,040 | 7,299 | 3% | -1% | ||||||||||||||||||||
| Other operating income |
2 | 1,489 | 2,272 | 1,786 | -34% | -17% | ||||||||||||||||||||
| Net income from insurance business |
2 | 47 | 49 | 77 | -4% | -39% | ||||||||||||||||||||
| Share of associates’ profit |
2, 18 | 135 | 131 | 131 | 3% | 3% | ||||||||||||||||||||
| Operating income |
8,893 | 9,492 | 9,293 | -6% | -4% | |||||||||||||||||||||
| Operating expenses |
3 | (4,605 | ) | (4,706 | ) | (4,365 | ) | -2% | 5% | |||||||||||||||||
| Profit before credit impairment and income tax |
4,288 | 4,786 | 4,928 | -10% | -13% | |||||||||||||||||||||
| Credit impairment charge |
9 | (1,674 | ) | (402 | ) | (392 | ) | large | large | |||||||||||||||||
| Profit before income tax |
2,614 | 4,384 | 4,536 | -40% | -42% | |||||||||||||||||||||
| Income tax expense |
4 | (978 | ) | (1,325 | ) | (1,284 | ) | -26% | -24% | |||||||||||||||||
| Profit after tax from continuing operations |
1,636 | 3,059 | 3,252 | -47% | -50% | |||||||||||||||||||||
| Profit/(Loss) after tax from discontinued operations |
12 | (90 | ) | (273 | ) | (70 | ) | -67% | 29% | |||||||||||||||||
| Profit for the period |
1,546 | 2,786 | 3,182 | -45% | -51% | |||||||||||||||||||||
| Comprising: |
||||||||||||||||||||||||||
| Profit attributable to shareholders of the Company |
1,545 | 2,780 | 3,173 | -44% | -51% | |||||||||||||||||||||
| Profit attributable to non-controlling interests |
1 | 6 | 9 | -83% | -89% | |||||||||||||||||||||
| Earnings per ordinary share (cents) including discontinued operations |
||||||||||||||||||||||||||
| Basic |
6 | 54.6 | 98.3 | 111.7 | -44% | -51% | ||||||||||||||||||||
| Diluted |
6 | 51.5 | 94.7 | 106.4 | -46% | -52% | ||||||||||||||||||||
| Earnings per ordinary share (cents) from continuing operations |
||||||||||||||||||||||||||
| Basic |
6 | 57.8 | 107.9 | 114.1 | -46% | -49% | ||||||||||||||||||||
| Diluted |
6 | 54.3 | 103.6 | 108.7 | -48% | -50% | ||||||||||||||||||||
| Dividend per ordinary share (cents)1 |
5 | TBD | 80 | 80 | n/a | n/a | ||||||||||||||||||||
| 1. | The decision on the payment of a 2020 interim dividend has been deferred until the economic outlook is clearer and an update will be provided at the August 2020 market update. |
The notes appearing on pages 84 to 120 form an integral part of the Condensed Consolidated Financial Statements.
79
CONDENSED CONSOLIDATED STATEMENT OF COMPREHENSIVE INCOME
Australia and New Zealand Banking Group Limited
| As at | Movement | |||||||||||||||||||||
| Mar 20 $M |
Sep 19 $M |
Mar 19 $M |
Mar 20 v Sep 19 |
Mar 20 v Mar 19 |
||||||||||||||||||
| Profit for the period from continuing operations |
1,636 | 3,059 | 3,252 | -47% | -50% | |||||||||||||||||
| Other comprehensive income |
||||||||||||||||||||||
| Items that will not be reclassified subsequently to profit or loss |
||||||||||||||||||||||
| Investment securities - equity securities at FVOCI |
(115 | ) | (131 | ) | 176 | -12% | large | |||||||||||||||
| Other reserve movements |
236 | 56 | 11 | large | large | |||||||||||||||||
| Items that may be reclassified subsequently to profit or loss |
||||||||||||||||||||||
| Foreign currency translation reserve1 |
1,281 | (137 | ) | 834 | large | 54% | ||||||||||||||||
| Other reserve movements |
83 | 392 | 517 | -79% | -84% | |||||||||||||||||
| Income tax attributable to the above items |
(76 | ) | (101 | ) | (187 | ) | -25% | -59% | ||||||||||||||
| Share of associates’ other comprehensive income2 |
10 | 13 | 13 | -23% | -23% | |||||||||||||||||
| Other comprehensive income after tax from continuing operations |
1,419 | 92 | 1,364 | large | 4% | |||||||||||||||||
| Profit/(Loss) after tax from discontinued operations |
(90 | ) | (273 | ) | (70 | ) | -67% | 29% | ||||||||||||||
| Other comprehensive income after tax from discontinued operations |
- | (139 | ) | 42 | -100% | -100% | ||||||||||||||||
| Total comprehensive income for the period |
2,965 | 2,739 | 4,588 | 8% | -35% | |||||||||||||||||
| Comprising total comprehensive income attributable to: |
||||||||||||||||||||||
| Shareholders of the Company |
2,965 | 2,729 | 4,578 | 9% | -35% | |||||||||||||||||
|
Non-controlling interests |
- | 10 | 10 | -100% | -100% | |||||||||||||||||
| 1. | Includes foreign currency translation differences attributable to non-controlling interests of $1 million loss (Sep 19 half: $4 million gain; Mar 19 half: $1 million gain). |
| 2. | Share of associates’ other comprehensive income includes a FVOCI reserve gain of $7 million (Sep 19 half: $15 million gain; Mar 19 half: $5 million gain), defined benefits gain of $3 million (Sep 19 half: nil; Mar 19 half: $7 million gain), cash flow hedge reserve of nil (Sep 19 half: $2 million loss; Mar 19 half: nil) and a foreign currency translation reserve gain of nil (Sep 19 half: nil; Mar 19 half: $1 million gain) that may be reclassified subsequently to profit or loss. |
The notes appearing on pages 84 to 120 form an integral part of the Condensed Consolidated Financial Statements.
80
CONDENSED CONSOLIDATED BALANCE SHEET
Australia and New Zealand Banking Group Limited
| As At | Movement | |||||||||||||||||||||||||
| Assets | Note | Mar 20 $M |
Sep 19 $M |
Mar 19 $M |
Mar 20 v. Sep 19 |
Mar 20 v. Mar 19 |
||||||||||||||||||||
| Cash and cash equivalents1 |
143,093 | 81,621 | 93,996 | 75% | 52% | |||||||||||||||||||||
| Settlement balances owed to ANZ |
6,961 | 3,739 | 4,041 | 86% | 72% | |||||||||||||||||||||
| Collateral paid |
16,762 | 15,006 | 11,860 | 12% | 41% | |||||||||||||||||||||
| Trading securities |
49,068 | 43,169 | 42,857 | 14% | 14% | |||||||||||||||||||||
| Derivative financial instruments |
173,677 | 120,667 | 79,375 | 44% | large | |||||||||||||||||||||
| Investment securities |
85,923 | 83,709 | 78,882 | 3% | 9% | |||||||||||||||||||||
| Net loans and advances |
8 | 656,609 | 615,258 | 609,281 | 7% | 8% | ||||||||||||||||||||
| Regulatory deposits |
804 | 879 | 944 | -9% | -15% | |||||||||||||||||||||
| Assets held for sale |
12 | - | 1,831 | 43,549 | -100% | -100% | ||||||||||||||||||||
| Investments in associates |
2,313 | 2,957 | 2,737 | -22% | -15% | |||||||||||||||||||||
| Current tax assets |
452 | 265 | 500 | 71% | -10% | |||||||||||||||||||||
| Deferred tax assets2 |
1,816 | 1,356 | 1,146 | 34% | 58% | |||||||||||||||||||||
| Goodwill and other intangible assets |
4,957 | 4,861 | 5,017 | 2% | -1% | |||||||||||||||||||||
| Premises and equipment2 |
3,211 | 1,924 | 1,863 | 67% | 72% | |||||||||||||||||||||
| Other assets |
4,309 | 3,895 | 4,222 | 11% | 2% | |||||||||||||||||||||
| Total assets |
1,149,955 | 981,137 | 980,270 | 17% | 17% | |||||||||||||||||||||
| Liabilities |
||||||||||||||||||||||||||
| Settlement balances owed by ANZ |
22,314 | 10,867 | 12,371 | large | 80% | |||||||||||||||||||||
| Collateral received |
17,463 | 7,929 | 5,726 | large | large | |||||||||||||||||||||
| Deposits and other borrowings |
10 | 726,909 | 637,677 | 634,989 | 14% | 14% | ||||||||||||||||||||
| Derivative financial instruments |
167,364 | 120,951 | 80,871 | 38% | large | |||||||||||||||||||||
| Current tax liabilities |
244 | 260 | 159 | -6% | 53% | |||||||||||||||||||||
| Deferred tax liabilities |
94 | 67 | 48 | 40% | 96% | |||||||||||||||||||||
| Liabilities held for sale |
12 | - | 2,121 | 46,555 | -100% | -100% | ||||||||||||||||||||
| Payables and other liabilities2 |
10,536 | 7,968 | 7,641 | 32% | 38% | |||||||||||||||||||||
| Employee entitlements |
635 | 588 | 567 | 8% | 12% | |||||||||||||||||||||
| Other provisions |
11 | 2,773 | 2,224 | 1,680 | 25% | 65% | ||||||||||||||||||||
| Debt issuances |
13 | 140,248 | 129,691 | 129,692 | 8% | 8% | ||||||||||||||||||||
| Total liabilities |
1,088,580 | 920,343 | 920,299 | 18% | 18% | |||||||||||||||||||||
| Net assets |
61,375 | 60,794 | 59,971 | 1% | 2% | |||||||||||||||||||||
| Shareholders’ equity |
||||||||||||||||||||||||||
| Ordinary share capital |
16 | 26,440 | 26,490 | 26,048 | 0% | 2% | ||||||||||||||||||||
| Reserves |
16 | 2,851 | 1,629 | 1,709 | 75% | 67% | ||||||||||||||||||||
| Retained earnings2 |
16 | 32,073 | 32,664 | 32,064 | -2% | 0% | ||||||||||||||||||||
| Share capital and reserves attributable to shareholders of the Company |
61,364 | 60,783 | 59,821 | 1% | 3% | |||||||||||||||||||||
|
Non-controlling interests |
16 | 11 | 11 | 150 | 0% | -93% | ||||||||||||||||||||
| Total shareholders’ equity |
61,375 | 60,794 | 59,971 | 1% | 2% | |||||||||||||||||||||
| 1. | Includes settlement balances owed to ANZ that meet the definition of cash and cash equivalents. |
| 2. | On adoption of AASB 16 on 1 October 2019, the Group recognised right-of-use assets of $1.6 billion presented within Property Plant and Equipment and lease liabilities of $1.7 billion presented within Payables and other liabilities. This resulted in a reduction to opening retained earnings of $88 million and an increase in deferred tax assets of $37 million. Comparative information has not been restated. Refer to Note 1 for further details. |
The notes appearing on pages 84 to 120 form an integral part of the Condensed Consolidated Financial Statements.
81
CONDENSED CONSOLIDATED CASH FLOW STATEMENT
Australia and New Zealand Banking Group Limited
The Condensed Consolidated Cash Flow Statement includes discontinued operations. Please refer to Note 12 for cash flows associated with discontinued operations and cash and cash equivalents reclassified as held for sale.
| Half Year | ||||||||||||
| Mar 20 $M |
Sep 19 $M |
Mar 19 $M7 |
||||||||||
| Profit after income tax |
1,546 | 2,786 | 3,182 | |||||||||
| Adjustments to reconcile to net cash flow from operating activities: |
||||||||||||
| Provision for credit impairment charge |
1,674 | 403 | 391 | |||||||||
| Impairment of investment in associates |
815 | - | - | |||||||||
| Depreciation and amortisation1 |
613 | 443 | 428 | |||||||||
| (Profit)/loss on sale of premises and equipment |
(4 | ) | (4 | ) | (1 | ) | ||||||
| Net derivatives/foreign exchange adjustment |
1,859 | 3,326 | 1,614 | |||||||||
| (Gain)/loss on sale from divestments |
11 | (19 | ) | (118 | ) | |||||||
| Other non-cash movements |
(99 | ) | (295 | ) | (61 | ) | ||||||
| Net (increase)/decrease in operating assets: |
||||||||||||
| Collateral paid |
(904 | ) | (2,850 | ) | (643 | ) | ||||||
| Trading securities |
1,761 | (1,423 | ) | (6,518 | ) | |||||||
| Loans and advances |
(30,392 | ) | (8,336 | ) | (1,932 | ) | ||||||
| Investments backing policy liabilities |
- | (3,331 | ) | (211 | ) | |||||||
| Other assets |
(687 | ) | 430 | (884 | ) | |||||||
| Net increase/(decrease) in operating liabilities: |
||||||||||||
| Deposits and other borrowings |
67,503 | (2,050 | ) | 9,056 | ||||||||
| Settlement balances owed by ANZ |
11,202 | (1,520 | ) | 443 | ||||||||
| Collateral received |
8,379 | 1,928 | (924 | ) | ||||||||
| Life insurance contract policy liabilities |
- | (110 | ) | 110 | ||||||||
| Other liabilities |
(8,630 | ) | 2,421 | (281 | ) | |||||||
| Total adjustments |
53,101 | (10,987 | ) | 469 | ||||||||
| Net cash (used in)/provided by operating activities2 |
54,647 | (8,201 | ) | 3,651 | ||||||||
| Cash flows from investing activities |
||||||||||||
| Investment securities: |
||||||||||||
| Purchases |
(17,369 | ) | (10,725 | ) | (13,122 | ) | ||||||
| Proceeds from sale or maturity |
18,997 | 7,720 | 13,508 | |||||||||
| Proceeds from divestments, net of cash disposed |
691 | 1,415 | 706 | |||||||||
| Proceeds from/(Repayment of) IOOF secured notes |
(800 | ) | - | 800 | ||||||||
| Other assets |
(33 | ) | (112 | ) | (396 | ) | ||||||
| Net cash (used in)/provided by investing activities |
1,486 | (1,702 | ) | 1,496 | ||||||||
| Cash flows from financing activities |
||||||||||||
| Debt issuances:3 |
||||||||||||
| Issue proceeds |
11,933 | 8,863 | 17,037 | |||||||||
| Redemptions |
(10,427 | ) | (12,177 | ) | (10,781 | ) | ||||||
| Dividends paid4 |
(2,228 | ) | (2,229 | ) | (2,242 | ) | ||||||
| On market purchase of treasury shares |
(122 | ) | - | (112 | ) | |||||||
| Repayment of lease liabilities5 |
(148 | ) | - | - | ||||||||
| Share buy-back |
- | - | (1,120 | ) | ||||||||
| Net cash (used in)/provided by financing activities |
(992 | ) | (5,543 | ) | 2,782 | |||||||
| Net (decrease)/increase in cash and cash equivalents |
55,141 | (15,446 | ) | 7,929 | ||||||||
| Cash and cash equivalents at beginning of period |
81,621 | 94,263 | 84,964 | |||||||||
| Effects of exchange rate changes on cash and cash equivalents |
6,331 | 2,804 | 1,370 | |||||||||
| Cash and cash equivalents at end of period6 |
143,093 | 81,621 | 94,263 | |||||||||
| 1. | Includes depreciation of right-of-use assets recognised on 1 October 2019 following the adoption of AASB 16. Comparatives have not been restated. |
| 2. | Net cash inflows/(outflows) from operating activities includes income taxes paid of $1,480 million (Sep 19 half: $1,194 million; Mar 19 half: $1,935 million). |
| 3. | Non-cash changes in debt issuances includes fair value hedging loss of $1,103 million (Sep 19 half: $978 million; Mar 19 half: $1,459 million) and foreign exchange losses of $8,536 million (Sep 19 half: $2,711 million; Mar 19 half: $1,104 million). |
| 4. | Cash outflow for shares purchased to satisfy the dividend reinvestment plan are classified in Dividends paid. |
| 5. | Relates to repayments of lease liabilities which the Group commenced recognising on 1 October 2019 following the adoption of AASB 16. Comparative information has not been restated. |
| 6. | Includes cash and cash equivalents recognised on the face of balance sheet of $143,093 million (Sep 19 half: $81,621 million; Mar 19 half: $93,996 million) with no amounts recorded as part of assets held for sale. (Sep 19 half: nil; Mar 19 half: $267 million). |
| 7. | Certain Mar 19 half items have been restated to reflect the impact from adoption of AASB 9. |
The notes appearing on pages 84 to 120 form an integral part of the Condensed Consolidated Financial Statements.
82
CONDENSED CONSOLIDATED STATEMENT OF CHANGES IN EQUITY
Australia and New Zealand Banking Group Limited
| Ordinary share |
Reserves $M |
Retained earnings $M |
Share capital and reserves attributable to shareholders of the Company $M |
Non- controlling interests $M |
Total $M |
|||||||||||||||||||
| As at 1 October 2018 |
27,205 | 323 | 31,737 | 59,265 | 140 | 59,405 | ||||||||||||||||||
| Impact on transition to AASB 9 |
- | 14 | (624 | ) | (610 | ) | - | (610 | ) | |||||||||||||||
| Profit or loss from continuing operations |
- | - | 3,243 | 3,243 | 9 | 3,252 | ||||||||||||||||||
| Profit or loss from discontinued operations |
- | - | (70 | ) | (70 | ) | - | (70 | ) | |||||||||||||||
| Other comprehensive income for the period from continuing operations |
- | 1,351 | 12 | 1,363 | 1 | 1,364 | ||||||||||||||||||
| Other comprehensive income for the period from discontinued operations |
- | 42 | - | 42 | - | 42 | ||||||||||||||||||
| Total comprehensive income for the period |
- | 1,393 | 3,185 | 4,578 | 10 | 4,588 | ||||||||||||||||||
| Transactions with equity holders in their capacity as equity holders:1 | ||||||||||||||||||||||||
| Dividends paid2 |
- | - | (2,254 | ) | (2,254 | ) | - | (2,254 | ) | |||||||||||||||
| Dividend income on treasury shares held within the Group’s life insurance statutory funds |
- | - | 12 | 12 | - | 12 | ||||||||||||||||||
| Group share buy-back3 |
(1,120 | ) | - | - | (1,120 | ) | - | (1,120 | ) | |||||||||||||||
| Other equity movements:1 | ||||||||||||||||||||||||
| Group employee share acquisition scheme |
(37 | ) | - | - | (37 | ) | - | (37 | ) | |||||||||||||||
| Other items |
- | (21 | ) | 8 | (13 | ) | - | (13 | ) | |||||||||||||||
| As at 31 March 2019 | 26,048 | 1,709 | 32,064 | 59,821 | 150 | 59,971 | ||||||||||||||||||
| Profit or loss from continuing operations |
- | - | 3,053 | 3,053 | 6 | 3,059 | ||||||||||||||||||
| Profit or loss from discontinued operations |
- | - | (273 | ) | (273 | ) | - | (273 | ) | |||||||||||||||
| Other comprehensive income for the period from continuing operations |
- | 42 | 46 | 88 | 4 | 92 | ||||||||||||||||||
| Other comprehensive income for the period from discontinued operations |
- | (139 | ) | - | (139 | ) | - | (139 | ) | |||||||||||||||
| Total comprehensive income for the period |
- | (97 | ) | 2,826 | 2,729 | 10 | 2,739 | |||||||||||||||||
| Transactions with equity holders in their capacity as equity holders:1 |
||||||||||||||||||||||||
| Dividends paid2 |
- | - | (2,227 | ) | (2,227 | ) | (2 | ) | (2,229 | ) | ||||||||||||||
| Other equity movements:1 |
||||||||||||||||||||||||
| Treasury shares Wealth Australia adjustment4 |
405 | - | - | 405 | - | 405 | ||||||||||||||||||
| Group employee share acquisition scheme |
37 | - | - | 37 | - | 37 | ||||||||||||||||||
| Other items |
- | 17 | 1 | 18 | (147 | ) | (129 | ) | ||||||||||||||||
| As at 30 September 2019 | 26,490 | 1,629 | 32,664 | 60,783 | 11 | 60,794 | ||||||||||||||||||
| Impact on transition to AASB 16 | - | - | (88 | ) | (88 | ) | - | (88 | ) | |||||||||||||||
| Profit or loss from continuing operations |
- | - | 1,635 | 1,635 | 1 | 1,636 | ||||||||||||||||||
| Profit or loss from discontinued operations |
- | - | (90 | ) | (90 | ) | - | (90 | ) | |||||||||||||||
| Other comprehensive income for the period from continuing operations |
- | 1,249 | 171 | 1,420 | (1 | ) | 1,419 | |||||||||||||||||
| Other comprehensive income for the period from discontinued operations |
- | - | - | - | - | - | ||||||||||||||||||
| Total comprehensive income for the period |
- | 1,249 | 1,716 | 2,965 | - | 2,965 | ||||||||||||||||||
| Transactions with equity holders in their capacity as equity holders:1 | ||||||||||||||||||||||||
| Dividends paid2 |
- | - | (2,228 | ) | (2,228 | ) | - | (2,228 | ) | |||||||||||||||
| Other equity movements:1 | ||||||||||||||||||||||||
| Group employee share acquisition scheme |
(50 | ) | - | - | (50 | ) | - | (50 | ) | |||||||||||||||
| Other items |
- | (27 | ) | 9 | (18 | ) | - | (18 | ) | |||||||||||||||
| As at 31 March 2020 | 26,440 | 2,851 | 32,073 | 61,364 | 11 | 61,375 | ||||||||||||||||||
| 1. | Current and prior periods include discontinued operations. |
| 2. | No new shares were issued under the Dividend Reinvestment Plan (DRP) for the 2019 final dividend (nil shares for the 2019 interim dividend; nil shares for the 2018 final dividend) as the shares were purchased on-market and provided directly to the shareholders participating in the DRP. On-market share purchases for the DRP in the March 2020 half were $185 million (Sep 19 half: $233 million; Mar 19 half: $199 million). |
| 3. | The Company completed a $3.0 billion on-market share buy-back of ANZ ordinary shares purchasing $1,120 million worth of shares in the Mar 2019 half resulting in 42.0 million shares being cancelled in the March 2019 half. |
| 4. | The successor fund transfer performed in preparation for the sale of the Group’s wealth business to Zurich and IOOF completed on 13 April 2019. As a result, the Group no longer eliminates the ANZ shares previously held in Wealth Australia discontinued operations (treasury shares). |
The notes appearing on pages 84 to 120 form an integral part of the Condensed Consolidated Financial Statements.
83
NOTES TO CONDENSED CONSOLIDATED FINANCIAL STATEMENTS
| 1. | Basis of preparation |
These Condensed Consolidated Financial Statements:
| • | have been prepared in accordance with the recognition and measurement requirements of Australian Accounting Standards (AASs); |
| • | should be read in conjunction with ANZ’s Annual Financial Statements for the year ended 30 September 2019 and any public announcements made by the Parent Entity and its controlled entities (the Group) for the half year ended 31 March 2020 in accordance with the continuous disclosure obligations under the Corporations Act 2001 and the ASX Listing Rules; |
| • | do not include all notes of the type normally included in ANZ’s Annual Financial Report; |
| • | are presented in Australian dollars unless otherwise stated; and |
| • | were approved by the Board of Directors on 29 April 2020. |
| i) | Statement of Compliance |
These Condensed Consolidated Financial Statements have been prepared in accordance with the Corporations Act 2001 and AASB 134 which ensures compliance with IAS 34 Interim Financial Reporting.
| ii) | Rounding of amounts |
The amounts contained in these Condensed Consolidated Financial Statements have been rounded to the nearest million dollars, except where otherwise indicated, as permitted by Australian Securities and Investments Commission Corporations Instrument 2016/191.
| iii) | Basis of measurement |
The financial information has been prepared in accordance with the historical cost basis except that the following assets and liabilities are stated at their fair value:
| • | derivative financial instruments as well as, in the case of fair value hedges, the fair value adjustment on the underlying hedged exposure; |
| • | financial assets and liabilities held for trading; |
| • | financial assets and liabilities designated at fair value through profit and loss; |
| • | financial assets at fair value through other comprehensive income; |
| • | assets and liabilities held for sale (except those at carrying value as per Note 12). |
In accordance with AASB 1038 Life Insurance Contracts, life insurance liabilities are measured using the Margin on Services model.
In accordance with AASB 119 Employee Benefits, defined benefit obligations are measured using the Projected Unit Credit method.
| iv) | Use of estimates, assumptions and judgements |
The preparation of these Condensed Consolidated Financial Statements requires the use of management judgement, estimates and assumptions that affect reported amounts and the application of accounting policies. Discussion of the critical accounting estimates and judgements, which include complex or subjective decisions or assessments are provided in the 2019 ANZ Annual Financial Report. Such estimates and judgements are reviewed on an ongoing basis.
A brief explanation of the key estimates, assumptions and judgements that have changed during the half year ended 31 March 2020 follows.
Coronavirus (COVID-19) pandemic
The ongoing COVID-19 pandemic has increased the estimation uncertainty in the preparation of these Condensed Consolidated Financial Statements. The estimation uncertainty is associated with:
| • | the extent and duration of the disruption to business arising from the actions by governments, businesses and consumers to contain the spread of the virus; |
| • | the extent and duration of the expected economic downturn (and forecasts for key economic factors including GDP, employment and house prices). This includes the disruption to capital markets, deteriorating credit, liquidity concerns, increasing unemployment, declines in consumer discretionary spending, reductions in production because of decreased demand, and other restructuring activities; and |
| • | the effectiveness of government and central bank measures that have and will be put in place to support businesses and consumers through this disruption and economic downturn. |
The Group has developed various accounting estimates in these Condensed Consolidated Financial Statements based on forecasts of economic conditions which reflect expectations and assumptions as at 31 March 2020 about future events that the Directors believe are reasonable in the circumstances. There is a considerable degree of judgement involved in preparing forecasts. The underlying assumptions are also subject to uncertainties which are often outside the control of the Group. Accordingly, actual economic conditions are likely to be different from those forecast since anticipated events frequently do not occur as expected, and the effect of those differences may significantly impact accounting estimates included in these financial statements.
The significant accounting estimates impacted by these forecasts and associated uncertainties are predominantly related to expected credit losses, fair value measurement, and recoverable amount assessments of non-financial assets.
The impact of the COVID-19 pandemic on each of these accounting estimates is discussed further below and/or in the relevant note to these Condensed Consolidated Financial Statements. Readers should carefully consider these disclosures in light of the inherent uncertainty described above.
Allowance for expected credit losses
The Group measures the allowance for expected credit losses (ECL) using an expected credit loss impairment model as required by AASB 9 Financial Instruments. The Group’s accounting policy for the recognition and measurement of the allowance for expected credit losses is described at Note 13 to ANZ’s Annual Financial Statements for the year ended 30 September 2019.
84
NOTES TO CONDENSED CONSOLIDATED FINANCIAL STATEMENTS
The table below shows the Group’s allowance for expected credit losses (refer to Note 9 and Note 14 for further information).
| As at | ||||||||||||
|
Mar 20 $M |
Sep 19 $M |
Mar 19 $M |
||||||||||
| Collectively assessed |
4,501 | 3,376 | 3,378 | |||||||||
| Individually assessed |
1,093 | 814 | 891 | |||||||||
| Total1,2 |
5,594 | 4,190 | 4,269 | |||||||||
| 1. | Includes allowance for expected credit losses for Net loans and advances – at amortised cost, Investment securities – debt securities at amortised cost and Off-balance sheet commitments - undrawn and contingent facilities. |
| 2. | Includes assets and liabilities reclassified as held for sale from continuing and discontinued operations. |
Individually assessed allowance for expected credit losses
In estimating individually assessed ECL for Stage 3 exposures, the Group makes judgements and assumptions in relation to expected repayments, the realisable value of collateral, the business prospects for the customer, competing claims and the likely cost and duration of the work-out process. Judgements and assumptions in respect of these matters have been updated to reflect the potential impact of COVID-19.
Collectively assessed allowance for expected credit losses
During the March 2020 half the collectively assessed allowance for expected credit losses increased by $1,125 million. This was attributable to changes in economic outlook of $1,031 million, foreign exchange of $77 million and changes in portfolio composition and risk of $17 million.
In estimating collectively assessed ECL, the Group makes judgements and assumptions in relation to:
| • | the selection of an estimation technique or modelling methodology, noting that the modelling of the Group’s ECL estimates are complex; and |
| • | the selection of inputs for those models, and the interdependencies between those inputs. |
The modelling methodology applied in estimating in ECL in these Condensed Consolidated Financial Statements is consistent with that applied in ANZ’s Annual Financial Statements for the year ended 30 September 2019.
The impact of COVID-19 on the global economy and how governments, businesses and consumers respond is uncertain. This uncertainty is reflected in the Group’s assessment of expected credit losses from its credit portfolio which are subject to a number of management judgements and estimates.
The following table summarises the key judgements and assumptions in relation to the model inputs and the interdependencies between those inputs, and highlights significant changes during the current period.
The judgements and associated assumptions have been made within the context of the impact of COVID-19, and reflect historical experience and other factors that are considered to be relevant, including expectations of future events that are believed to be reasonable under the circumstances. In relation to COVID-19, judgements and assumptions include the extent and duration of the pandemic, the impacts of actions of governments and other authorities, and the responses of businesses and consumers in different industries, along with the associated impact on the global economy. Accordingly, the Group’s ECL estimates are inherently uncertain and, as a result, actual results may differ from these estimates.
| Judgement/Assumption | Description | Changes and considerations during the half year ended 31 March 2020 | ||
| Determining when a significant increase in credit risk (SICR) has occurred | In the measurement of ECL, judgement is involved in setting the rules and trigger points to determine whether there has been a SICR since initial recognition of a loan, which would result in the financial asset moving from ‘stage 1’ to ‘stage 2’. This is a key area of judgement since transition from stage 1 to stage 2 increases the ECL from an allowance based on the probability of default in the next 12 months, to an allowance for lifetime expected credit losses. Subsequent decreases in credit risk resulting in transition from stage 2 to stage 1 may similarly result in significant changes in the ECL allowance. The setting of precise trigger points requires judgement which may have a material impact upon the size of the ECL allowance.
|
Various initiatives, such as payment holidays and deferrals have been offered to customers in this half year recognising the potential detrimental impact of COVID-19. Such offers, if accepted, are not automatically considered to indicate SICR but are used as necessary within the broader set of indicators used to assess and grade customer facilities. | ||
| Measuring both 12-month and lifetime credit losses | ECL is a function of the probability of default (PD), the loss given default (LGD) and the exposure at default (EAD) which are point-in-time measures reflecting the relevant forward looking information determined by management. Judgement is involved in determining which forward-looking information variables are relevant for particular lending portfolios and for determining the sensitivity of the parameters to movements in these forward looking variables. |
The PD, EAD and LGD models are subject to the Group’s model risk policy that stipulates periodic model monitoring, periodic re-validation and defines approval procedures and authorities according to model materiality. There were no material changes to the policies during the half year ended 31 March 2020. | ||
| In addition, judgement is required where behavioural characteristics are applied in estimating the lifetime of a facility to be used in measuring ECL. |
There were no changes to behavioural lifetime estimates during the half year ended 31 March 2020. | |||
85
NOTES TO CONDENSED CONSOLIDATED FINANCIAL STATEMENTS
| Judgement/Assumption | Description | Changes and considerations during the half year ended 31 March 2020 | ||
|
Base case economic forecast |
The Group derives a forward looking “base case” economic scenario which reflects ANZ’s view of the most likely future macro-economic conditions. |
There have been no changes to the types of forward looking variables (key economic drivers) used as model inputs in the current half year.
As at 31 March 2020, the base case assumptions have been updated to reflect the rapidly evolving situation with respect to COVID-19. This includes an assessment of the impact of central bank (monetary policy), governments (wage subsidies), and institution specific responses (such as payment holidays). These are considered in determining the length and severity of the forecast economic downturn.
The expected outcomes of key economic drivers for the base case scenario as at 31 March 2020 and those previously used as at 30 September 2019 are described below under the heading “Forecast base case assumptions”. | ||
| Probability weighting of each scenario (base case, upside1, downside1 and severe downside2 scenarios) | Probability weighting of each scenario is determined by management considering the risks and uncertainties surrounding the base case scenario. | The key consideration for probability weightings in the current period is the continuing impact of COVID-19.
In addition to the base case forecast which reflects largely the negative economic consequences of COVID-19, greater weighting has been applied to the downside and severe downside scenarios given the Group’s assessment of downside risks.
The assigned probability weightings in Australia, New Zealand and Rest of world are subject to a high degree of inherent uncertainty and therefore the actual outcomes may be significantly different to those projected. The Group considers these weightings in each geography to provide the best estimate of the possible loss outcomes and has analysed inter-relationships and correlations (over both the short and long term) within the Group’s credit portfolios in determining them. | ||
| Management temporary adjustments | Management temporary adjustments to the ECL allowance are adjustments used in circumstances where it is judged that our existing inputs, assumptions and model techniques do not capture all the risk factors relevant to our lending portfolios. Emerging local or global macroeconomic, microeconomic or political events, and natural disasters that are not incorporated into our current parameters, risk ratings, or forward-looking information are examples of such circumstances. The use of management temporary adjustments may impact the amount of ECL recognised. | Temporary adjustments have been assessed in the context of COVID-19 and the extent that associated credit loss exposures are captured within the modelled economic scenarios. While changes to temporary adjustment have been made to select industries and portfolios, there has been no material change to the overall temporary adjustments in the March 2020 half. | ||
| 1. | The upside and downside scenarios are fixed by reference to average economic cycle conditions (that is, they are not based on the economic conditions prevailing at balance date) and are based on a combination of more optimistic (in the case of the upside) and pessimistic (in the case of the downside) economic conditions. |
| 2. | The severe downside scenario is fixed by reference to average economic cycle conditions and accounts for the potentially severe downside impact of less likely extremely adverse economic conditions. |
Base case economic forecast assumptions
The uncertain evolution of the COVID-19 pandemic increases the risk to the forecast resulting in an understatement or overstatement of the ECL balance due to uncertainties around:
| • | The extent and duration of measures to stop or reduce the speed of the spread of COVID-19; |
| • | The extent and duration of the economic down turn, along with the time required for economies to recover; and |
| • | The effectiveness of government stimulus measures, in particular their impact on the magnitude of economic downturn and the extent and duration of the recovery. |
The Group’s base case economic forecast scenarios reflects a sharp deterioration in economic conditions in the second quarter with a gradual improvement thereafter. It reflects a widespread shutdown in the 2nd quarter of calendar 2020 followed thereafter by a progressive relaxation.
86
NOTES TO CONDENSED CONSOLIDATED FINANCIAL STATEMENTS
The economic drivers of the base case economic forecasts at 31 March 2020 and those that were used at 30 September 2019 are set out below. These reflect ANZ’s view, at the respective reporting dates, of the most likely future macro-economic conditions.
| Base case economic forecast as at 31 March 2020 | Base case economic forecast as at 30 September 2019 | |||
| Australia: | ||||
|
• GDP |
Expected contraction in GDP in the 2020 calendar year, with some recovery in 2021.
GDP is expected to contract 13% in the June 2020 quarter and to recover thereafter resulting in the 2020 calendar year GDP contracting 4.7% then growing by 4.1% in the 2021 calendar year. |
Expected to improve modestly. | ||
|
• Unemployment rate |
Unemployment is expected to increase significantly over the June quarter, recovering gradually over the remainder of 2020 and 2021, but remaining higher than pre COVID- 19 levels.
The unemployment rate is expected to reach 13% in the June 2020 quarter before moderate recovery in the September 2020 quarter. It is expected to average 9.0% for calendar year 2020 and 7.3% for calendar year 2021. |
Expected to remain essentially flat. | ||
|
• Residential property values |
Property prices are expected to fall progressively by 4.1% in calendar year 2020 (taking into account growth pre COVID-19) and contract a further 6.3% in calendar year 2021. | Expected to improve after a period of decline. | ||
|
• Consumer price index |
CPI growth is forecast to fall moderately in 2020 from 2019 levels, returning to 2019 levels in 2021.
CPI growth is forecast at 1.2% for calendar year 2020 and 1.6% for calendar year 2021. |
Growth expected to rise from current levels. | ||
| New Zealand | ||||
|
• GDP |
Expected sizeable contraction in GDP in June quarter, rebounding partially over the remainder of the year. Moderate GDP growth is expected in 2021.
GDP is expected to contract by 17% in the June 2020 quarter, rebounding in the September 2020 quarter once activity resumes, resulting in the 2020 calendar year GDP contracting 6.7% then growing by 4.2% in the 2021 calendar year. |
Expected to improve modestly. | ||
|
• Unemployment rate |
Unemployment is expected to increase significantly over the June quarter, recovering gradually over the remainder of 2020 and 2021, but remaining significantly higher than levels of 1H20. It is expected to average 7.4% for calendar year 2020 and 7.7% for calendar year 2021. | Expected to remain stable. | ||
|
• Residential property values |
Property prices are expected to contract by 1.9% in calendar year in 2020, followed by 6.0% growth in calendar year 2021. | Expected to achieve modest levels of growth. | ||
|
• Consumer price index |
CPI growth is forecast at slightly lower levels than 2019 across 2020 and 2021.
CPI growth is forecast at 1.5% for calendar year 2020 and 1.5% for calendar year 2021. |
Expected to rise modestly. | ||
| Rest of world | ||||
|
• GDP |
Expected contraction in GDP in the 2020 calendar year, with modest growth in 2021.
GDP is expected to contract 3.6% over the 2020 calendar year and then grow by 2.0% over the 2021 calendar year. |
Growth is forecast to taper lower in the near term due to uncertainty in the global outlook. | ||
|
• Consumer price index |
Inflation is forecast to fall significantly in 2020 from 2019 levels, increasing in 2021.
Inflation is forecast at 0.9% for calendar year 2020 and 1.7% for calendar year 2021. |
Expected to remain soft. | ||
87
NOTES TO CONDENSED CONSOLIDATED FINANCIAL STATEMENTS
ECL - Sensitivity analysis
The uncertainty on the impact of COVID-19 introduced significant estimation uncertainty in relation to the measurement of the Group’s allowance for expected credit losses. The rapidly evolving consequences of COVID-19 and government, business and consumer responses could result in significant adjustments to the allowance within the current and next financial years.
Given current economic uncertainties and the judgment applied to factors used in determining the expected default of borrowers in future periods, expected credit losses reported by the Group should be considered as a best estimate within a range of possible estimates.
The table below illustrates the sensitivity of ECL to key factors used in determining it:
ECL sensitivity - Weightings applied to forecast scenarios
|
Total ECL $m |
Impact $m |
|||||||
| 100% upside scenario |
1,969 | (2,533) | ||||||
| 100% base scenario |
4,319 | (183) | ||||||
| 100% downside scenario |
5,293 | 791 | ||||||
| 100% severe downside scenario |
6,472 | 1,970 | ||||||
Fair Value Measurement of Financial Instruments
The majority of valuation models the Group uses to value financial instruments employ only observable market data as inputs. This has not changed as a result of COVID-19.
For certain financial instruments, we may use data that is not readily observable in current markets where we need to exercise more management judgement to determine fair value depending on the significance of the unobservable input to the overall valuation. Generally, we derive unobservable inputs from other relevant market data and compare them to observed transaction prices where available.
The financial instruments which are subject to valuation using unobservable inputs are disclosed in the Group’s fair value hierarchy in Note 15, and are predominantly equity investment securities where quoted prices in active markets are not available. At 31 March 2020 the Group had $1,296m of assets and $67m of liabilities where the valuation was primarily derived using an unobservable input (Sep 19: $1,272m assets and $52m liabilities; Mar 19: $1,365m assets and $43m liabilities).
The Group has an investment in the Bank of Tianjin (BoT), which at 31 March 2020 has a carrying value of $1,053m (Sep 19: $1,106m; Mar 19: $1,215m). As a result of persistent illiquidity of the quoted share price, the Group determines the fair value based on a valuation model using comparable bank pricing multiples as determined by management. Judgement is required in both the selection of the model and inputs used. Although the comparator group entities operate in the same industry, the nature of their business and local economic conditions may be different from the Group’s investment. Thus where local conditions change, which impact the price-to-book ratio of the comparator group, the fair value of the asset will change proportionately. That is, if the price-to-book ratio changed by 10%, the fair value would change by 10%. As the asset is classified as fair value through other comprehensive income, changes in the fair value are reflected directly in equity.
Investments in associates
At 31 March 2020, the impairment assessment of non-lending assets identified that two of the Group’s associate investments AMMB Holdings Berhad (AmBank) and PT Bank Pan Indonesia (PT Panin) had indicators of impairment; specifically their market value (based on share price) was below their carrying value. The Group performed value in use (VIU) calculations to assess if the carrying value of the investments were impaired.
The VIU calculations are sensitive to a number of key assumptions, including discount rates, long term growth rates, future profitability and capital levels. Changes in key assumptions could have a positive or adverse impact on the recoverable amount of the investment. The key assumptions used in the VIU calculations are outlined below:
| AmBank | PT Panin | |||||||||||||||
| Mar 20 | Sep 19 | Mar 20 | Sep 19 | |||||||||||||
| Carrying Value ($m) |
1,161 | 1,586 | 1,130 | 1,350 | ||||||||||||
| Post-tax discount rate |
12.4% | 10.7% | 13.9% | 13.3% | ||||||||||||
| Terminal growth rate |
4.9% | 4.8% | 5.3% | 5.3% | ||||||||||||
| Expected NPAT growth (compound annual growth rate - 5 years) |
1.0% | 4.1% | 2.6% | 6.5% | ||||||||||||
| Common Equity Tier 1 ratio |
11.5% | 11.9% to 12.7% | 12.3% | 11.6% | ||||||||||||
While the underlying performance of both investments continues to be strong, the assumptions in the VIU were adjusted to reflect reasonable estimates of the impact of COVID-19 and the increased risks associated with the estimated cash flows. Accordingly in performing the VIU calculation as at 31 March 2020 expected NPAT growth estimates were reduced; higher risk weight asset growth estimates were used in the early years and a higher discount rate was used assuming that higher risk premiums would more than offset reductions in risk free rates.
As the adjusted VIU calculations did not support the carrying value of either investment as at 31 March 2020 the Group recorded an impairment charge of $815 million in the March 2020 half with AmBank impaired by $595 million and PT Panin impaired by $220 million. Both investments form part of the TSO and Group Centre operating segment.
The impact of COVID-19 on the valuation of AmBank and PT Panin is uncertain. Significant management judgment is required to determine the assumptions underpinning the VIU calculations. Changes in key assumptions could have a positive or adverse impact on the recoverable amount of the investment.
88
NOTES TO CONDENSED CONSOLIDATED FINANCIAL STATEMENTS
Customer remediation provision
At 31 March 2020, the Group has recognised provisions of $1,094 million (Sep 19: $1,139 million; Mar 19: $698 million) in respect of customer remediation which includes provisions for expected refunds to customers, remediation project costs and costs associated and related customer and regulatory claims, penalties and litigation outcomes.
Determining the amount of the provisions, which represent management’s best estimate of the cost of settling the identified matters, requires the exercise of significant judgement. It will often be necessary to form a view on a number of different assumptions, including the number of impacted customers, the average refund per customer, associated remediation project costs, and the implications of regulatory exposures and customer claims having regard to their specific facts and circumstances.
Consequently, the appropriateness of the underlying assumptions is reviewed on a regular basis against actual experience and other relevant evidence, including expert legal advice, and adjustments are made to the provisions where appropriate.
Other provisions
The Group holds provisions for various obligations including restructuring costs and surplus lease space, non-lending losses, fraud and forgeries and litigation related claims. These provisions involve judgements regarding the timing and outcome of future events, including estimates of expenditure required to satisfy such obligations. The appropriateness of the underlying assumptions is reviewed on a regular basis against actual experience and other relevant evidence, including expert legal advice, and adjustments are made to the provisions where appropriate.
Useful lives of software
Management judgement is used to assess the useful life of software assets. A number of factors can influence the useful lives of software assets, including changes to business strategy, significant divestments and the pace of technological change.
The Group reassess the useful lives of software assets on a semi-annual basis.
| v) | Accounting policies |
These Condensed Consolidated Financial Statements have been prepared on the basis of accounting policies and using methods of computation consistent with those applied in the 2019 ANZ Annual Financial Report with the exception of policies associated with new standards adopted during the period as discussed below.
Discontinued operations are separately presented from the results of the continuing operations as a single line item ‘profit/(loss) after tax from discontinued operations’ in the Condensed Consolidated Income Statement. Notes to the Condensed Consolidated Income Statement have been presented on a continuing basis. Assets and liabilities of discontinued operations have been presented as held for sale in the Condensed Consolidated Balance Sheet as at 31 March 2020.
Accounting standards adopted during the period
AASB 16 Leases (AASB 16)
AASB 16 became effective for the Group from 1 October 2019 and replaced the previous standard AASB 117 Leases (AASB 117). AASB 16 primarily impacts the Group’s property and technology leases which were previously classified as operating leases. Under AASB 117, operating leases were not recognised on balance sheet and rent payments were expensed over the lease term.
Under AASB 16, the Group recognises all leases (except for leases of low value assets and short term leases) on balance sheet under a single accounting model. Accordingly, the Group recognises its right to use an underlying leased asset over the lease term as a right-of-use (ROU) asset, and its obligation to make lease payments as a lease liability. In the income statement, the Group recognises depreciation expense on the ROU asset and interest expense on the lease liability. As a result, lease expenses will be higher in the early periods of a lease and lower in the later periods of the lease compared to the previous standard where expenses were constant over the lease term. Cumulative expenses over the life of a lease will not change.
As permitted by the standard, the Group does not recognise ROU assets and lease liabilities for leases of low value items and short term leases (less than 12 months). Instead, the lease payments associated with these leases are recognised as operating expense in the income statement on a straight-line basis over the lease term.
The Group has applied the modified retrospective transition approach whereby initial lease liabilities are recognised based on the present value of remaining lease payments as of the transition date. The initial ROU asset recognised for certain large commercial and retail leases was measured as if AASB 16 had always been applied to the leases. For all other leases, the initial ROU asset was measured as equal to the initial lease liability.
The implementation of AASB 16 requires management to make certain key judgements including the determination of lease terms, discount rates and identifying arrangements that contain a lease.
Based on the modified retrospective transition approach, the Group recognised lease liabilities of $1.7 billion presented within Payables and other liabilities and right-of-use assets of $1.6 billion presented within Property Plant and Equipment. This resulted in a reduction to opening retained earnings of $88 million and an increase in deferred tax assets of $37 million as of 1 October 2019. Comparatives have not been restated.
In addition, the Group elected to apply the following practical expedients as permitted under the modified retrospective transition approach:
| a) | Impairment of ROU assets at the transition date were assessed by relying on onerous lease provisions previously recognised as of 30 September 2019 under AASB 117; |
| b) | Initial direct costs associated with entering leases prior to the transition date were excluded from the carrying value of ROU assets recognised at transition; |
| c) | No ROU assets or lease liabilities were recognised for certain leases with less than 12 months remaining as of the transition date; these leases were treated as short-term leases with all lease payments recognised in rent expense as incurred; and |
| d) | Hindsight was used to determine the lease term of contracts that contained options to extend the lease. |
89
NOTES TO CONDENSED CONSOLIDATED FINANCIAL STATEMENTS
The following table reconciles the operating lease commitments disclosed under AASB 117 as at 30 September 2019 to the opening lease liabilities recognised under AASB 16 as at 1 October 2019.
| $M | ||||
| Operating Lease Commitments as of 30 September 2019 |
1,656 | |||
| Increase in lease term for extension options |
210 | |||
| Exclusion of low value leases and leases of less than 12 months |
(19 | ) | ||
| Exclusion of service components |
(10 | ) | ||
| Other |
(17 | ) | ||
| Total Undiscounted Lease Payments |
1,820 | |||
| Effect of discounting at a weighted average incremental borrowing rate of 2.44% |
(141 | ) | ||
| Total lease liabilities under AASB 16 |
1,679 | |||
During the reporting period, the Group recognised the following amounts in the income statement
| $M | ||||
| Depreciation expense on ROU assets |
203 | |||
| Interest expense on lease liabilities |
20 | |||
| Interest expense on makegood provisions |
1 | |||
| Rent expense in relation to low value leases and leases of less than 12 months |
11 | |||
| Other Income in relation to subleases |
12 | |||
The Group’s accounting policies with respect to lease arrangements where it acts as lessor have not changed under AASB 16 except where the Group subleases certain leased properties. Where the Group acts as intermediate lessor, it classifies the sublease as either a finance lease or operating lease by reference to the ROU asset of the head lease. Income from operating subleases is recognised in Other Operating Income in the Income Statement.
Interest Rate Benchmark Reform
Background
Interbank offered rates (IBORs), such as the London Interbank Offered Rate (LIBOR), play a critical role in global financial markets, serving as reference rates for derivatives, loans and securities, and as parameters in the valuation of financial instruments.
Uncertainty surrounding the integrity of IBOR rates has in recent years, led regulators, central banks and market participants to work towards a transition to alternative risk-free benchmark reference rates (RFR’s) and market-led working groups in respective jurisdictions have recommended alternative risk-free reference rates, which are gradually being adopted. Progress in the transition to these new benchmarks has resulted in significant uncertainty in the future of IBOR benchmarks beyond 1 January 2022.
Accounting amendments
In response to the uncertainty about the long-term viability of these benchmark rates, and LIBOR in particular, the International Accounting Standards Board (IASB) has established a project to consider the financial reporting implications of the reform. The transition from LIBOR is expected to have an impact on various elements of financial instrument accounting, including hedge accounting, as well as fair value methodologies and disclosures.
In October 2019, the AASB issued AASB 2019-3 Amendments to Australian Accounting Standards – Interest Rate Benchmark Reform, which amends certain existing hedge accounting requirements to provide relief from potential effects of the uncertainty caused by the interest rate benchmark reform. The Group elected to early adopt the amendments from 1 October 2019 which have not had a significant impact on the Group.
These amendments address the accounting effects of uncertainty in the period leading up to the reform arising from the Group’s ability to satisfy the existing prospective hedge effectiveness requirements of AASB 139. This uncertainty arises as it is not known when the hedged items (such as debt issuances) and associated hedging instruments (such as interest rate swaps) will be changed to reference the RFR’s, or if both the hedging item and the associated hedging instrument will move to the new rates at the same time. The Group has applied this amendment to all hedge accounted relationships (cash flow or fair value hedges) where the reform gives rise to uncertainties about the timing or amount of IBOR based cash flows of the hedged item or hedging instrument.
The IASB has commenced working on Phase 2 of its IBOR Reform project, which focuses on potential issues that might affect financial reporting once the existing rate is replaced with an alternative rate. The Group is monitoring these developments and continues to assess the expected financial impact.
Impact of IBOR reform
The Group has exposure to IBOR through its issuance of debt, the structural interest rate risk position, holdings of investment securities; products denominated in foreign currencies and associated hedging activities in our treasury and markets businesses within TSO and Group Centre and Institutional divisions respectively.
The Group has established an enterprise-wide Benchmark Transition Program to manage the transition. The program includes the assessment and actions necessary to accommodate the transition to RFR’s as they apply to internal processes and systems including pricing, risk management, documentation and hedge arrangements. The program includes management of the impact on customers.
Impact of IBOR reform on the Group’s hedging relationships
The most significant interest rate benchmarks to which the Group’s hedging relationships are exposed to are USD LIBOR, Euro Interbank Offered Rate (Euribor), Bank Bill Swap Rate (BBSW) and Bank Bill Market (BKBM).
Of these benchmarks the Group expects BBSW, BKBM and EURIBOR to exist as benchmark rates for the foreseeable future and therefore does not believe its BBSW, BKBM or EURIBOR benchmark fair value or cash flow hedges to be directly impacted by IBOR reform.
90
NOTES TO CONDENSED CONSOLIDATED FINANCIAL STATEMENTS
The table below details the carrying values of the Group’s exposures designated in hedge accounting relationships that will be impacted by IBOR reform, principally USD Libor. The nominal value of the associated hedging instruments are also included:
| As at 31 March 20
|
||||||||||||
| Hedged items | USD LIBOR exposures
|
|||||||||||
| Investment securities at FVOCI |
17,144 | |||||||||||
| Net loans and advances |
135 | |||||||||||
| Debt issuances |
42,935 | |||||||||||
| Hedging instruments | Notional designated up to 31 December 2021 AUD$M |
Notional designated beyond AUD$M |
Total Notional Amount AUD $M |
|||||||||
| Fair value hedges |
22,352 | 34,965 | 57,317 | |||||||||
| Cash flow hedges |
- | 1,212 | 1,212 | |||||||||
As at 31 March, 2020 the Group also has GBP LIBOR, CHF LIBOR and JPY LIBOR exposures designated in hedge accounting relationships of $1,118 million, $1,073 million and $3,582 million respectively.
| vi) | Future accounting developments |
AASB 9 - General hedge accounting
AASB 9 introduces new hedge accounting requirements which more closely align accounting with risk management activities undertaken when hedging financial and non-financial risks.
AASB 9 provides the Group with an accounting policy choice to continue to apply AASB 139 Financial Instruments: Recognition and Measurement (AASB 139) hedge accounting requirements until the International Accounting Standards Board’s ongoing project on macro hedge accounting is completed. The Group currently applies the hedge accounting requirements of AASB 139.
91
NOTES TO CONDENSED CONSOLIDATED FINANCIAL STATEMENTS
| 2. | Income |
| Half Year | Movement | |||||||||||||||||||
| Mar 20 | Sep 19 | Mar 19 | Mar 20 | Mar 20 | ||||||||||||||||
| $M | $M | $M | v. Sep 19 | v. Mar 19 | ||||||||||||||||
| Interest income |
13,800 | 15,107 | 15,970 | -9% | -14% | |||||||||||||||
| Interest expense |
(6,382 | ) | (7,882 | ) | (8,493 | ) | -19% | -25% | ||||||||||||
| Major bank levy |
(196 | ) | (185 | ) | (178 | ) | 6% | 10% | ||||||||||||
| Net interest income |
7,222 | 7,040 | 7,299 | 3% | -1% | |||||||||||||||
| Other operating income |
||||||||||||||||||||
| i) Fee and commission income |
||||||||||||||||||||
| Lending fees1 |
303 | 299 | 303 | 1% | 0% | |||||||||||||||
| Non-lending fees |
1,441 | 1,552 | 1,507 | -7% | -4% | |||||||||||||||
| Commissions |
46 | 76 | 48 | -39% | -4% | |||||||||||||||
| Funds management income |
139 | 126 | 128 | 10% | 9% | |||||||||||||||
| Fee and commission income |
1,929 | 2,053 | 1,986 | -6% | -3% | |||||||||||||||
| Fee and commission expense |
(752 | ) | (741 | ) | (721 | ) | 1% | 4% | ||||||||||||
| Net fee and commission income |
1,177 | 1,312 | 1,265 | -10% | -7% | |||||||||||||||
| ii) Other income |
||||||||||||||||||||
| Net foreign exchange earnings and other financial instruments income2 |
1,099 | 898 | 380 | 22% | large | |||||||||||||||
| Impairment of AmBank |
(595 | ) | - | - | n/a | n/a | ||||||||||||||
| Impairment of PT Panin |
(220 | ) | - | - | n/a | n/a | ||||||||||||||
| Sale of OPL NZ |
- | 7 | 82 | -100% | -100% | |||||||||||||||
| Sale of Paymark |
- | - | 37 | n/a | -100% | |||||||||||||||
| Sale of Cambodia JV |
- | 10 | - | -100% | n/a | |||||||||||||||
| Sale of PNG Retail, Commercial & SME |
- | 1 | - | -100% | n/a | |||||||||||||||
| Dividend income on equity securities |
- | 28 | - | -100% | n/a | |||||||||||||||
| Other |
28 | 16 | 22 | 75% | 27% | |||||||||||||||
| Other income |
312 | 960 | 521 | -68% | -40% | |||||||||||||||
| Other operating income |
1,489 | 2,272 | 1,786 | -34% | -17% | |||||||||||||||
| iii) Net income from insurance business |
47 | 49 | 77 | -4% | -39% | |||||||||||||||
| iv) Share of associates’ profit |
135 | 131 | 131 | 3% | 3% | |||||||||||||||
| Operating income3 |
8,893 | 9,492 | 9,293 | -6% | -4% | |||||||||||||||
| 1. | Lending fees exclude fees treated as part of the effective yield calculation in interest income. |
| 2. | Includes fair value movements (excluding realised and accrued interest) on derivatives not designated as accounting hedges entered into to manage interest rate and foreign exchange risk on funding instruments, ineffective portions of cash flow hedges, and fair value movements in financial assets and liabilities designated at fair value through profit and loss. |
| 3. | Includes charges associated with customer remediation of $58 million for the March 2020 half (Sep 19 half: $148 million; Mar 19 half: $64 million). |
92
NOTES TO CONDENSED CONSOLIDATED FINANCIAL STATEMENTS
| 3. | Operating expenses |
| Half Year
|
Movement
|
|||||||||||||||||||||
| Mar 20 $M |
Sep 19 $M |
Mar 19 $M |
Mar 20 v. Sep 19 |
Mar 20 v. Mar 19 |
||||||||||||||||||
| i) Personnel |
||||||||||||||||||||||
| Salaries and related costs |
2,177 | 2,122 | 2,127 | 3% | 2% | |||||||||||||||||
| Superannuation costs |
169 | 147 | 146 | 15% | 16% | |||||||||||||||||
| Other |
119 | 126 | 97 | -6% | 23% | |||||||||||||||||
| Personnel1 |
2,465 | 2,395 | 2,370 | 3% | 4% | |||||||||||||||||
| ii) Premises |
||||||||||||||||||||||
| Rent2 |
43 | 218 | 232 | -80% | -81% | |||||||||||||||||
| Depreciation3 |
263 | 86 | 81 | large | large | |||||||||||||||||
| Other |
99 | 85 | 93 | 16% | 6% | |||||||||||||||||
| Premises |
405 | 389 | 406 | 4% | 0% | |||||||||||||||||
| iii) Technology |
||||||||||||||||||||||
| Depreciation and amortisation3 |
341 | 357 | 337 | -4% | 1% | |||||||||||||||||
| Licences and outsourced services |
405 | 339 | 333 | 19% | 22% | |||||||||||||||||
| Other |
93 | 74 | 94 | 26% | -1% | |||||||||||||||||
| Technology (excluding personnel) |
839 | 770 | 764 | 9% | 10% | |||||||||||||||||
| iv) Restructuring |
105 | 26 | 51 | large | large | |||||||||||||||||
| v) Other |
||||||||||||||||||||||
| Advertising and public relations |
89 | 129 | 97 | -31% | -8% | |||||||||||||||||
| Professional fees |
293 | 308 | 229 | -5% | 28% | |||||||||||||||||
| Freight, stationery, postage and communication |
104 | 109 | 107 | -5% | -3% | |||||||||||||||||
| Royal Commission legal costs |
- | 2 | 13 | -100% | -100% | |||||||||||||||||
| Other |
305 | 578 | 328 | -47% | -7% | |||||||||||||||||
| Other1 |
791 | 1,126 | 774 | -30% | 2% | |||||||||||||||||
| Operating expenses1 |
4,605 | 4,706 | 4,365 | -2% | 5% | |||||||||||||||||
| 1. | Includes customer remediation expenses of $71 million for the March 2020 half (Sep 19 half: $337 million; Mar 19 half: $36 million). |
| 2. | Following the adoption of AASB16 on 1 October 2019, with the exception of low value leases and leases of less than 12 months, expenses associated with operating leases are shown as depreciation of the right-of-use asset and interest expense associated with the lease liability (comparatives not restated). |
| 3. | Includes depreciation and amortisation on right-of-use assets which the Group commenced recognising on the adoption of AASB 16 (comparatives not restated). |
93
NOTES TO CONDENSED CONSOLIDATED FINANCIAL STATEMENTS
| 4. | Income tax expense |
Reconciliation of the prima facie income tax expense on pre-tax profit with the income tax expense recognised in the profit and loss.
| Half Year
|
Movement
|
|||||||||||||||||||||
| Mar 20 $M |
Sep 19 $M |
Mar 19 $M |
Mar 20 v. Sep 19 |
Mar 20 v. Mar 19 |
||||||||||||||||||
| Profit before income tax from continuing operations |
2,614 | 4,384 | 4,536 | -40% | -42% | |||||||||||||||||
| Prima facie income tax expense at 30% |
784 | 1,315 | 1,361 | -40% | -42% | |||||||||||||||||
| Tax effect of permanent differences: |
||||||||||||||||||||||
| Gains or losses on sale from divestments |
- | (5 | ) | (20 | ) | -100% | -100% | |||||||||||||||
| Impairment of investment in AmBank and PT Panin |
245 | - | - | n/a | n/a | |||||||||||||||||
| Share of associates’ profit |
(41 | ) | (39 | ) | (39 | ) | 5% | 5% | ||||||||||||||
| Interest on convertible instruments |
29 | 30 | 33 | -3% | -12% | |||||||||||||||||
| Overseas tax rate differential |
(35 | ) | (48 | ) | (64 | ) | -27% | -45% | ||||||||||||||
| Provision for foreign tax on dividend repatriation |
14 | 30 | 9 | -53% | 56% | |||||||||||||||||
| Tax provisions no longer required |
- | (8 | ) | (6 | ) | -100% | -100% | |||||||||||||||
| Other |
5 | 71 | 6 | -93% | -17% | |||||||||||||||||
| Subtotal |
1,001 | 1,346 | 1,280 | -26% | -22% | |||||||||||||||||
| Income tax (over)/under provided in previous years |
(23 | ) | (21 | ) | 4 | 10% | large | |||||||||||||||
| Income tax expense |
978 | 1,325 | 1,284 | -26% | -24% | |||||||||||||||||
| Australia |
580 | 867 | 815 | -33% | -29% | |||||||||||||||||
| Overseas |
398 | 458 | 469 | -13% | -15% | |||||||||||||||||
| Income tax expense |
978 | 1,325 | 1,284 | -26% | -24% | |||||||||||||||||
| Effective tax rate |
37.4% | 30.2% | 28.3% | |||||||||||||||||||
94
NOTES TO CONDENSED CONSOLIDATED FINANCIAL STATEMENTS
| 5. | Dividends |
| Dividend per ordinary share (cents) | Half Year
|
Movement
|
||||||||||||||||||||
| Mar 20 | Sep 19 | Mar 19 |
Mar 20 v. Sep 19 |
Mar 20 v. Mar 19 |
||||||||||||||||||
| Interim |
||||||||||||||||||||||
| - fully franked1,2,3 |
TBD | N/A | 80 | |||||||||||||||||||
| - partially franked1 |
TBD | N/A | N/A | |||||||||||||||||||
| Final |
||||||||||||||||||||||
| - partially franked3,4 |
N/A | 80 | N/A | |||||||||||||||||||
| Total |
TBD | 80 | 80 | |||||||||||||||||||
| Ordinary share dividend ($M)5 |
||||||||||||||||||||||
| Interim dividend |
- | 2,267 | - | |||||||||||||||||||
| Final dividend |
2,268 | - | 2,295 | |||||||||||||||||||
| Bonus option plan adjustment |
(40 | ) | (40 | ) | (41 | ) | 0% | -2% | ||||||||||||||
| Total |
2,228 | 2,227 | 2,254 | 0% | -1% | |||||||||||||||||
| Ordinary share dividend payout ratio (%)6 |
TBD | 81.6% | 71.4% | |||||||||||||||||||
| 1. | The decision on the payment of a 2020 interim dividend has been deferred until the economic outlook is clearer and an update will be provided at the August 2020 market update. |
| 2. | Fully franked for Australian tax purposes (30% tax rate) for the 2019 interim dividend. |
| 3. | Carries New Zealand imputation credits of NZD 9 cents for the 2019 interim and final dividend. |
| 4. | Partially franked at 70% for Australian tax purposes (30% tax rate). |
| 5. | Dividends paid to ordinary equity holders of the Company. Excludes dividends paid by subsidiaries of the Group to non-controlling equity holders (Sep 19 half: $1.6 million; Mar 19 half: nil). |
| 6. | The dividend payout ratio for the March 2020 half will be determined when the decision on the 2020 interim dividend has been made. Dividend payout ratios for the September 2019 half and March 2019 half were calculated using actual dividend paid of $2,268 million and $2,267 million respectively. |
With consideration to the current uncertainties in the economic outlook and the letter issued by the Australian Prudential Regulation Authority (APRA) to all Authorised Deposit Taking Institutions (ADIs) on 7 April 2020, on capital management and the ongoing Coronavirus (COVID-19) pandemic, the ANZ board has deferred the decision on the payment of a 2020 interim dividend until the economic outlook is clearer. Decisions in relation to the Dividend Reinvestment Plan and Bonus Option Plan will also be made at that time as applicable.
The Board will continue to deliberate and an update will be provided at the August 2020 market update.
95
NOTES TO CONDENSED CONSOLIDATED FINANCIAL STATEMENTS
| 6. | Earnings per share |
| Half Year | Movement | |||||||||||||||||||
| Mar 20 | Mar 20 | |||||||||||||||||||
| Mar 20 | Sep 19 | Mar 19 | v. Sep 19 | v. Mar 19 | ||||||||||||||||
| Earnings Per Share (EPS) - Basic |
||||||||||||||||||||
| Earnings Per Share (cents) |
54.6 | 98.3 | 111.7 | -44% | -51% | |||||||||||||||
| Earnings Per Share (cents) from continuing operations1 |
57.8 | 107.9 | 114.1 | -46% | -49% | |||||||||||||||
| Earnings Per Share (cents) from discontinued operations |
(3.2 | ) | (9.6 | ) | (2.4 | ) | -67% | 33% | ||||||||||||
| Earnings Per Share (EPS) - Diluted |
||||||||||||||||||||
| Earnings Per Share (cents) |
51.5 | 94.7 | 106.4 | -46% | -52% | |||||||||||||||
| Earnings Per Share (cents) from continuing operations1 |
54.3 | 103.6 | 108.7 | -48% | -50% | |||||||||||||||
| Earnings Per Share (cents) from discontinued operations |
(2.8 | ) | (8.9 | ) | (2.3 | ) | -69% | 22% | ||||||||||||
| Basic EPS is calculated by dividing the profit or loss attributable to ordinary shareholders by the weighted average number of ordinary shares outstanding during the period (after eliminating ANZ shares held within the Group known as treasury shares). Diluted EPS is calculated by adjusting the profit or loss attributable to ordinary shareholders and the weighted average number of ordinary shares used in the basic EPS calculation for the effect of dilutive potential ordinary shares. |
| |||||||||||||||||||
|
| ||||||||||||||||||||
| Reconciliation of earnings used in earnings per share calculations |
||||||||||||||||||||
| Basic: |
||||||||||||||||||||
| Profit for the period ($M) |
1,546 | 2,786 | 3,182 | -45% | -51% | |||||||||||||||
| Less: Profit attributable to non-controlling interests ($M) |
1 | 6 | 9 | -83% | -89% | |||||||||||||||
| Earnings used in calculating basic earnings per share ($M) |
1,545 | 2,780 | 3,173 | -44% | -51% | |||||||||||||||
| Less: Profit/(Loss) after tax from discontinued operations ($M) |
(90 | ) | (273 | ) | (70 | ) | -67% | 29% | ||||||||||||
| Earnings used in calculating basic earnings per share from continuing operations ($M) |
1,635 | 3,053 | 3,243 | -46% | -50% | |||||||||||||||
| Diluted: |
||||||||||||||||||||
| Earnings used in calculating basic earnings per share ($M) |
1,545 | 2,780 | 3,173 | -44% | -51% | |||||||||||||||
| Add: Interest on convertible subordinated debt ($M) |
124 | 131 | 137 | -5% | -9% | |||||||||||||||
| Earnings used in calculating diluted earnings per share ($M) |
1,669 | 2,911 | 3,310 | -43% | -50% | |||||||||||||||
| Less: Profit/(Loss) after tax from discontinued operations ($M) |
(90 | ) | (273 | ) | (70 | ) | -67% | 29% | ||||||||||||
| Earnings used in calculating diluted earnings per share from continuing operations ($M) |
1,759 | 3,184 | 3,380 | -45% | -48% | |||||||||||||||
| Reconciliation of weighted average number of ordinary shares (WANOS) used in earnings per share calculations1,2 |
||||||||||||||||||||
| WANOS used in calculating basic earnings per share (M) |
2,830.6 | 2,828.4 | 2,841.3 | 0% | 0% | |||||||||||||||
| Add: Weighted average dilutive potential ordinary shares (M) |
||||||||||||||||||||
| Convertible subordinated debt (M) |
401.4 | 237.9 | 260.5 | 69% | 54% | |||||||||||||||
| Share based payments (options, rights and deferred shares) (M) |
6.6 | 8.3 | 8.4 | -20% | -21% | |||||||||||||||
| WANOS used in calculating diluted earnings per share (M) |
3,238.6 | 3,074.6 | 3,110.2 | 5% | 4% | |||||||||||||||
| 1. | The successor fund transfer performed in preparation for the sale of the Group’s wealth businesses to Zurich and IOOF was completed on 13 April 2019. Post this date, treasury shares held in Wealth Australia discontinued operations ceased to be eliminated in the Group’s consolidated financial statements and are included in the denominator used in calculating earnings per share. If the weighted average number of treasury shares held in Wealth Australia discontinued operations was included in the denominator used in calculating earnings per share from continuing operations in the comparative periods, basic earnings per share from continuing operations for the September 2019 half and March 2019 half would have been 107.9 cents and 113.5 cents respectively and diluted earnings per share from continuing operations for the September 2019 half and March 2019 half would have been 103.5 cents and 108.1 cents respectively. |
| 2. | Weighted average number of ordinary shares excludes the weighted average number of treasury shares held in ANZEST and Wealth Australia discontinued operations as summarised in the table below: |
| |
Mar 20 half (Million)
|
Sep 19 half (Million)
|
Mar 19 half (Million)
| |||||
|
ANZEST Pty Ltd |
4.9 | 4.6 | 4.9 | |||||
| Wealth Australia discontinued operations |
- | 0.9 | 15.6 | |||||
|
Total treasury shares |
4.9 | 5.5 | 20.5 | |||||
96
NOTES TO CONDENSED CONSOLIDATED FINANCIAL STATEMENTS
| 7. | Segment analysis |
| i) | Description of segments |
The Group operates on a divisional structure with five continuing divisions: Australia Retail and Commercial, New Zealand, Institutional, Pacific, and TSO and Group Centre. For further information on the composition of divisions refer to the Definitions on page 141.
The presentation of divisional results has not been impacted by methodology or structural changes during the period.
The divisions reported below are consistent with internal reporting provided to the chief operating decision maker, being the Chief Executive Officer.
| ii) | Operating segments |
ANZ measures the performance of continuing segments on a cash profit basis. To calculate cash profit, certain non-core items are removed from statutory profit. Details of these items are included in the ‘Other items’ section of this note. Transactions between divisions across segments within ANZ are conducted on an arm’s-length basis and disclosed as part of the income and expenses of these segments.
For information on discontinued operations please refer to Note 12.
| March 2020 Half Year | Australia Retail and Commercial $M |
Institutional $M |
New Zealand $M |
Pacific $M |
TSO and Group Centre $M |
Other items1 $M |
Group Total $M |
|||||||||||||||||||||
| Net interest income |
4,048 | 1,624 | 1,410 | 65 | 75 | - | 7,222 | |||||||||||||||||||||
| Net fee and commission income |
||||||||||||||||||||||||||||
| - Lending fees |
133 | 156 | 8 | 6 | - | - | 303 | |||||||||||||||||||||
| - Non-lending fees |
694 | 406 | 331 | 18 | (8 | ) | - | 1,441 | ||||||||||||||||||||
| - Commissions |
25 | - | 21 | - | - | - | 46 | |||||||||||||||||||||
| - Funds management income |
12 | 1 | 126 | - | - | - | 139 | |||||||||||||||||||||
| - Fee and commission expense |
(322 | ) | (178 | ) | (248 | ) | (4 | ) | - | - | (752 | ) | ||||||||||||||||
| Net income from insurance business |
47 | - | - | - | - | - | 47 | |||||||||||||||||||||
| Other income |
6 | 782 | 9 | 30 | (829 | ) | 314 | 312 | ||||||||||||||||||||
| Share of associates’ profit |
- | - | - | - | 135 | - | 135 | |||||||||||||||||||||
| Operating income |
4,643 | 2,791 | 1,657 | 115 | (627 | ) | 314 | 8,893 | ||||||||||||||||||||
| Profit/(Loss) after tax from continuing operations |
1,214 | 610 | 567 | 20 | (998 | ) | 222 | 1,635 | ||||||||||||||||||||
| Profit/(Loss) after tax from discontinued operations |
(90 | ) | ||||||||||||||||||||||||||
| Profit after tax attributable to shareholders |
1,545 | |||||||||||||||||||||||||||
| 1. | In evaluating the performance of the operating segments, certain items are removed from statutory profit where they are not considered integral to the ongoing performance of the segment and are evaluated separately. |
97
NOTES TO CONDENSED CONSOLIDATED FINANCIAL STATEMENTS
| 7. | Segment analysis, cont’d |
| Australia Retail and Commercial |
Institutional | New Zealand |
Pacific | TSO and Group Centre |
Other items1 |
Group Total |
||||||||||||||||||||||
| September 2019 Half Year |
$M | $M | $M | $M | $M | $M | $M | |||||||||||||||||||||
| Net interest income |
4,000 | 1,501 | 1,351 | 60 | 128 | - | 7,040 | |||||||||||||||||||||
| Net fee and commission income |
||||||||||||||||||||||||||||
| - Lending fees |
146 | 138 | 8 | 7 | - | - | 299 | |||||||||||||||||||||
| - Non-lending fees |
791 | 412 | 337 | 22 | (10 | ) | - | 1,552 | ||||||||||||||||||||
| - Commissions |
35 | - | 40 | - | 1 | - | 76 | |||||||||||||||||||||
| - Funds management income |
4 | 1 | 123 | - | (2 | ) | - | 126 | ||||||||||||||||||||
| - Fee and commission expense |
(335 | ) | (170 | ) | (232 | ) | (5 | ) | 1 | - | (741 | ) | ||||||||||||||||
| Net income from insurance business |
48 | - | - | - | 1 | - | 49 | |||||||||||||||||||||
| Other income |
9 | 685 | 2 | 30 | 25 | 209 | 960 | |||||||||||||||||||||
| Share of associates’ profit |
(2 | ) | - | - | - | 133 | - | 131 | ||||||||||||||||||||
| Operating income |
4,696 | 2,567 | 1,629 | 114 | 277 | 209 | 9,492 | |||||||||||||||||||||
| Profit/(Loss) after tax from continuing operations |
1,492 | 816 | 646 | 26 | (74 | ) | 147 | 3,053 | ||||||||||||||||||||
| Profit/(Loss) after tax from discontinued operations |
(273 | ) | ||||||||||||||||||||||||||
| Profit after tax attributable to shareholders |
2,780 | |||||||||||||||||||||||||||
| March 2019 Half Year |
||||||||||||||||||||||||||||
| Net interest income |
4,092 | 1,579 | 1,385 | 68 | 175 | - | 7,299 | |||||||||||||||||||||
| Net fee and commission income |
||||||||||||||||||||||||||||
| - Lending fees |
144 | 144 | 8 | 7 | - | - | 303 | |||||||||||||||||||||
| - Non-lending fees |
708 | 435 | 354 | 20 | (10 | ) | - | 1,507 | ||||||||||||||||||||
| - Commissions |
40 | - | 21 | - | (13 | ) | - | 48 | ||||||||||||||||||||
| - Funds management income |
10 | 1 | 120 | - | (3 | ) | - | 128 | ||||||||||||||||||||
| - Fee and commission expense |
(322 | ) | (168 | ) | (227 | ) | (4 | ) | - | - | (721 | ) | ||||||||||||||||
| Net income from insurance business |
52 | - | 18 | - | - | 7 | 77 | |||||||||||||||||||||
| Other income |
18 | 714 | 4 | 27 | 218 | (460 | ) | 521 | ||||||||||||||||||||
| Share of associates’ profit |
1 | - | 4 | - | 126 | - | 131 | |||||||||||||||||||||
| Operating income |
4,743 | 2,705 | 1,687 | 118 | 493 | (453 | ) | 9,293 | ||||||||||||||||||||
| Profit/(Loss) after tax from continuing operations |
1,703 | 1,012 | 753 | 33 | 63 | (321 | ) | 3,243 | ||||||||||||||||||||
| Profit/(Loss) after tax from discontinued operations |
(70 | ) | ||||||||||||||||||||||||||
| Profit after tax attributable to shareholders |
3,173 | |||||||||||||||||||||||||||
| 1. | In evaluating the performance of the operating segments, certain items are removed from statutory profit where they are not considered integral to the ongoing performance of the segment and are evaluated separately. |
iii) Other items
The table below sets out the profit after tax impact of other items which are removed from statutory profit to reflect the cash profit of each segment.
| Half Year | Movement | |||||||||||||||||||
| Item gains/(losses) | Related segment | Mar 20 $M |
Sep 19 $M |
Mar 19 $M |
Mar 20 v. Sep 19 |
Mar 20 v. Mar 19 | ||||||||||||||
| Revaluation of policy liabilities |
New Zealand | - | - | (77 | ) | n/a | -100% | |||||||||||||
| Economic hedges |
Institutional, New Zealand, TSO and Group Centre |
340 | 67 | (185 | ) | large | large | |||||||||||||
| Revenue and expense hedges |
TSO and Group Centre | (120 | ) | 79 | (60 | ) | large | 100% | ||||||||||||
| Structured credit intermediation trades |
Institutional | 2 | 1 | 1 | 100% | 100% | ||||||||||||||
| Total from continuing operations |
222 | 147 | (321 | ) | 51% | large | ||||||||||||||
98
NOTES TO CONDENSED CONSOLIDATED FINANCIAL STATEMENTS
| 8. | Net loans and advances |
| As at | Movement | |||||||||||||||||||
| Mar 20 $M |
Sep 19 $M |
Mar 19 $M |
Mar 20 v. Sep 19 |
Mar 20 v. Mar 19 |
||||||||||||||||
| Australia |
||||||||||||||||||||
| Overdrafts |
4,997 | 5,867 | 5,832 | -15% | -14% | |||||||||||||||
| Credit cards outstanding |
7,383 | 7,781 | 8,168 | -5% | -10% | |||||||||||||||
| Commercial bills outstanding |
6,414 | 6,159 | 6,441 | 4% | 0% | |||||||||||||||
| Term loans - housing |
263,596 | 264,786 | 268,766 | 0% | -2% | |||||||||||||||
| Term loans - non-housing |
164,346 | 145,538 | 132,733 | 13% | 24% | |||||||||||||||
| Lease receivables |
1,066 | 929 | 966 | 15% | 10% | |||||||||||||||
| Hire purchase contracts |
452 | 535 | 561 | -16% | -19% | |||||||||||||||
| Total Australia |
448,254 | 431,595 | 423,467 | 4% | 6% | |||||||||||||||
| Asia, Pacific, Europe & America |
||||||||||||||||||||
| Overdrafts |
476 | 541 | 611 | -12% | -22% | |||||||||||||||
| Credit cards outstanding |
7 | 7 | 12 | 0% | -42% | |||||||||||||||
| Term loans - housing |
531 | 504 | 770 | 5% | -31% | |||||||||||||||
| Term loans - non-housing1 |
78,803 | 61,491 | 61,405 | 28% | 28% | |||||||||||||||
| Lease receivables1 |
29 | 274 | 305 | -89% | -90% | |||||||||||||||
| Other |
28 | 19 | 13 | 47% | large | |||||||||||||||
| Total Asia, Pacific, Europe & America |
79,874 | 62,836 | 63,116 | 27% | 27% | |||||||||||||||
| New Zealand |
||||||||||||||||||||
| Overdrafts |
795 | 859 | 1,040 | -7% | -24% | |||||||||||||||
| Credit cards outstanding |
1,389 | 1,453 | 1,552 | -4% | -11% | |||||||||||||||
| Term loans - housing |
85,301 | 78,518 | 79,410 | 9% | 7% | |||||||||||||||
| Term loans - non-housing |
43,373 | 41,308 | 42,930 | 5% | 1% | |||||||||||||||
| Lease receivables |
138 | 146 | 162 | -5% | -15% | |||||||||||||||
| Hire purchase contracts |
1,657 | 1,580 | 1,592 | 5% | 4% | |||||||||||||||
| Total New Zealand |
132,653 | 123,864 | 126,686 | 7% | 5% | |||||||||||||||
|
Sub-total |
660,781 | 618,295 | 613,269 | 7% | 8% | |||||||||||||||
| Unearned income |
(368 | ) | (398 | ) | (446 | ) | -8% | -17% | ||||||||||||
| Capitalised brokerage/mortgage origination fees2 |
865 | 870 | 947 | -1% | -9% | |||||||||||||||
| Gross loans and advances (including assets reclassified as held for sale) |
661,278 | 618,767 | 613,770 | 7% | 8% | |||||||||||||||
| Allowance for expected credit losses (refer to Note 9) |
(4,669 | ) | (3,509 | ) | (3,601 | ) | 33% | 30% | ||||||||||||
| Net loans and advances (including assets reclassified as held for sale) |
656,609 | 615,258 | 610,169 | 7% | 8% | |||||||||||||||
| Net loans and advances held for sale (refer to Note 12) |
- | - | (888 | ) | n/a | -100% | ||||||||||||||
| Net loans and advances |
656,609 | 615,258 | 609,281 | 7% | 8% | |||||||||||||||
| 1. | During the March 2020 half, the Group reclassified certain arrangements from Lease receivables to Term loans – non-housing. Comparatives were not restated. |
| 2. | Capitalised brokerage/mortgage origination fees are amortised over the expected life of the loan. |
99
NOTES TO CONDENSED CONSOLIDATED FINANCIAL STATEMENTS
| 9. | Allowance for expected credit losses |
The following tables present the movement in the allowance for ECL (including allowance for ECL on financial assets held for sale) for the March 2020, September 2019 and March 2019 half year’s.
Net loans and advances - at amortised cost
Allowance for ECL is included in Net loans and advances.
| Stage 3 | ||||||||||||||||||||
| Stage 1 $M |
Stage 2 $M |
Collectively assessed $M |
Individually assessed |
Total $M |
||||||||||||||||
| As at 1 October 2018 |
920 | 1,391 | 359 | 894 | 3,564 | |||||||||||||||
| Transfer between stages |
133 | (228 | ) | (53 | ) | 148 | - | |||||||||||||
| New and increased provisions (net of releases) |
(124 | ) | 244 | 74 | 475 | 669 | ||||||||||||||
| Write-backs |
- | - | - | (152 | ) | (152 | ) | |||||||||||||
| Bad debts written off (excluding recoveries) |
- | - | - | (498 | ) | (498 | ) | |||||||||||||
| Foreign currency translation and other movements |
11 | 8 | 1 | (2 | ) | 18 | ||||||||||||||
| As at 31 March 2019 |
940 | 1,415 | 381 | 865 | 3,601 | |||||||||||||||
| Transfer between stages |
160 | (253 | ) | (87 | ) | 180 | - | |||||||||||||
| New and increased provisions (net of releases) |
(172 | ) | 221 | 122 | 569 | 740 | ||||||||||||||
| Write-backs |
- | - | - | (230 | ) | (230 | ) | |||||||||||||
| Bad debts written off (excluding recoveries) |
- | - | - | (578 | ) | (578 | ) | |||||||||||||
| Foreign currency translation and other movements |
(1 | ) | (5 | ) | (3 | ) | (15 | ) | (24 | ) | ||||||||||
| As at 30 September 2019 |
927 | 1,378 | 413 | 791 | 3,509 | |||||||||||||||
| Transfer between stages |
204 | (270 | ) | (95 | ) | 161 | - | |||||||||||||
| New and increased provisions (net of releases) |
30 | 840 | 132 | 718 | 1,720 | |||||||||||||||
| Write-backs |
- | - | - | (164 | ) | (164 | ) | |||||||||||||
| Bad debts written off (excluding recoveries) |
- | - | - | (469 | ) | (469 | ) | |||||||||||||
| Foreign currency translation and other movements |
30 | 20 | 5 | 18 | 73 | |||||||||||||||
| As at 31 March 2020 |
1,191 | 1,968 | 455 | 1,055 | 4,669 | |||||||||||||||
Investment securities - debt securities at amortised cost
Allowance for ECL is included in Investment securities.
| Stage 3 | ||||||||||||||||||||
| Stage 1 $M |
Stage 2 $M |
Collectively assessed $M |
Individually assessed |
Total $M |
||||||||||||||||
| As at 1 October 2018 |
9 | 2 | - | - | 11 | |||||||||||||||
| Transfer between stages |
- | - | - | - | - | |||||||||||||||
| New and increased provisions (net of releases) |
2 | (1 | ) | - | - | 1 | ||||||||||||||
| Write-backs |
- | - | - | - | - | |||||||||||||||
| Bad debts written off (excluding recoveries) |
- | - | - | - | - | |||||||||||||||
| Foreign currency translation and other movements |
- | - | - | - | - | |||||||||||||||
| As at 31 March 2019 |
11 | 1 | - | - | 12 | |||||||||||||||
| Transfer between stages |
- | - | - | - | - | |||||||||||||||
| New and increased provisions (net of releases) |
- | - | - | - | - | |||||||||||||||
| Write-backs |
- | - | - | - | - | |||||||||||||||
| Bad debts written off (excluding recoveries) |
- | - | - | - | - | |||||||||||||||
| Foreign currency translation and other movements |
1 | - | - | - | 1 | |||||||||||||||
| As at 30 September 2019 |
12 | 1 | - | - | 13 | |||||||||||||||
| Transfer between stages |
- | - | - | - | - | |||||||||||||||
| New and increased provisions (net of releases) |
1 | - | - | - | 1 | |||||||||||||||
| Write-backs |
- | - | - | - | - | |||||||||||||||
| Bad debts written off (excluding recoveries) |
- | - | - | - | - | |||||||||||||||
| Foreign currency translation and other movements |
1 | - | - | - | 1 | |||||||||||||||
| As at 31 March 2020 |
14 | 1 | - | - | 15 | |||||||||||||||
100
NOTES TO CONDENSED CONSOLIDATED FINANCIAL STATEMENTS
| 9. | Allowance for expected credit losses, cont’d |
Investment securities - debt securities at FVOCI
For FVOCI assets, the allowance for ECL does not alter the carrying amount which remains at fair value. Instead, the allowance for ECL is recognised in Other Comprehensive Income (OCI) with a corresponding charge to profit or loss.
| Stage 3 | ||||||||||||||||||||
| Stage 1 $M |
Stage 2 $M |
Collectively assessed $M |
Individually assessed $M |
Total $M |
||||||||||||||||
| As at 1 October 2018 |
14 | - | - | - | 14 | |||||||||||||||
| Transfer between stages |
- | - | - | - | - | |||||||||||||||
| New and increased provisions (net of releases) |
(3 | ) | - | - | - | (3 | ) | |||||||||||||
| Write-backs |
- | - | - | - | - | |||||||||||||||
| Bad debts written off (excluding recoveries) |
- | - | - | - | - | |||||||||||||||
| Foreign currency translation and other movements |
- | - | - | - | - | |||||||||||||||
| As at 31 March 2019 |
11 | - | - | - | 11 | |||||||||||||||
| Transfer between stages |
- | - | - | - | - | |||||||||||||||
| New and increased provisions (net of releases) |
1 | - | - | - | 1 | |||||||||||||||
| Write-backs |
- | - | - | - | - | |||||||||||||||
| Bad debts written off (excluding recoveries) |
- | - | - | - | - | |||||||||||||||
| Foreign currency translation and other movements |
(4 | ) | - | - | - | (4 | ) | |||||||||||||
| As at 30 September 2019 |
8 | - | - | - | 8 | |||||||||||||||
| Transfer between stages |
- | - | - | - | - | |||||||||||||||
| New and increased provisions (net of releases) |
1 | - | - | - | 1 | |||||||||||||||
| Write-backs |
- | - | - | - | - | |||||||||||||||
| Bad debts written off (excluding recoveries) |
- | - | - | - | - | |||||||||||||||
| Foreign currency translation and other movements |
- | - | - | - | - | |||||||||||||||
| As at 31 March 2020 |
9 | - | - | - | 9 | |||||||||||||||
| Off-balance sheet commitments - undrawn and contingent facilities Allowance for ECL is included in Provisions. |
|
|||||||||||||||||||
| Stage 3 | ||||||||||||||||||||
| Stage 1 $M |
Stage 2 $M |
Collectively assessed $M |
Individually assessed $M |
Total $M |
||||||||||||||||
| As at 1 October 2018 |
474 | 166 | 15 | 26 | 681 | |||||||||||||||
| Transfer between stages |
19 | (19 | ) | - | - | - | ||||||||||||||
| New and increased provisions (net of releases) |
(34 | ) | 3 | (1 | ) | 1 | (31 | ) | ||||||||||||
| Write-backs |
- | - | - | - | - | |||||||||||||||
| Bad debts written off (excluding recoveries) |
- | - | - | - | - | |||||||||||||||
| Foreign currency translation and other movements |
5 | 2 | - | (1 | ) | 6 | ||||||||||||||
| As at 31 March 2019 |
464 | 152 | 14 | 26 | 656 | |||||||||||||||
| Transfer between stages |
18 | (20 | ) | 1 | 1 | - | ||||||||||||||
| New and increased provisions (net of releases) |
(12 | ) | 19 | 6 | - | 13 | ||||||||||||||
| Write-backs |
- | - | - | (3 | ) | (3 | ) | |||||||||||||
| Bad debts written off (excluding recoveries) |
- | - | - | - | - | |||||||||||||||
| Foreign currency translation and other movements |
3 | - | - | (1 | ) | 2 | ||||||||||||||
| As at 30 September 2019 |
473 | 151 | 21 | 23 | 668 | |||||||||||||||
| Transfer between stages |
20 | (24 | ) | (2 | ) | 6 | - | |||||||||||||
| New and increased provisions (net of releases) |
98 | 115 | (2 | ) | 15 | 226 | ||||||||||||||
| Write-backs |
- | - | - | (6 | ) | (6 | ) | |||||||||||||
| Bad debts written off (excluding recoveries) |
- | - | - | - | - | |||||||||||||||
| Foreign currency translation and other movements |
19 | 2 | 1 | - | 22 | |||||||||||||||
| As at 31 March 2020 |
610 | 244 | 18 | 38 | 910 | |||||||||||||||
101
NOTES TO CONDENSED CONSOLIDATED FINANCIAL STATEMENTS
| 9. | Allowance for expected credit losses, cont’d |
Credit impairment charge/(release) analysis
| Half Year | Movement | |||||||||||||||||||||
| Mar 20 $M |
Sep 19 $M |
Mar 19 $M |
Mar 20 v. Sep 19 |
Mar 20 v. Mar 19 |
||||||||||||||||||
| New and increased provisions (net of releases)1 |
||||||||||||||||||||||
| - Collectively assessed |
1,048 | 4 | 12 | large | large | |||||||||||||||||
| - Individually assessed |
900 | 750 | 624 | 20% | 44% | |||||||||||||||||
| Write-backs |
(170 | ) | (233 | ) | (152 | ) | -27% | 12% | ||||||||||||||
| Recoveries of amounts previously written off |
(104 | ) | (119 | ) | (93 | ) | -13% | 12% | ||||||||||||||
| Total credit impairment charge |
1,674 | 402 | 391 | large | large | |||||||||||||||||
| Less: credit impairment charge/(release) from discontinued operations |
- | - | (1 | ) | n/a | -100% | ||||||||||||||||
| Total credit impairment charge from continuing operations |
1,674 | 402 | 392 | large | large | |||||||||||||||||
| 1. | Includes the impact of transfers between collectively assessed and individually assessed. |
102
NOTES TO CONDENSED CONSOLIDATED FINANCIAL STATEMENTS
| 10. | Deposits and other borrowings |
| As at | Movement | |||||||||||||||||||||
| Mar 20 $M |
Sep 19 $M |
Mar 19 $M |
Mar 20 v. Sep 19 |
Mar 20 v. Mar 19 |
||||||||||||||||||
| Australia |
||||||||||||||||||||||
| Certificates of deposit |
34,733 | 32,953 | 39,481 | 5% | -12% | |||||||||||||||||
| Term deposits |
69,056 | 74,560 | 77,714 | -7% | -11% | |||||||||||||||||
| On demand and short term deposits |
220,135 | 196,261 | 180,863 | 12% | 22% | |||||||||||||||||
| Deposits not bearing interest |
14,410 | 12,765 | 12,202 | 13% | 18% | |||||||||||||||||
| Deposits from banks and securities sold under repurchase agreements |
52,942 | 43,447 | 49,964 | 22% | 6% | |||||||||||||||||
| Commercial paper |
17,435 | 9,413 | 12,530 | 85% | 39% | |||||||||||||||||
| Total Australia |
408,711 | 369,399 | 372,754 | 11% | 10% | |||||||||||||||||
| Asia, Pacific, Europe & America |
||||||||||||||||||||||
| Certificates of deposit |
1,494 | 2,318 | 3,215 | -36% | -54% | |||||||||||||||||
| Term deposits |
121,141 | 101,586 | 94,396 | 19% | 28% | |||||||||||||||||
| On demand and short term deposits |
24,211 | 20,787 | 19,930 | 16% | 21% | |||||||||||||||||
| Deposits not bearing interest |
7,101 | 4,648 | 5,234 | 53% | 36% | |||||||||||||||||
| Deposits from banks and securities sold under repurchase agreements |
46,397 | 33,891 | 34,705 | 37% | 34% | |||||||||||||||||
| Total Asia, Pacific, Europe & America |
200,344 | 163,230 | 157,480 | 23% | 27% | |||||||||||||||||
| New Zealand |
||||||||||||||||||||||
| Certificates of deposit |
1,651 | 1,375 | 874 | 20% | 89% | |||||||||||||||||
| Term deposits |
50,414 | 50,941 | 50,890 | -1% | -1% | |||||||||||||||||
| On demand and short term deposits |
45,978 | 39,216 | 41,011 | 17% | 12% | |||||||||||||||||
| Deposits not bearing interest |
14,050 | 10,929 | 10,383 | 29% | 35% | |||||||||||||||||
| Deposits from banks and securities sold under repurchase agreements |
1,422 | 188 | 245 | large | large | |||||||||||||||||
| Commercial paper and other borrowings |
4,339 | 2,399 | 2,896 | 81% | 50% | |||||||||||||||||
| Total New Zealand |
117,854 | 105,048 | 106,299 | 12% | 11% | |||||||||||||||||
| Total deposits and other borrowings (including liabilities reclassified as held for sale) |
726,909 | 637,677 | 636,533 | 14% | 14% | |||||||||||||||||
| Deposits and other borrowings held for sale (refer to Note 12) |
- | - | (1,544 | ) | n/a | -100% | ||||||||||||||||
| Total deposits and other borrowings |
726,909 | 637,677 | 634,989 | 14% | 14% | |||||||||||||||||
103
NOTES TO CONDENSED CONSOLIDATED FINANCIAL STATEMENTS
| 11. | Other provisions |
| As at | Movement | |||||||||||||||||||||
| Mar 20 $M |
Sep 19 $M |
Mar 19 $M |
Mar 20 v. Sep 19 |
Mar 20 v. Mar 19 |
||||||||||||||||||
| ECL allowance on undrawn facilities |
910 | 668 | 656 | 36% | 39% | |||||||||||||||||
| Customer remediation |
1,094 | 1,139 | 698 | -4% | 57% | |||||||||||||||||
| Restructuring costs |
128 | 64 | 114 | 100% | 12% | |||||||||||||||||
| Non-lending losses, frauds and forgeries |
82 | 94 | 101 | -13% | -19% | |||||||||||||||||
| Other |
559 | 350 | 174 | 60% | large | |||||||||||||||||
| Total other provisions (including liabilities reclassified as held for sale) |
2,773 | 2,315 | 1,743 | 20% | 59% | |||||||||||||||||
| Less: Other provisions reclassified as held for sale |
- | (91 | ) | (63 | ) | -100% | -100% | |||||||||||||||
| Total other provisions |
2,773 | 2,224 | 1,680 | 25% | 65% | |||||||||||||||||
Customer remediation
Customer remediation includes provisions for expected refunds to customers, remediation project costs and related customer and regulatory claims, penalties and litigation outcomes.
Restructuring costs
Provisions for restructuring costs arise from activities related to material changes in the scope of business undertaken by the Group or the manner in which that business is undertaken and include employee termination benefits. Costs relating to on-going activities are not provided for and are expensed as incurred.
Non-lending losses, frauds and forgeries
Non-lending losses include losses arising from certain legal actions not directly related to amounts of principal outstanding for loans and advances and losses arising from forgeries, frauds and the correction of operational issues. The amounts recognised are the best estimate of the consideration required to settle the present obligation at the reporting date, taking into account the risks and uncertainties that surround the events and circumstances that affect the provision.
Other
Other provisions comprise various other provisions including workers compensation, make-good provisions associated with leased premises, warranties and indemnities provided in connection with various disposals of businesses and assets, and contingent liabilities recognised as part of a business combination.
104
NOTES TO CONDENSED CONSOLIDATED FINANCIAL STATEMENTS
| 12. | Discontinued operations and assets and liabilities held for sale |
| i) | Discontinued operations |
In October 2017, the Group announced it had agreed to sell its OnePath pensions and investments (OnePath P&I) business and Aligned Dealer Groups (ADGs) businesses to IOOF. The sale of the ADG business completed on 1 October 2018 and the sale of OnePath P&I business was completed on 31 January 2020.
In December 2017, the Group announced that it had agreed to the sale of its life insurance business to Zurich Financial Services Australia (Zurich) and the transaction was completed on 31 May 2019.
As a result of the sale transactions outlined above, the financial results of the businesses being divested and associated Group reclassification and consolidation impacts are treated as discontinued operations from a reporting perspective.
Details of the financial performance and cash flows of discontinued operations are shown below.
Income Statement
| Half Year | Movement | |||||||||||||||||||||||
| Mar 20 $M |
Sep 19 $M |
Mar 19 $M |
Mar 20 v. Sep 19 |
Mar 20 v. Mar 19 |
||||||||||||||||||||
| Net interest income |
(5) | (19) | (57) | -74% | -91% | |||||||||||||||||||
| Other operating income |
(109) | 46 | 199 | large | large | |||||||||||||||||||
| Operating income |
(114) | 27 | 142 | large | large | |||||||||||||||||||
| Operating expenses |
(120) | (228) | (221) | -47% | -46% | |||||||||||||||||||
| Profit/(Loss) before credit impairment and income tax |
(234) | (201) | (79) | 16% | large | |||||||||||||||||||
| Credit impairment (charge)/release |
- | - | 1 | n/a | -100% | |||||||||||||||||||
| Profit/(Loss) before income tax |
(234) | (201) | (78) | 16% | large | |||||||||||||||||||
| Income tax (expense)/benefit |
144 | (72) | 8 | large | large | |||||||||||||||||||
| Profit/(Loss) for the period attributable to shareholders of the Company1 |
(90) | (273) | (70) | -67% | 29% | |||||||||||||||||||
| 1. | Includes the results of the OnePathP&I business up to sale completion in January 2020 and the life insurance business up to the sale completion in May 2019. |
Income Statement impact relating to discontinued operations
During the March 2020 half, the Group recognised the following impacts in relation to discontinued operations:
| • | $16 million loss on disposal ($11 million loss after tax) recorded in operating income attributable to sale completion costs. |
| • | $124 million of customer remediation charges ($128 million recorded in operating income and -$4 million recorded in operating expenses) and an associated $30 million tax benefit. |
| • | $101 million charge was recorded in operating income offset by a $101 million tax benefit within income tax expense relating to the finalisation of the policyholder tax position associated with the sale of the life insurance business to Zurich. |
During the September 2019 half, the Group recognised the following impacts in relation to discontinued operations:
| • | $1 million net loss from sale related adjustments and write-downs, partially offset by the recycling of gains previously deferred in equity reserves on sale completion recorded in operating income, and a $64 million income tax expense. |
| • | $166 million of customer remediation charges ($106 million recorded in operating income and $60 million recorded in operating expenses) and an associated $12 million tax benefit. |
During the March 2019 half, the Group recognised the following impacts in relation to discontinued operations:
| • | $75 million of customer remediation charges ($55 million recorded in operating income and $20 million recorded in operating expenses) and an associated $22 million tax benefit. |
Cash Flow Statement
| Half Year | Movement | |||||||||||||||||||||||
| Mar 20 $M |
Sep 19 $M |
Mar 19 $M |
Mar 20 v. Sep 19 |
Mar 20 v. Mar 19 |
||||||||||||||||||||
| Net cash provided by/(used in) operating activities |
(25 | ) | 37 | (589 | ) | large | -96% | |||||||||||||||||
| Net cash provided by/(used in) investing activities |
- | 34 | 803 | -100% | -100% | |||||||||||||||||||
| Net cash provided by/(used in) financing activities |
25 | (71 | ) | (219 | ) | large | large | |||||||||||||||||
| Net increase/(decrease) in cash and cash equivalents |
- | - | (5 | ) | n/a | -100% | ||||||||||||||||||
105
NOTES TO CONDENSED CONSOLIDATED FINANCIAL STATEMENTS
| 12. | Discontinued operations and assets and liabilities held for sale, cont’d |
| ii) | Assets and liabilities held for sale |
At 31 March 2020, there were no assets and liabilities held for sale.
In the prior periods assets and liabilities held for sale included the assets and liabilities associated with the Group’s discontinued operations as well as the assets and liabilities of other assets or disposal groups, subject to sale, which do not meet the criteria to classify as a discontinued operation under the accounting standards. The assets and liabilities held for sale were re-measured at the lower of their carrying amount and fair value less costs to sell, except for assets such as deferred tax assets, financial assets and contractual rights under insurance contracts, which are specifically exempt from this requirement and continue to be recognised at their carrying value upon reclassification to held for sale.
Assets and liabilities held for sale1
| As at 30 September 2019 | As at 31 March 2019 | |||||||||||||||||||||||||
| Discontinued operations $M |
Total $M | Discontinued operations $M |
Cambodia JV $M |
PNG Retail, $M |
Total $M |
|||||||||||||||||||||
| Cash and cash equivalents |
- | - | - | 267 | - | 267 | ||||||||||||||||||||
| Trading securities2 |
919 | 919 | - | - | - | - | ||||||||||||||||||||
| Derivative financial instruments |
- | - | - | 1 | - | 1 | ||||||||||||||||||||
| Investment securities |
- | - | 1,167 | - | - | 1,167 | ||||||||||||||||||||
| Net loans and advances |
- | - | 43 | 700 | 145 | 888 | ||||||||||||||||||||
| Regulatory deposits |
- | - | - | 145 | - | 145 | ||||||||||||||||||||
| Deferred tax assets |
16 | 16 | 97 | 2 | - | 99 | ||||||||||||||||||||
| Goodwill and other intangible assets |
394 | 394 | 1,138 | - | - | 1,138 | ||||||||||||||||||||
| Investments backing policy liabilities2 |
- | - | 39,191 | - | - | 39,191 | ||||||||||||||||||||
| Premises and equipment |
1 | 1 | 2 | 5 | 6 | 13 | ||||||||||||||||||||
| Other assets |
501 | 501 | 590 | 50 | - | 640 | ||||||||||||||||||||
| Total assets held for sale |
1,831 | 1,831 | 42,228 | 1,170 | 151 | 43,549 | ||||||||||||||||||||
| Deposits and other borrowings |
- | - | - | 1,064 | 480 | 1,544 | ||||||||||||||||||||
| Current tax liabilities |
3 | 3 | (192 | ) | 4 | - | (188 | ) | ||||||||||||||||||
| Deferred tax liabilities |
105 | 105 | 338 | 1 | - | 339 | ||||||||||||||||||||
| Policy liabilities |
- | - | 38,787 | - | - | 38,787 | ||||||||||||||||||||
| External unit holder liabilities |
- | - | 4,590 | - | - | 4,590 | ||||||||||||||||||||
| Payables and other liabilities |
1,914 | 1,914 | 1,349 | 53 | - | 1,402 | ||||||||||||||||||||
| Provisions3 |
99 | 99 | 35 | 42 | 4 | 81 | ||||||||||||||||||||
| Total liabilities held for sale |
2,121 | 2,121 | 44,907 | 1,164 | 484 | 46,555 | ||||||||||||||||||||
| 1. | Amounts are shown net of intercompany balances. |
| 2. | The successor fund transfer performed in preparation for the sale of the Group’s wealth business to Zurich and IOOF completed on 13 April 2019. As a result, OnePath P&I assets previously held as Investments backing policy liabilities were shown as Trading securities at 30 September 2019. |
| 3. | Includes employee entitlements of $8 million at September 2019, $18 million at March 2019 and other provisions of $91 million at September 2019, $63 million at March 2019. |
106
NOTES TO CONDENSED CONSOLIDATED FINANCIAL STATEMENTS
| 12. | Discontinued operations and assets and liabilities held for sale, cont’d |
Other strategic divestments not classified as discontinued operations but have been presented as held for sale at 31 March 2019 include:
| • | ANZ Royal Bank (Cambodia) Ltd (Cambodia JV) – Institutional division |
In May 2018, the Group announced it had reached an agreement to sell its 55% stake in Cambodia JV ANZ Royal Bank to J Trust, a Japanese diversified financial holding company listed on the Tokyo Stock Exchange. The transaction was completed on 19 August 2019.
| • | Papua New Guinea Retail, Commercial and Small-Medium Sized Enterprise businesses (PNG Retail, Commercial & SME) – Institutional division |
In June 2018, the Group announced it had entered into an agreement to sell its Retail, Commercial and Small-Medium Sized Enterprise (SME) banking businesses in Papua New Guinea to Kina Bank. The transaction was completed on 23 September 2019.
Income Statement impact relating to assets and liabilities held for sale in continuing operations
During the September 2019 half, the Group recognised the following impacts in relation to assets and liabilities held for sale:
| • | $10 million gain after tax relating to the sale of Cambodia JV, comprising a $30 million release from the foreign currency translation reserve, a $17 million dividend withholding tax associated with the sale completion and $3 million of asset write-offs. |
| • | $7 million provision release relating to the sale completion of OPL NZ. |
| • | $1 million gain after tax relating to the sale of PNG Retail, Commercial and SME, net of costs associated with the sale. |
During the March 2019 half, the Group recognised the following impacts in relation to assets and liabilities held for sale:
| • | $69 million gain after tax relating to the sale of the OPL NZ business, comprising a $56 million gain on sale, a $26 million release from the foreign currency translation reserve and a $13 million income tax expense. |
| • | $37 million gain after tax relating to the sale of the Paymark. |
The impacts on continuing operations are shown in the relevant Income Statement categories.
107
NOTES TO CONDENSED CONSOLIDATED FINANCIAL STATEMENTS
| 13. | Debt issuances |
| Half Year | Movement | |||||||||||||||||||||||
| Mar 20 $M |
Sep 19 $M |
Mar 19 $M |
Mar 20 v. Sep 19 |
Mar 20 v. Mar 19 |
||||||||||||||||||||
| Total unsubordinated debt |
119,136 | 113,105 | 113,424 | 5% | 5% | |||||||||||||||||||
| Additional Tier 1 Capital (perpetual subordinated securities)1 |
||||||||||||||||||||||||
| ANZ Capital Notes (ANZ CN)2 |
||||||||||||||||||||||||
| ANZ CN1 |
1,119 | 1,118 | 1,118 | 0% | 0% | |||||||||||||||||||
| ANZ CN2 |
1,607 | 1,607 | 1,606 | 0% | 0% | |||||||||||||||||||
| ANZ CN3 |
966 | 966 | 965 | 0% | 0% | |||||||||||||||||||
| ANZ CN4 |
1,613 | 1,612 | 1,611 | 0% | 0% | |||||||||||||||||||
| ANZ CN5 |
926 | 925 | 925 | 0% | 0% | |||||||||||||||||||
| ANZ Capital Securities3 |
1,712 | 1,481 | 1,336 | 16% | 28% | |||||||||||||||||||
| ANZ NZ Capital Notes4 |
487 | 462 | 478 | 5% | 2% | |||||||||||||||||||
| Tier 2 Capital |
||||||||||||||||||||||||
| Perpetual subordinated notes5 |
485 | 444 | 423 | 9% | 15% | |||||||||||||||||||
| Term subordinated notes6 |
12,197 | 7,971 | 7,806 | 53% | 56% | |||||||||||||||||||
| Total subordinated debt |
21,112 | 16,586 | 16,268 | 27% | 30% | |||||||||||||||||||
| Total debt issuances |
140,248 | 129,691 | 129,692 | 8% | 8% | |||||||||||||||||||
| 1. | ANZ Capital Notes, ANZ Capital Securities and the ANZ NZ Capital Notes are Basel 3 compliant instruments. |
| 2. | Each of the ANZ Capital Notes will convert into a variable number of ANZ ordinary shares on a specified mandatory conversion date at a 1% discount (subject to certain conditions being satisfied). If ANZ’s Common Equity Tier 1 capital ratio is equal to or less than 5.125%, or ANZ receives a notice of non-viability from APRA, then the notes will immediately convert into ANZ ordinary shares at a 1% discount subject to a maximum conversion number. Subject to certain conditions, the notes are redeemable or convertible to ANZ ordinary shares (on similar terms to mandatory conversion) by ANZ at its discretion on an early redemption or conversion date. |
| Issuer | Issue date | Issue Amount $M |
Early redemption or conversion date | Mandatory conversion date | ||||||||
|
CN1 |
ANZ | 7 Aug 2013 | 1,120 | 1 Sep 2021 | 1 Sep 2023 | |||||||
|
CN2 |
ANZ | 31 Mar 2014 | 1,610 | 24 Mar 2022 | 24 Mar 2024 | |||||||
|
|
CN3 |
ANZ, acting through its New Zealand branch | 5 Mar 2015 | 970 | 24 Mar 2023 | 24 Mar 2025 | ||||||
|
CN4 |
ANZ | 27 Sep 2016 | 1,622 | 20 Mar 2024 | 20 Mar 2026 | |||||||
|
CN5 |
ANZ | 28 Sep 2017 | 931 | 20 Mar 2025 | 20 Mar 2027 | |||||||
| 3. | On 15 June 2016, ANZ acting through its London branch issued fully-paid perpetual subordinated contingent convertible securities (ANZ Capital Securities). If ANZ’s Common Equity Tier 1 capital ratio is equal to or less than 5.125%, or ANZ receives a notice of non-viability from APRA, then the securities will immediately convert into ANZ ordinary shares at a 1% discount subject to a maximum conversion number. Subject to certain conditions, on the First Reset Date (15 June 2026) and each 5 year anniversary, ANZ has the right to redeem all of the securities at its discretion. |
| 4. | On 31 March 2015, ANZ Bank New Zealand Limited (ANZ Bank NZ) issued convertible notes (ANZ NZ Capital Notes) which will convert into ANZ ordinary shares on 25 May 2022 at a 1% discount (subject to certain conditions being satisfied). If ANZ or ANZ Bank NZ’s Common Equity Tier 1 capital ratio is equal to or less than 5.125%, ANZ receives a notice of non-viability from APRA, ANZ Bank NZ receives a direction from RBNZ or a statutory manager is appointed to ANZ Bank NZ and makes a determination, then the notes will immediately convert into ANZ ordinary shares at a 1% discount subject to a maximum conversion number. In April 2020, ANZ Bank NZ announced that the notes will not be redeemed or converted on the optional exchange date (25 May 2020). |
| 5. | The USD 300 million perpetual subordinated notes have been granted Basel 3 transitional capital treatment until the end of the transition period in December 2021. |
| 6. | All the term subordinated notes are convertible and are Basel 3 compliant instruments. If ANZ receives a notice of non-viability from APRA, then the convertible subordinated notes will immediately convert into ANZ ordinary shares at a 1% discount subject to a maximum conversion number. |
108
NOTES TO CONDENSED CONSOLIDATED FINANCIAL STATEMENTS
| 14. | Credit risk |
Maximum exposure to credit risk
For financial assets recognised on the balance sheet, the maximum exposure to credit risk is the carrying amount. In certain circumstances there may be differences between the carrying amounts reported on the balance sheet and the amounts reported in the tables below. Principally, these differences arise in respect of financial assets that are subject to risks other than credit risk, such as equity instruments which are primarily subject to market risk, or bank notes and coins.
For undrawn facilities, this maximum exposure to credit risk is the full amount of the committed facilities. For contingent exposures, the maximum exposure to credit risk is the maximum amount the group would have to pay if the instrument is called upon.
The table below shows the maximum exposure to credit risk of on-balance sheet, and off-balance sheet, positions before taking account of any collateral held or other credit enhancements:
| Reported As at |
Excluded1 As at |
Maximum Exposure to Credit Risk As at |
||||||||||||||||||||||||||||||||||||||
| On-balance sheet positions2 | Mar 20 $M |
Sep 19 $M |
Mar 19 $M |
Mar 20 $M |
Sep 19 $M |
Mar 19 $M |
Mar 20 $M |
Sep 19 $M |
Mar 19 $M |
|||||||||||||||||||||||||||||||
| Net loans and advances |
656,609 | 615,258 | 610,169 | - | - | - | 656,609 | 615,258 | 610,169 | |||||||||||||||||||||||||||||||
| Investment securities |
||||||||||||||||||||||||||||||||||||||||
| - debt securities at amortised cost |
7,231 | 5,999 | 6,176 | - | - | - | 7,231 | 5,999 | 6,176 | |||||||||||||||||||||||||||||||
| - debt securities at FVOCI |
77,476 | 76,489 | 72,555 | - | - | - | 77,476 | 76,489 | 72,555 | |||||||||||||||||||||||||||||||
| - equity securities at FVOCI |
1,166 | 1,221 | 1,318 | 1,166 | 1,221 | 1,318 | - | - | - | |||||||||||||||||||||||||||||||
| - debt securities at FVTPL3 |
50 | - | - | - | - | - | 50 | - | - | |||||||||||||||||||||||||||||||
| Other financial assets |
393,862 | 269,619 | 276,816 | 14,305 | 11,124 | 49,466 | 379,557 | 258,495 | 227,350 | |||||||||||||||||||||||||||||||
| Total on-balance sheet positions | 1,136,394 | 968,586 | 967,034 | 15,471 | 12,345 | 50,784 | 1,120,923 | 956,241 | 916,250 | |||||||||||||||||||||||||||||||
| Off-balance sheet commitments | ||||||||||||||||||||||||||||||||||||||||
| Undrawn and contingent facilities4 |
269,417 | 253,123 | 245,285 | - | - | - | 269,417 | 253,123 | 245,285 | |||||||||||||||||||||||||||||||
| Total | 1,405,811 | 1,221,709 | 1,212,319 | 15,471 | 12,345 | 50,784 | 1,390,340 | 1,209,364 | 1,161,535 | |||||||||||||||||||||||||||||||
| 1. | Excluded comprises bank notes and coins and cash at bank within liquid assets, investments relating to the insurance business where the credit risk is passed onto the policy holder. Equity securities and precious metal exposures recognised as trading securities have been excluded as they do not have credit exposure. Equity securities within investment securities – equity securities at FVOCI/available-for-sale financial assets were also excluded as they do not have credit exposure. |
| 2. | On-balance sheet position includes assets and liabilities reclassified as held for sale. |
| 3. | These facilities are rated as Satisfactory. |
| 4. | Undrawn facilities and contingent facilities includes guarantees, letters of credit and performance related contingencies, net of collectively assessed allowance for expected credit losses. |
Credit Quality
The Group’s internal Customer Credit Rating (CCR) is used to manage the credit quality of financial assets. To enable wider comparisons, the Group’s CCRs are mapped to external rating agency scales as follows:
| Credit Quality Description |
Internal CCR | ANZ Customer Requirement | Moody’s Rating |
Standard & Poor’s Rating | ||||
| Strong |
CCR 0+ to 4- | Demonstrated superior stability in their operating and financial performance over the long-term, and whose earnings capacity is not significantly vulnerable to foreseeable events. | Aaa – Baa3 | AAA – BBB- | ||||
| Satisfactory |
CCR 5+ to 6- | Demonstrated sound operational and financial stability over the medium to long term even though some may be susceptible to cyclical trends or variability in earnings. | Ba1 – B1 | BB+ – B+ | ||||
| Weak |
CCR 7+ to 8= | Demonstrated some operational and financial instability, with variability and uncertainty in profitability and liquidity projected to continue over the short and possibly medium term. | B2 - Caa | B - CCC | ||||
| Defaulted |
CCR8- to 10 | When doubt arises as to the collectability of a credit facility, the financial instrument (or ‘the facility’) is classified as defaulted. | N/A | N/A | ||||
109
NOTES TO CONDENSED CONSOLIDATED FINANCIAL STATEMENTS
| 14. | Credit risk, cont’d |
Net loans and advances
| As at Mar 20 | ||||||||||||||||||||
| Stage 3 | ||||||||||||||||||||
| Stage 1 $M |
Stage 2 $M |
Collectively assessed $M |
Individually assessed $M |
Total $M |
||||||||||||||||
| Strong |
465,601 | 14,009 | - | - | 479,610 | |||||||||||||||
| Satisfactory |
114,178 | 39,137 | - | - | 153,315 | |||||||||||||||
| Weak |
5,959 | 11,692 | - | - | 17,651 | |||||||||||||||
| Defaulted |
- | - | 4,837 | 2,435 | 7,272 | |||||||||||||||
| Gross loans and advances at amortised cost |
585,738 | 64,838 | 4,837 | 2,435 | 657,848 | |||||||||||||||
| Allowance for ECL |
1,191 | 1,968 | 455 | 1,055 | 4,669 | |||||||||||||||
| Net loans and advances at amortised cost |
584,547 | 62,870 | 4,382 | 1,380 | 653,179 | |||||||||||||||
| Coverage ratio |
0.20% | 3.04% | 9.41% | 43.33% | 0.71% | |||||||||||||||
| Loans and advances at fair value through profit or loss |
2,932 | |||||||||||||||||||
| Unearned income |
(368 | ) | ||||||||||||||||||
| Capitalised brokerage/mortgage origination fees |
866 | |||||||||||||||||||
| Net carrying amount |
656,609 | |||||||||||||||||||
| As at Sep 19 | ||||||||||||||||||||
| Stage 3 | ||||||||||||||||||||
| Stage 1 $M |
Stage 2 $M |
Collectively assessed $M |
Individually assessed $M |
Total $M |
||||||||||||||||
| Strong |
425,113 | 18,597 | - | - | 443,710 | |||||||||||||||
| Satisfactory |
121,030 | 28,445 | - | - | 149,475 | |||||||||||||||
| Weak |
7,138 | 10,373 | - | - | 17,511 | |||||||||||||||
| Defaulted |
- | - | 4,699 | 1,978 | 6,677 | |||||||||||||||
| Gross loans and advances at amortised cost |
553,281 | 57,415 | 4,699 | 1,978 | 617,373 | |||||||||||||||
| Allowance for ECL |
927 | 1,378 | 413 | 791 | 3,509 | |||||||||||||||
| Net loans and advances at amortised cost |
552,354 | 56,037 | 4,286 | 1,187 | 613,864 | |||||||||||||||
| Coverage ratio |
0.17% | 2.40% | 8.79% | 39.99% | 0.57% | |||||||||||||||
| Loans and advances at fair value through profit or loss |
922 | |||||||||||||||||||
| Unearned income |
(398 | ) | ||||||||||||||||||
| Capitalised brokerage/mortgage origination fees |
870 | |||||||||||||||||||
| Net carrying amount |
615,258 | |||||||||||||||||||
| As at Mar 19 | ||||||||||||||||||||
| Stage 3 | ||||||||||||||||||||
| Stage 1 $M |
Stage 2 $M |
Collectively assessed $M |
Individually assessed $M |
Total $M |
||||||||||||||||
| Strong |
444,556 | 10,273 | - | - | 454,829 | |||||||||||||||
| Satisfactory |
112,984 | 19,843 | - | - | 132,827 | |||||||||||||||
| Weak |
8,808 | 9,775 | - | - | 18,583 | |||||||||||||||
| Defaulted |
- | - | 4,078 | 1,961 | 6,039 | |||||||||||||||
| Gross loans and advances at amortised cost |
566,348 | 39,891 | 4,078 | 1,961 | 612,278 | |||||||||||||||
| Allowance for ECL |
940 | 1,415 | 381 | 865 | 3,601 | |||||||||||||||
| Net loans and advances at amortised cost |
565,408 | 38,476 | 3,697 | 1,096 | 608,677 | |||||||||||||||
| Coverage ratio |
0.17% | 3.55% | 9.34% | 44.11% | 0.59% | |||||||||||||||
| Loans and advances at fair value through profit or loss |
991 | |||||||||||||||||||
| Unearned income |
(446 | ) | ||||||||||||||||||
| Capitalised brokerage/mortgage origination fees |
947 | |||||||||||||||||||
| Net carrying amount |
610,169 | |||||||||||||||||||
110
NOTES TO CONDENSED CONSOLIDATED FINANCIAL STATEMENTS
| 14. | Credit risk, cont’d |
Investment securities - debt securities at amortised cost
| As at Mar 20 | ||||||||||||||||||||
| Stage 3 | ||||||||||||||||||||
| Stage 1 $M |
Stage 2 $M |
Collectively $M |
Individually assessed $M |
Total $M |
||||||||||||||||
| Strong |
5,733 | - | - | - | 5,733 | |||||||||||||||
| Satisfactory |
888 | 625 | - | - | 1,513 | |||||||||||||||
| Weak |
- | - | - | - | - | |||||||||||||||
| Defaulted |
- | - | - | - | - | |||||||||||||||
| Gross investment securities - debt securities at amortised cost |
6,621 | 625 | - | - | 7,246 | |||||||||||||||
| Allowance for ECL |
14 | 1 | - | - | 15 | |||||||||||||||
| Net investment securities - debt securities at amortised cost |
6,607 | 624 | - | - | 7,231 | |||||||||||||||
| Coverage ratio |
0.21% | 0.16% | - | - | 0.21% | |||||||||||||||
| As at Sep 19 | ||||||||||||||||||||
| Stage 3 | ||||||||||||||||||||
| Stage 1 $M |
Stage 2 $M |
Collectively assessed $M |
Individually assessed $M |
Total $M |
||||||||||||||||
| Strong |
4,798 | - | - | - | 4,798 | |||||||||||||||
| Satisfactory |
707 | 507 | - | - | 1,214 | |||||||||||||||
| Weak |
- | - | - | - | - | |||||||||||||||
| Defaulted |
- | - | - | - | - | |||||||||||||||
| Gross investment securities - debt securities at amortised cost |
5,505 | 507 | - | - | 6,012 | |||||||||||||||
| Allowance for ECL |
12 | 1 | - | - | 13 | |||||||||||||||
| Net investment securities - debt securities at amortised cost |
5,493 | 506 | - | - | 5,999 | |||||||||||||||
| Coverage ratio |
0.22% | 0.20% | - | - | 0.22% | |||||||||||||||
| As at Mar 19 | ||||||||||||||||||||
| Stage 3 | ||||||||||||||||||||
| Stage 1 $M |
Stage 2 $M |
Collectively assessed $M |
Individually assessed $M |
Total $M |
||||||||||||||||
| Strong |
4,751 | - | - | - | 4,751 | |||||||||||||||
| Satisfactory |
666 | 771 | - | - | 1,437 | |||||||||||||||
| Weak |
- | - | - | - | - | |||||||||||||||
| Defaulted |
- | - | - | - | - | |||||||||||||||
| Gross investment securities - debt securities at amortised cost |
5,417 | 771 | - | - | 6,188 | |||||||||||||||
| Provision for credit impairment |
11 | 1 | - | - | 12 | |||||||||||||||
| Net investment securities - debt securities at amortised cost |
5,406 | 770 | - | - | 6,176 | |||||||||||||||
| Coverage ratio |
0.20% | 0.13% | - | - | 0.19% | |||||||||||||||
111
NOTES TO CONDENSED CONSOLIDATED FINANCIAL STATEMENTS
| 14. | Credit risk, cont’d |
Investment securities - debt securities at FVOCI
| As at Mar 20 | ||||||||||||||||||||
| Stage 3 | ||||||||||||||||||||
| Collectively | Individually | |||||||||||||||||||
| Stage 1 | Stage 2 | assessed | assessed | Total | ||||||||||||||||
| $M | $M | $M | $M | $M | ||||||||||||||||
| Strong |
77,213 | - | - | - | 77,213 | |||||||||||||||
| Satisfactory |
263 | - | - | - | 263 | |||||||||||||||
| Weak |
- | - | - | - | - | |||||||||||||||
| Defaulted |
- | - | - | - | - | |||||||||||||||
| Investment securities - debt securities at FVOCI |
77,476 | - | - | - | 77,476 | |||||||||||||||
| Allowances for ECL recognised in other comprehensive income |
9 | - | - | - | 9 | |||||||||||||||
| Coverage ratio |
0.01% | - | - | - | 0.01% | |||||||||||||||
| As at Sep 19 | ||||||||||||||||||||
| Stage 3 | ||||||||||||||||||||
| Collectively | Individually | |||||||||||||||||||
| Stage 1 | Stage 2 | assessed | assessed | Total | ||||||||||||||||
| $M | $M | $M | $M | $M | ||||||||||||||||
| Strong |
76,218 | - | - | - | 76,218 | |||||||||||||||
| Satisfactory |
271 | - | - | - | 271 | |||||||||||||||
| Weak |
- | - | - | - | - | |||||||||||||||
| Defaulted |
- | - | - | - | - | |||||||||||||||
| Investment securities - debt securities at FVOCI |
76,489 | - | - | - | 76,489 | |||||||||||||||
| Allowances for ECL recognised in other comprehensive income |
8 | - | - | - | 8 | |||||||||||||||
| Coverage ratio |
0.01% | - | - | - | 0.01% | |||||||||||||||
| As at Mar 19 | ||||||||||||||||||||
| Stage 3 | ||||||||||||||||||||
| Collectively | Individually | |||||||||||||||||||
| Stage 1 | Stage 2 | assessed | assessed | Total | ||||||||||||||||
| $M | $M | $M | $M | $M | ||||||||||||||||
| Strong |
72,401 | - | - | - | 72,401 | |||||||||||||||
| Satisfactory |
154 | - | - | - | 154 | |||||||||||||||
| Weak |
- | - | - | - | - | |||||||||||||||
| Defaulted |
- | - | - | - | - | |||||||||||||||
| Investment securities - debt securities at FVOCI |
72,555 | - | - | - | 72,555 | |||||||||||||||
| Allowances for ECL recognised in other comprehensive income |
11 | - | - | - | 11 | |||||||||||||||
| Coverage ratio |
0.02% | - | - | - | 0.02% | |||||||||||||||
Other financial assets
| As at Mar 20 | As at Sep 19 | As at Mar 19 | ||||||||||
| Total | Total | Total | ||||||||||
| $M | $M | $M | ||||||||||
| Strong |
369,909 | 248,020 | 215,307 | |||||||||
| Satisfactory |
9,033 | 10,060 | 11,596 | |||||||||
| Weak |
615 | 415 | 447 | |||||||||
| Defaulted |
- | - | - | |||||||||
| Total carrying amount |
379,557 | 258,495 | 227,350 | |||||||||
112
NOTES TO CONDENSED CONSOLIDATED FINANCIAL STATEMENTS
| 14. | Credit risk, cont’d |
Off-balance sheet commitments - undrawn and contingent facilities
| As at Mar 20 | ||||||||||||||||||||
| Stage 3 | ||||||||||||||||||||
| Collectively | Individually | |||||||||||||||||||
| Stage 1 | Stage 2 | assessed | assessed | Total | ||||||||||||||||
| $M | $M | $M | $M | $M | ||||||||||||||||
| Strong |
172,684 | 1,617 | - | - | 174,301 | |||||||||||||||
| Satisfactory |
24,433 | 4,832 | - | - | 29,265 | |||||||||||||||
| Weak |
284 | 1,156 | - | - | 1,440 | |||||||||||||||
| Defaulted |
- | - | 149 | 164 | 313 | |||||||||||||||
| Gross undrawn and contingent facilities subject to ECL |
197,401 | 7,605 | 149 | 164 | 205,319 | |||||||||||||||
| Allowance for ECL included in Provisions |
610 | 244 | 18 | 38 | 910 | |||||||||||||||
| Net undrawn and contingent facilities subject to ECL |
196,791 | 7,361 | 131 | 126 | 204,409 | |||||||||||||||
| Coverage ratio |
0.31% | 3.21% | 12.08% | 23.17% | 0.44% | |||||||||||||||
| Undrawn and contingent facilities not subject to ECL1 |
65,008 | |||||||||||||||||||
| Net undrawn and contingent facilities |
269,417 | |||||||||||||||||||
| As at Sep 19 | ||||||||||||||||||||
| Stage 3 | ||||||||||||||||||||
| Collectively | Individually | |||||||||||||||||||
| Stage 1 | Stage 2 | assessed | assessed | Total | ||||||||||||||||
| $M | $M | $M | $M | $M | ||||||||||||||||
| Strong |
162,891 | 1,972 | - | - | 164,863 | |||||||||||||||
| Satisfactory |
23,655 | 3,634 | - | - | 27,289 | |||||||||||||||
| Weak |
294 | 976 | - | - | 1,270 | |||||||||||||||
| Defaulted |
- | - | 140 | 51 | 191 | |||||||||||||||
| Gross undrawn and contingent facilities subject to ECL |
186,840 | 6,582 | 140 | 51 | 193,613 | |||||||||||||||
| Allowance for ECL included in Provisions |
473 | 151 | 21 | 23 | 668 | |||||||||||||||
| Net undrawn and contingent facilities subject to ECL |
186,367 | 6,431 | 119 | 28 | 192,945 | |||||||||||||||
| Coverage ratio |
0.25% | 2.29% | 15.00% | 45.10% | 0.35% | |||||||||||||||
| Undrawn and contingent facilities not subject to ECL1 |
60,178 | |||||||||||||||||||
| Net undrawn and contingent facilities |
253,123 | |||||||||||||||||||
| As at Mar 19 | ||||||||||||||||||||
| Stage 3 | ||||||||||||||||||||
| Collectively | Individually | |||||||||||||||||||
| Stage 1 | Stage 2 | assessed | assessed | Total | ||||||||||||||||
| $M | $M | $M | $M | $M | ||||||||||||||||
| Strong |
158,599 | 1,977 | - | - | 160,576 | |||||||||||||||
| Satisfactory |
23,519 | 3,894 | - | - | 27,413 | |||||||||||||||
| Weak |
395 | 957 | - | - | 1,352 | |||||||||||||||
| Defaulted |
- | - | 96 | 61 | 157 | |||||||||||||||
| Gross undrawn and contingent facilities subject to ECL |
182,513 | 6,828 | 96 | 61 | 189,498 | |||||||||||||||
| Allowance for ECL included in Provisions |
464 | 152 | 14 | 26 | 656 | |||||||||||||||
| Net undrawn and contingent facilities subject to ECL |
182,049 | 6,676 | 82 | 35 | 188,842 | |||||||||||||||
| Coverage ratio |
0.25% | 2.23% | 14.58% | 42.62% | 0.35% | |||||||||||||||
| Undrawn and contingent facilities not subject to ECL1 |
56,443 | |||||||||||||||||||
| Net undrawn and contingent facilities |
245,285 | |||||||||||||||||||
| 1. | Commitments that can be unconditionally cancelled at any time without notice. |
113
NOTES TO CONDENSED CONSOLIDATED FINANCIAL STATEMENTS
| 15. | Fair value measurement |
The Group carries a significant number of financial instruments on the balance sheet at fair value. In addition, in the prior period, the Group also held assets classified as held for sale which were measured at fair value less costs to sell. The fair value is the best estimate of the price that would be received to sell an asset, or paid to transfer a liability, in an orderly transaction between market participants at the measurement date.
| i) | Assets and liabilities measured at fair value on the balance sheet |
| a) | Valuation |
The Group has an established control framework, including appropriate segregation of duties, to ensure that fair values are accurately determined, reported and controlled. The framework includes the following features:
| • | products are approved for transacting with external customers and counterparties only where fair values can be appropriately determined; |
| • | when using quoted prices to value an instrument, these are independently verified from external pricing providers; |
| • | fair value methodologies and inputs are evaluated and approved by a function independent of the party that undertakes the transaction; |
| • | movements in fair values are independently monitored and explained by reference to underlying factors relevant to the fair value; and |
| • | valuation adjustments (such as funding valuation adjustments, credit valuation adjustments and bid-offer adjustments) are independently validated and monitored. |
If the Group holds offsetting risk positions, then the Group uses the portfolio exception in AASB 13 Fair Value Measurement (AASB 13) to measure the fair value of such groups of financial assets and financial liabilities. We measure the portfolio based on the price that would be received to sell a net long position (an asset) for a particular risk exposure, or to transfer a net short position (a liability) for a particular risk exposure.
b) Fair value approach and valuation techniques
We use valuation techniques to estimate the fair value of assets and liabilities for recognition, measurement and disclosure purposes where no quoted price in an active market for that asset or liability exists. This includes the following:
| Asset or Liability | Fair Value Approach | |
| Financial instruments classified as: - trading securities - securities sold short - derivative financial assets and liabilities - investment securities - other assets |
Valuation techniques are used that incorporate observable market inputs for securities with similar credit risk, maturity and yield characteristics. Equity instruments that are not traded in active markets may be measured using comparable company valuation multiples. | |
| Financial instruments classified as: - net loans and advances - deposits and other borrowings - debt issuances |
Discounted cash flow techniques are used whereby contractual future cash flows of the instrument are discounted using discount rates incorporating wholesale market interest rates, or market borrowing rates for debt with similar maturities or with a yield curve appropriate for the remaining term to maturity. | |
| Assets and liabilities held for sale |
Valuation based on the agreed sale price before transaction costs. |
Details of significant unobservable inputs used in measuring fair values are described in (ii)(a).
| c) | Fair value hierarchy categorisation |
The Group categorises financial assets and liabilities carried at fair value into a fair value hierarchy as required by AASB 13 based on the observability of inputs used to measure the fair value:
| • | Level 1 - valuations based on quoted prices (unadjusted) in active markets for identical assets or liabilities; |
| • | Level 2 - valuations using inputs other than quoted prices included within Level 1 that are observable for a similar asset or liability, either directly or indirectly; and |
| • | Level 3 - valuations where significant unobservable inputs are used to measure the fair value of the asset or liability. |
| d) | Fair value hierarchy disclosure |
The following table presents assets and liabilities carried at fair value:
114
NOTES TO CONDENSED CONSOLIDATED FINANCIAL STATEMENTS
| 15. | Fair value measurement, cont’d |
| Fair value measurements | ||||||||||||||||||||||||||||
| As at March 2020 |
Level 1 $M |
Level 2 $M |
Level 3 $M |
Total $M |
||||||||||||||||||||||||
| Assets |
||||||||||||||||||||||||||||
| Trading securities1 |
39,000 | 10,068 | - | 49,068 | ||||||||||||||||||||||||
| Derivative financial instruments |
1,565 | 172,039 | 73 | 173,677 | ||||||||||||||||||||||||
| Investment securities |
76,932 | 550 | 1,210 | 78,692 | ||||||||||||||||||||||||
| Net loans and advances (measured at fair value)2 |
- | 2,919 | 13 | 2,932 | ||||||||||||||||||||||||
| Assets held for sale |
- | - | - | - | ||||||||||||||||||||||||
| Total |
117,497 | 185,576 | 1,296 | 304,369 | ||||||||||||||||||||||||
| Liabilities |
||||||||||||||||||||||||||||
| Deposits and other borrowings (designated at fair value) |
- | 5,461 | - | 5,461 | ||||||||||||||||||||||||
| Derivative financial instruments |
1,778 | 165,519 | 67 | 167,364 | ||||||||||||||||||||||||
| Liabilities held for sale |
- | - | - | - | ||||||||||||||||||||||||
| Payables and other liabilities3 |
4,113 | 21 | - | 4,134 | ||||||||||||||||||||||||
| Debt issuances (designated at fair value) |
- | 2,681 | - | 2,681 | ||||||||||||||||||||||||
| Total |
5,891 | 173,682 | 67 | 179,640 | ||||||||||||||||||||||||
| As at September 2019 |
||||||||||||||||||||||||||||
| Assets |
||||||||||||||||||||||||||||
| Trading securities |
37,768 | 5,401 | - | 43,169 | ||||||||||||||||||||||||
| Derivative financial instruments |
365 | 120,241 | 61 | 120,667 | ||||||||||||||||||||||||
| Investment securities |
76,000 | 499 | 1,211 | 77,710 | ||||||||||||||||||||||||
| Net loans and advances (measured at fair value) |
- | 922 | - | 922 | ||||||||||||||||||||||||
| Assets held for sale4 |
- | 1,952 | - | 1,952 | ||||||||||||||||||||||||
| Total |
114,133 | 129,015 | 1,272 | 244,420 | ||||||||||||||||||||||||
| Liabilities |
||||||||||||||||||||||||||||
| Deposits and other borrowings (designated at fair value) |
- | 2,301 | - | 2,301 | ||||||||||||||||||||||||
| Derivative financial instruments |
881 | 120,018 | 52 | 120,951 | ||||||||||||||||||||||||
| Liabilities held for sale4 |
- | 2,121 | - | 2,121 | ||||||||||||||||||||||||
| Payables and other liabilities3 |
2,553 | 38 | - | 2,591 | ||||||||||||||||||||||||
| Debt issuances (designated at fair value) |
- | 2,589 | - | 2,589 | ||||||||||||||||||||||||
| Total |
3,434 | 127,067 | 52 | 130,553 | ||||||||||||||||||||||||
| As at March 2019 |
||||||||||||||||||||||||||||
| Assets |
||||||||||||||||||||||||||||
| Trading securities |
35,967 | 6,890 | - | 42,857 | ||||||||||||||||||||||||
| Derivative financial instruments |
331 | 78,991 | 53 | 79,375 | ||||||||||||||||||||||||
|
Available-for-sale assets |
71,001 | 393 | 1,312 | 72,706 | ||||||||||||||||||||||||
| Net loans and advances (measured at fair value) |
- | 991 | - | 991 | ||||||||||||||||||||||||
| Assets held for sale4 |
- | 43,673 | - | 43,673 | ||||||||||||||||||||||||
| Total |
107,299 | 130,938 | 1,365 | 239,602 | ||||||||||||||||||||||||
| Liabilities |
||||||||||||||||||||||||||||
| Deposits and other borrowings (designated at fair value) |
- | 2,169 | - | 2,169 | ||||||||||||||||||||||||
| Derivative financial instruments |
508 | 80,320 | 43 | 80,871 | ||||||||||||||||||||||||
| Liabilities held for sale4 |
- | 46,538 | - | 46,538 | ||||||||||||||||||||||||
| Payables and other liabilities3 |
2,125 | 42 | - | 2,167 | ||||||||||||||||||||||||
| Debt issuances (designated at fair value) |
- | 2,414 | - | 2,414 | ||||||||||||||||||||||||
| Total |
2,633 | 131,483 | 43 | 134,159 | ||||||||||||||||||||||||
| 1. | Transfers from Level 1 to Level 2 and Level 2 to Level 1 for March 2020 half and previous periods are immaterial. Transfers into and out of levels are measured at the beginning of the reporting period in which the transfer occurred. |
| 2. | During the March 2020 half the Group changed its accounting treatment for certain gold loan products which are now designated as at fair value through profit and loss. |
| 3. | Payables and other liabilities relates to securities sold short which are classified as held for trading are measured at fair value through profit or loss. |
| 4. | The amounts reclassified as assets and liabilities held for sale relate to assets and liabilities measured at fair value less costs to sell in accordance with AASB 5 Non-current Assets Held for Sale and Discontinued Operations. The amounts presented reflect fair value excluding cost to sell but including intercompany eliminations. |
115
NOTES TO CONDENSED CONSOLIDATED FINANCIAL STATEMENTS
| 15. | Fair value measurement, cont’d |
| ii) | Details of fair value measurements that incorporate unobservable market data |
| a) | Level 3 fair value measurements |
The net balance of Level 3 financial instruments is an asset of $1,229 million (Sep 19: $1,220 million; Mar 19: $1,322 million). The assets and liabilities which incorporate significant unobservable inputs primarily include:
| • | equities for which there is no active market or traded prices cannot be observed; |
| • | structured credit products for which credit spreads and default probabilities relating to the reference assets and derivative counterparties cannot be observed; and |
| • | other derivatives referencing market rates that cannot be observed primarily due to lack of market activity. |
Movements in the Level 3 balance are due to the revaluation of the Group’s investment in Bank of Tianjin.
There were no material transfers into or out of Level 3 during the period.
Bank of Tianjin (BoT)
The investment is valued based on comparative price-to-book (P/B) multiples (a P/B multiple is the ratio of the market value of equity to the book value of equity). The extent of judgment applied in determining the appropriate multiple and comparator group from which the multiple is derived are non-observable inputs which have resulted in the Level 3 classification.
| b) | Sensitivity to Level 3 data inputs |
When we make assumptions due to significant inputs not being directly observable in the market place (Level 3 inputs), then changing these assumptions changes the Group’s estimate of the instrument’s fair value. Favourable and unfavourable changes are determined by changing the primary unobservable parameter used in deriving the valuation.
Bank of Tianjin (BoT)
The valuation of the BoT investment is sensitive to the selected unobservable input, being the P/B multiple. If the P/B multiple was increased or decreased by 10% it would result in a $105 million increase or decrease to the fair value of the investment (Sep 19: $111 million; Mar 19: $121million), which would be recognised in shareholders’ equity.
Other
The remaining Level 3 balance is immaterial and changes in the Level 3 inputs have a minimal impact on net profit and net assets of the Group.
| c) | Deferred fair value gains and losses |
When fair values are determined using unobservable inputs significant to the fair value of a financial instrument, the Group does not immediately recognise the difference between the transaction price and the amount we determine based on the valuation technique (referred to as the day one gain or loss) in profit or loss. After initial recognition, we recognise the deferred amount in profit or loss over the life of the transaction on a straight line basis or until all inputs become observable.
The day one gains and losses deferred are immaterial.
116
NOTES TO CONDENSED CONSOLIDATED FINANCIAL STATEMENTS
| 15. | Fair value measurement, cont’d |
| iii) | Financial assets and liabilities not measured at fair value |
The classes of financial assets and liabilities listed in the table below are predominately carried at amortised cost on the Group’s balance sheet. Whilst this is the value at which we expect the assets will be realised and the liabilities settled, the Group provides an estimate of the fair value of these financial assets and liabilities at balance date in the table below, presenting the fair value of the entire class of financial assets and financial liabilities.
| Carrying amount in the balance sheet | Fair Value | |||||||||||||||
| As at March 2020 | At amortised cost $M |
At fair value $M |
Total $M |
$M | ||||||||||||
| Financial assets |
||||||||||||||||
| Net loans and advances1 |
653,677 | 2,932 | 656,609 | 658,091 | ||||||||||||
| Investment securities |
7,231 | 78,692 | 85,923 | 85,944 | ||||||||||||
| Total |
660,908 | 81,624 | 742,532 | 744,035 | ||||||||||||
| Financial liabilities |
||||||||||||||||
| Deposits and other borrowings |
721,448 | 5,461 | 726,909 | 727,326 | ||||||||||||
| Debt issuances |
137,567 | 2,681 | 140,248 | 138,454 | ||||||||||||
| Total |
859,015 | 8,142 | 867,157 | 865,780 | ||||||||||||
| As at September 2019 |
||||||||||||||||
| Financial assets |
||||||||||||||||
| Net loans and advances |
614,336 | 922 | 615,258 | 616,255 | ||||||||||||
| Investment securities |
5,999 | 77,710 | 83,709 | 83,707 | ||||||||||||
| Total |
620,335 | 78,632 | 698,967 | 699,962 | ||||||||||||
| Financial liabilities |
||||||||||||||||
| Deposits and other borrowings2 |
635,376 | 2,301 | 637,677 | 637,961 | ||||||||||||
| Debt issuances |
127,102 | 2,589 | 129,691 | 131,377 | ||||||||||||
| Total |
762,478 | 4,890 | 767,368 | 769,338 | ||||||||||||
| As at March 2019 |
||||||||||||||||
| Financial assets |
||||||||||||||||
| Net loans and advances2 |
608,264 | 1,879 | 610,143 | 610,983 | ||||||||||||
| Investment securities2 |
6,176 | 73,873 | 80,049 | 80,044 | ||||||||||||
| Total |
614,440 | 75,752 | 690,192 | 691,027 | ||||||||||||
| Financial liabilities |
||||||||||||||||
| Deposits and other borrowings2 |
632,820 | 3,713 | 636,533 | 637,009 | ||||||||||||
| Debt issuances |
127,278 | 2,414 | 129,692 | 130,558 | ||||||||||||
| Total |
760,098 | 6,127 | 766,225 | 767,567 | ||||||||||||
| 1. | During the March 2020 half the Group changed its accounting treatment for certain gold loan products which are now designated as at fair value through profit and loss. |
| 2. | Net loans and advances, investment securities and deposits and other borrowings include amounts reclassified to assets and liabilities held for sale. Refer to Note 12. |
117
NOTES TO CONDENSED CONSOLIDATED FINANCIAL STATEMENTS
| 16. | Shareholders’ equity |
| Issued and quoted securities | Half Year | |||||||||||
| Ordinary shares |
|
Mar 20 No. |
|
|
Sep 19 No. |
|
|
Mar 19 No. |
| |||
| Opening balance |
2,834,584,923 | 2,833,175,579 | 2,873,618,118 | |||||||||
| Group Share Buy-back |
- | - | (42,032,991 | ) | ||||||||
| Bonus Option Plan |
1,592,499 | 1,409,344 | 1,590,452 | |||||||||
| Dividend reinvestment plan issues:1 |
- | - | - | |||||||||
| Closing balance |
2,836,177,422 | 2,834,584,923 | 2,833,175,579 | |||||||||
| Less treasury shares: |
||||||||||||
| Treasury Shares |
(5,011,537 | ) | (4,474,997 | ) | (4,640,745 | ) | ||||||
| Treasury Shares in Wealth Australia discontinued operations |
- | - | (15,527,220 | ) | ||||||||
| Closing Balance |
2,831,165,885 | 2,830,109,926 | 2,813,007,614 | |||||||||
| Issued/(Repurchased) during the period |
|
1,592,499 |
|
1,409,344 | (40,442,539 | ) | ||||||
| 1. | The DRP in respect to the 2019 final dividend was satisfied in full through the on-market purchase and transfer of 7,401,161 shares at $25.03 to participating shareholders. (2019 Interim dividend; 8,403,922 shares at $27.79, 2018 final dividend; 7,635,365 shares at $26.03). |
| Half Year | Movement | |||||||||||||||||||
| Shareholders’ equity | Mar 20 $M |
Sep 19 $M |
Mar 19 $M |
Mar 20 v. Sep 19 |
Mar 20 v. Mar 19 |
|||||||||||||||
| Ordinary share capital |
26,440 | 26,490 | 26,048 | 0% | 2% | |||||||||||||||
| Reserves |
||||||||||||||||||||
| Foreign currency translation reserve |
1,988 | 705 | 846 | large | large | |||||||||||||||
| Share option reserve |
62 | 89 | 71 | -30% | -13% | |||||||||||||||
| FVOCI reserve |
(51 | ) | 126 | 370 | large | large | ||||||||||||||
| Cash flow hedge reserve |
874 | 731 | 444 | 20% | 97% | |||||||||||||||
| Transactions with non-controlling interests reserve |
(22 | ) | (22 | ) | (22 | ) | 0% | 0% | ||||||||||||
| Total reserves |
2,851 | 1,629 | 1,709 | 75% | 67% | |||||||||||||||
| Retained earnings |
32,073 | 32,664 | 32,064 | -2% | 0% | |||||||||||||||
| Share capital and reserves attributable to shareholders of the Company |
61,364 | 60,783 | 59,821 | 1% | 3% | |||||||||||||||
| Non-controlling interests |
11 | 11 | 150 | 0% | -93% | |||||||||||||||
| Total shareholders’ equity |
61,375 | 60,794 | 59,971 | 1% | 2% | |||||||||||||||
| 17. | Changes in composition of the Group |
On 31 January 2020, the Group completed the sale of the OnePath P&I business which included the material entities OnePath Funds Management Limited and OnePath Custodians Pty Limited. The holding company of these subsidiaries, ANZ Wealth Australia Limited, is no longer considered to be a material subsidiary.
118
NOTES TO CONDENSED CONSOLIDATED FINANCIAL STATEMENTS
| 18. | Investments in Associates1 |
| Half Year | Movement | |||||||||||||||||||
| Mar 20 $M |
Sep 19 $M |
Mar 19 $M |
Mar 20 v. Sep 19 |
Mar 20 v. Mar 19 |
||||||||||||||||
| Share of associates’ profit |
135 | 131 | 131 | 3% | 3% | |||||||||||||||
| Contributions to profit2 | Contribution to Group profit after tax |
Ownership interest held by Group |
||||||||||||||||||||||||
| Associates | Half Year | As at | ||||||||||||||||||||||||
| Mar 20 $M |
Sep 19 $M |
Mar 19 $M |
Mar 20 % |
Sep 19 % |
Mar 19 % |
|||||||||||||||||||||
| P.T. Bank Pan Indonesia |
74 | 63 | 70 | 39 | 39 | 39 | ||||||||||||||||||||
| AMMB Holdings Berhad |
61 | 70 | 56 | 24 | 24 | 24 | ||||||||||||||||||||
| Other associates |
- | (2 | ) | 5 | n/a | n/a | n/a | |||||||||||||||||||
| Share of associates’ profit |
135 | 131 | 131 | |||||||||||||||||||||||
| 1. | At 31 March 2020, the Group recorded an impairment charge of $815 million in other operating income the half year with AmBank impaired by $595 million and PT Panin impaired by $220 million. Refer to Note 1 of the Condensed Consolidated Financial Statements for more information on the key assumptions used in the value in use (VIU) calculations to arrive at the impairment charges. Post the impairment charge, the carrying value of AmBank was $1,161 million and PT Panin was $1,130 million. |
| 2. | Contributions to profit reflect the IFRS equivalent results adjusted to align with the Group’s financial year end which may differ from the published results of these entities. Excludes gains or losses on disposal or valuation adjustments. |
| 19. Related | party disclosure |
There have been no transactions with related parties that are significant to understanding the changes in financial position and performance of the Group since 30 September 2019.
| 20. Contingent | liabilities and contingent assets |
There are outstanding court proceedings, claims and possible claims for and against the Group. Where relevant, expert legal advice has been obtained and, in the light of such advice, provisions (refer to Note 11) and/or disclosures as deemed appropriate have been made. In some instances we have not disclosed the estimated financial impact of the individual items either because it is not practicable to do so or because such disclosure may prejudice the interests of the Group.
Refer to Note 33 of the 2019 ANZ Annual Financial Report for a description of contingent liabilities and contingent assets as at 30 September 2019. A summary of some of those contingent liabilities, and new contingent liabilities that have arisen in the current reporting period, is set out below.
| • | Regulatory and customer exposures |
In recent years there has been an increase in the number of matters on which the Group engages with its regulators. There have also been significant increases in the nature and scale of regulatory investigations and reviews, civil and criminal enforcement actions (whether by court action or otherwise), formal and informal inquiries, regulatory supervisory activities and the quantum of fines issued by regulators, particularly against financial institutions both in Australia and globally. The Group has received various notices and requests for information from its regulators as part of both industry-wide and Group-specific reviews and has also made disclosures to its regulators at its own instigation. The nature of these interactions can be wide ranging and, for example, currently include a range of matters including responsible lending practices, regulated lending requirements, product suitability and distribution, interest and fees and the entitlement to charge them, customer remediation, wealth advice, insurance distribution, pricing, competition, conduct in financial markets and financial transactions, capital market transactions, anti-money laundering and counter-terrorism financing obligations, reporting and disclosure obligations and product disclosure documentation. There may be exposures to customers which are additional to any regulatory exposures. These could include class actions, individual claims or customer remediation or compensation activities. The outcomes and total costs associated with such reviews and possible exposures remain uncertain.
| • | Bank fees litigation and periodical payment remediation and ASIC action |
A litigation funder commenced a class action against the Company in 2010, followed by a second similar class action in March 2013. The applicants contended that certain exception fees (honour, dishonour and non-payment fees on transaction accounts and late payment and over-limit fees on credit cards) were unenforceable penalties and that various of the fees were also unenforceable under statutory provisions governing unconscionable conduct, unfair contract terms and unjust transactions. The claims in the March 2013 class action failed and have been dismissed.
The original claims in the 2010 class action have been dismissed. In 2017, a new claim was added to the 2010 class action, in relation to the Company’s entitlement to charge certain periodical payment non-payment fees. Part of the class of customers had already received remediation payments from the Company. An agreement to settle the claim was reached in December 2018. The settlement was approved by the court in December 2019.
In July 2019, ASIC commenced civil penalty proceedings against the Company in relation to the charging of fees for periodical payments in certain circumstances between August 2003 and February 2016. ASIC seeks civil penalties in respect of alleged false or misleading representations and unconscionable conduct. ASIC also alleges that the Company engaged in misleading or deceptive conduct and breached certain statutory obligations as a financial services licensee. The trial of the matter is scheduled to commence on 14 September 2020. The outcomes and total costs remain uncertain. The Company is defending the allegations.
119
NOTES TO CONDENSED CONSOLIDATED FINANCIAL STATEMENTS
| • | Benchmark/rate actions |
In July and August 2016, class action complaints were brought in the United States District Court against local and international banks, including the Company – one action relating to the bank bill swap rate (BBSW), and one action relating to the Singapore Interbank Offered Rate (SIBOR) and the Singapore Swap Offer Rate (SOR). The class actions are expressed to apply to persons and entities that engaged in US-based transactions in financial instruments that were priced, benchmarked, and/or settled based on BBSW or SIBOR. The claimants seek damages or compensation in amounts not specified, and allege that the defendant banks, including the Company, violated US anti-trust laws and (in the BBSW case only) anti- racketeering laws, the Commodity Exchange Act, and unjust enrichment principles. The Company is defending the proceedings. The matters are at an early stage.
In February 2017, the South African Competition Commission commenced proceedings against local and international banks including the Company alleging breaches of the cartel provisions of the South African Competition Act in respect of trading in the South African rand. The potential civil penalty or other financial impact is uncertain. The matter is at an early stage.
| • | Capital raising actions |
In June 2018, the Commonwealth Director of Public Prosecutions commenced criminal proceedings against the Company and a senior employee alleging that they were knowingly concerned in cartel conduct by the joint lead managers of the Company’s August 2015 underwritten institutional equity placement of approximately 80.8 million ordinary shares. The matter is at an early stage. The Company and its senior employee are defending the allegations.
In September 2018, the Australian Securities and Investments Commission (ASIC) commenced civil penalty proceedings against the Company alleging failure to comply with continuous disclosure obligations in connection with the Company’s August 2015 underwritten institutional equity placement. ASIC alleges the Company should have advised the market that the joint lead managers took up approximately 25.5 million ordinary shares of the placement. The matter is at an early stage. The Company is defending the allegations.
| • | Consumer credit insurance litigation |
In February 2020, a class action was brought against the Company alleging breaches of financial advice obligations, misleading or deceptive conduct and unconscionable conduct in relation to the distribution of consumer credit insurance products. The issuers of the insurance products, QBE and OnePath Life, are also defendants to the claim. The Company is defending the allegations. The matter is at an early stage.
| • | Franchisee litigation |
In February 2018, two related class actions were brought against the Company alleging breaches of contract and unconscionable conduct in relation to lending to 7-Eleven franchisees. An agreement to settle the claims against the Company was reached in March 2019. The settlement is subject to court approval.
| • | Royal Commission |
The Royal Commission into Misconduct in the Banking, Superannuation and Financial Services Industry released its final report on 4 February 2019. The findings and recommendations of the Commission are resulting in additional costs and may lead to further exposures, including exposures associated with further regulator activity or potential customer exposures such as class actions, individual claims or customer remediation or compensation activities. The outcomes and total costs associated with these possible exposures remain uncertain.
| • | Security recovery actions |
Various claims have been made or are anticipated, arising from security recovery actions taken to resolve impaired assets. These claims will be defended.
| • | Warranties and Indemnities |
The Group has provided warranties, indemnities and other commitments in favour of the purchaser and other persons in connection with various disposals of businesses and assets and other transactions, covering a range of matters and risks. It is exposed to claims under those warranties, indemnities and commitments.
| 21. Significant | Events Since Balance Date |
With effect from 2 April 2020, the Reserve Bank of New Zealand (RBNZ) amended the conditions of registration for ANZ Bank New Zealand Limited (ANZ Bank NZ), a New Zealand subsidiary of ANZ Banking Group Limited (ANZBGL) to (among other things) prohibit ANZ Bank NZ from making distributions other than discretionary payments payable to holders of Additional Tier 1 capital instruments. These amendments were also applied to other locally incorporated banks in New Zealand to further support the stability of the New Zealand banking financial system during this period of economic uncertainty. These requirements prevent ANZ Bank NZ from redeeming its NZ$500 million Capital Notes in May 2020, although it can continue making coupon payments on those Capital Notes. As ANZ Bank NZ has announced that it will not be exercising its option to convert in May 2020, the terms of the Capital Notes provide for their conversion into a variable number of ANZBGL shares in May 2022 subject to certain conditions (refer to note 13). Conversion would result in an increase in the Group’s CET1 capital (~12 bps) at Level 2. The amendments will also prevent ANZ Bank NZ from paying dividends to ANZBGL.
Other than the matter above there have been no other significant events from 31 March 2020 to the date of signing this report that have not been adjusted or disclosed.
120
NOTES TO CONDENSED CONSOLIDATED FINANCIAL STATEMENTS
This page has been left blank intentionally
121
DIRECTORS’ DECLARATION
Directors’ Declaration
The Directors of Australia and New Zealand Banking Group Limited declare that:
| 1. | in the Directors’ opinion the Condensed Consolidated Financial Statements and Notes to the Condensed Consolidated Financial Statements are in accordance with the Corporations Act 2001, including: |
| • | section 304, that they comply with the Australian Accounting Standards and any further requirements in the Corporations Regulations 2001; and |
| • | section 305, that they give a true and fair view of the financial position of the Group as at 31 March 2020 and of its performance for the half year ended on that date; and |
| 2. | in the Directors’ opinion as at the date of this declaration there are reasonable grounds to believe that the Company will be able to pay its debts as and when they become due and payable. |
Signed in accordance with a resolution of the Directors.

|

| |
| David M Gonski, AC | Shayne C Elliott | |
| Chairman | Director |
29 April 2020
122
DIRECTORS’ DECLARATION
This page has been left blank intentionally
123
AUDITOR’S REVIEW REPORT AND INDEPENDENCE DECLARATION

Independent Auditor’s Review Report to the shareholders of Australia and New Zealand Banking Group Limited
Report on the Condensed Consolidated Financial Statements
Conclusion
We have reviewed the accompanying Condensed Consolidated Financial Statements of Australia and New Zealand Banking Group Limited (the Group).
The Group comprises Australia and New Zealand Banking Group Limited (the Company) and the entities it controlled at the half year’s end or from time to time during the half year.
The Condensed Consolidated Financial Statements comprise:
| • | The condensed consolidated balance sheet as at 31 March 2020; |
| • | The condensed consolidated income statement, condensed consolidated statement of comprehensive income, condensed consolidated statement of changes in equity, and condensed consolidated cash flow statement for the half year ended on that date; |
| • | Notes 1 to 21 comprising a summary of significant accounting policies and other explanatory information; and |
| • | The Directors’ Declaration. |
Based on our review, which is not an audit, we have not become aware of any matter that makes us believe that the Condensed Consolidated Financial Statements of Australia and New Zealand Banking Group Limited are not in accordance with the Corporations Act 2001, including:
| i) | giving a true and fair view of the Group’s financial position as at 31 March 2020 and of its performance for the half year ended on that date; and |
| ii) | complying with Australian Accounting Standard AASB 134 Interim Financial Reporting and the Corporations Regulations 2001. |
Estimation uncertainty in the preparation of the Condensed Consolidated Financial Statements – Emphasis of Matter
We draw attention to Note 1 (iv) in the Condensed Consolidated Financial Statements, which describes increased estimation uncertainty in the preparation of the Condensed Consolidated Financial Statements, specifically as it relates to the potential impacts of Coronavirus (COVID-19) on the Group’s expected credit losses (ECL). These disclosures include key judgements and assumptions in relation to the ECL model inputs and the interdependencies between those inputs, and highlight significant changes made during the half year ended 31 March 2020.
As described in Note 1(iv) the underlying forecasts and assumptions are subject to uncertainties which are often outside the control of the Group. Actual economic conditions are likely to be different from those forecast since anticipated events frequently do not occur as expected, and the effect of those differences may significantly impact the resulting accounting estimates.
In our view, this issue is fundamental to the users’ understanding of the Condensed Consolidated Financial Statements and the financial position and performance of the Group.
Our conclusion is not modified in respect of this matter.
Responsibilities of the Directors for the Condensed Consolidated Financial Statements
The Directors of the Company are responsible for:
| • | the preparation of the Condensed Consolidated Financial Statements that give a true and fair view in accordance with Australian Accounting Standards and the Corporations Act 2001; and |
| • | such internal control as the Directors determine is necessary to enable the preparation of the Condensed Consolidated Financial Statements that are free from material misstatement, whether due to fraud or error. |
Auditor’s responsibility for the review of the Condensed Consolidated Financial Statements
Our responsibility is to express a conclusion on the Condensed Consolidated Financial Statements based on our review. We conducted our review in accordance with Auditing Standard on Review Engagements ASRE 2410 Review of a Financial Report Performed by the Independent Auditor of the Entity, in order to state whether, on the basis of the procedures described, we have become aware of any matter that makes us believe that the Condensed Consolidated Financial Statements are not in accordance with the Corporations Act 2001 including: giving a true and fair view of the Group’s financial position as at 31 March 2020 and its performance for the half year ended on that date, and complying with Australian Accounting Standard AASB 134 Interim Financial Reporting and the Corporations Regulations 2001. As auditor of Australia and New Zealand Banking Group Limited, ASRE 2410 requires that we comply with the ethical requirements relevant to the audit of the annual financial report.
A review of Condensed Consolidated Financial Statements consists of making enquiries, primarily of persons responsible for financial and accounting matters, and applying analytical and other review procedures. A review is substantially less in scope than an audit conducted in accordance with Australian Auditing Standards and consequently does not enable us to obtain assurance that we would become aware of all significant matters that might be identified in an audit. Accordingly, we do not express an audit opinion.
In conducting our review, we have complied with the independence requirements of the Corporations Act 2001.

|

| |
| KPMG | Alison Kitchen | |
| Melbourne | Partner | |
| 29 April 2020 |
124
AUDITOR’S REVIEW REPORT AND INDEPENDENCE DECLARATION
Lead Auditor’s Independence Declaration under Section 307C of the Corporations Act 2001
To the Directors of Australia and New Zealand Banking Group Limited
I declare that, to the best of my knowledge and belief, in relation to the review of Australia and New Zealand Banking Group Limited for the half year ended 31 March 2020, there have been:
| (i) | no contraventions of the auditor independence requirements as set out in the Corporations Act 2001 in relation to the review; and |
| (ii) | no contraventions of any applicable code of professional conduct in relation to the review. |
|
|
| |
| KPMG Melbourne 29 April 2020 |
Alison Kitchen Partner | |
KPMG, an Australian partnership and a member firm of the KPMG network of independent member firms affiliated with KPMG International Cooperative (”KPMG International”), a Swiss entity. Liability limited by a scheme approved under Professional Standards Legislation.
125
AUDITOR’S REVIEW REPORT AND INDEPENDENCE DECLARATION
This page has been left blank intentionally
126
SUPPLEMENTARY INFORMATION
| CONTENTS | Page | |||
| Capital management - including discontinued operations |
128 | |||
| Average balance sheet and related interest - including discontinued operations |
132 | |||
| Select geographical disclosures – including discontinued operations |
135 | |||
| Exchange rates |
136 | |||
| Derivative financial instruments |
137 | |||
127
SUPPLEMENTARY INFORMATION
Capital management - including discontinued operations
| As at | Movement | |||||||||||||||||||||||
| Qualifying Capital | Mar 20 $M |
Sep 19 $M |
Mar 19 $M |
Mar 20 v. Sep 19 |
Mar 20 v. Mar 19 |
|||||||||||||||||||
| Tier 1 |
||||||||||||||||||||||||
| Shareholders’ equity and non-controlling interests |
61,375 | 60,794 | 59,971 | 1% | 2 | % | ||||||||||||||||||
| Prudential adjustments to shareholders’ equity |
Table 1 | (66 | ) | 120 | (43 | ) | large | 53 | % | |||||||||||||||
| Gross Common Equity Tier 1 capital |
61,309 | 60,914 | 59,928 | 1% | 2 | % | ||||||||||||||||||
| Deductions |
Table 2 | (12,978 | ) | (13,559 | ) | (14,400 | ) | -4% | -10 | % | ||||||||||||||
| Common Equity Tier 1 capital |
48,331 | 47,355 | 45,528 | 2% | 6 | % | ||||||||||||||||||
| Additional Tier 1 capital |
Table 3 | 7,964 | 7,866 | 7,547 | 1% | 6 | % | |||||||||||||||||
| Tier 1 capital |
56,295 | 55,221 | 53,075 | 2% | 6 | % | ||||||||||||||||||
| Tier 2 capital |
Table 4 | 13,112 | 8,549 | 7,569 | 53% | 73 | % | |||||||||||||||||
| Total qualifying capital |
69,407 | 63,770 | 60,644 | 9% | 14 | % | ||||||||||||||||||
| Capital adequacy ratios (Level 2) |
||||||||||||||||||||||||
| Common Equity Tier 1 |
10.8% | 11.4% | 11.5% | |||||||||||||||||||||
| Tier 1 |
12.5% | 13.2% | 13.4% | |||||||||||||||||||||
| Tier 2 |
2.9% | 2.1% | 1.9% | |||||||||||||||||||||
| Total capital ratio |
15.5% | 15.3% | 15.3% | |||||||||||||||||||||
| Risk weighted assets |
Table 5 | 449,012 | 416,961 | 396,291 | 8% | 13 | % | |||||||||||||||||
128
SUPPLEMENTARY INFORMATION
Capital management - including discontinued operations, cont’d
| As at | Movement | |||||||||||||||||||||||
| Mar 20 $M |
Sep 19 $M |
Mar 19 $M |
Mar 20 v. Sep 19 |
Mar 20 v. Mar 19 |
||||||||||||||||||||
| Table 1: Prudential adjustments to shareholders’ equity | ||||||||||||||||||||||||
| Treasury shares attributable to ANZ Wealth Australia discontinued operations policyholders | - | - | 328 | n/a | -100% | |||||||||||||||||||
| Shareholder Equity attributable to deconsolidated entities | (94 | ) | 107 | (352 | ) | large | -73% | |||||||||||||||||
| Deferred fee revenue including fees deferred as part of loan yields | 94 | 108 | 143 | -13% | -34% | |||||||||||||||||||
| Other | (66 | ) | (95 | ) | (162 | ) | -31% | -59% | ||||||||||||||||
| Total | (66 | ) | 120 | (43 | ) | large | 53% | |||||||||||||||||
| Table 2: Deductions from Common Equity Tier 1 capital | ||||||||||||||||||||||||
| Unamortised goodwill & other intangibles (excluding ANZ Wealth Australia discontinued operations and New Zealand) | (3,620 | ) | (3,772 | ) | (3,865 | ) | -4% | -6% | ||||||||||||||||
| Intangible component of investments in ANZ Wealth Australia discontinued operations and New Zealand | (80 | ) | (556 | ) | (1,494 | ) | -86% | -95% | ||||||||||||||||
| Capitalised software | (1,263 | ) | (1,322 | ) | (1,360 | ) | -4% | -7% | ||||||||||||||||
| Capitalised expenses including loan and lease origination fees | (932 | ) | (1,178 | ) | (1,019 | ) | -21% | -9% | ||||||||||||||||
| Applicable deferred net tax assets | (1,815 | ) | (1,376 | ) | (1,162 | ) | 32% | 56% | ||||||||||||||||
| Expected losses in excess of eligible provisions | Table 8 | - | (1 | ) | (42 | ) | -100% | -100% | ||||||||||||||||
| Investment in other insurance and funds management subsidiaries | (336 | ) | (336 | ) | (270 | ) | 0% | 24% | ||||||||||||||||
| Investment in ANZ Wealth Australia discontinued operations and New Zealand | (85 | ) | (103 | ) | (735 | ) | -17% | -88% | ||||||||||||||||
| Investment in banking associates and minority interests | (2,291 | ) | (2,707 | ) | (2,501 | ) | -15% | -8% | ||||||||||||||||
| Other deductions | (2,556 | ) | (2,208 | ) | (1,952 | ) | 16% | 31% | ||||||||||||||||
| Total | (12,978 | ) | (13,559 | ) | (14,400 | ) | -4% | -10% | ||||||||||||||||
| Table 3: Additional Tier 1 capital | ||||||||||||||||||||||||
| ANZ Capital Notes 1 | 1,119 | 1,118 | 1,118 | 0% | 0% | |||||||||||||||||||
| ANZ Capital Notes 2 | 1,607 | 1,607 | 1,606 | 0% | 0% | |||||||||||||||||||
| ANZ Capital Notes 3 | 966 | 966 | 965 | 0% | 0% | |||||||||||||||||||
| ANZ Capital Notes 4 | 1,613 | 1,612 | 1,611 | 0% | 0% | |||||||||||||||||||
| ANZ Capital Notes 5 | 926 | 925 | 925 | 0% | 0% | |||||||||||||||||||
| ANZ Bank NZ Capital Notes | 487 | 462 | 478 | 5% | 2% | |||||||||||||||||||
| ANZ Capital Securities | 1,712 | 1,481 | 1,336 | 16% | 28% | |||||||||||||||||||
| Regulatory adjustments and deductions | (466 | ) | (305 | ) | (492 | ) | 53% | -5% | ||||||||||||||||
| Total | 7,964 | 7,866 | 7,547 | 1% | 6% | |||||||||||||||||||
| Table 4: Tier 2 capital | ||||||||||||||||||||||||
| General reserve for impairment of financial assets | 1,253 | 296 | 307 | large | large | |||||||||||||||||||
| Perpetual subordinated notes | 485 | 444 | 423 | 9% | 15% | |||||||||||||||||||
| Term subordinated debt notes | 12,197 | 7,971 | 7,806 | 53% | 56% | |||||||||||||||||||
| Regulatory adjustments and deductions | (823 | ) | (162 | ) | (967 | ) | large | -15% | ||||||||||||||||
| Total |
13,112 | 8,549 | 7,569 | 53% | 73% | |||||||||||||||||||
129
SUPPLEMENTARY INFORMATION
Capital management - including discontinued operations, cont’d
| As at | Movement | |||||||||||||||||||||||||||
| Mar 20 $M |
Sep 19 $M |
Mar 19 $M |
Mar 20 v. Sep 19 |
Mar 20 v. Mar 19 |
||||||||||||||||||||||||
| Table 5: Risk weighted assets |
||||||||||||||||||||||||||||
| On balance sheet |
285,340 | 264,533 | 264,405 | 8% | 8% | |||||||||||||||||||||||
| Commitments |
57,866 | 55,051 | 53,079 | 5% | 9% | |||||||||||||||||||||||
| Contingents |
13,335 | 12,626 | 12,149 | 6% | 10% | |||||||||||||||||||||||
| Derivatives |
29,456 | 25,896 | 15,890 | 14% | 85% | |||||||||||||||||||||||
| Total credit risk weighted assets |
Table 6 | 385,997 | 358,106 | 345,523 | 8% | 12% | ||||||||||||||||||||||
| Market risk - Traded |
7,102 | 5,307 | 5,790 | 34% | 23% | |||||||||||||||||||||||
| Market risk - IRRBB |
8,011 | 6,922 | 7,245 | 16% | 11% | |||||||||||||||||||||||
| Operational risk |
47,902 | 46,626 | 37,733 | 3% | 27% | |||||||||||||||||||||||
| Total risk weighted assets |
449,012 | 416,961 | 396,291 | 8% | 13% | |||||||||||||||||||||||
| As at | Movement | |||||||||||||||||||||||||||
| Mar 20 $M |
Sep 19 $M |
Mar 19 $M |
Mar 20 v. Sep 19 |
Mar 20 v. Mar 19 |
||||||||||||||||||||||||
| Table 6: Credit risk weighted assets by Basel asset class |
||||||||||||||||||||||||||||
| Subject to Advanced IRB approach |
||||||||||||||||||||||||||||
| Corporate |
150,290 | 136,885 | 127,989 | 10% | 17% | |||||||||||||||||||||||
| Sovereign |
6,915 | 6,199 | 7,016 | 12% | -1% | |||||||||||||||||||||||
| Bank |
18,615 | 15,968 | 15,511 | 17% | 20% | |||||||||||||||||||||||
| Residential mortgage |
107,351 | 105,491 | 101,469 | 2% | 6% | |||||||||||||||||||||||
| Qualifying revolving retail (credit cards) |
4,956 | 5,255 | 5,795 | -6% | -14% | |||||||||||||||||||||||
| Other retail |
25,080 | 26,258 | 28,029 | -4% | -11% | |||||||||||||||||||||||
| Credit risk weighted assets subject to Advanced IRB approach |
313,207 | 296,056 | 285,809 | 6% | 10% | |||||||||||||||||||||||
|
|
||||||||||||||||||||||||||||
| Credit risk specialised lending exposures subject to slotting criteria |
41,072 | 36,318 | 35,696 | 13% | 15% | |||||||||||||||||||||||
| Subject to Standardised approach |
||||||||||||||||||||||||||||
| Corporate |
14,626 | 11,645 | 12,252 | 26% | 19% | |||||||||||||||||||||||
| Residential mortgage |
228 | 216 | 331 | 6% | -31% | |||||||||||||||||||||||
| Other retail (includes credit cards) |
46 | 50 | 81 | -8% | -43% | |||||||||||||||||||||||
| Credit risk weighted assets subject to Standardised approach |
14,900 | 11,911 | 12,664 | 25% | 18% | |||||||||||||||||||||||
|
|
||||||||||||||||||||||||||||
| Credit Valuation Adjustment and Qualifying Central Counterparties |
9,679 | 8,682 | 6,217 | 11% | 56% | |||||||||||||||||||||||
| Credit risk weighted assets relating to securitisation exposures |
2,142 | 1,859 | 1,558 | 15% | 37% | |||||||||||||||||||||||
| Other assets |
4,997 | 3,280 | 3,579 | 52% | 40% | |||||||||||||||||||||||
| Total credit risk weighted assets |
385,997 | 358,106 | 345,523 | 8% | 12% | |||||||||||||||||||||||
130
SUPPLEMENTARY INFORMATION
Capital management - including discontinued operations, cont’d
| Collectively and Individually Assessed Provision |
Basel Expected Loss1 | |||||||||||||||||||||||||
| Table 7: Total provision for credit impairment and Basel expected loss by division | Mar 20 $M |
Sep 19 $M |
Mar 19 $M |
Mar 20 $M |
Sep 19 $M |
Mar 19 $M |
||||||||||||||||||||
| Australia Retail and Commercial |
2,902 | 2,353 | 2,420 | 2,415 | 2,415 | 2,460 | ||||||||||||||||||||
| Institutional |
1,996 | 1,329 | 1,340 | 1,367 | 1,022 | 1,041 | ||||||||||||||||||||
| New Zealand |
620 | 446 | 442 | 737 | 672 | 696 | ||||||||||||||||||||
| Pacific |
76 | 62 | 67 | - | 7 | 8 | ||||||||||||||||||||
| TSO and Group Centre |
- | - | - | - | - | 1 | ||||||||||||||||||||
| Total provision for credit impairment and expected loss |
5,594 | 4,190 | 4,269 | 4,519 | 4,116 | 4,206 | ||||||||||||||||||||
| 1. | Only applicable to Advanced Internal Ratings based portfolios. |
| As at | Movement | |||||||||||||||||||
| Table 8: APRA Expected loss in excess of eligible provisions | Mar 20 $M |
Sep 19 $M |
Mar 19 $M |
Mar 20 v. Sep 19 |
Mar 20 v. Mar 19 |
|||||||||||||||
| APRA Basel 3 expected loss: non-defaulted |
2,775 | 2,646 | 2,675 | 5% | 4% | |||||||||||||||
| Less: Qualifying collectively assessed provision |
||||||||||||||||||||
| Collectively assessed provision |
(4,501 | ) | (3,376 | ) | (3,378 | ) | 33% | 33% | ||||||||||||
| Non-qualifying collectively assessed provision |
473 | 435 | 395 | 9% | 20% | |||||||||||||||
| Standardised collectively assessed provision |
190 | 135 | 151 | 41% | 26% | |||||||||||||||
| Non-defaulted excess included in deduction |
- | - | - | n/a | n/a | |||||||||||||||
| APRA Basel 3 expected loss: defaulted |
1,744 | 1,470 | 1,531 | 19% | 14% | |||||||||||||||
| Less: Qualifying individually assessed provision |
||||||||||||||||||||
| Individually assessed provision |
(1,093 | ) | (814 | ) | (891 | ) | 34% | 23% | ||||||||||||
| Additional individually assessed provision for partial write offs |
(289 | ) | (313 | ) | (310 | ) | -8% | -7% | ||||||||||||
| Standardised individually assessed provision |
71 | 66 | 85 | 8% | -16% | |||||||||||||||
| Collectively assessed provision on advanced defaulted |
(440 | ) | (408 | ) | (373 | ) | 8% | 18% | ||||||||||||
| - | 1 | 42 | -100% | -100% | ||||||||||||||||
| Shortfall in expected loss not included in deduction |
7 | - | - | n/a | n/a | |||||||||||||||
| Defaulted excess included in deduction |
- | 1 | 42 | -100% | -100% | |||||||||||||||
| Gross deduction |
- | 1 | 42 | -100% | -100% | |||||||||||||||
131
SUPPLEMENTARY INFORMATION
Average balance sheet and related interest1, 2 – including discontinued operations
| Half Year Mar 20 | Half Year Sep 19 | Half Year Mar 19 | ||||||||||||||||||||||||||||||||||||||
| Avg bal $M |
Int $M |
Rate % |
Avg bal $M |
Int $M |
Rate % |
Avg bal $M |
Int $M |
Rate % |
||||||||||||||||||||||||||||||||
| Loans and advances |
||||||||||||||||||||||||||||||||||||||||
| Home loans |
320,523 | 6,340 | 4.0% | 320,818 | 7,006 | 4.4% | 322,407 | 7,396 | 4.6% | |||||||||||||||||||||||||||||||
| Consumer finance |
16,030 | 766 | 9.6% | 16,651 | 835 | 10.0% | 17,876 | 887 | 10.0% | |||||||||||||||||||||||||||||||
| Business lending |
268,884 | 5,095 | 3.8% | 253,334 | 5,382 | 4.2% | 246,530 | 5,570 | 4.5% | |||||||||||||||||||||||||||||||
| Individual provisions for credit impairment |
(798 | ) | - | n/a | (874 | ) | - | n/a | (902 | ) | - | n/a | ||||||||||||||||||||||||||||
| Total (continuing operations) |
604,639 | 12,201 | 4.0% | 589,929 | 13,223 | 4.5% | 585,911 | 13,853 | 4.7% | |||||||||||||||||||||||||||||||
| Non-lending interest earning assets |
||||||||||||||||||||||||||||||||||||||||
| Cash and other liquid assets |
125,077 | 562 | 0.9% | 105,781 | 624 | 1.2% | 110,337 | 710 | 1.3% | |||||||||||||||||||||||||||||||
| Trading and investment securities/available-for-sale assets |
126,238 | 1,015 | 1.6% | 118,141 | 1,219 | 2.1% | 114,169 | 1,317 | 2.3% | |||||||||||||||||||||||||||||||
| Other assets |
697 | 22 | n/a | 980 | 41 | n/a | 1,111 | 91 | n/a | |||||||||||||||||||||||||||||||
| Total (continuing operations) |
252,012 | 1,599 | 1.3% | 224,902 | 1,884 | 1.7% | 225,617 | 2,118 | 1.9% | |||||||||||||||||||||||||||||||
| Total interest earning assets (continuing operations)3 |
856,651 | 13,800 | 3.2% | 814,831 | 15,107 | 3.7% | 811,528 | 15,971 | 3.9% | |||||||||||||||||||||||||||||||
|
Non-interest earning assets (continuing operations) |
165,322 | 163,987 | 120,099 | |||||||||||||||||||||||||||||||||||||
| Total average assets (continuing operations) |
1,021,973 | 978,818 | 931,627 | |||||||||||||||||||||||||||||||||||||
| Total average assets (discontinued operations) |
1,221 | 8,911 | 42,564 | |||||||||||||||||||||||||||||||||||||
| Total average assets |
1,023,194 | 987,729 | 974,191 | |||||||||||||||||||||||||||||||||||||
| Deposits and other borrowings |
||||||||||||||||||||||||||||||||||||||||
| Certificates of deposit |
37,398 | 236 | 1.3% | 41,561 | 311 | 1.5% | 43,592 | 505 | 2.3% | |||||||||||||||||||||||||||||||
| Term deposits |
231,163 | 2,286 | 2.0% | 228,739 | 2,886 | 2.5% | 217,887 | 2,783 | 2.6% | |||||||||||||||||||||||||||||||
| On demand and short term deposits |
239,786 | 1,427 | 1.2% | 227,405 | 1,786 | 1.6% | 215,957 | 1,892 | 1.8% | |||||||||||||||||||||||||||||||
| Deposits from banks and securities sold under agreement to repurchase |
81,132 | 666 | 1.6% | 79,345 | 819 | 2.1% | 81,748 | 913 | 2.2% | |||||||||||||||||||||||||||||||
| Commercial paper and other borrowings |
21,397 | 110 | 1.0% | 10,633 | 116 | 2.2% | 22,127 | 309 | 2.8% | |||||||||||||||||||||||||||||||
| Total (continuing operations) |
610,876 | 4,725 | 1.5% | 587,683 | 5,918 | 2.0% | 581,311 | 6,402 | 2.2% | |||||||||||||||||||||||||||||||
| Non-deposit interest bearing liabilities |
||||||||||||||||||||||||||||||||||||||||
| Collateral received and settlement balances owed by ANZ |
13,495 | 40 | 0.6% | 12,407 | 63 | 1.0% | 11,603 | 51 | 0.9% | |||||||||||||||||||||||||||||||
| Debt issuances & subordinated debt |
125,362 | 1,507 | 2.4% | 125,183 | 1,846 | 2.9% | 120,454 | 2,060 | 3.4% | |||||||||||||||||||||||||||||||
| Other liabilities |
7,669 | 307 | n/a | 5,222 | 240 | n/a | 2,465 | 159 | n/a | |||||||||||||||||||||||||||||||
| Total (continuing operations) |
146,526 | 1,854 | 2.5% | 142,812 | 2,149 | 3.0% | 134,522 | 2,270 | 3.4% | |||||||||||||||||||||||||||||||
| Total interest bearing liabilities (continuing operations)3 |
757,402 | 6,579 | 1.7% | 730,495 | 8,067 | 2.2% | 715,833 | 8,672 | 2.4% | |||||||||||||||||||||||||||||||
|
Non-interest bearing liabilities (continuing operations) |
204,148 | 182,093 | 153,751 | |||||||||||||||||||||||||||||||||||||
| Total average liabilities (continuing operations) |
961,550 | 912,588 | 869,584 | |||||||||||||||||||||||||||||||||||||
| Total average liabilities (discontinued operations) |
1,414 | 15,351 | 45,412 | |||||||||||||||||||||||||||||||||||||
| Total average liabilities |
962,964 | 927,939 | 914,996 | |||||||||||||||||||||||||||||||||||||
| Total average shareholders’ equity |
60,230 | 59,790 | 59,195 | |||||||||||||||||||||||||||||||||||||
| 1. | Averages used are predominantly daily averages. |
| 2. | Assets and liabilities held for sale are included in continuing operations balance sheet categories and discontinued operations. |
| 3. | Intra-group interest earning assets and interest income and Intra-group interest earning liabilities and interest expense have been eliminated. |
132
SUPPLEMENTARY INFORMATION
Average balance sheet and related interest1, 2 – including discontinued operations (cont’d)
| Half Year Mar 20 | Half Year Sep 19 | Half Year Mar 19 | ||||||||||||||||||||||||||||||||||||||
| Avg bal $M |
Int $M |
Rate % |
Avg bal $M |
Int $M |
Rate % |
Avg bal $M |
Int $M |
Rate % |
||||||||||||||||||||||||||||||||
| Loans and advances |
||||||||||||||||||||||||||||||||||||||||
| Australia |
408,922 | 8,219 | 4.0% | 400,584 | 8,926 | 4.4% | 401,296 | 9,507 | 4.8% | |||||||||||||||||||||||||||||||
| Asia, Pacific, Europe & America |
66,892 | 1,339 | 4.0% | 63,493 | 1,469 | 4.6% | 61,248 | 1,456 | 4.8% | |||||||||||||||||||||||||||||||
| New Zealand |
128,825 | 2,643 | 4.1% | 125,852 | 2,828 | 4.5% | 123,367 | 2,890 | 4.7% | |||||||||||||||||||||||||||||||
| Total (continuing operations) |
604,639 | 12,201 | 4.0% | 589,929 | 13,223 | 4.5% | 585,911 | 13,853 | 4.7% | |||||||||||||||||||||||||||||||
| Trading and investment securities/available-for-sale assets |
||||||||||||||||||||||||||||||||||||||||
| Australia |
61,968 | 360 | 1.2% | 58,306 | 542 | 1.9% | 58,709 | 684 | 2.3% | |||||||||||||||||||||||||||||||
| Asia, Pacific, Europe & America |
48,207 | 500 | 2.1% | 45,618 | 515 | 2.3% | 41,171 | 455 | 2.2% | |||||||||||||||||||||||||||||||
| New Zealand |
16,063 | 155 | 1.9% | 14,217 | 162 | 2.3% | 14,289 | 178 | 2.5% | |||||||||||||||||||||||||||||||
| Total (continuing operations) |
126,238 | 1,015 | 1.6% | 118,141 | 1,219 | 2.1% | 114,169 | 1,317 | 2.3% | |||||||||||||||||||||||||||||||
| Total interest earning assets3 |
||||||||||||||||||||||||||||||||||||||||
| Australia |
521,127 | 8,889 | 3.4% | 503,406 | 9,883 | 3.9% | 505,654 | 10,633 | 4.2% | |||||||||||||||||||||||||||||||
| Asia, Pacific, Europe & America |
185,718 | 2,051 | 2.2% | 166,743 | 2,212 | 2.6% | 163,810 | 2,206 | 2.7% | |||||||||||||||||||||||||||||||
| New Zealand |
149,806 | 2,860 | 3.8% | 144,682 | 3,012 | 4.2% | 142,064 | 3,132 | 4.4% | |||||||||||||||||||||||||||||||
| Total (continuing operations) |
856,651 | 13,800 | 3.2% | 814,831 | 15,107 | 3.7% | 811,528 | 15,971 | 3.9% | |||||||||||||||||||||||||||||||
| Total average assets |
||||||||||||||||||||||||||||||||||||||||
| Australia |
640,901 | 625,713 | 588,469 | |||||||||||||||||||||||||||||||||||||
| Asia, Pacific, Europe & America |
216,335 | 192,802 | 188,160 | |||||||||||||||||||||||||||||||||||||
| New Zealand |
164,737 | 160,303 | 154,998 | |||||||||||||||||||||||||||||||||||||
| Total average assets (continuing operations) |
1,021,973 | 978,818 | 931,627 | |||||||||||||||||||||||||||||||||||||
| Total average assets (discontinued operations) |
1,221 | 8,911 | 42,564 | |||||||||||||||||||||||||||||||||||||
| Total average assets |
1,023,194 | 987,729 | 974,191 | |||||||||||||||||||||||||||||||||||||
| Interest bearing deposits and other borrowings |
||||||||||||||||||||||||||||||||||||||||
| Australia |
340,526 | 2,439 | 1.4% | 333,298 | 3,202 | 1.9% | 334,952 | 3,716 | 2.2% | |||||||||||||||||||||||||||||||
| Asia, Pacific, Europe & America |
171,757 | 1,381 | 1.6% | 158,496 | 1,658 | 2.1% | 150,989 | 1,554 | 2.1% | |||||||||||||||||||||||||||||||
| New Zealand |
98,594 | 905 | 1.8% | 95,889 | 1,059 | 2.2% | 95,370 | 1,132 | 2.4% | |||||||||||||||||||||||||||||||
| Total (continuing operations) |
610,877 | 4,725 | 1.5% | 587,683 | 5,919 | 2.0% | 581,311 | 6,402 | 2.2% | |||||||||||||||||||||||||||||||
| Total interest bearing liabilities3 |
||||||||||||||||||||||||||||||||||||||||
| Australia |
435,175 | 3,666 | 1.7% | 426,405 | 4,680 | 2.2% | 421,237 | 5,296 | 2.5% | |||||||||||||||||||||||||||||||
| Asia, Pacific, Europe & America |
197,147 | 1,681 | 1.7% | 183,293 | 1,963 | 2.1% | 176,119 | 1,864 | 2.1% | |||||||||||||||||||||||||||||||
| New Zealand |
125,082 | 1,232 | 2.0% | 120,797 | 1,424 | 2.4% | 118,477 | 1,512 | 2.6% | |||||||||||||||||||||||||||||||
| Total (continuing operations) |
757,404 | 6,579 | 1.7% | 730,495 | 8,067 | 2.2% | 715,833 | 8,672 | 2.4% | |||||||||||||||||||||||||||||||
| Total average liabilities |
||||||||||||||||||||||||||||||||||||||||
| Australia |
583,204 | 556,542 | 528,775 | |||||||||||||||||||||||||||||||||||||
| Asia, Pacific, Europe & America |
229,218 | 211,136 | 201,315 | |||||||||||||||||||||||||||||||||||||
| New Zealand |
149,128 | 144,910 | 139,494 | |||||||||||||||||||||||||||||||||||||
| Total average liabilities (continuing operations) |
961,550 | 912,588 | 869,584 | |||||||||||||||||||||||||||||||||||||
| Total average liabilities (discontinued operations) |
1,414 | 15,351 | 45,412 | |||||||||||||||||||||||||||||||||||||
| Total average liabilities |
962,964 | 927,939 | 914,996 | |||||||||||||||||||||||||||||||||||||
| Total average shareholders’ equity |
||||||||||||||||||||||||||||||||||||||||
| Ordinary share capital, reserves, retained earnings and non-controlling interests |
60,230 | 59,790 | 59,195 | |||||||||||||||||||||||||||||||||||||
| Total average shareholders’ equity |
60,230 | 59,790 | 59,195 | |||||||||||||||||||||||||||||||||||||
| Total average liabilities and shareholder’s equity |
1,023,194 | 987,729 | 974,191 | |||||||||||||||||||||||||||||||||||||
| 1. | Averages used are predominantly daily averages. |
| 2. | Assets and liabilities held for sale are included in continuing operations balance sheet categories and discontinued operations. |
| 3. | Intra-group interest earning assets and interest income and Intra-group interest earning liabilities and interest expense have been eliminated. |
133
SUPPLEMENTARY INFORMATION
| Half Year
|
||||||||||||
| Mar 20 | Sep 19 | Mar 19 | ||||||||||
| Gross earnings rate1 |
% | % | % | |||||||||
| Australia |
3.55 | 4.12 | 4.38 | |||||||||
| Asia, Pacific, Europe & America |
2.24 | 2.64 | 2.71 | |||||||||
| New Zealand |
3.82 | 4.15 | 4.42 | |||||||||
| Group |
3.22 | 3.70 | 3.95 | |||||||||
| Net interest spread and net interest margin analysis as follows: |
||||||||||||
| Half Year
|
||||||||||||
| Mar 20 | Sep 19 | Mar 19 | ||||||||||
| Australia1 |
% | % | % | |||||||||
| Net interest spread |
1.76 | 1.79 | 1.75 | |||||||||
| Interest attributable to net non-interest bearing items |
0.23 | 0.25 | 0.35 | |||||||||
| Net interest margin - Australia |
1.99 | 2.04 | 2.10 | |||||||||
| Asia, Pacific, Europe & America1 |
||||||||||||
| Net interest spread |
0.53 | 0.50 | 0.58 | |||||||||
| Interest attributable to net non-interest bearing items |
0.10 | 0.13 | 0.13 | |||||||||
| Net interest margin - Asia, Pacific, Europe & America |
0.63 | 0.63 | 0.71 | |||||||||
| New Zealand1 |
||||||||||||
| Net interest spread |
1.81 | 1.76 | 1.82 | |||||||||
| Interest attributable to net non-interest bearing items |
0.29 | 0.33 | 0.35 | |||||||||
| Net interest margin - New Zealand |
2.10 | 2.09 | 2.17 | |||||||||
| Group |
||||||||||||
| Net interest spread |
1.48 | 1.50 | 1.52 | |||||||||
| Interest attributable to net non-interest bearing items |
0.21 | 0.22 | 0.28 | |||||||||
| Net interest margin |
1.69 | 1.72 | 1.80 | |||||||||
| Net interest margin (excluding Markets) |
2.37 | 2.40 | 2.50 | |||||||||
| 1. | Geographic gross earnings rate, net interest spread and net interest margin are calculated gross of intra-group items (Intra-group interest earning assets and associated interest income and intra-group interest bearing liabilities and associated interest expense). |
134
SUPPLEMENTARY INFORMATION
Select geographical disclosures – including discontinued operations
The following divisions operate across the geographic locations illustrated below:
| • | Institutional division - International, New Zealand and Australia |
| • | Pacific division - International |
| • | New Zealand division - New Zealand |
| • | TSO and Group Centre operate across all geographies |
| • | Discontinued operations - Australia |
The International geography includes Asia, Pacific, Europe & America
| Australia $M |
New Zealand $M |
International $M |
Total $M |
|||||||||||||
| March 2020 Half Year |
||||||||||||||||
| Statutory profit attributable to shareholders of the company |
1,189 | 752 | (396 | ) | 1,545 | |||||||||||
| Cash profit |
1,065 | 645 | (387 | ) | 1,323 | |||||||||||
| Net loans and advances1 |
445,449 | 132,127 | 79,033 | 656,609 | ||||||||||||
| Customer deposits1 |
303,600 | 110,442 | 152,453 | 566,495 | ||||||||||||
| Risk weighted assets1 |
270,876 | 84,900 | 93,235 | 449,011 | ||||||||||||
| September 2019 Half Year |
||||||||||||||||
| Statutory profit attributable to shareholders of the company |
1,509 | 846 | 425 | 2,780 | ||||||||||||
| Cash profit |
1,429 | 813 | 405 | 2,647 | ||||||||||||
| Net loans and advances1 |
429,454 | 123,467 | 62,337 | 615,258 | ||||||||||||
| Customer deposits1 |
283,586 | 101,205 | 127,021 | 511,812 | ||||||||||||
| Risk weighted assets1 |
259,820 | 78,613 | 78,528 | 416,961 | ||||||||||||
| March 2019 Half Year |
||||||||||||||||
| Statutory profit attributable to shareholders of the company |
1,750 | 877 | 546 | 3,173 | ||||||||||||
| Cash profit |
1,902 | 1,052 | 560 | 3,514 | ||||||||||||
| Net loans and advances1 |
421,279 | 126,287 | 62,603 | 610,169 | ||||||||||||
| Customer deposits1 |
270,779 | 103,034 | 119,560 | 493,373 | ||||||||||||
| Risk weighted assets1 |
249,777 | 71,322 | 75,192 | 396,291 | ||||||||||||
|
1. Balance Sheet amounts include assets and liabilities held for sale. |
||||||||||||||||
| New Zealand geography (in NZD) | ||||||||||||||||||||
| Half Year
|
Movement
|
|||||||||||||||||||
| Mar 20 NZD M |
Sep 19 NZD M |
Mar 19 NZD M |
Mar 20 v. Sep 19 |
Mar 20 v. Mar 19 |
||||||||||||||||
| Net interest income |
1,648 | 1,606 | 1,626 | 3% | 1% | |||||||||||||||
| Other operating income |
344 | 440 | 654 | -22% | -47% | |||||||||||||||
| Operating income |
1,992 | 2,046 | 2,280 | -3% | -13% | |||||||||||||||
| Operating expenses |
(828 | ) | (850 | ) | (735 | ) | -3% | 13% | ||||||||||||
| Profit before credit impairment and income tax |
1,164 | 1,196 | 1,545 | -3% | -25% | |||||||||||||||
| Credit impairment (charge)/release |
(232 | ) | (67 | ) | (32 | ) | large | large | ||||||||||||
| Profit before income tax |
932 | 1,129 | 1,513 | -17% | -38% | |||||||||||||||
| Income tax expense and non-controlling interests |
(255 | ) | (310 | ) | (399 | ) | -18% | -36% | ||||||||||||
| Cash profit1 |
677 | 819 | 1,114 | -17% | -39% | |||||||||||||||
| Adjustments between statutory profit and cash profit |
112 | 77 | (185 | ) | 45% | large | ||||||||||||||
| Statutory profit1 |
789 | 896 | 929 | -12% | -15% | |||||||||||||||
| Individually assessed credit impairment charge/(release) - cash |
44 | 37 | 32 | 19% | 38% | |||||||||||||||
| Collectively assessed credit impairment charge/(release) - cash |
188 | 30 | - | large | n/a | |||||||||||||||
| Net loans and advances |
135,679 | 133,264 | 131,795 | 2% | 3% | |||||||||||||||
| Customer deposits |
113,411 | 109,236 | 107,528 | 4% | 5% | |||||||||||||||
| Risk weighted assets |
87,182 | 84,850 | 74,433 | 3% | 17% | |||||||||||||||
| Total full time equivalent staff (FTE) |
7,532 | 7,491 | 7,311 | 1% | 3% | |||||||||||||||
| 1. | Statutory profit for March 2019 half included a NZ$59 million gain on sale of OPL NZ, and a NZ$39 million gain on sale of Paymark. Cash profit also includes an after tax gain of NZ$86 million on the reversal of the life-to-date cash profit adjustments on the revaluation of OPL NZ policy liabilities sold. |
135
SUPPLEMENTARY INFORMATION
Exchange rates
Major exchange rates used in the translation of foreign subsidiaries, branches, investments in associates and issued debt are as follows:
| Balance Sheet | Profit & Loss Average | |||||||||||||||||||||||||
| As at | Half Year | |||||||||||||||||||||||||
| Mar 20 | Sep 19 | Mar 19 | Mar 20 | Sep 19 | Mar 19 | |||||||||||||||||||||
| Chinese Renminbi |
4.3895 | 4.8126 | 4.7700 | 4.7002 | 4.7917 | 4.8805 | ||||||||||||||||||||
| Euro |
0.5619 | 0.6175 | 0.6313 | 0.6066 | 0.6197 | 0.6274 | ||||||||||||||||||||
| Pound Sterling |
0.5017 | 0.5491 | 0.5425 | 0.5225 | 0.5503 | 0.5520 | ||||||||||||||||||||
| Indian Rupee |
46.745 | 47.737 | 48.991 | 48.153 | 48.403 | 50.906 | ||||||||||||||||||||
| Indonesian Rupiah |
10,126 | 9,578 | 10,099 | 9,487 | 9,814 | 10,329 | ||||||||||||||||||||
| Japanese Yen |
67.015 | 72.816 | 78.550 | 72.937 | 75.069 | 79.629 | ||||||||||||||||||||
| Malaysian Ringgit |
2.6611 | 2.8277 | 2.8963 | 2.7969 | 2.8782 | 2.9526 | ||||||||||||||||||||
| New Taiwan Dollar |
18.707 | 20.960 | 21.863 | 20.315 | 21.580 | 22.028 | ||||||||||||||||||||
| New Zealand Dollar |
1.0269 | 1.0794 | 1.0436 | 1.0488 | 1.0567 | 1.0578 | ||||||||||||||||||||
| Papua New Guinean Kina |
2.1193 | 2.2971 | 2.3924 | 2.2845 | 2.3467 | 2.4051 | ||||||||||||||||||||
| United States Dollar |
0.6189 | 0.6754 | 0.7094 | 0.6705 | 0.6923 | 0.7145 | ||||||||||||||||||||
136
SUPPLEMENTARY INFORMATION
Derivative financial instruments
Derivative financial instruments are contracts whose value is derived from one or more underlying variables or indices defined in the contract, require little or no initial net investment and are settled at a future date. Derivatives include contracts traded on registered exchanges and contracts agreed between counterparties. The use of derivatives and their sale to customers as risk management products is an integral part of the Group’s trading and sales activities. Derivatives are also used to manage the Group’s own exposure to fluctuations in foreign exchange and interest rates as part of its asset and liability management activities.
The following table provides an overview of the Group’s foreign exchange, interest rate, commodity and credit derivatives. They include all trading and balance sheet risk management contracts. The derivative instruments become favourable (assets) or unfavourable (liabilities) as a result of fluctuations in market rates relative to the terms of the derivative.
| Assets | Liabilities | Assets | Liabilities | Assets | Liabilities | |||||||||||||||||||
| Mar 20 | Mar 20 | Sep 19 | Sep 19 | Mar 19 | Mar 19 | |||||||||||||||||||
| Fair Values | $M | $M | $M | $M | $M | $M | ||||||||||||||||||
| Interest rate contracts |
||||||||||||||||||||||||
| Forward rate agreements |
255 | (250 | ) | 74 | (78 | ) | 13 | (14 | ) | |||||||||||||||
| Futures contracts |
78 | (160 | ) | 41 | (136 | ) | 66 | (205 | ) | |||||||||||||||
| Swap agreements |
112,934 | (108,736 | ) | 86,965 | (84,575 | ) | 55,832 | (56,028 | ) | |||||||||||||||
| Options purchased |
2,436 | - | 1,454 | - | 1,111 | - | ||||||||||||||||||
| Options sold |
- | (3,865 | ) | - | (2,317 | ) | - | (1,789 | ) | |||||||||||||||
| Total |
115,703 | (113,011 | ) | 88,534 | (87,106 | ) | 57,022 | (58,036 | ) | |||||||||||||||
| Foreign exchange contracts |
||||||||||||||||||||||||
| Spot and forward contracts |
26,038 | (23,964 | ) | 15,987 | (15,427 | ) | 11,303 | (10,419 | ) | |||||||||||||||
| Swap agreements |
27,624 | (27,138 | ) | 13,912 | (16,326 | ) | 9,288 | (11,087 | ) | |||||||||||||||
| Options purchased |
837 | - | 405 | - | 366 | - | ||||||||||||||||||
| Options sold |
- | (937 | ) | - | (514 | ) | - | (506 | ) | |||||||||||||||
| Total |
54,499 | (52,039 | ) | 30,304 | (32,267 | ) | 20,957 | (22,012 | ) | |||||||||||||||
| Commodity contracts |
3,449 | (2,288 | ) | 1,807 | (1,553 | ) | 1,328 | (738 | ) | |||||||||||||||
| Credit default swaps |
||||||||||||||||||||||||
| Structured credit derivatives purchased |
16 | - | 16 | - | 16 | - | ||||||||||||||||||
| Other credit derivatives purchased |
4 | (6 | ) | 4 | (3 | ) | 14 | (59 | ) | |||||||||||||||
| Credit derivatives purchased |
20 | (6 | ) | 20 | (3 | ) | 30 | (59 | ) | |||||||||||||||
| Structured credit derivatives sold |
- | (17 | ) | - | (19 | ) | - | (20 | ) | |||||||||||||||
| Other credit derivatives sold |
6 | (3 | ) | 2 | (3 | ) | 38 | (6 | ) | |||||||||||||||
| Credit derivatives sold |
6 | (20 | ) | 2 | (22 | ) | 38 | (26 | ) | |||||||||||||||
| Total |
26 | (26 | ) | 22 | (25 | ) | 68 | (85 | ) | |||||||||||||||
| Derivative financial instruments |
173,677 | (167,364 | ) | 120,667 | (120,951 | ) | 79,375 | (80,871 | ) | |||||||||||||||
137
SUPPLEMENTARY INFORMATION
This page has been left blank intentionally
138
DEFINITIONS
AASB - Australian Accounting Standards Board. The term “AASB” is commonly used when identifying Australian Accounting Standards issued by the AASB.
ANZEST – ANZ Employee Share Trust.
APRA - Australian Prudential Regulation Authority.
APS - ADI Prudential Standard.
Cash and cash equivalents comprise coins, notes, money at call, balances held with central banks, liquid settlement balances (readily convertible to known amounts of cash which are subject to insignificant risk of changes in value) and securities purchased under agreements to resell (reverse repos) in less than three months.
Cash profit is an additional measure of profit which is prepared on a basis other than in accordance with accounting standards. Cash profit represents ANZ’s preferred measure of the result of the core business activities of the Group, enabling readers to assess Group and Divisional performance against prior periods and against peer institutions. To calculate cash profit, the Group excludes non-core items from statutory profit as noted below. These items are calculated consistently period on period so as not to discriminate between positive and negative adjustments.
Gains and losses are adjusted where they are significant, or have the potential to be significant in any one period, and fall into one of three categories:
| 1. | gains or losses included in earnings arising from changes in tax, legal or accounting legislation or other non-core items not associated with the core operations of the Group; |
| 2. | treasury shares, revaluation of policy liabilities, economic hedging impacts and similar accounting items that represent timing differences that will reverse through earnings in the future; and |
| 3. | accounting reclassifications between individual line items that do not impact reported results, such as policyholders tax gross up. |
Cash profit is not a measure of cash flow or profit determined on a cash accounting basis.
Collectively assessed allowance for expected credit loss represents the Expected Credit Loss (ECL). This incorporates forward looking information and does not require an actual loss event to have occurred for an impairment provision to be recognised.
Coronavirus (COVID-19) is a respiratory illness caused by a new virus and declared a Public Health Emergency of International Concern. COVID-19 was characterised as a pandemic by the World Health Organisation on 11 March 2020.
Covered bonds are bonds issued by an ADI to external investors secured against a pool of the ADI’s assets (the cover pool) assigned to a bankruptcy remote special purpose entity. The primary assets forming the cover pool are mortgage loans. The mortgages remain on the issuer’s balance sheet. The covered bond holders have dual recourse to the issuer and the cover pool assets. The mortgages included in the cover pool cannot be otherwise pledged or disposed of but may be repurchased and substituted in order to maintain the credit quality of the pool. The Group issues covered bonds as part of its funding activities.
Credit risk is the risk of financial loss resulting from the failure of ANZ’s customers and counterparties to honour or perform fully the terms of a loan or contract.
Credit risk weighted assets (CRWA) represent assets which are weighted for credit risk according to a set formula as prescribed in APS 112/113.
Customer deposits represent term deposits, other deposits bearing interest, deposits not bearing interest and borrowing corporations’ debt excluding securitisation deposits.
Customer remediation includes provisions for expected refunds to customers, remediation project costs and related customer and regulatory claims, penalties and litigation outcomes.
Derivative credit valuation adjustment (CVA) - Over the life of a derivative instrument, ANZ uses a model to adjust fair value to take into account the impact of counterparty credit quality. The methodology calculates the present value of expected losses over the life of the financial instrument as a function of probability of default, loss given default, expected credit risk exposure and an asset correlation factor. Impaired derivatives are also subject to a CVA.
Dividend payout ratio is the total ordinary dividend payment divided by profit attributable to shareholders of the Company.
Gross loans and advances (GLA) is made up of loans and advances, capitalised brokerage/mortgage origination fees less unearned income.
Impaired assets are those financial assets where doubt exists as to whether the full contractual amount will be received in a timely manner, or where concessional terms have been provided because of the financial difficulties of the customer. Financial assets are impaired if there is objective evidence of impairment as a result of a loss event that occurred prior to the reporting date, and that loss event has had an impact, which can be reliably estimated, on the expected future cash flows of the individual asset or portfolio of assets.
Impaired loans comprise drawn facilities where the customer’s status is defined as impaired.
Individually assessed allowance for expected credit losses is assessed on a case-by-case basis for all individually managed impaired assets taking into consideration factors such as the realisable value of security (or other credit mitigants), the likely return available upon liquidation or bankruptcy, legal uncertainties, estimated costs involved in recovery, the market price of the exposure in secondary markets and the amount and timing of expected receipts and recoveries.
Interest rate risk in the banking book (IRRBB) relates to the potential adverse impact of changes in market interest rates on ANZ’s future net interest income. The risk generally arises from:
| 1. | Repricing and yield curve risk - the risk to earnings or market value as a result of changes in the overall level of interest rates and/or the relativity of these rates across the yield curve; |
| 2. | Basis risk - the risk to earnings or market value arising from volatility in the interest margin applicable to banking book items; and |
| 3. | Optionality risk - the risk to earnings or market value arising from the existence of stand-alone or embedded options in banking book items. |
Internationally comparable ratios are ANZ’s interpretation of the regulations documented in the Basel Committee publications: “Basel 3: A global regulatory framework for more resilient banks and banking systems” (June 2011) and “International Convergence of Capital Measurement and Capital Standards” (June 2006). They also include differences identified in APRA’s information paper entitled International Capital Comparison Study (13 July 2015).
Level 1 in the context of APRA supervision, Australia and New Zealand Banking Group Limited consolidated with certain approved subsidiaries.
Level 2 in the context of APRA supervision, the consolidated ANZ Group excluding associates, insurance and funds management entities, commercial non-financial entities and certain securitisation vehicles.
139
DEFINITIONS
Net interest margin is net interest income as a percentage of average interest earning assets.
Net loans and advances represent gross loans and advances less allowance for credit losses.
Net Stable Funding Ratio (NSFR) is the ratio of the amount of available stable funding (ASF) to the amount of required stable funding (RSF) defined by APRA. The amount of ASF is the portion of an Authorised Deposit-taking Institutions (ADI) capital and liabilities expected to be a reliable source of funds over a one year time horizon. The amount of RSF is a function of the liquidity characteristics and residual maturities of an ADI’s assets and off-balance sheet activities. ADIs must maintain an NSFR of at least 100%.
Net tangible assets equal share capital and reserves attributable to shareholders of the Company less unamortised intangible assets (including goodwill and software).
Regulatory deposits are mandatory reserve deposits lodged with local central banks in accordance with statutory requirements.
Restructured items comprise facilities in which the original contractual terms have been modified for reasons related to the financial difficulties of the customer. Restructuring may consist of reduction of interest, principal or other payments legally due, or an extension in maturity materially beyond those typically offered to new facilities with similar risk.
Return on average assets is the profit attributable to shareholders of the Company, divided by average total assets.
Return on average ordinary shareholders’ equity is the profit attributable to shareholders of the Company, divided by average ordinary shareholders’ equity.
Risk weighted assets (RWA) are risk weighted according to each asset’s inherent potential for default and what the likely losses would be in the case of default. In the case of non asset backed risks (i.e. market and operational risk), RWA is determined by multiplying the capital requirements for those risks by 12.5.
Settlement balances owed to/by ANZ represent financial assets and/or liabilities which are in the course of being settled. These may include trade dated assets and liabilities, vostro accounts and securities settlement accounts.
140
DEFINITIONS
| Description of divisions |
The Group operates on a divisional structure with five continuing divisions: Australia Retail and Commercial, Institutional, New Zealand, Pacific, and TSO and Group Centre.
Australia Retail and Commercial
Australia Retail and Commercial division comprises of the following business units.
| • | Retail provides products and services to consumer customers in Australia via the branch network, mortgage specialists, contact centres and a variety of self-service channels (internet banking, phone banking, ATMs, website, ANZ share investing and digital banking) and third party brokers in addition to financial planning services provided by salaried financial planners. |
| • | Commercial provides a full range of banking products and financial services, including asset financing, across the following customer segments: medium to large commercial customers and agribusiness customers across regional Australia, small business owners and high net worth individuals and family groups. |
Institutional
The Institutional division services governments, global institutional and corporate customers across three product sets: Transaction Banking, Loans & Specialised Finance and Markets.
| • | Transaction Banking provides working capital and liquidity solutions including documentary trade, supply chain financing, commodity financing as well as cash management solutions, deposits, payments and clearing. |
| • | Loans & Specialised Finance provides loan products, loan syndication, specialised loan structuring and execution, project and export finance, debt structuring and acquisition finance and corporate advisory. |
| • | Markets provide risk management services on foreign exchange, interest rates, credit, commodities and debt capital markets in addition to managing the Group’s interest rate exposure and liquidity position. |
New Zealand
The New Zealand division comprises the Retail and Commercial business units.
| • | Retail provides a full range of banking and wealth management services to consumer, private banking and small business banking customers. We deliver our services via our internet and app-based digital solutions and network of branches, mortgage specialists, relationship managers and contact centres. |
| • | Commercial provides a full range of banking services including traditional relationship banking and sophisticated financial solutions through dedicated managers focusing on privately owned medium to large enterprises, the agricultural business segment and governments. |
Pacific
The Pacific division provides products and services to retail customers, small to medium-sized enterprises, institutional customers and governments located in the Pacific Islands. Products and services include retail products provided to consumers, traditional relationship banking and sophisticated financial solutions provided to business customers through dedicated managers.
TSO and Group Centre
TSO and Group Centre division provide support to the operating divisions, including technology, group operations, shared services, property, risk management, financial management, strategy, marketing, human resources and corporate affairs. The Group Centre includes residual Asia Retail and Wealth, Group Treasury, Shareholder Functions and minority investments in Asia.
Refer to Note 12 for details on discontinued operations.
141
ASX APPENDIX 4D - CROSS REFERENCE INDEX
| Page | ||
| Details of the reporting period (4D Item 1) |
After front cover | |
| Results for Announcement to the Market (4D Item 2) |
After front cover | |
| Net Tangible Assets per security (4D Item 3) |
12 | |
| Details of entities over which control has been gained or lost (4D Item 4) |
118 | |
| Dividends and dividend dates (4D Item 5) |
After front cover | |
| Dividend Reinvestment Plan (4D Item 6) |
After front cover | |
| Details of associates and joint venture entities (4D Item 7) |
119 | |
142
ALPHABETICAL INDEX
| PAGE | ||||
| Appendix 4D Cross Reference Index |
142 | |||
| Appendix 4D Statement |
2 | |||
| Auditor’s Review Report and Independence Declaration |
124 | |||
| Average Balance Sheet and Related Interest |
132 | |||
| Basis of Preparation |
84 | |||
| Capital Management |
128 | |||
| Changes in Composition of the Group |
118 | |||
| Condensed Consolidated Balance Sheet |
81 | |||
| Condensed Consolidated Cash Flow Statement |
82 | |||
| Condensed Consolidated Income Statement |
79 | |||
| Condensed Consolidated Statement of Changes in Equity |
83 | |||
| Condensed Consolidated Statement of Comprehensive Income |
80 | |||
| Contingent Liabilities and Contingent Assets |
119 | |||
| Credit Risk |
109 | |||
| Definitions |
139 | |||
| Deposits and Other Borrowings |
103 | |||
| Derivative Financial Instruments |
137 | |||
| Directors’ Declaration |
122 | |||
| Directors’ Report |
78 | |||
| Discontinued Operations and Asset and Liabilities Held for Sale |
105 | |||
| Dividends |
95 | |||
| Divisional Results |
47 | |||
| Earnings Per Share |
96 | |||
| Exchange Rates |
136 | |||
| Fair Value Measurement |
114 | |||
| Full Time Equivalent Staff |
17 | |||
| Group Results |
19 | |||
| Income |
92 | |||
| Income Tax Expense |
94 | |||
| Investments In Associates |
119 | |||
| Net Loans and Advances |
99 | |||
| Operating Expenses |
93 | |||
| Profit Reconciliation |
71 | |||
| Allowance for Expected Credit Losses |
100 | |||
| Related Party Disclosures |
119 | |||
| Segment Analysis |
97 | |||
| Select Geographical Disclosures |
135 | |||
| Share Capital |
118 | |||
| Shareholders’ Equity |
118 | |||
| Subordinated Debt |
108 | |||
| Significant Events Since Balance Date |
120 | |||
| Summary |
7 | |||
143
ALPHABETICAL INDEX
THIS PAGE HAS BEEN LEFT BLANK INTENTIONALLY
144