Attached files
| file | filename |
|---|---|
| EX-99.1 - PRESS RELEASE - EXPRESS, INC. | exhibit991q12020earnin.htm |
| 8-K - 8-K - EXPRESS, INC. | expr-20200603.htm |

EXPRESS First Quarter 2020 Earnings
Cautionary Statement Regarding Forward-Looking Statements Forward Looking Statements: Certain statements are “forward-looking statements” made pursuant to the safe harbor provisions of the Private Securities Litigation Reform Act of 1995. Forward-looking statements include any statement that does not directly relate to any historical or current fact and include, but are not limited to (1) guidance and expectations, including statements regarding expected operating margins, comparable sales, effective tax rates, interest income, net income, diluted earnings per share, and capital expenditures, (2) statements regarding expected store openings, store closures, store conversions, and gross square footage, and (3) statements regarding the Company's strategy, plans, and initiatives, including, but not limited to, results expected from such strategy, plans, and initiatives. Forward-looking statements are based on our current expectations and assumptions, which may not prove to be accurate. These statements are not guarantees and are subject to risks, uncertainties, and changes in circumstances that are difficult to predict, and significant contingencies, many of which are beyond the Company's control. Many factors could cause actual results to differ materially and adversely from these forward-looking statements. Among these factors are (1) changes in consumer spending and general economic conditions; (2) the COVID-19 impact and its continued impact on our business operations, store traffic, employee availability, financial condition, liquidity and cash flow; (3) our ability to identify and respond to new and changing fashion trends, customer preferences, and other related factors; (4) fluctuations in our sales, results of operations, and cash levels on a seasonal basis and due to a variety of other factors, including our product offerings relative to customer demand, the mix of merchandise we sell, promotions, and inventory levels; (5) customer traffic at malls, shopping centers, and at our stores; (6) competition from other retailers; (7) our dependence on a strong brand image; (8) our ability to adapt to changing consumer behavior and develop and maintain a relevant and reliable omni-channel experience for our customers; (9) the failure or breach of information systems upon which we rely; (10) our ability to protect customer data from fraud and theft; (11) our dependence upon third parties to manufacture all of our merchandise; (12) changes in the cost of raw materials, labor, and freight; (13) supply chain or other business disruption, including as a result of the coronavirus; (14) our dependence upon key executive management; (15) our ability to execute our growth strategy, EXPRESSway Forward, including engaging our customers and acquiring new ones, executing with precision to accelerate sales and profitability, creating great product and reinvigorating our brand; (16) our substantial lease obligations; (17) our reliance on third parties to provide us with certain key services for our business; (18) impairment charges on long-lived assets; (19) claims made against us resulting in litigation or changes in laws and regulations applicable to our business; (20) our inability to protect our trademarks or other intellectual property rights which may preclude the use of our trademarks or other intellectual property around the world; (21) restrictions imposed on us under the terms of our asset-based loan facility, including restrictions on the ability to effect share repurchases; (22) changes in tax requirements, results of tax audits, and other factors that may cause fluctuations in our effective tax rate; (23) changes in tariff rates; and (24) natural disasters, extreme weather, public health issues, including pandemics, fire, acts of terrorism or war and other events that cause business interruption. Additional information concerning these and other factors can be found in Express, Inc.'s filings with the Securities and Exchange Commission. We undertake no obligation to publicly update or revise any forward-looking statement as a result of new information, future events, or otherwise, except as required by law. 2
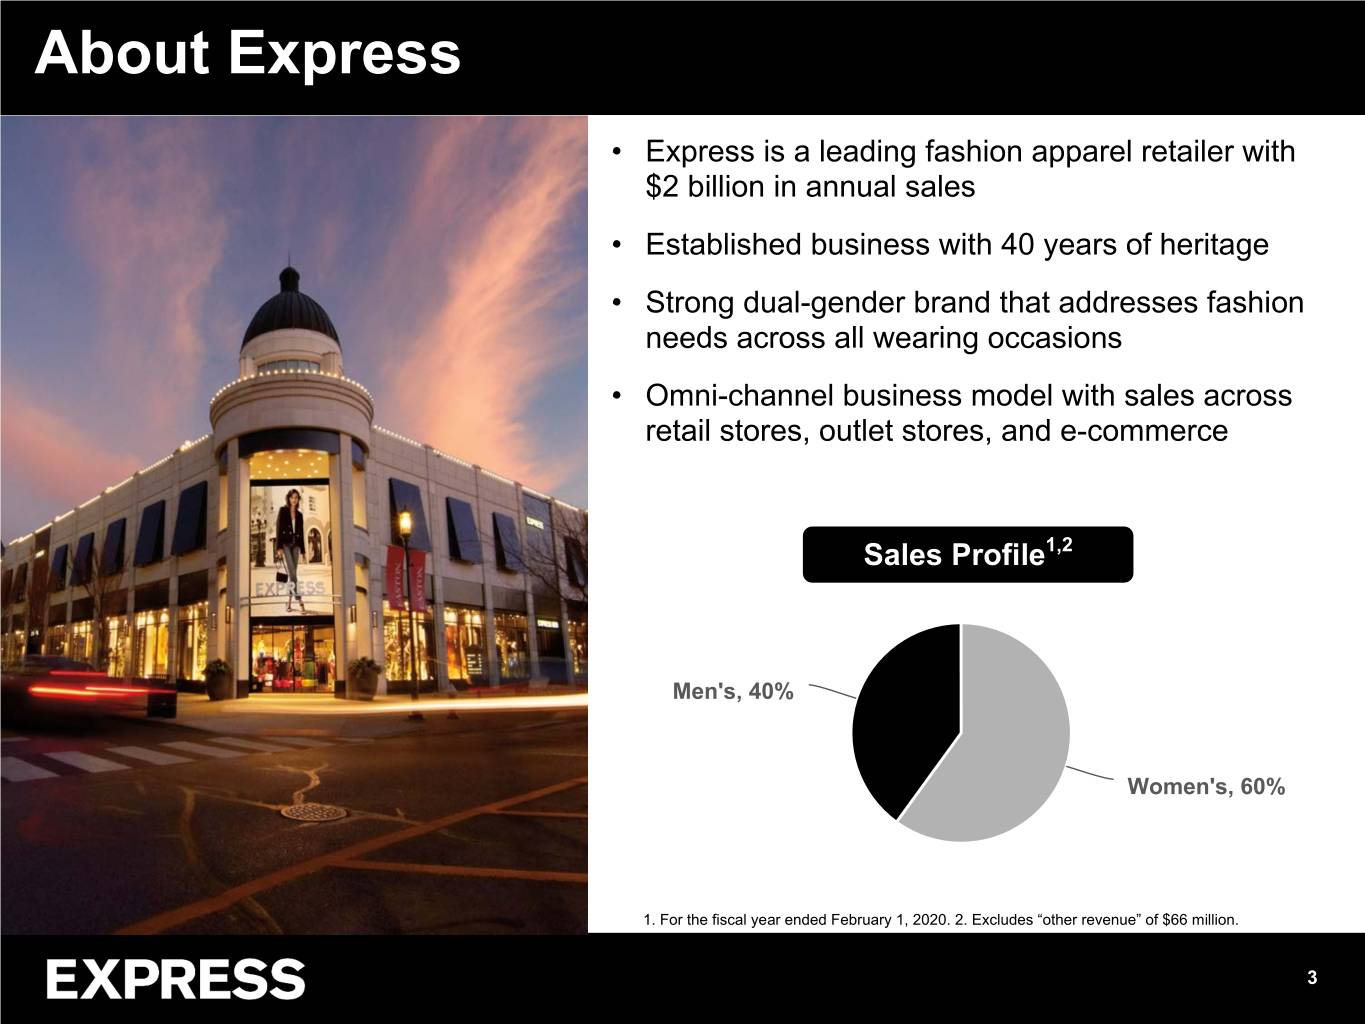
About Express • Express is a leading fashion apparel retailer with $2 billion in annual sales • Established business with 40 years of heritage • Strong dual-gender brand that addresses fashion needs across all wearing occasions • Omni-channel business model with sales across retail stores, outlet stores, and e-commerce Sales Profile1,2 Men's, 40% Women's, 60% 1. For the fiscal year ended February 1, 2020. 2. Excludes “other revenue” of $66 million. 3
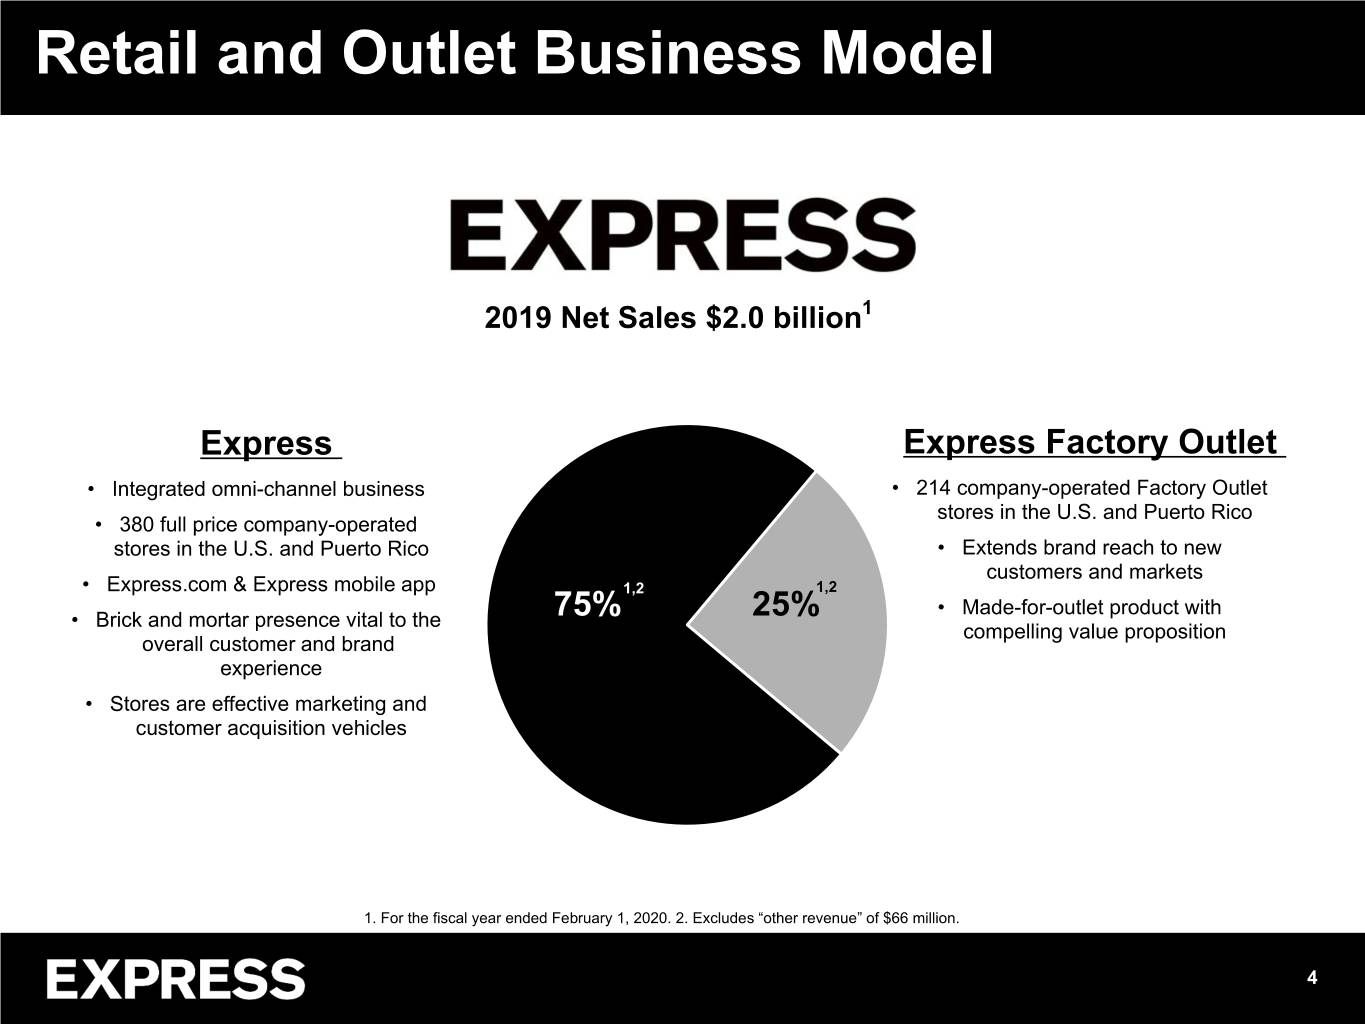
Retail and Outlet Business Model 2019 Net Sales $2.0 billion1 Express Express Factory Outlet • Integrated omni-channel business • 214 company-operated Factory Outlet stores in the U.S. and Puerto Rico • 380 full price company-operated stores in the U.S. and Puerto Rico • Extends brand reach to new customers and markets • Express.com & Express mobile app 1,2 1,2 • Made-for-outlet product with • Brick and mortar presence vital to the 75% 25% compelling value proposition overall customer and brand experience • Stores are effective marketing and customer acquisition vehicles 1. For the fiscal year ended February 1, 2020. 2. Excludes “other revenue” of $66 million. 4

Q1 2020 Results
COVID-19 LIQUIDITY ACTIONS • Total liquidity benefits of $385M in 2020 from the following actions: ◦ Accessed $165 million from its $250 million asset based credit facility ◦ Cut second quarter inventory receipts by over $100 million ◦ Identified cost savings of approximately $75 million dollars ◦ Lowered expected annual capital expenditures by $25 million ◦ Anticipated cash benefits in 2020 from the Coronavirus Aid Relief and Economic Security (CARES) Act of approximately $20 million • Additional significant cash benefits from the CARES Act are also expected to be realized in 2021 6
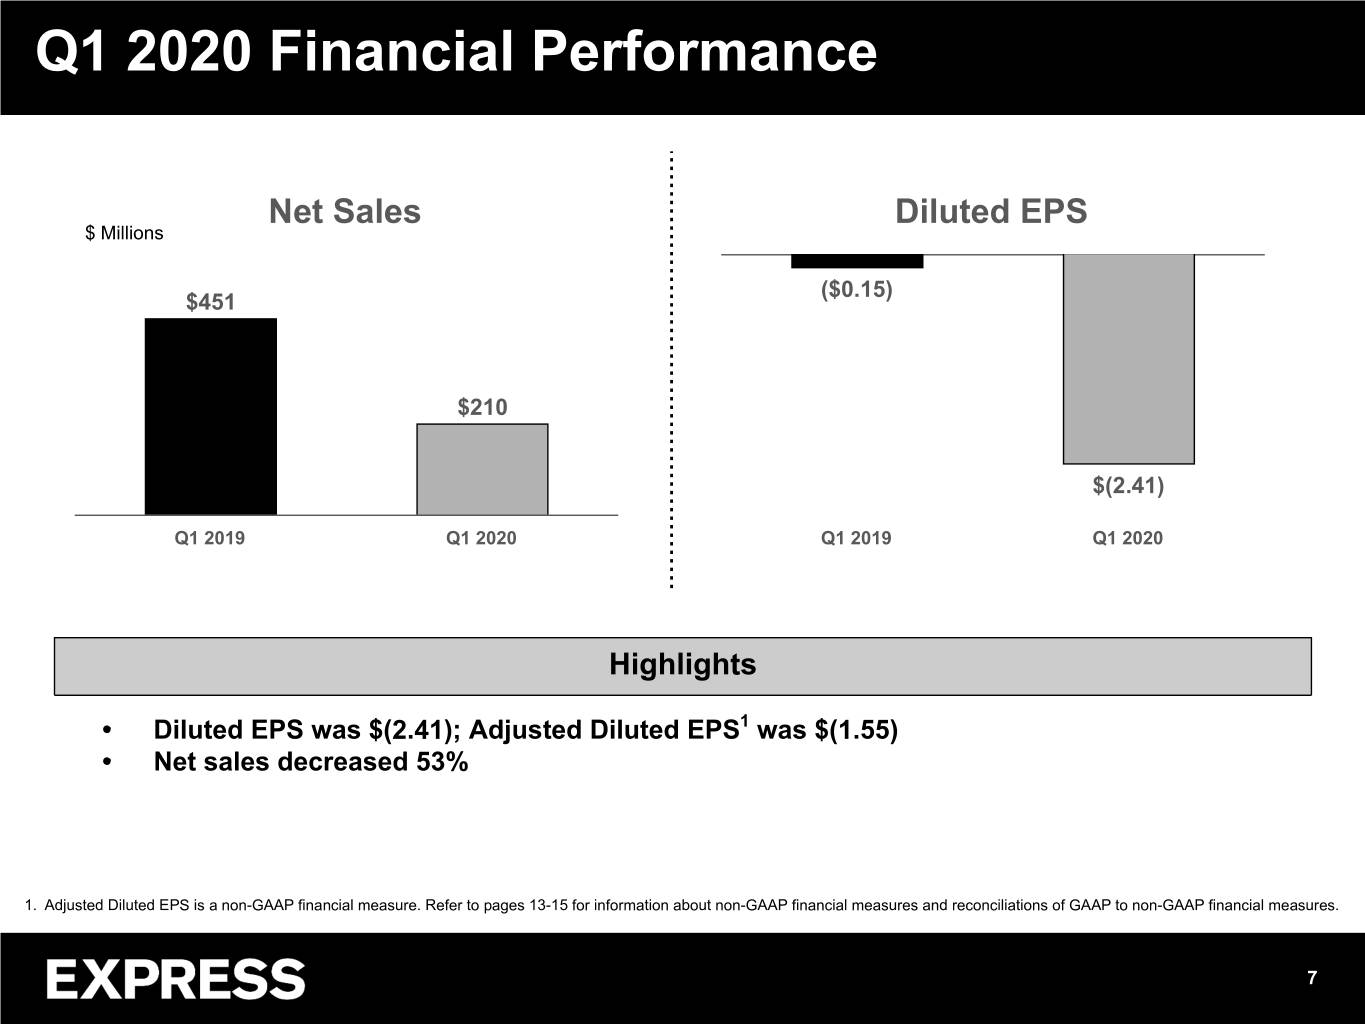
Q1 2020 Financial Performance Net Sales Diluted EPS $ Millions ($0.15) $451 $210 $(2.41) Q1 2019 Q1 2020 Q1 2019 Q1 2020 Highlights • Diluted EPS was $(2.41); Adjusted Diluted EPS1 was $(1.55) • Net sales decreased 53% 1. Adjusted Diluted EPS is a non-GAAP financial measure. Refer to pages 13-15 for information about non-GAAP financial measures and reconciliations of GAAP to non-GAAP financial measures. 7
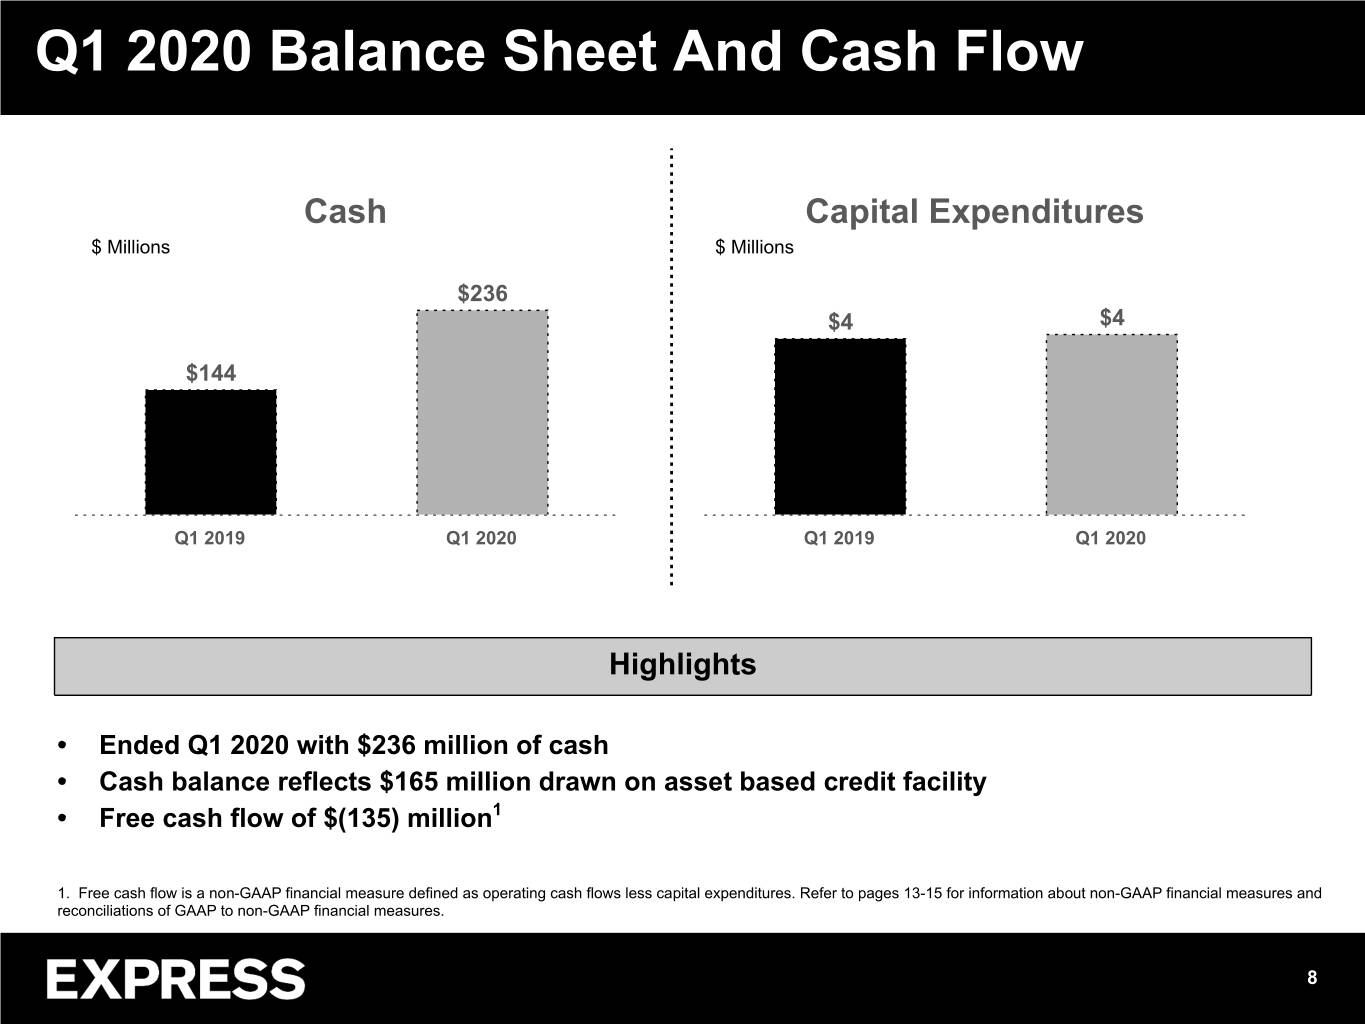
Q1 2020 Balance Sheet And Cash Flow Cash Capital Expenditures $ Millions $ Millions $236 $4 $4 $144 Q1 2019 Q1 2020 Q1 2019 Q1 2020 Highlights • Ended Q1 2020 with $236 million of cash • Cash balance reflects $165 million drawn on asset based credit facility • Free cash flow of $(135) million1 1. Free cash flow is a non-GAAP financial measure defined as operating cash flows less capital expenditures. Refer to pages 13-15 for information about non-GAAP financial measures and reconciliations of GAAP to non-GAAP financial measures. 8

2020 Financial Guidance
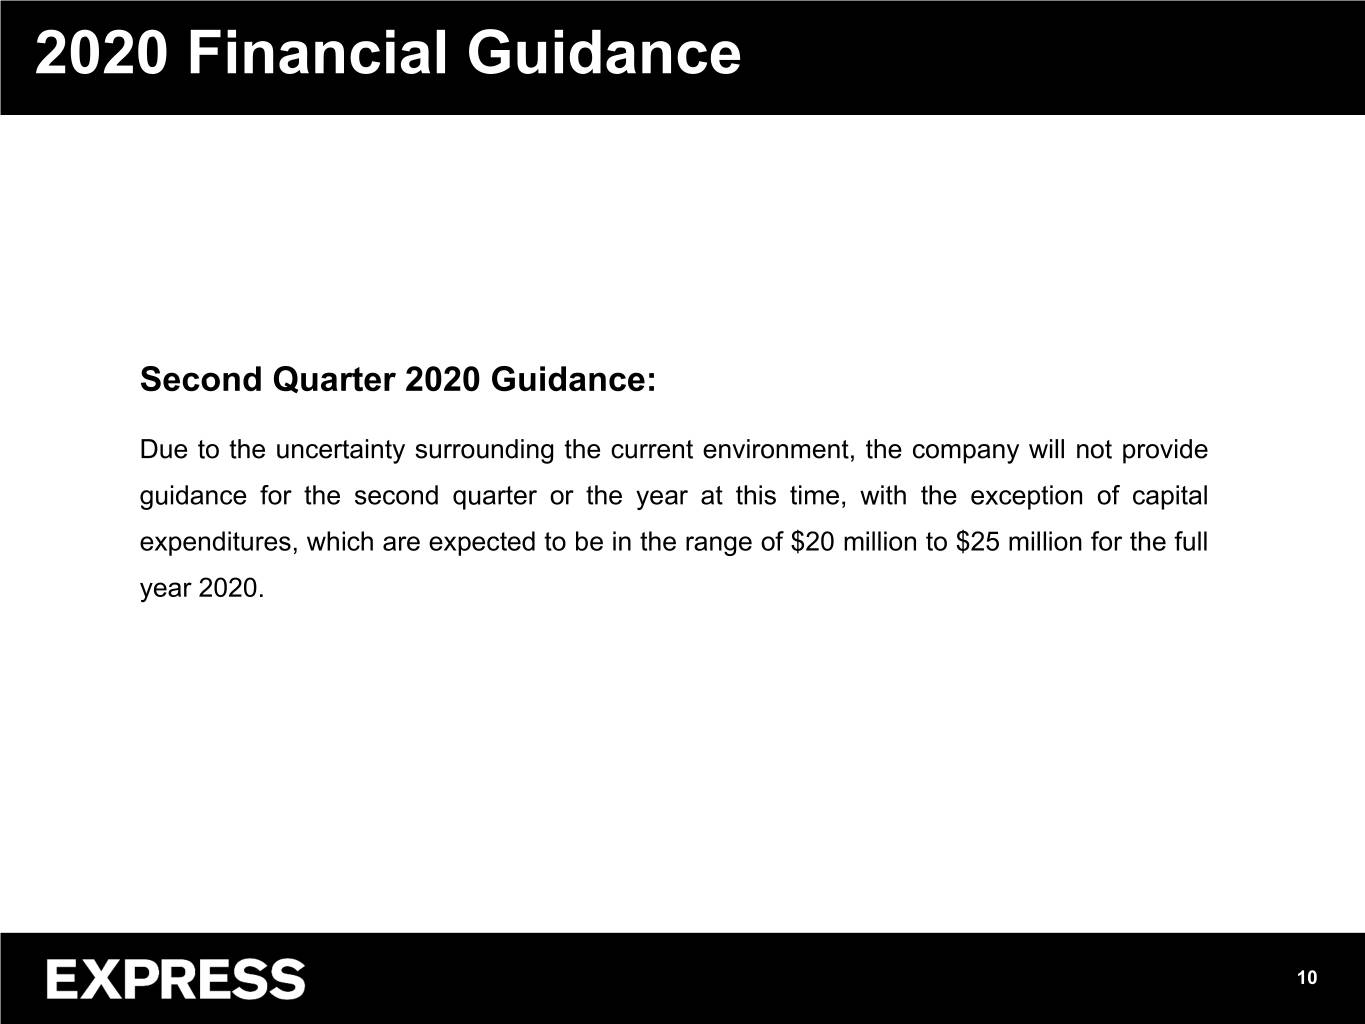
2020 Financial Guidance Second Quarter 2020 Guidance: Due to the uncertainty surrounding the current environment, the company will not provide guidance for the second quarter or the year at this time, with the exception of capital expenditures, which are expected to be in the range of $20 million to $25 million for the full year 2020. 10
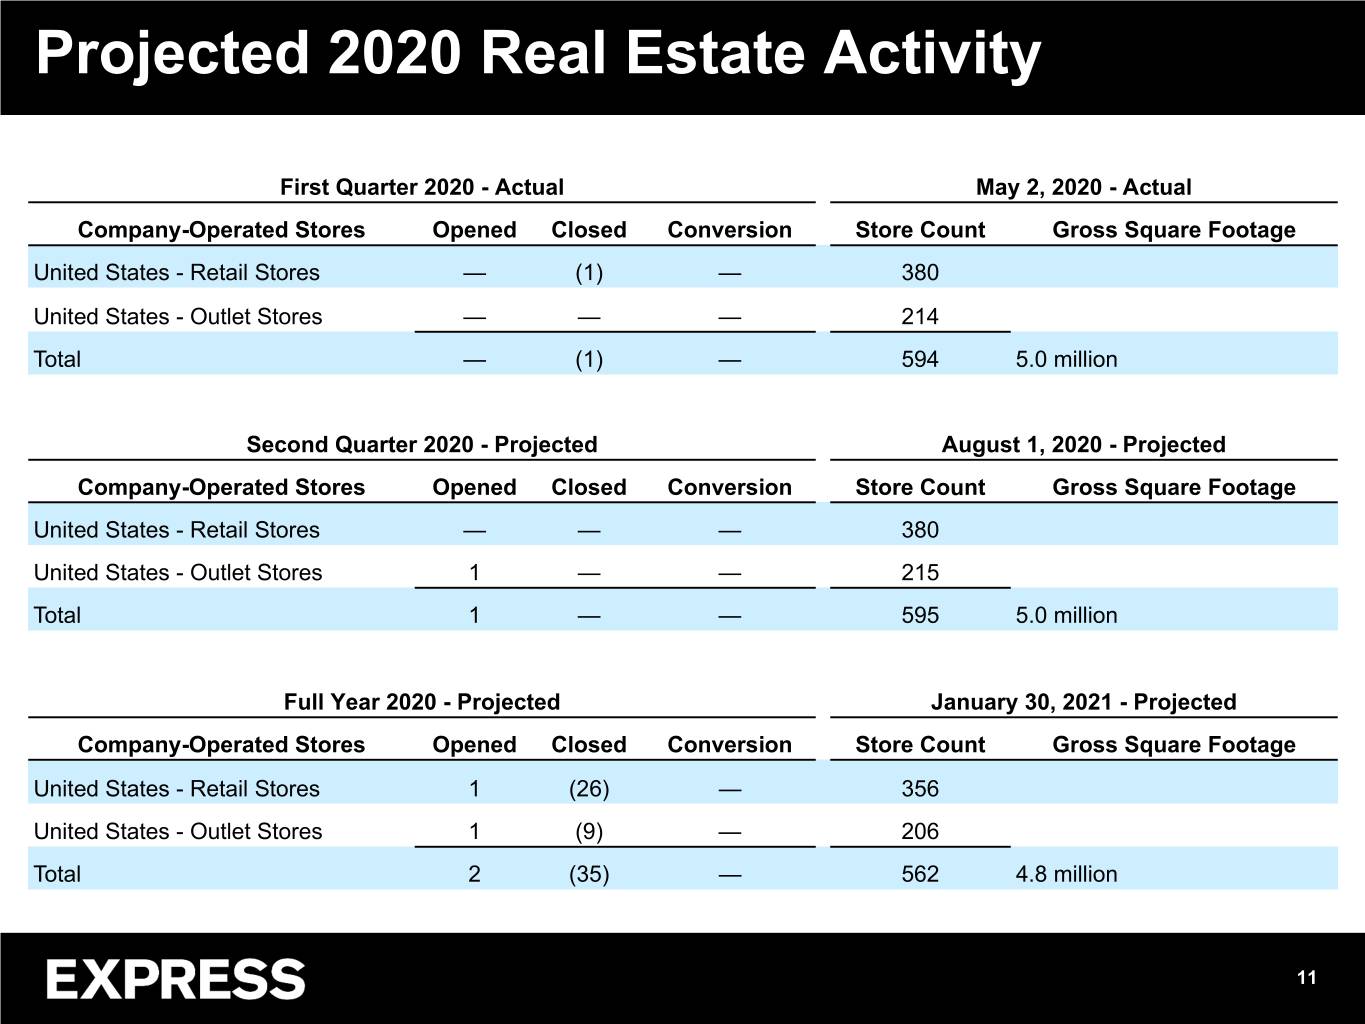
Projected 2020 Real Estate Activity First Quarter 2020 - Actual May 2, 2020 - Actual Company-Operated Stores Opened Closed Conversion Store Count Gross Square Footage United States - Retail Stores — (1) — 380 United States - Outlet Stores —— — 214 Total — (1) — 594 5.0 million Second Quarter 2020 - Projected August 1, 2020 - Projected Company-Operated Stores Opened Closed Conversion Store Count Gross Square Footage United States - Retail Stores —— — 380 United States - Outlet Stores 1 — — 215 Total 1 — — 595 5.0 million Full Year 2020 - Projected January 30, 2021 - Projected Company-Operated Stores Opened Closed Conversion Store Count Gross Square Footage United States - Retail Stores 1 (26) — 356 United States - Outlet Stores 1 (9) — 206 Total 2 (35) — 562 4.8 million 11

Non-GAAP Reconciliations
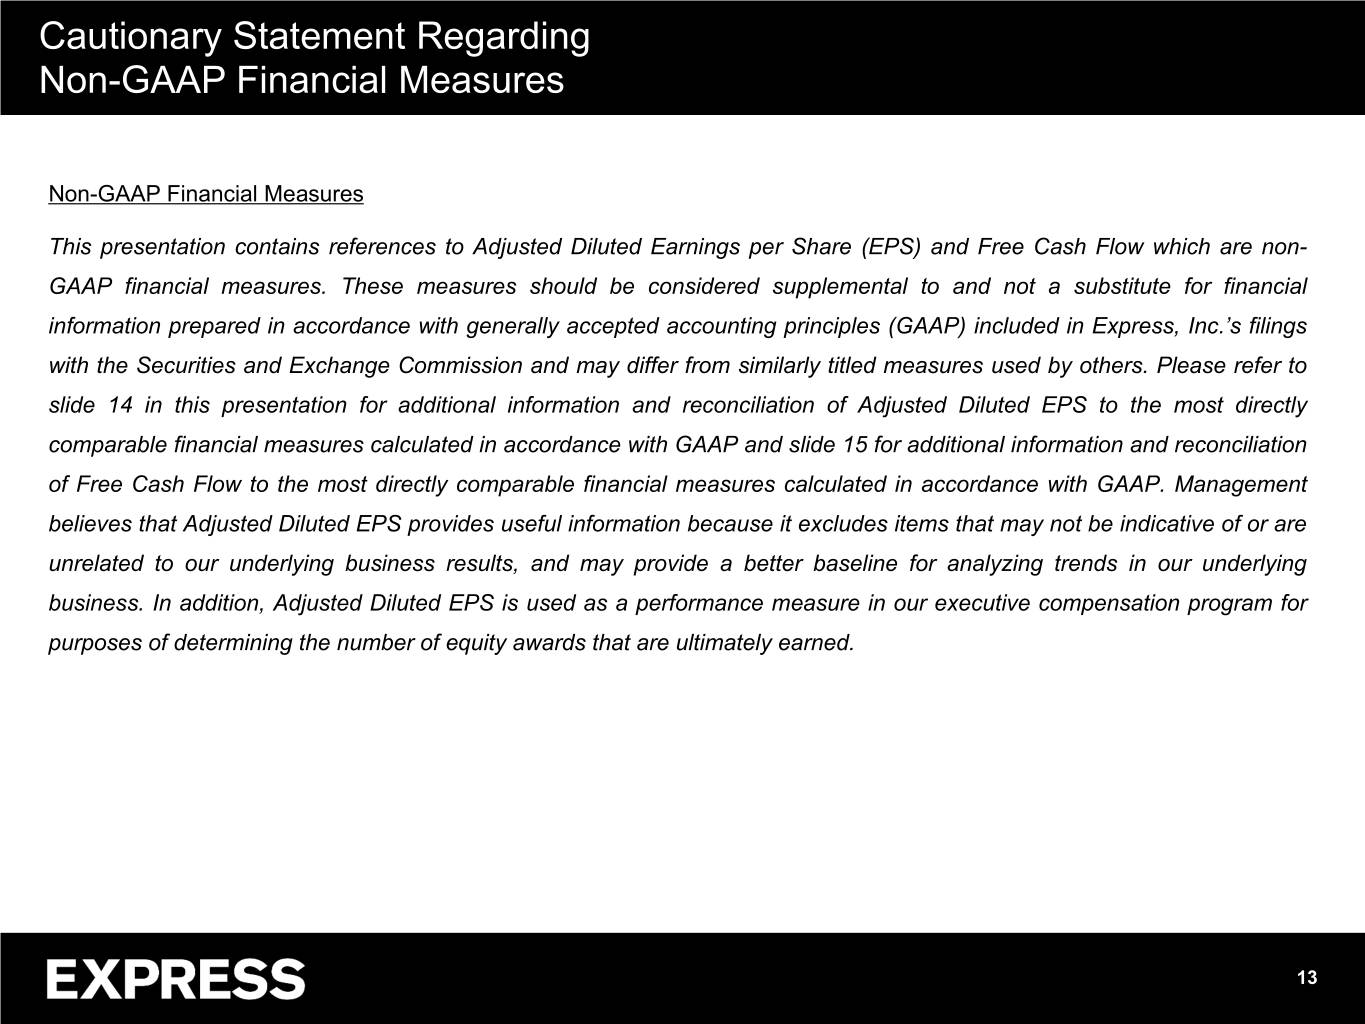
Cautionary Statement Regarding Non-GAAP Financial Measures Non-GAAP Financial Measures This presentation contains references to Adjusted Diluted Earnings per Share (EPS) and Free Cash Flow which are non- GAAP financial measures. These measures should be considered supplemental to and not a substitute for financial information prepared in accordance with generally accepted accounting principles (GAAP) included in Express, Inc.’s filings with the Securities and Exchange Commission and may differ from similarly titled measures used by others. Please refer to slide 14 in this presentation for additional information and reconciliation of Adjusted Diluted EPS to the most directly comparable financial measures calculated in accordance with GAAP and slide 15 for additional information and reconciliation of Free Cash Flow to the most directly comparable financial measures calculated in accordance with GAAP. Management believes that Adjusted Diluted EPS provides useful information because it excludes items that may not be indicative of or are unrelated to our underlying business results, and may provide a better baseline for analyzing trends in our underlying business. In addition, Adjusted Diluted EPS is used as a performance measure in our executive compensation program for purposes of determining the number of equity awards that are ultimately earned. 13
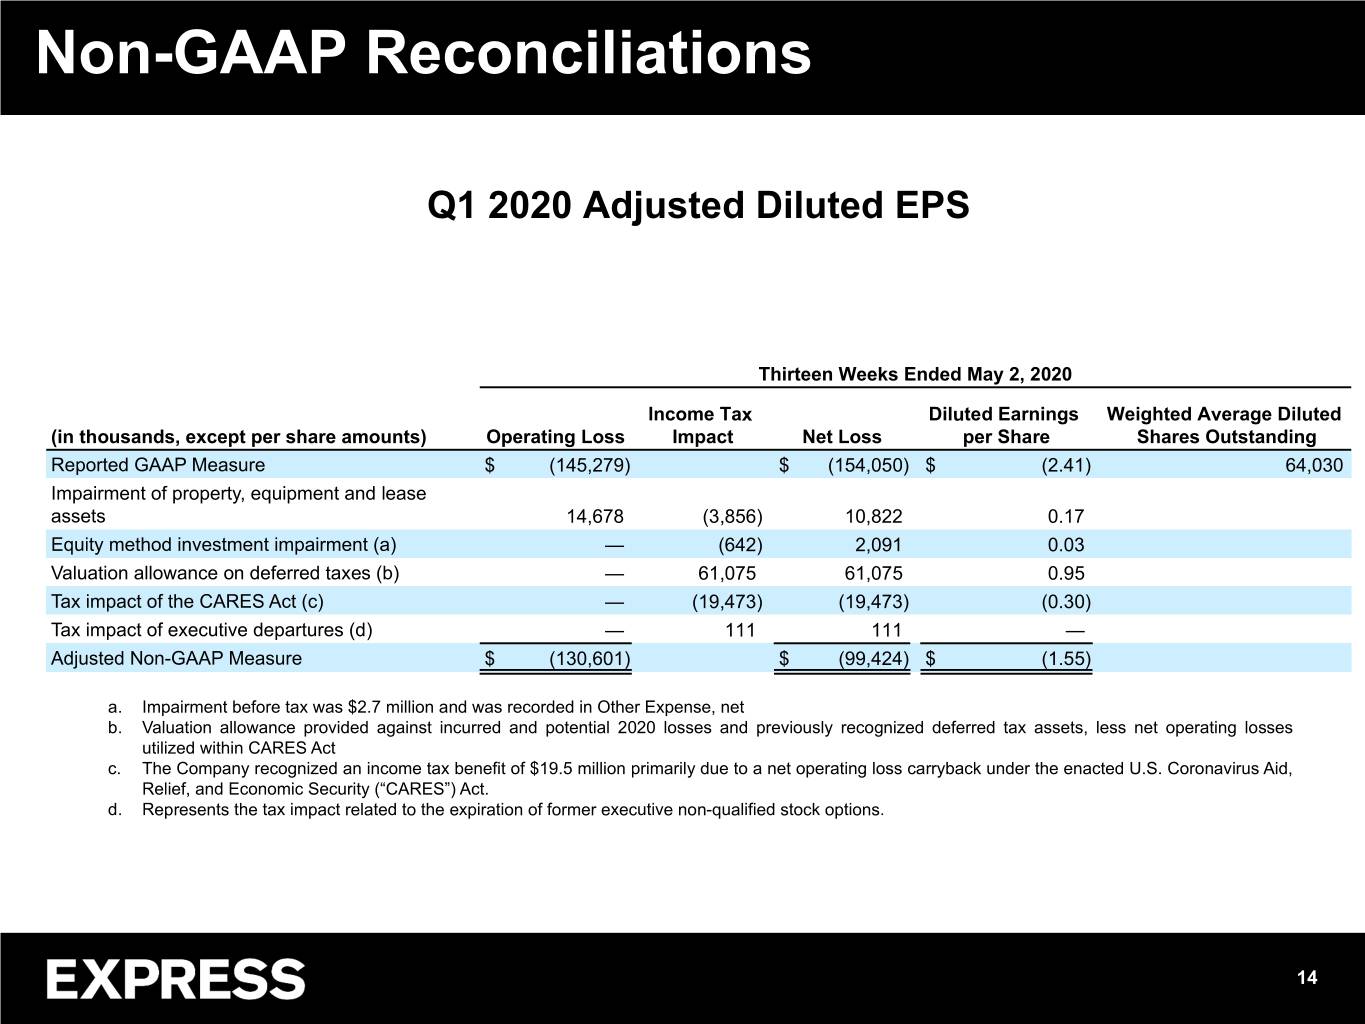
Non-GAAP Reconciliations Q1 2020 Adjusted Diluted EPS Thirteen Weeks Ended May 2, 2020 Income Tax Diluted Earnings Weighted Average Diluted (in thousands, except per share amounts) Operating Loss Impact Net Loss per Share Shares Outstanding Reported GAAP Measure $ (145,279) $ (154,050) $ (2.41) 64,030 Impairment of property, equipment and lease assets 14,678 (3,856) 10,822 0.17 Equity method investment impairment (a) — (642) 2,091 0.03 Valuation allowance on deferred taxes (b) — 61,075 61,075 0.95 Tax impact of the CARES Act (c) — (19,473) (19,473) (0.30) Tax impact of executive departures (d) — 111 111 — Adjusted Non-GAAP Measure $ (130,601) $ (99,424) $ (1.55) a. Impairment before tax was $2.7 million and was recorded in Other Expense, net b. Valuation allowance provided against incurred and potential 2020 losses and previously recognized deferred tax assets, less net operating losses utilized within CARES Act c. The Company recognized an income tax benefit of $19.5 million primarily due to a net operating loss carryback under the enacted U.S. Coronavirus Aid, Relief, and Economic Security (“CARES”) Act. d. Represents the tax impact related to the expiration of former executive non-qualified stock options. 14
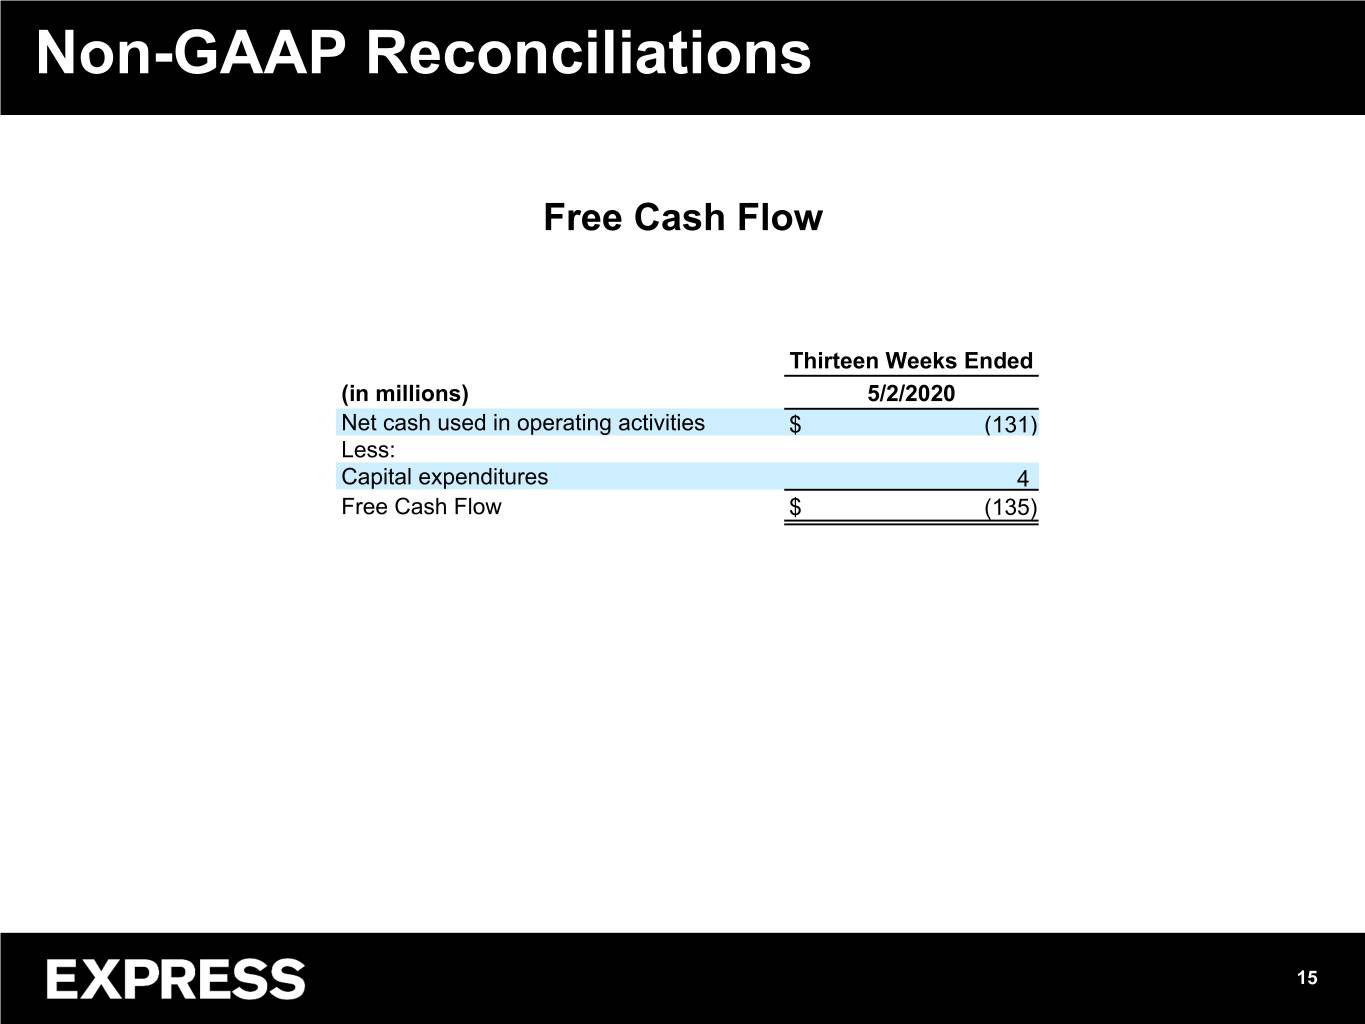
Non-GAAP Reconciliations Free Cash Flow Thirteen Weeks Ended (in millions) 5/2/2020 Net cash used in operating activities $ (131) Less: Capital expenditures 4 Free Cash Flow $ (135) 15

