Attached files
| file | filename |
|---|---|
| 8-K - FORM 8-K - US Ecology, Inc. | usecology_i8k.htm |
Exhibit 99.1

1 June 2020 Investor Presentation

2 Safe Harbor These slides contain (and the accompanying oral discussion will contain) “forward - looking statements” within the meaning of the Private Securities Litigation Reform Act of 1995 . Forward looking statements are only predictions and are not guarantees of performance . These statements are based on management’s beliefs and assumptions, which in turn are based on currently available information . Important assumptions include, among others, those regarding demand for the Company’s services, expansion of service offerings geographically or through new or expanded service lines, the timing and cost of planned capital expenditures, competitive conditions and general economic conditions . These assumptions could prove inaccurate . Forward looking statements also involve known and unknown risks and uncertainties, which could cause actual results to differ materially from those contained in any forward - looking statement . Many of these factors are beyond our ability to control or predict . Such factors include developments related to the COVID - 19 pandemic, fluctuations in commodity markets related to our business, the integration of NRC’s operations, the loss or failure to renew significant contracts, competition in our markets, adverse economic conditions, our compliance with applicable laws and regulations, potential liability in connection with providing oil spill response services and waste disposal services, the effect of existing or future laws and regulations related to greenhouse gases and climate change, the effect of our failure to comply with U . S . or foreign anti - bribery laws, the effect of compliance with laws and regulations, an accident at one of our facilities, incidents arising out of the handling of dangerous substances, our failure to maintain an acceptable safety record, our ability to perform under required contracts, limitations on our available cash flow as a result of our indebtedness, liabilities arising from our participation in multi - employer pension plans, the effect of changes in the method of determining the London Interbank Offered Rate (“LIBOR”) or the replacement thereto, risks associated with our international operations, the impact of changes to U . S . tariff and import and export regulations, a change in NRC’s classification as an Oil Spill Removal Organization, cyber security threats, unanticipated changes in tax rules and regulations, loss of key personnel, a deterioration in our labor relations or labor disputes, our reliance on third - party contractors to provide emergency response services, our access to insurance, surety bonds and other financial assurances, our litigation risk not covered by insurance, the replacement of non - recurring event projects, our ability to permit and contract for timely construction of new or expanded disposal space, renewals of our operating permits or lease agreements with regulatory bodies, our access to cost - effective transportation services, lawsuits, our implementation of new technologies, fluctuations in foreign currency markets and foreign affairs, our integration of acquired businesses, our ability to pay dividends or repurchase stock, anti - takeover regulations, stock market volatility, the failure of the warrants to be in the money or their expiration worthless and risks related to our compliance with maritime regulations (including the Jones Act) . Except as required by applicable law, including the securities laws of the United States and the rules and regulations of the Securities and Exchange Commission (the “SEC”), we are under no obligation to publicly update or revise any forward looking statements, whether as a result of new information, future events or otherwise . You should not place undue reliance on our forward - looking statements . Although we believe that the expectations reflected in forward looking statements are reasonable, we cannot guarantee future results or performance . Such statements involve known and unknown risks, uncertainties and other factors that could cause the actual results of the Company to differ materially from the results implied by such statements, including general economic and business conditions, conditions affecting the industries served by the Company and its subsidiaries, conditions affecting the Company’s customers, competitor responses to the Company’s products and services, the overall market acceptance of such products and services, the integration of acquisitions, and other factors disclosed in the Company’s periodic reports filed with the Securities and Exchange Commission (“SEC”) . We refer investors to review such factors in our 2019 Form 10 - K filed with the SEC on March 2 , 2020 . Such statements may include, but are not limited to, statements about the Company’s business outlook and financial guidance and other statements that are not historical facts including any statements, expectations or impacts of the COVID - 19 pandemic . Consequently such forward looking statements should be regarded as the Company’s current plans, estimates and beliefs . The Company does not undertake and specifically declines any obligation to publicly release the results of any revisions to these forward - looking statements that may be made to reflect any future events or circumstances after the date of such statements or to reflect the occurrence of anticipated or unanticipated events .

3 US Ecology Overview Vision: To be the premier provider of comprehensive environmental services. • Fully Integrated Environmental Services Provider • $11 Billion Hazardous Waste Market • $1 Billion Radioactive Waste • $14 Billion Field and Industrial Services • Highly Regulated Industry • Strategic Landfill Assets and Permitted Facilities • Broad Geographic Reach • Industry Expertise and Execution Track Record • Diverse, Blue Chip Customer Base across a Broad Range of Industries • High Proportion of Recurring Revenue Minimizes Economic Cycle Exposure • Meaningful Operating Leverage • Strong Balance Sheet with Financial Flexibility • Commitment to Health, Safety and the Environment • Drivers: Regulation, Industrial Economy, Government/ Superfund • Growing services business with cross selling opportunities • Pipeline of Organic Growth Initiatives • Pursue Selective, High Quality Strategic Acquisitions $25 Billion (1) Environmental Services Industry Considerable Barriers to Entry Positioned for Growth Strong Operational and Financial Metrics ( 1) Source: Environmental Business Journal, Volume XXIX October 2016
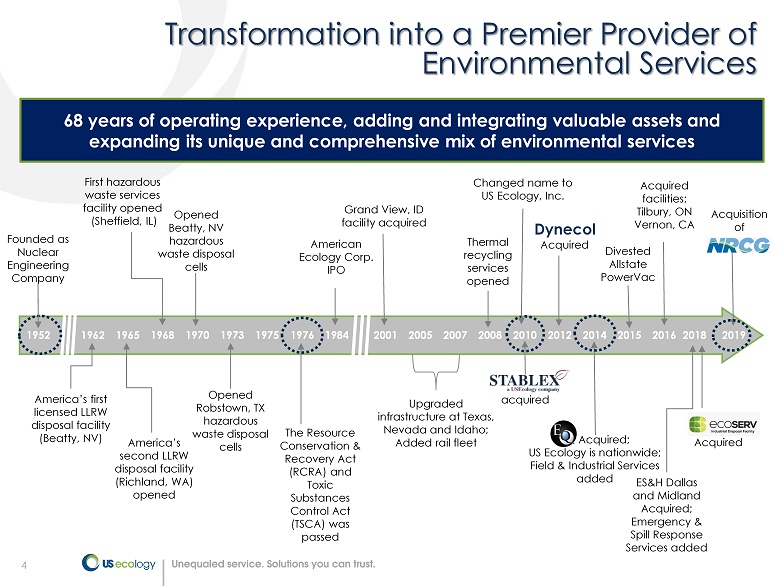
4 68 years of operating experience, adding and integrating valuable assets and expanding its unique and comprehensive mix of environmental services 4 acquired Grand View, ID facility acquired 2001 2008 Thermal recycling services opened 1984 1952 1965 Founded as Nuclear Engineering Company America’s second LLRW disposal facility ( Richland, WA) opened 1968 First hazardous waste services facility opened (Sheffield, IL) 1962 America’s first licensed LLRW disposal facility (Beatty, NV) 1973 Opened Robstown, TX hazardous waste disposal cells 2007 2005 Changed name to US Ecology, Inc. 2010 American Ecology Corp. IPO 1970 Opened Beatty, NV hazardous waste disposal cells 1975 1976 The Resource Conservation & Recovery Act (RCRA) and Toxic Substances Control Act (TSCA) was passed Upgraded infrastructure at Texas, Nevada and Idaho; Added rail fleet 2012 Acquired 2014 EQ Acquired; US Ecology is nationwide; Field & Industrial Services added 2018 Acquired facilities: Tilbury, ON Vernon, CA Divested Allstate PowerVac 2015 ES&H Dallas and Midland Acquired; Emergency & Spill Response Services added 2016 Acquired 2019 Acquisition of Transformation into a Premier Provider of Environmental Services Dynecol
5 NRC Transaction
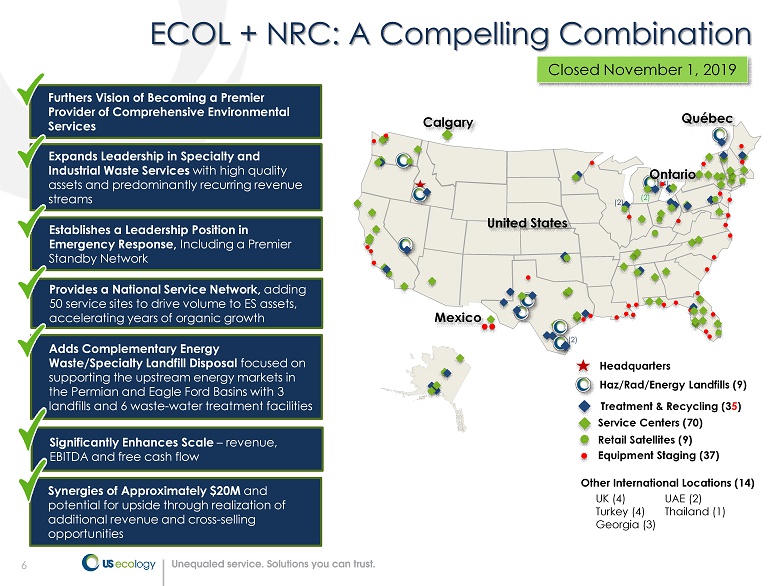
6 ECOL + NRC: A Compelling Combination (4) Mexico Québec (2) (2) United States (2) Ontario Equipment Staging (37) Haz/Rad/Energy Landfills (9) Treatment & Recycling (3 5 ) Service Centers (70) Headquarters Retail Satellites (9) Furthers Vision of Becoming a Premier Provider of Comprehensive Environmental Services Expands Leadership in Specialty and Industrial Waste Services with high quality assets and predominantly recurring revenue streams Establishes a Leadership Position in Emergency Response, Including a Premier Standby Network Significantly Enhances Scale – revenue, EBITDA and free cash flow Provides a National Service Network, adding 50 service sites to drive volume to ES assets, accelerating years of organic growth Adds Complementary Energy Waste/Specialty Landfill Disposal focused on supporting the upstream energy markets in the Permian and Eagle Ford Basins with 3 landfills and 6 waste - water treatment facilities Synergies of Approximately $20M and potential for upside through realization of additional revenue and cross - selling opportunities Calgary Other International Locations (14) UK (4) UAE (2) Turkey (4) Thailand (1) Georgia (3) Closed November 1, 2019
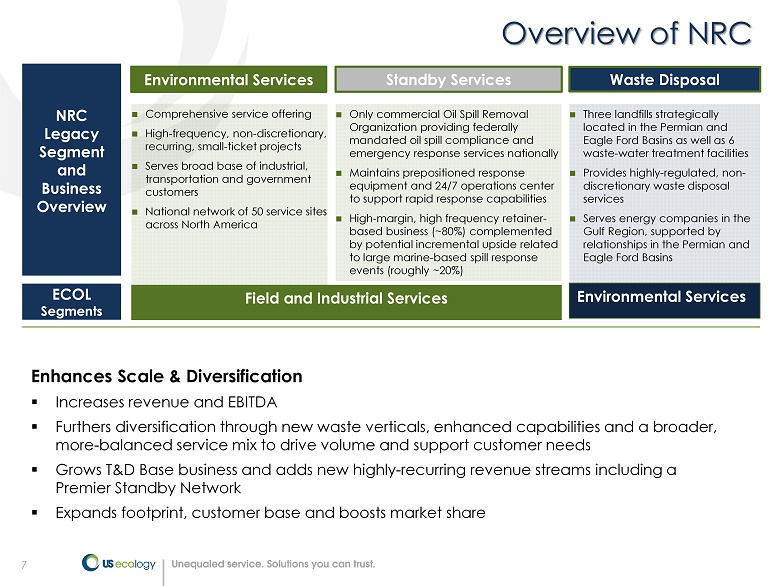
7 NRC Legacy Segment and Business Overview Comprehensive service offering High - frequency, non - discretionary, recurring, small - ticket projects Serves broad base of industrial, transportation and government customers National network of 50 service sites across North America Three landfills strategically located in the Permian and Eagle Ford Basins as well as 6 waste - water treatment facilities Provides highly - regulated, non - discretionary waste disposal services Serves energy companies in the Gulf Region, supported by relationships in the Permian and Eagle Ford Basins Only commercial Oil Spill Removal Organization providing federally mandated oil spill compliance and emergency response services nationally Maintains prepositioned response equipment and 24/7 operations center to support rapid response capabilities High - margin, high frequency retainer - based business (~80%) complemented by potential incremental upside related to large marine - based spill response events (roughly ~20%) Overview of NRC Environmental Services Waste Disposal Standby Services ECOL Segments Field and Industrial Services Environmental Services Enhances Scale & Diversification ▪ Increases revenue and EBITDA ▪ Furthers diversification through new waste verticals, enhanced capabilities and a broader, more - balanced service mix to drive volume and support customer needs ▪ Grows T&D Base business and adds new highly - recurring revenue streams including a Premier Standby Network ▪ Expands footprint, customer base and boosts market share

8 ▪ Diverse base of blue - chip customers, with over 12,000 commercial and government entities ▪ Top 20 customers account for only 21% of revenue ▪ Strong customer retention and tenure Select ES Customers Select NRC Customers Direct Indirect Minimal Customer Concentration and Overlap Select FIS Customers

9 Company Overview
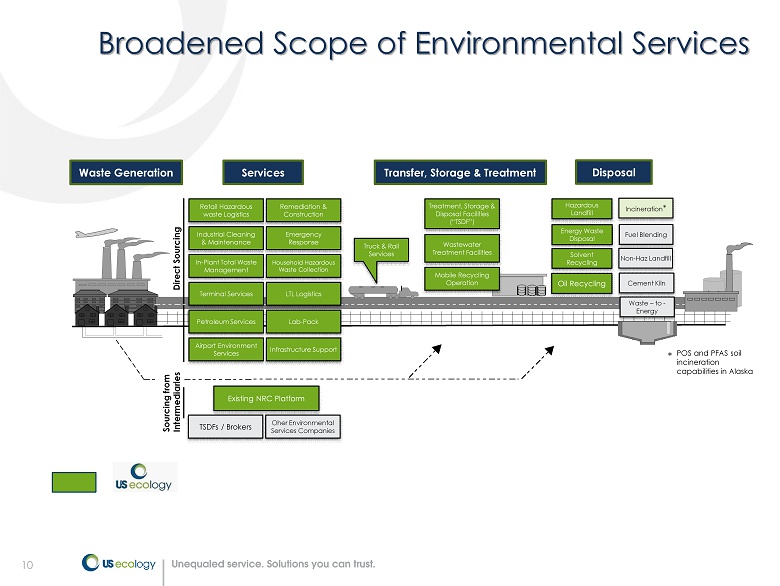
10 Broadened Scope of Environmental Services Waste Generation Services Transfer, Storage & Treatment Disposal Retail Hazardous waste Logistics Industrial Cleaning & Maintenance In - Plant Total Waste Management Terminal Services Petroleum Services Airport Environment Services Remediation & Construction Emergency Response Household Hazardous Waste Collection LTL Logistics Lab - Pack Infrastructure Support TSDFs / Brokers Oher Environmental Services Companies Truck & Rail Services Treatment, Storage & Disposal Facilities (“TSDF”) Wastewater Treatment Facilities Mobile Recycling Operation Hazardous Landfill Solvent Recycling Oil Recycling Waste – to - Energy Incineration * Fuel Blending Non - Haz Landfill Cement Kiln Direct Sourcing Sourcing from Intermediaries Energy Waste Disposal Existing NRC Platform POS and PFAS soil incineration capabilities in Alaska *
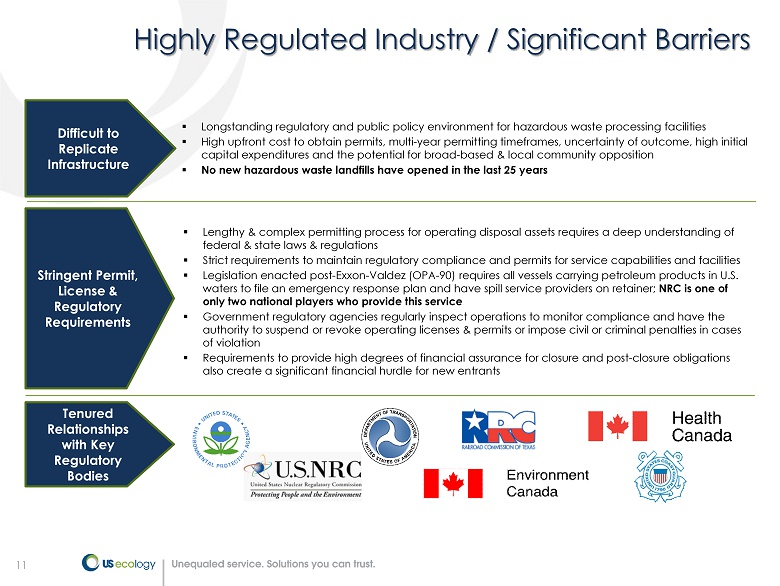
11 Highly Regulated Industry / Significant Barriers Stringent Permit, License & Regulatory Requirements ▪ Lengthy & complex permitting process for operating disposal assets requires a deep understanding of federal & state laws & regulations ▪ Strict requirements to maintain regulatory compliance and permits for service capabilities and facilities ▪ Legislation enacted post - Exxon - Valdez (OPA - 90) requires all vessels carrying petroleum products in U.S. waters to file an emergency response plan and have spill service providers on retainer; NRC is one of only two national players who provide this service ▪ Government regulatory agencies regularly inspect operations to monitor compliance and have the authority to suspend or revoke operating licenses & permits or impose civil or criminal penalties in cases of violation ▪ Requirements to provide high degrees of financial assurance for closure and post - closure obligations also create a significant financial hurdle for new entrants Difficult to Replicate Infrastructure ▪ Longstanding regulatory and public policy environment for hazardous waste processing facilities ▪ High upfront cost to obtain permits, multi - year permitting timeframes, uncertainty of outcome, high initial capital expenditures and the potential for broad - based & local community opposition ▪ No new hazardous waste landfills have opened in the last 25 years Tenured Relationships with Key Regulatory Bodies

12 Provides hazardous and non - hazardous materials management services at Company - owned/operated treatment and disposal facilities Services include waste disposal, treatment, recycling and transportation Key assets include: ― Hazardous waste landfills ― Commercially licensed radioactive waste landfill ― Treatment and Recycling facilities ― Energy waste landfills, wastewater treatment and related services 12 Field Services: Provides packaging, collection and waste management solutions at customer sites and our 10 - day storage facilities as well as emergency and spill response Small Quantity Generation (“SQG”) ― Retail Services ― LTL Collection ― Lab pack ― Household Hazardous Waste (“HHW”) Emergency Response Standby Services Total Waste Management Transportation and Logistics Remediation Industrial Services: Provides specialty cleaning, maintenance and excavation services at customers’ industrial sites as well as emergency response services and transportation. Cost center providing sales and administrative support across segments Segment Overview 1 See definition and reconciliation of Adjusted EBITDA and adjusted earnings per diluted share on pages 38 - 47 of this presentation 2 Includes NRC acquisition for the 2 months of ownership in 2019 Revenue: $453.1 million (66%) Adjusted EBITDA 1 : $187.8 million Adjusted EBITDA Margin: 41% Environmental Services (“ES”) Field & Industrial Services (“FIS”) Corporate 2019 Statistics for ES (2) Revenue: $232.4 million (34%) Adjusted EBITDA 1 : $26.7 million Adjusted EBITDA Margin: 11% 2019 Statistics for FIS (2) Adjusted EBITDA 1 : ($65.1 million) 2019 Statistics for Corporate (2)
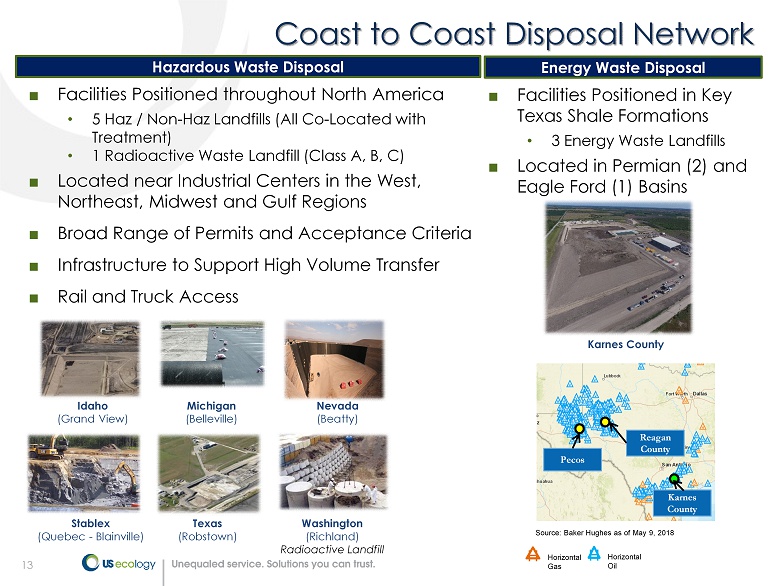
13 Coast to Coast Disposal Network ■ Facilities Positioned throughout North America • 5 Haz / Non - Haz Landfills (All Co - Located with Treatment) • 1 Radioactive Waste Landfill (Class A, B, C) ■ Located near Industrial Centers in the West, Northeast, Midwest and Gulf Regions ■ Broad Range of Permits and Acceptance Criteria ■ Infrastructure to Support High Volume Transfer ■ Rail and Truck Access Idaho (Grand View) Washington (Richland) Radioactive Landfill Michigan (Belleville) Nevada (Beatty) Texas (Robstown) Stablex (Quebec - Blainville) H Horizontal Gas H Horizontal Oil Reagan County Pecos Source: Baker Hughes as of May 9, 2018 Karnes County Hazardous Waste Disposal Energy Waste Disposal Karnes County ■ Facilities Positioned in Key Texas Shale Formations • 3 Energy Waste Landfills ■ Located in Permian (2) and Eagle Ford (1) Basins
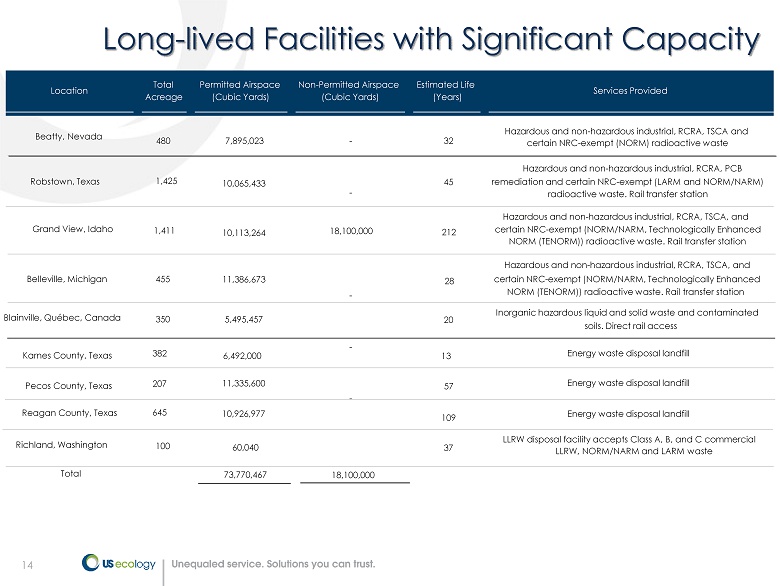
14 Long - lived Facilities with Significant Capacity Location Total Acreage Permitted Airspace (Cubic Yards) Non - Permitted Airspace (Cubic Yards) Estimated Life (Years) Services Provided Beatty, Nevada 480 7,895,023 - 32 Hazardous and non - hazardous industrial, RCRA, TSCA and certain NRC - exempt (NORM) radioactive waste Robstown, Texas 1,425 10,065,433 - 45 Hazardous and non - hazardous industrial, RCRA, PCB remediation and certain NRC - exempt (LARM and NORM/NARM) radioactive waste. Rail transfer station Grand View, Idaho 1,411 10,113,264 18,100,000 212 Hazardous and non - hazardous industrial, RCRA, TSCA, and certain NRC - exempt (NORM/NARM, Technologically Enhanced NORM (TENORM)) radioactive waste. Rail transfer station Belleville, Michigan 455 11,386,673 - 28 Hazardous and non - hazardous industrial, RCRA, TSCA, and certain NRC - exempt (NORM/NARM, Technologically Enhanced NORM (TENORM)) radioactive waste. Rail transfer station Blainville, Québec, Canada 350 5 ,495,457 - 20 Inorganic hazardous liquid and solid waste and contaminated soils. Direct rail access Richland, Washington 100 60,040 - 37 LLRW disposal facility accepts Class A, B, and C commercial LLRW, NORM/NARM and LARM waste Total 73,770,467 18,100,000 Karnes County, Texas Pecos County, Texas 207 382 6,492,000 13 11,335,600 5 7 Reagan County, Texas 645 10,926,977 109 Energy waste disposal landfill Energy waste disposal landfill Energy waste disposal landfill
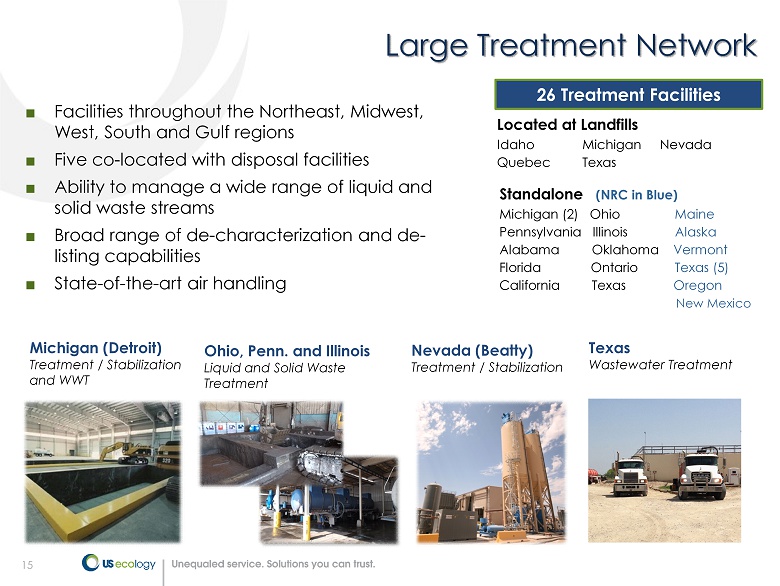
15 Large Treatment Network ■ Facilities throughout the Northeast, Midwest, West, South and Gulf regions ■ Five co - located with disposal facilities ■ Ability to manage a wide range of liquid and solid waste streams ■ Broad range of de - characterization and de - listing capabilities ■ State - of - the - art air handling 26 Treatment Facilities Located at Landfills Idaho Michigan Nevada Quebec Texas Standalone (NRC in Blue) Michigan (2) Ohio Maine Pennsylvania Illinois Alaska Alabama Oklahoma Vermont Florida Ontario Texas (5) California Texas Oregon New Mexico Michigan (Detroit) Treatment / Stabilization and WWT Ohio, Penn. and Illinois Liquid and Solid Waste Treatment Nevada (Beatty) Treatment / Stabilization Texas Wastewater Treatment

16 Recycling ■ Seven recovery / recycling operations in the Gulf, Midwest, Northeast and Southern Regions ■ Market Oriented Solutions: ▪ Thermal Desorption – Oil / Catalyst Recovery ▪ Solvent Distillation – Airline De - icing, Other Solvents ▪ Selective Precipitation – Valuable Metals Recovery Resource Recovery Glycol & NMP Solvent Recycling (MI) Two Airport Recovery Sites (MN & PA) Texas (Robstown) Thermal Recycling Pennsylvania (York) Ohio (Canton) Selective Precipitation Metals Recovery
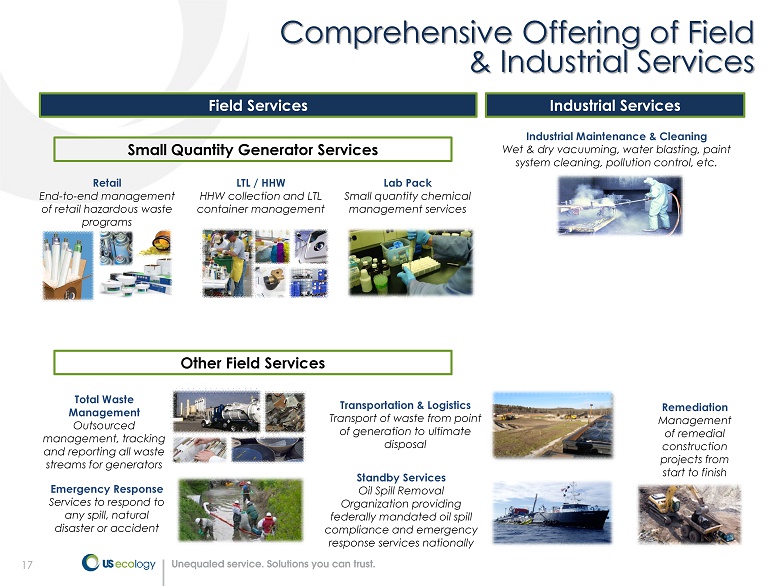
17 Comprehensive Offering of Field & Industrial Services Remediation Management of remedial construction projects from start to finish Retail End - to - end management of retail hazardous waste programs Transportation & Logistics Transport of waste from point of generation to ultimate disposal Lab Pack Small quantity chemical management services Total Waste Management Outsourced management, tracking and reporting all waste streams for generators LTL / HHW HHW collection and LTL container management Small Quantity Generator Services Other Field Services Emergency Response Services to respond to any spill, natural disaster or accident Field Services Industrial Services Industrial Maintenance & Cleaning Wet & dry vacuuming, water blasting, paint system cleaning, pollution control, etc. Standby Services Oil Spill Removal Organization providing federally mandated oil spill compliance and emergency response services nationally
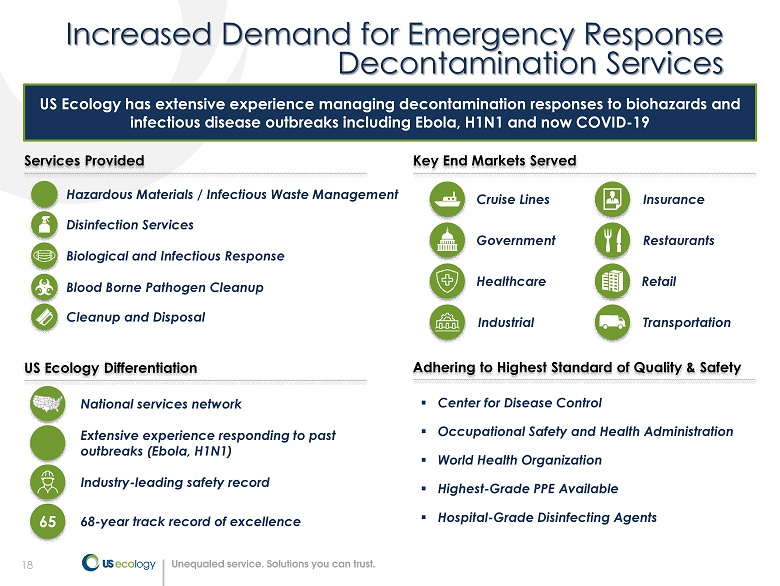
18 Increased Demand for Emergency Response Decontamination Services US Ecology has extensive experience managing decontamination responses to biohazards and infectious disease outbreaks including Ebola, H1N1 and now COVID - 19 Biological and Infectious Response Hazardous Materials / Infectious Waste Management Disinfection Services Blood Borne Pathogen Cleanup Cleanup and Disposal Services Provided Key End Markets Served Insurance Government Retail Restaurants Cruise Lines Transportation US Ecology Differentiation Adhering to Highest Standard of Quality & Safety 68 - year track record of excellence 65 National services network Extensive experience responding to past outbreaks (Ebola, H1N1) ▪ Center for Disease Control ▪ Occupational Safety and Health Administration ▪ World Health Organization ▪ Highest - Grade PPE Available ▪ Hospital - Grade Disinfecting Agents Healthcare Industry - leading safety record Industrial
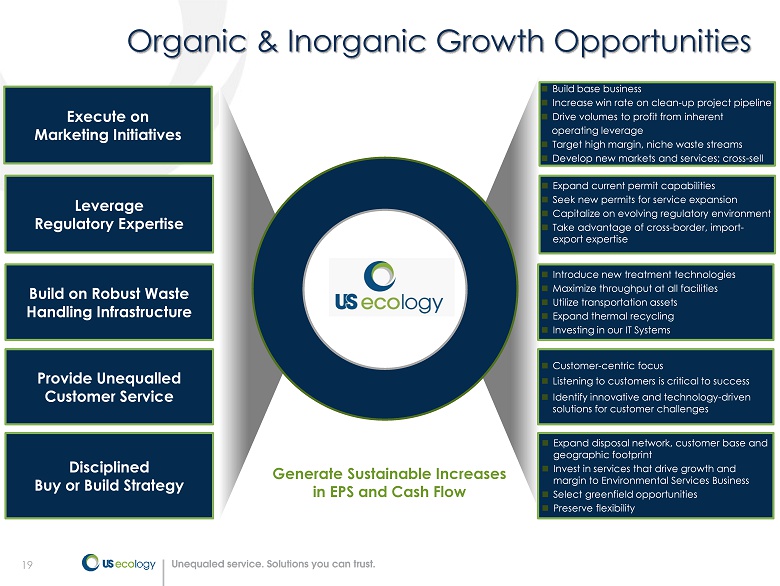
19 Organic & Inorganic Growth Opportunities Build on Robust Waste Handling Infrastructure Leverage Regulatory Expertise Provide Unequalled Customer Service Generate Sustainable Increases in EPS and Cash Flow Focus on High Value Waste Streams Build base business Increase win rate on clean - up project pipeline Drive volumes to profit from inherent operating leverage Target high margin, niche waste streams Develop new markets and services; cross - sell Expand current permit capabilities Seek new permits for service expansion Capitalize on evolving regulatory environment Take advantage of cross - border, import - export expertise Introduce new treatment technologies Maximize throughput at all facilities Utilize transportation assets Expand thermal recycling Investing in our IT Systems Customer - centric focus Listening to customers is critical to success Identify innovative and technology - driven solutions for customer challenges Disciplined Buy or Build Strategy Expand disposal network, customer base and geographic footprint Invest in services that drive growth and margin to Environmental Services Business Select greenfield opportunities Preserve flexibility Execute on Marketing Initiatives

20 Financial Overview
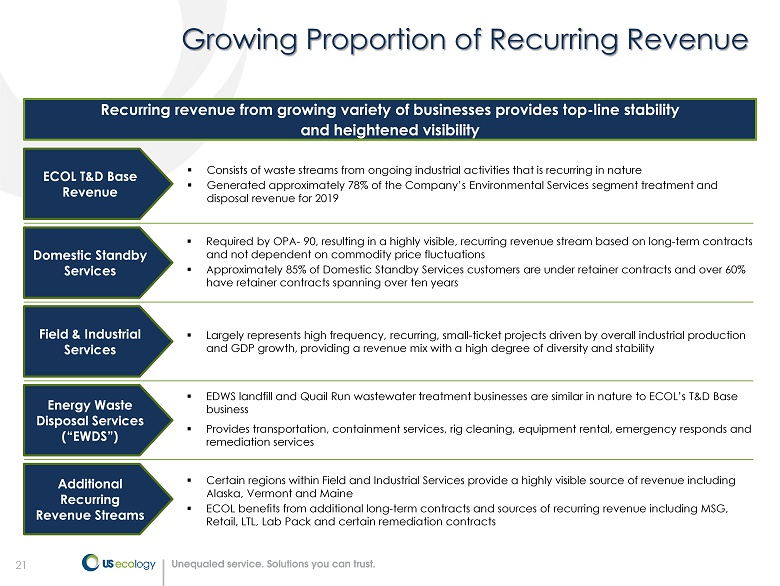
21 Growing Proportion of Recurring Revenue Recurring revenue from growing variety of businesses provides top - line stability and heightened visibility ECOL T&D Base Revenue ▪ Consists of waste streams from ongoing industrial activities that is recurring in nature ▪ Generated approximately 78% of the Company’s Environmental Services segment treatment and disposal revenue for 2019 Field & Industrial Services Domestic Standby Services Additional Recurring Revenue Streams ▪ Required by OPA - 90, resulting in a highly visible, recurring revenue stream based on long - term contracts and not dependent on commodity price fluctuations ▪ Approximately 85% of Domestic Standby Services customers are under retainer contracts and over 60% have retainer contracts spanning over ten years ▪ Largely represents high frequency, recurring, small - ticket projects driven by overall industrial production and GDP growth, providing a revenue mix with a high degree of diversity and stability ▪ Certain regions within Field and Industrial Services provide a highly visible source of revenue including Alaska, Vermont and Maine ▪ ECOL benefits from additional long - term contracts and sources of recurring revenue including MSG, Retail, LTL, Lab Pack and certain remediation contracts Energy Waste Disposal Services (“EWDS”) ▪ EDWS landfill and Quail Run wastewater treatment businesses are similar in nature to ECOL’s T&D Base business ▪ Provides transportation, containment services, rig cleaning, equipment rental, emergency responds and remediation services

22 56% 59% 61% 65% 60% 71% 75% 81% 78% 80% 78% 0% 10% 20% 30% 40% 50% 60% 70% 80% 90% $0 $100 $200 $300 $400 $500 2009 2010 2011 2012 2013 2014 2015 2016 2017 2018 2019 ES Base T&D ES Event T&D ES Transportation % ES Base/Recurring Building Our Recurring Revenue – Legacy USE Focus on Growing Base Business ■ Continued investment to grow base treatment & disposal (T&D) • Lean/Focused sales • Hybrid broker/Direct channel • Permit modifications • Infrastructure expansion ■ Positioned for event business (“Surge Capacity”) Note: Reflects the T&D revenue associated with acquisitions on an “as reported” basis. Stablex Acquisition EQ Acquisition
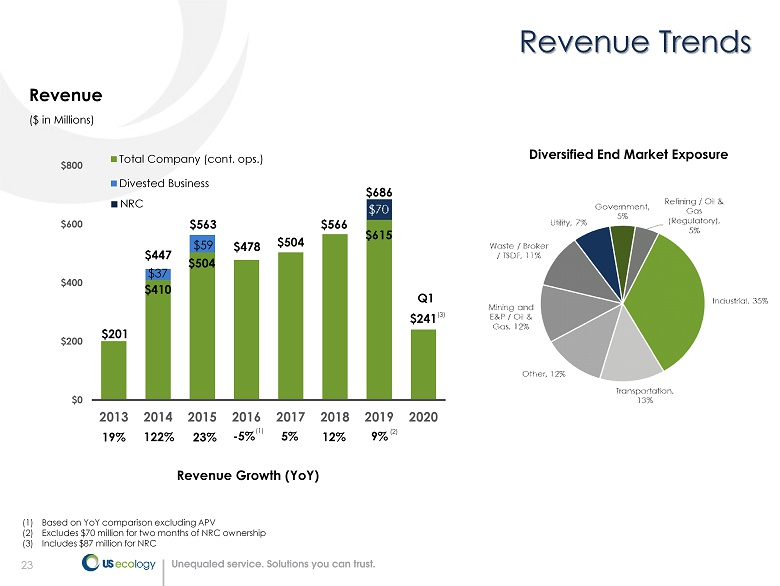
23 ($ in Millions) Revenue Growth (YoY) $201 $504 $566 $615 $241 $0 $200 $400 $600 $800 2013 2014 2015 2016 2017 2018 2019 2020 Total Company (cont. ops.) Divested Business Q1 Revenue 19% 122% 23% - 5% (1) Based on YoY comparison excluding APV (2) Excludes $70 million for two months of NRC ownership (3) Includes $87 million for NRC Revenue Trends $410 $37 $504 $59 $478 $447 $563 5% (1) 12% ■ NRC 9% (2) $686 Diversified End Market Exposure (3)
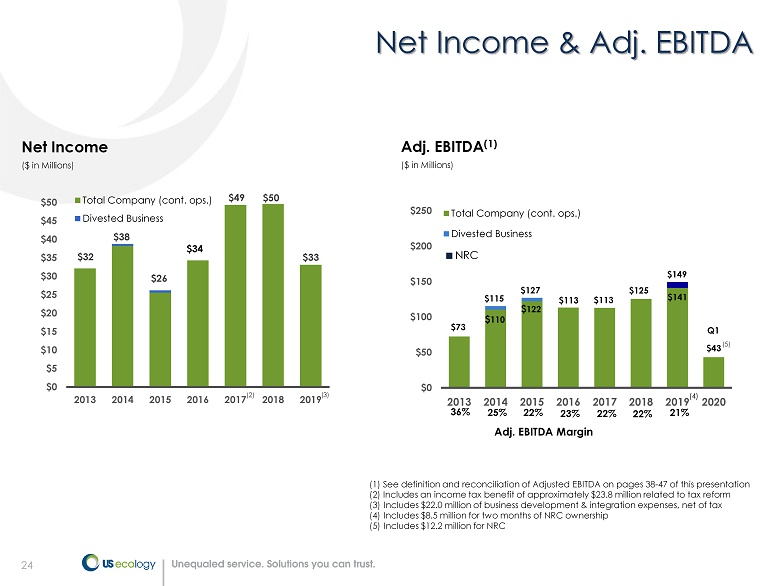
24 ($ in Millions) $32 $38 $26 $49 $50 $33 $0 $5 $10 $15 $20 $25 $30 $35 $40 $45 $50 2013 2014 2015 2016 2017 2018 2019 Total Company (cont. ops.) Divested Business Net Income Net Income & Adj. EBITDA (1) See definition and reconciliation of Adjusted EBITDA on pages 38 - 47 of this presentation (2) Includes an income tax benefit of approximately $23.8 million related to tax reform (3) Includes $22.0 million of business development & integration expenses, net of tax (4) Includes $8.5 million for two months of NRC ownership (5) Includes $12.2 million for NRC $73 $113 $125 $141 $43 $0 $50 $100 $150 $200 $250 2013 2014 2015 2016 2017 2018 2019 2020 Total Company (cont. ops.) Divested Business $ 110 $ 122 $149 ($ in Millions) Adj. EBITDA (1) 25% 22% 23% Adj. EBITDA Margin 36% (4) $34 $115 $127 (2) 22% $113 22% ■ NRC 21% (3) Q1 (5)
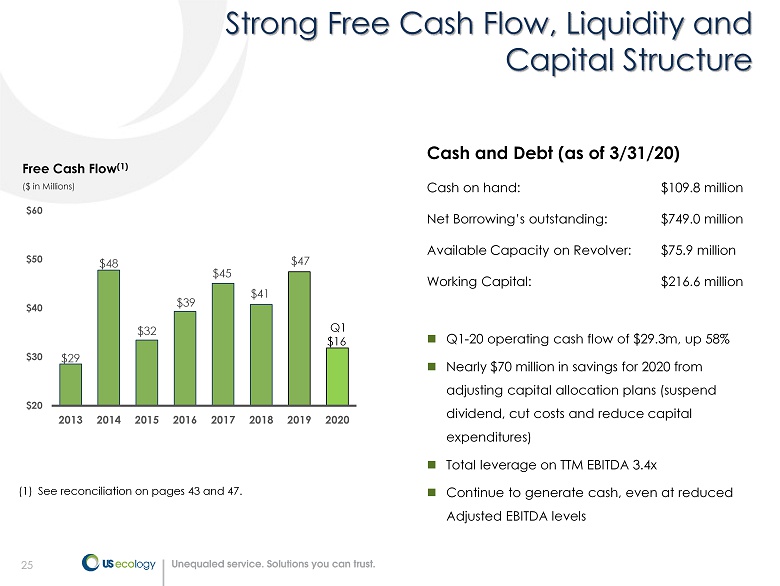
25 Strong Free Cash Flow, Liquidity and Capital Structure Cash on hand: $109.8 million Net Borrowing’s outstanding: $749.0 million Available Capacity on Revolver: $75.9 million Working Capital: $216.6 million Free Cash Flow (1) ($ in Millions) $29 $48 $32 $39 $45 $41 $47 $20 $30 $40 $50 $60 2013 2014 2015 2016 2017 2018 2019 2020 Q1 - 20 operating cash flow of $29.3m, up 58% Nearly $70 million in savings for 2020 from adjusting capital allocation plans (suspend dividend, cut costs and reduce capital expenditures) Total leverage on TTM EBITDA 3.4x Continue to generate cash, even at reduced Adjusted EBITDA levels Cash and Debt (as of 3/31/20) (1) See reconciliation on pages 43 and 47. Q1 $16
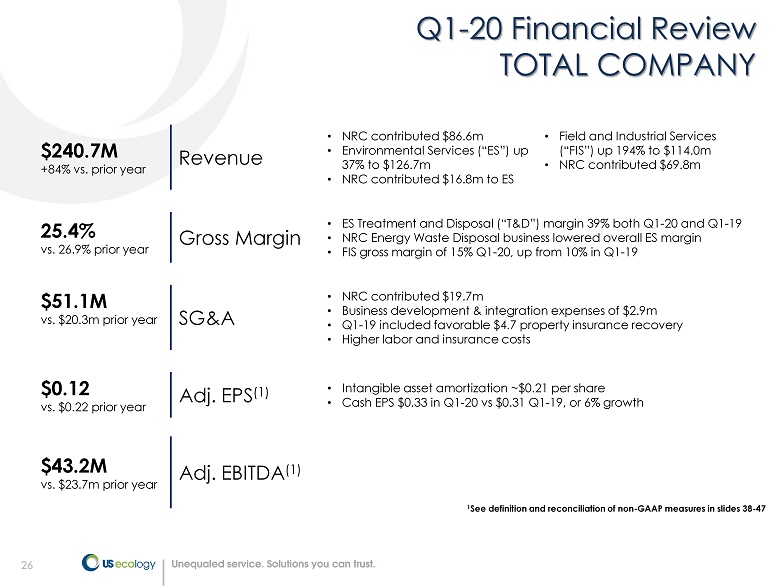
26 $240.7M +84% vs. prior year Revenue • NRC contributed $86.6m • Environmental Services (“ES”) up 37% to $126.7m • NRC contributed $16.8m to ES • Field and Industrial Services (“FIS”) up 194% to $114.0m • NRC contributed $69.8m 25.4% vs. 26.9% prior year Gross Margin • ES Treatment and Disposal (“T&D”) margin 39% both Q1 - 20 and Q1 - 19 • NRC Energy Waste Disposal business lowered overall ES margin • FIS gross margin of 15% Q1 - 20, up from 10% in Q1 - 19 $51.1M vs. $20.3m prior year SG&A • NRC contributed $19.7m • Business development & integration expenses of $2.9m • Q1 - 19 included favorable $4.7 property insurance recovery • Higher labor and insurance costs $0.12 vs. $0.22 prior year Adj. EPS (1) • Intangible asset amortization ~$0.21 per share • Cash EPS $0.33 in Q1 - 20 vs $0.31 Q1 - 19, or 6% growth $43.2M vs. $23.7m prior year Adj. EBITDA (1) 1 See definition and reconciliation of non - GAAP measures in slides 38 - 47 Q1 - 20 Financial Review TOTAL COMPANY
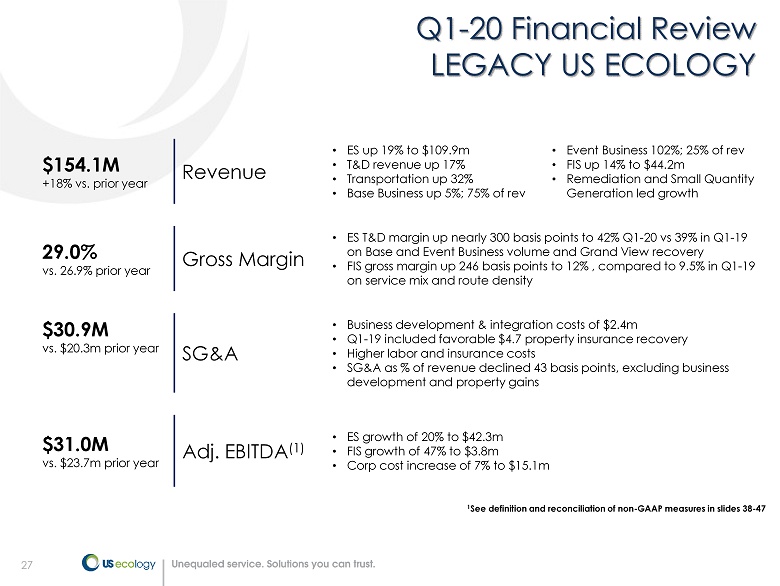
27 $154.1M +18% vs. prior year Revenue • ES up 19% to $109.9m • T&D revenue up 17% • Transportation up 32% • Base Business up 5%; 75% of rev • Event Business 102%; 25% of rev • FIS up 14% to $44.2m • Remediation and Small Quantity Generation led growth 29.0% vs. 26.9% prior year Gross Margin • ES T&D margin up nearly 300 basis points to 42% Q1 - 20 vs 39% in Q1 - 19 on Base and Event Business volume and Grand View recovery • FIS gross margin up 246 basis points to 12% , compared to 9.5% in Q1 - 19 on service mix and route density $30.9M vs. $20.3m prior year SG&A • Business development & integration costs of $2.4m • Q1 - 19 included favorable $4.7 property insurance recovery • Higher labor and insurance costs • SG&A as % of revenue declined 43 basis points, excluding business development and property gains $31.0M vs. $23.7m prior year Adj. EBITDA (1) • ES growth of 20% to $42.3m • FIS growth of 47% to $3.8m • Corp cost increase of 7% to $15.1m 1 See definition and reconciliation of non - GAAP measures in slides 38 - 47 Q1 - 20 Financial Review LEGACY US ECOLOGY

28 Capital Preservation Initiatives Enacted Action plan to address the economic uncertainty as a consequence of the COVID - 19 Pandemic Conserve Cash in 2020 ▪ Reduced capital expenditures by ~ $30 million, or 30% ▪ Temporarily suspended dividend, saving $6 million per quarter, $18 million in 2020 ▪ Cost control initiatives to generate up to $20 million of annual savings Minimize Customer and Employee Disruption ▪ All services deemed essential by government agencies ▪ Implemented policies to meet customer needs, minimize potential service disruptions while protecting employee safety ▪ Restricted non - essential travel ▪ Instituted remote - work programs ▪ Contingency plans combat economic and market volatility $30 $18 $20 $0 $20 $40 $60 $80 2020E Cost Control Initiatives Dividend Suspension Reduced Capex Nearly $70 Million of 2020 Cost Savings Potential $ in millions
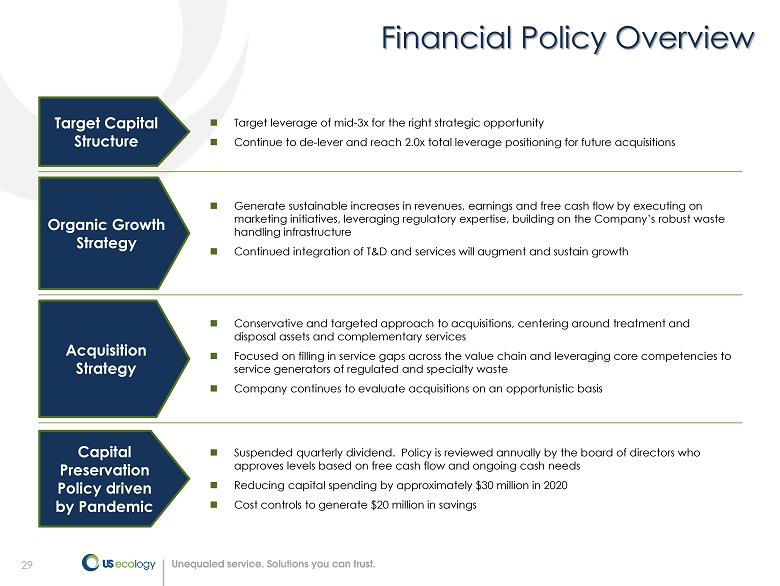
29 Financial Policy Overview Acquisition Strategy Conservative and targeted approach to acquisitions, centering around treatment and disposal assets and complementary services Focused on filling in service gaps across the value chain and leveraging core competencies to service generators of regulated and specialty waste Company continues to evaluate acquisitions on an opportunistic basis Organic Growth Strategy Generate sustainable increases in revenues, earnings and free cash flow by executing on marketing initiatives, leveraging regulatory expertise, building on the Company’s robust waste handling infrastructure Continued integration of T&D and services will augment and sustain growth Target Capital Structure Target leverage of mid - 3x for the right strategic opportunity Continue to de - lever and reach 2.0x total leverage positioning for future acquisitions Capital Preservation Policy driven by Pandemic Suspended quarterly dividend. Policy is reviewed annually by the board of directors who approves levels based on free cash flow and ongoing cash needs Reducing capital spending by approximately $30 million in 2020 Cost controls to generate $20 million in savings

30 Withdrew original 2020 full year guidance March 31, 2020 on unprecedented uncertainty and market conditions What we expect: – Haz waste and associated field services to weather the conditions – COVID - 19 decontaminations services offsetting some of the industrial softness – Energy exposed markets down significantly with long recovery – April 2020 Base Business volumes down 15% - 20% from March 2020 and April 2019 – April Event Business volumes up sequentially from March 2020, down slightly from April 2019 – Q2 - 20 expected to be lowest quarter of year – Businesses reopen in phases commencing in May – Overall industrial activity strengthens at the end of Q2 into Q3 – Strong year - over - year FCF generation even on reduced operating levels – Current environment does not yet provide enough clarity to refresh guidance Withholding Guidance due to COVID - 19

31 2020 Market Considerations Energy Waste Disposal Services ▪ Direct impact from both supply - and demand - side factors impacting crude oil market ▪ Energy companies reducing capital expenditures by 50% or more as a result of dramatic drop in oil prices ▪ Energy waste represented 12% of 2019 revenue ▪ US Ecology’s assets strategically located in the Permian and Eagle Ford basins, the two lowest cost basins in the U.S. Environmental and Field & Industrial Services ▪ Stay - at - home and related government - mandated orders forcing the temporary closure of all non - essential businesses, including certain industrial facilities ▪ All US Ecology services deemed essential by U.S. Department of Homeland Security ▪ Leading small quantity generation and emergency response services expected to grow ▪ Extensive experience managing decontamination responses to biohazards and infectious disease outbreaks Balance Sheet Strength ▪ Capital expenditure reductions, suspended dividend and cost control initiatives to conserve as much as $70 million of cash in 2020 ▪ Ensure the flexibility and ability to take advantage of opportunities to further our strategic plan when the market rebounds Defensible and scalable business model as well as financial flexibility positions the business to withstand uncertain times
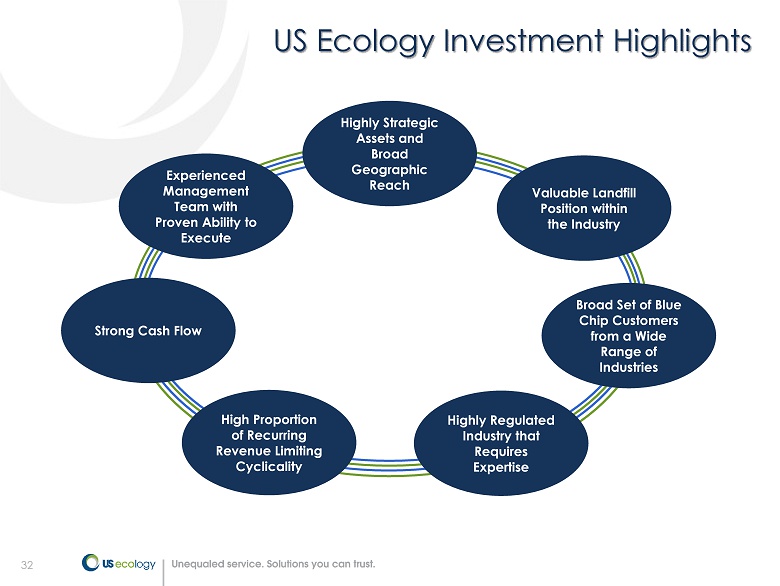
32 Experienced Management Team with Proven Ability to Execute Valuable Landfill Position within the Industry Broad Set of Blue Chip Customers from a Wide Range of Industries Strong Cash Flow Highly Strategic Assets and Broad Geographic Reach US Ecology Investment Highlights High Proportion of Recurring Revenue Limiting Cyclicality Highly Regulated Industry that Requires Expertise
33 Appendix
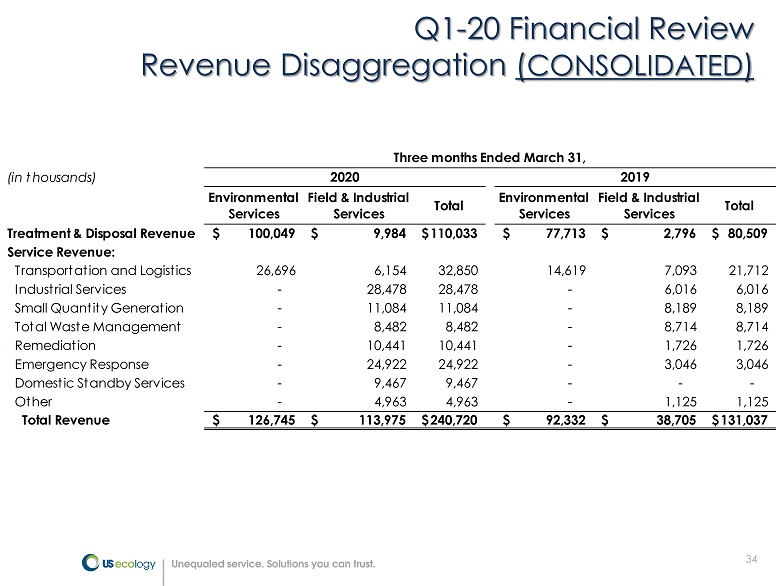
34 Q1 - 20 Financial Review Revenue Disaggregation ( CONSOLIDATED ) (in thousands) Environmental Services Field & Industrial Services Total Environmental Services Field & Industrial Services Total Treatment & Disposal Revenue 100,049$ 9,984$ 110,033$ 77,713$ 2,796$ 80,509$ Service Revenue: Transportation and Logistics 26,696 6,154 32,850 14,619 7,093 21,712 Industrial Services - 28,478 28,478 - 6,016 6,016 Small Quantity Generation - 11,084 11,084 - 8,189 8,189 Total Waste Management - 8,482 8,482 - 8,714 8,714 Remediation - 10,441 10,441 - 1,726 1,726 Emergency Response - 24,922 24,922 - 3,046 3,046 Domestic Standby Services - 9,467 9,467 - - - Other - 4,963 4,963 - 1,125 1,125 Total Revenue 126,745$ 113,975$ 240,720$ 92,332$ 38,705$ 131,037$ Three months Ended March 31, 2020 2019
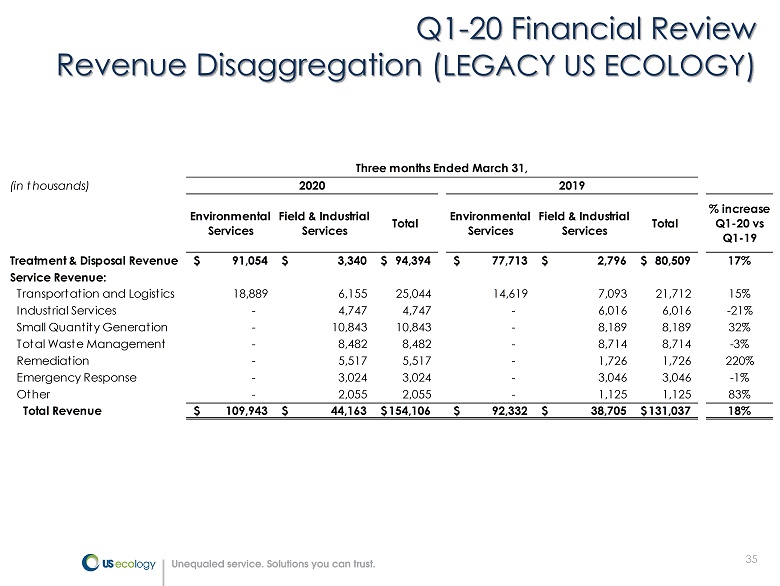
35 Q1 - 20 Financial Review Revenue Disaggregation ( LEGACY US ECOLOGY ) (in thousands) Environmental Services Field & Industrial Services Total Environmental Services Field & Industrial Services Total % increase Q1-20 vs Q1-19 Treatment & Disposal Revenue 91,054$ 3,340$ 94,394$ 77,713$ 2,796$ 80,509$ 17% Service Revenue: Transportation and Logistics 18,889 6,155 25,044 14,619 7,093 21,712 15% Industrial Services - 4,747 4,747 - 6,016 6,016 -21% Small Quantity Generation - 10,843 10,843 - 8,189 8,189 32% Total Waste Management - 8,482 8,482 - 8,714 8,714 -3% Remediation - 5,517 5,517 - 1,726 1,726 220% Emergency Response - 3,024 3,024 - 3,046 3,046 -1% Other - 2,055 2,055 - 1,125 1,125 83% Total Revenue 109,943$ 44,163$ 154,106$ 92,332$ 38,705$ 131,037$ 18% Three months Ended March 31, 2020 2019
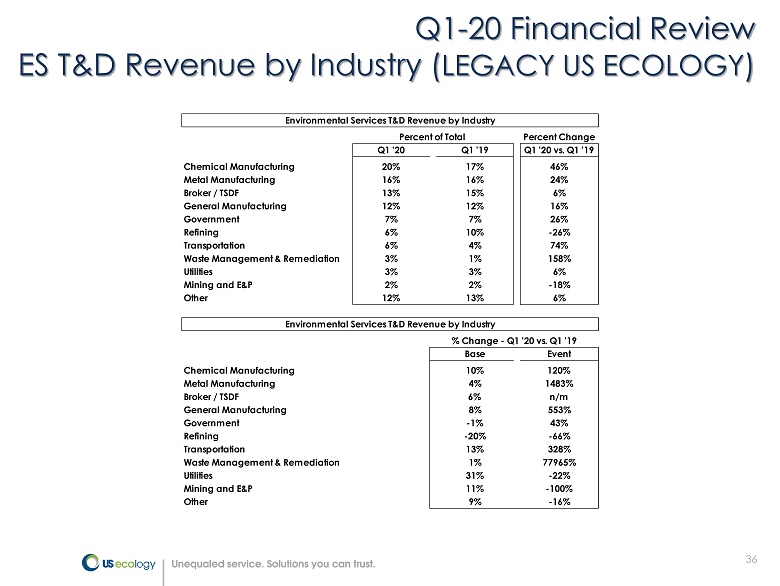
36 Q1 - 20 Financial Review ES T&D Revenue by Industry ( LEGACY US ECOLOGY ) Percent Change Q1 '20 Q1 '19 Q1 '20 vs. Q1 '19 Chemical Manufacturing 20% 17% 46% Metal Manufacturing 16% 16% 24% Broker / TSDF 13% 15% 6% General Manufacturing 12% 12% 16% Government 7% 7% 26% Refining 6% 10% -26% Transportation 6% 4% 74% Waste Management & Remediation 3% 1% 158% Utilities 3% 3% 6% Mining and E&P 2% 2% -18% Other 12% 13% 6% Base Event Chemical Manufacturing 10% 120% Metal Manufacturing 4% 1483% Broker / TSDF 6% n/m General Manufacturing 8% 553% Government -1% 43% Refining -20% -66% Transportation 13% 328% Waste Management & Remediation 1% 77965% Utilities 31% -22% Mining and E&P 11% -100% Other 9% -16% Environmental Services T&D Revenue by Industry Percent of Total Environmental Services T&D Revenue by Industry % Change - Q1 '20 vs. Q1 '19

37 Q1 - 20 Financial Review Financial Position & Cash Flow Metrics (in thousands) March 31, 2020 December 31, 2019 Assets Current Assets: Cash and cash equivalents 109,790$ 41,281$ Other current assets 277,790 291,690 Total current assets 387,580 332,971 Long-term assets 1,591,059 1,898,273 Total assets 1,978,639$ 2,231,244$ Liabilities and Stockholders’ Equity Current Liabilities: Short-term borrowings and current portion of long-term debt 3,754 3,359 Other current liabilities 167,240 177,411 Total current liabilities 170,994 180,770 Long-term debt 855,003 765,842 Other long-term liabilities 276,319 273,252 Total liabilities 1,302,316 1,219,864 Stockholders’ Equity 676,323 1,011,380 Total liabilities and stockholders' equity 1,978,639$ 2,231,244$ Working Capital 216,586$ 152,201$ Selected Cash Flow Items: 2020 2019 Net cash provided by operating activities 29,346$ 18,524$ Adjusted free cash flow 1 15,915$ 12,101$ Three months ended March 31, 1 See definition and reconciliation of non - GAAP measures in slides 38 - 47
38 US Ecology reports adjusted EBITDA, adjusted earnings per diluted share results and adjusted free cash flow, which are non - GAAP financial measures, as a complement to results provided in accordance with generally accepted accounting principles in the United States (“GAAP”) and believes that such information provides analysts, stockholders, and other users information to better understand the Company’s operating performance. Because adjusted EBITDA, adjusted earnings per diluted share and adjusted free cash flow are not measurements determined in accordance with GAAP and are thus susceptible to varying calculations they may not be comparable to similar measures used by other companies. Items excluded from adjusted EBITDA, adjusted earnings per diluted share and adjusted free cash flow are significant components in understanding and assessing financial performance. Adjusted EBITDA, adjusted earnings per diluted share and adjusted free cash flow should not be considered in isolation or as an alternative to, or substitute for, net income, cash flows generated by operations, investing or financing activities, or other financial statement data presented in the consolidated financial statements as indicators of financial performance or liquidity. Adjusted EBITDA, adjusted earnings per diluted share and adjusted free cash flow have limitations as analytical tools and should not be considered in isolation or a substitute for analyzing our results as reported under GAAP. 38 Non - GAAP Financial Measures
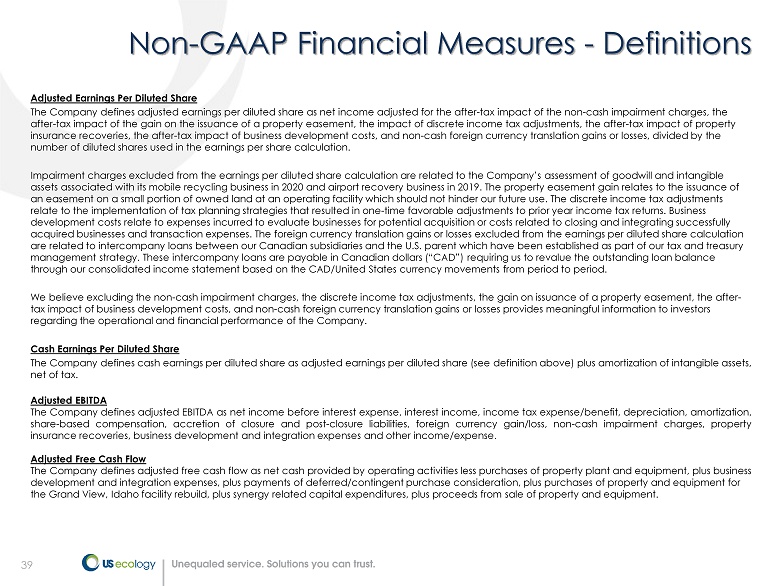
39 Adjusted Earnings Per Diluted Share The Company defines adjusted earnings per diluted share as net income adjusted for the after - tax impact of the non - cash impairme nt charges, the after - tax impact of the gain on the issuance of a property easement, the impact of discrete income tax adjustments, the after - ta x impact of property insurance recoveries, the after - tax impact of business development costs, and non - cash foreign currency translation gains or los ses, divided by the number of diluted shares used in the earnings per share calculation. Impairment charges excluded from the earnings per diluted share calculation are related to the Company’s assessment of goodwi ll and intangible assets associated with its mobile recycling business in 2020 and airport recovery business in 2019. The property easement gai n r elates to the issuance of an easement on a small portion of owned land at an operating facility which should not hinder our future use. The discrete in com e tax adjustments relate to the implementation of tax planning strategies that resulted in one - time favorable adjustments to prior year income tax returns. Business development costs relate to expenses incurred to evaluate businesses for potential acquisition or costs related to closing an d i ntegrating successfully acquired businesses and transaction expenses. The foreign currency translation gains or losses excluded from the earnings per di luted share calculation are related to intercompany loans between our Canadian subsidiaries and the U.S. parent which have been established as part o f o ur tax and treasury management strategy. These intercompany loans are payable in Canadian dollars (“CAD”) requiring us to revalue the outstanding lo an balance through our consolidated income statement based on the CAD/United States currency movements from period to period. We believe excluding the non - cash impairment charges, the discrete income tax adjustments, the gain on issuance of a property ea sement, the after - tax impact of business development costs, and non - cash foreign currency translation gains or losses provides meaningful informat ion to investors regarding the operational and financial performance of the Company. Cash Earnings Per Diluted Share The Company defines cash earnings per diluted share as adjusted earnings per diluted share (see definition above) plus amorti zat ion of intangible assets, net of tax. Adjusted EBITDA The Company defines adjusted EBITDA as net income before interest expense, interest income, income tax expense/benefit, depreciation, amortization, share - based compensation, accretion of closure and post - closure liabilities, foreign currency gain/loss, non - cash impairment charges, property insurance recoveries, business development and integration expenses and other income/expense . Adjusted Free Cash Flow The Company defines adjusted free cash flow as net cash provided by operating activities less purchases of property plant and eq uipment, plus business development and integration expenses, plus payments of deferred/contingent purchase consideration, plus purchases of property an d equipment for the Grand View, Idaho facility rebuild, plus synergy related capital expenditures, plus proceeds from sale of property and eq uip ment. 39 Non - GAAP Financial Measures - Definitions
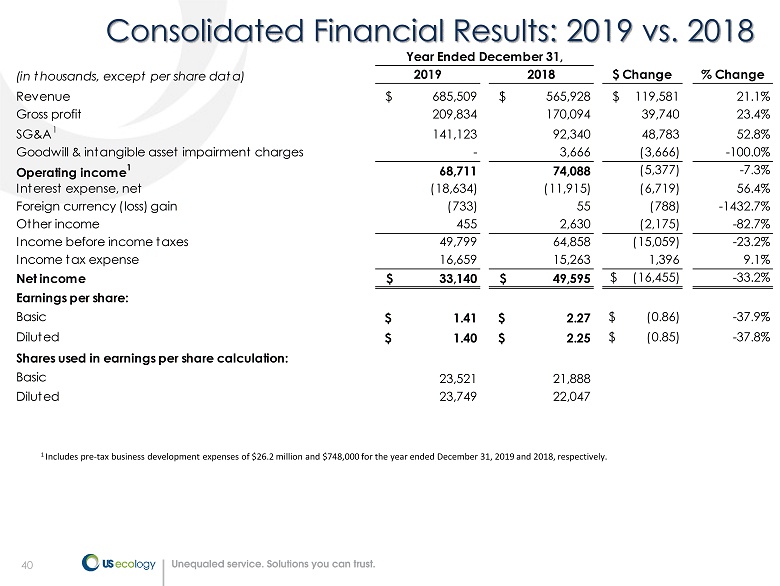
40 40 Consolidated Financial Results: 2019 vs. 2018 (in thousands, except per share data) 2019 2018 $ Change % Change Revenue $ 685,509 $ 565,928 $ 119,581 21.1% Gross profit 209,834 170,094 39,740 23.4% SG&A 1 141,123 92,340 48,783 52.8% Goodwill & intangible asset impairment charges - 3,666 (3,666) -100.0% Operating income 1 68,711 74,088 (5,377) -7.3% Interest expense, net (18,634) (11,915) (6,719) 56.4% Foreign currency (loss) gain (733) 55 (788) -1432.7% Other income 455 2,630 (2,175) -82.7% Income before income taxes 49,799 64,858 (15,059) -23.2% Income tax expense 16,659 15,263 1,396 9.1% Net income $ 33,140 $ 49,595 $ (16,455) -33.2% Earnings per share: Basic $ 1.41 $ 2.27 $ (0.86) -37.9% Diluted $ 1.40 $ 2.25 $ (0.85) -37.8% Shares used in earnings per share calculation: Basic 23,521 21,888 Diluted 23,749 22,047 Year Ended December 31, 1 Includes pre - tax business development expenses of $26.2 million and $748,000 for the year ended December 31, 2019 and 2018, resp ectively.
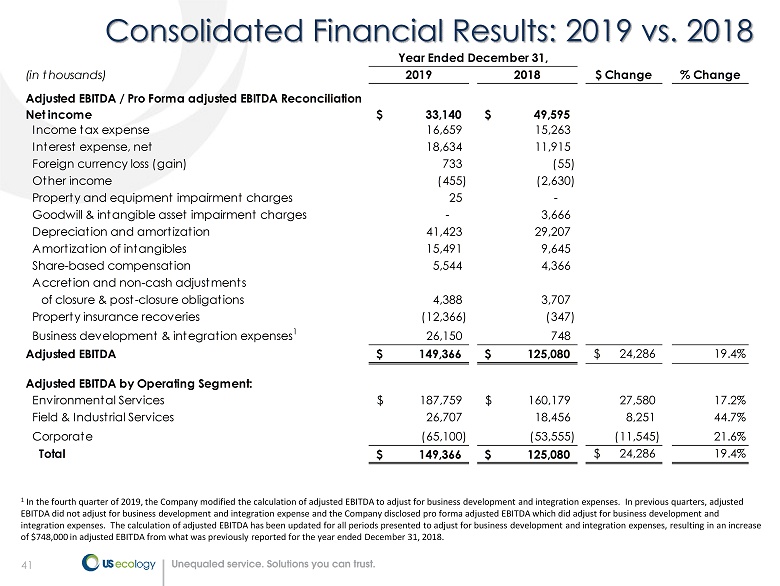
41 41 Consolidated Financial Results: 2019 vs. 2018 (in thousands) 2019 2018 $ Change % Change Adjusted EBITDA / Pro Forma adjusted EBITDA Reconciliation Net income 33,140$ 49,595$ Income tax expense 16,659 15,263 Interest expense, net 18,634 11,915 Foreign currency loss (gain) 733 (55) Other income (455) (2,630) Property and equipment impairment charges 25 - Goodwill & intangible asset impairment charges - 3,666 Depreciation and amortization 41,423 29,207 Amortization of intangibles 15,491 9,645 Share-based compensation 5,544 4,366 Accretion and non-cash adjustments of closure & post-closure obligations 4,388 3,707 Property insurance recoveries (12,366) (347) Business development & integration expenses 1 26,150 748 Adjusted EBITDA 149,366$ 125,080$ 24,286$ 19.4% Adjusted EBITDA by Operating Segment: Environmental Services 187,759$ 160,179$ 27,580 17.2% Field & Industrial Services 26,707 18,456 8,251 44.7% Corporate (65,100) (53,555) (11,545) 21.6% Total 149,366$ 125,080$ 24,286$ 19.4% Year Ended December 31, 1 In the fourth quarter of 2019, the Company modified the calculation of adjusted EBITDA to adjust for business development and in tegration expenses. In previous quarters, adjusted EBITDA did not adjust for business development and integration expense and the Company disclosed pro forma adjusted EBITDA wh ich did adjust for business development and integration expenses. The calculation of adjusted EBITDA has been updated for all periods presented to adjust for business d eve lopment and integration expenses, resulting in an increase of $748,000 in adjusted EBITDA from what was previously reported for the year ended December 31, 2018.
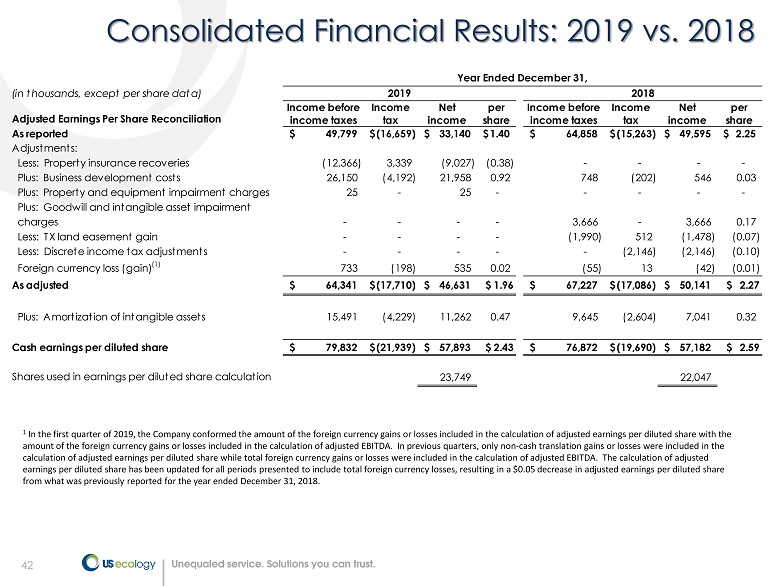
42 42 Consolidated Financial Results: 2019 vs. 2018 (in thousands, except per share data) Adjusted Earnings Per Share Reconciliation Income before income taxes Income tax Net income per share Income before income taxes Income tax Net income per share As reported 49,799$ (16,659)$ 33,140$ 1.40$ 64,858$ (15,263)$ 49,595$ 2.25$ Adjustments: Less: Property insurance recoveries (12,366) 3,339 (9,027) (0.38) - - - - Plus: Business development costs 26,150 (4,192) 21,958 0.92 748 (202) 546 0.03 Plus: Property and equipment impairment charges 25 - 25 - - - - - Plus: Goodwill and intangible asset impairment charges - - - - 3,666 - 3,666 0.17 Less: TX land easement gain - - - - (1,990) 512 (1,478) (0.07) Less: Discrete income tax adjustments - - - - - (2,146) (2,146) (0.10) Foreign currency loss (gain) (1) 733 (198) 535 0.02 (55) 13 (42) (0.01) As adjusted 64,341$ (17,710)$ 46,631$ $ 1.96 67,227$ (17,086)$ 50,141$ $ 2.27 Plus: Amortization of intangible assets 15,491 (4,229) 11,262 0.47 9,645 (2,604) 7,041 0.32 Cash earnings per diluted share 79,832$ (21,939)$ 57,893$ $ 2.43 76,872$ (19,690)$ 57,182$ $ 2.59 Shares used in earnings per diluted share calculation 23,749 22,047 Year Ended December 31, 2019 2018 1 In the first quarter of 2019, the Company conformed the amount of the foreign currency gains or losses included in the calcul ati on of adjusted earnings per diluted share with the amount of the foreign currency gains or losses included in the calculation of adjusted EBITDA. In previous quarters, only no n - c ash translation gains or losses were included in the calculation of adjusted earnings per diluted share while total foreign currency gains or losses were included in the calculat ion of adjusted EBITDA. The calculation of adjusted earnings per diluted share has been updated for all periods presented to include total foreign currency losses, resulting in a $ 0.05 decrease in adjusted earnings per diluted share from what was previously reported for the year ended December 31, 2018.
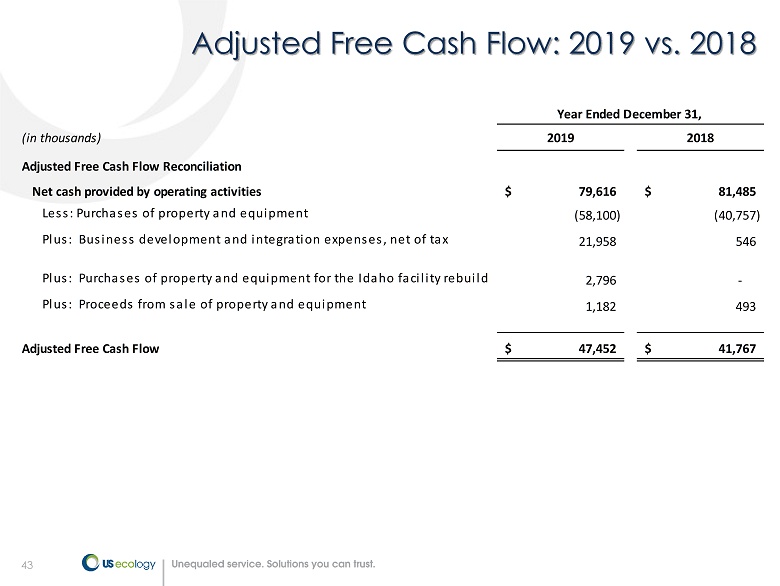
43 43 Adjusted Free Cash Flow: 2019 vs. 2018 (in thousands) 2019 2018 Adjusted Free Cash Flow Reconciliation Net cash provided by operating activities 79,616$ 81,485$ Less: Purchases of property and equipment (58,100) (40,757) Plus: Business development and integration expenses, net of tax 21,958 546 Plus: Purchases of property and equipment for the Idaho facility rebuild 2,796 - Plus: Proceeds from sale of property and equipment 1,182 493 Adjusted Free Cash Flow 47,452$ 41,767$ Year Ended December 31,
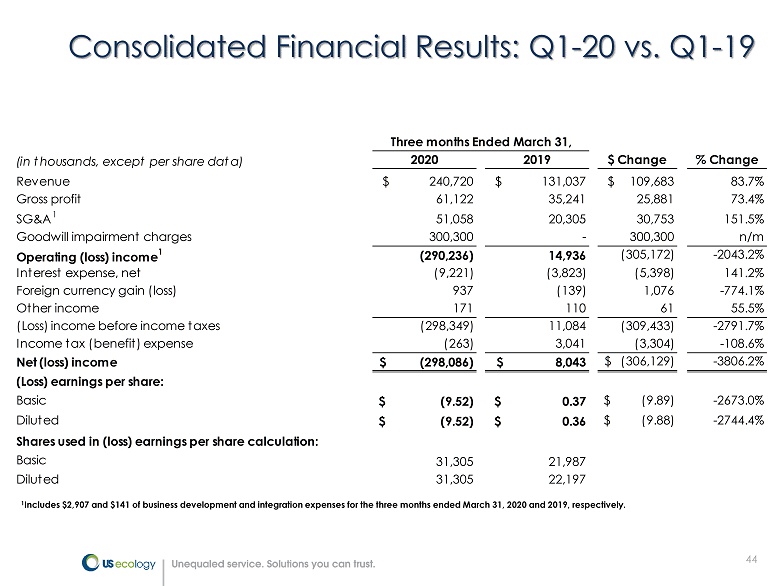
44 Consolidated Financial Results: Q1 - 20 vs. Q1 - 19 (in thousands, except per share data) 2020 2019 $ Change % Change Revenue $ 240,720 $ 131,037 $ 109,683 83.7% Gross profit 61,122 35,241 25,881 73.4% SG&A 1 51,058 20,305 30,753 151.5% Goodwill impairment charges 300,300 - 300,300 n/m Operating (loss) income 1 (290,236) 14,936 (305,172) -2043.2% Interest expense, net (9,221) (3,823) (5,398) 141.2% Foreign currency gain (loss) 937 (139) 1,076 -774.1% Other income 171 110 61 55.5% (Loss) income before income taxes (298,349) 11,084 (309,433) -2791.7% Income tax (benefit) expense (263) 3,041 (3,304) -108.6% Net (loss) income $ (298,086) $ 8,043 $ (306,129) -3806.2% (Loss) earnings per share: Basic $ (9.52) $ 0.37 $ (9.89) -2673.0% Diluted $ (9.52) $ 0.36 $ (9.88) -2744.4% Shares used in (loss) earnings per share calculation: Basic 31,305 21,987 Diluted 31,305 22,197 Three months Ended March 31, 1 Includes $2,907 and $141 of business development and integration expenses for the three months ended March 31, 2020 and 2019, re spectively.
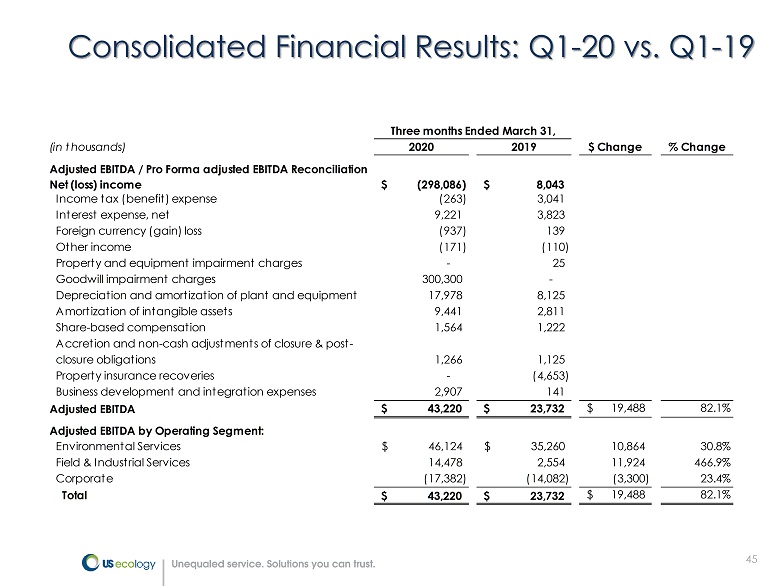
45 Consolidated Financial Results: Q1 - 20 vs. Q1 - 19 (in thousands) 2020 2019 $ Change % Change Adjusted EBITDA / Pro Forma adjusted EBITDA Reconciliation Net (loss) income (298,086)$ 8,043$ Income tax (benefit) expense (263) 3,041 Interest expense, net 9,221 3,823 Foreign currency (gain) loss (937) 139 Other income (171) (110) Property and equipment impairment charges - 25 Goodwill impairment charges 300,300 - Depreciation and amortization of plant and equipment 17,978 8,125 Amortization of intangible assets 9,441 2,811 Share-based compensation 1,564 1,222 Accretion and non-cash adjustments of closure & post- closure obligations 1,266 1,125 Property insurance recoveries - (4,653) Business development and integration expenses 2,907 141 Adjusted EBITDA 43,220$ 23,732$ 19,488$ 82.1% Adjusted EBITDA by Operating Segment: Environmental Services 46,124$ 35,260$ 10,864 30.8% Field & Industrial Services 14,478 2,554 11,924 466.9% Corporate (17,382) (14,082) (3,300) 23.4% Total 43,220$ 23,732$ 19,488$ 82.1% Three months Ended March 31,
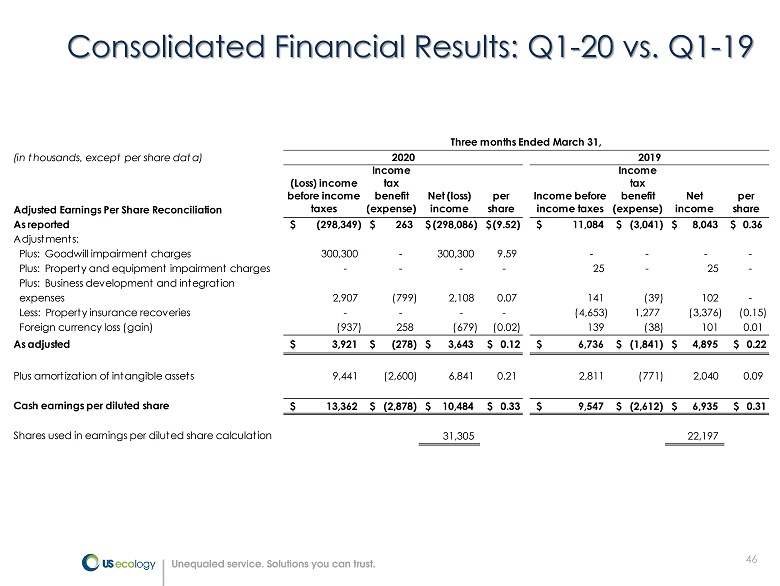
46 Consolidated Financial Results: Q1 - 20 vs. Q1 - 19 (in thousands, except per share data) Adjusted Earnings Per Share Reconciliation (Loss) income before income taxes Income tax benefit (expense) Net (loss) income per share Income before income taxes Income tax benefit (expense) Net income per share As reported (298,349)$ 263$ (298,086)$ (9.52)$ 11,084$ (3,041)$ 8,043$ 0.36$ Adjustments: Plus: Goodwill impairment charges 300,300 - 300,300 9.59 - - - - Plus: Property and equipment impairment charges - - - - 25 - 25 - Plus: Business development and integration expenses 2,907 (799) 2,108 0.07 141 (39) 102 - Less: Property insurance recoveries - - - - (4,653) 1,277 (3,376) (0.15) Foreign currency loss (gain) (937) 258 (679) (0.02) 139 (38) 101 0.01 As adjusted 3,921$ (278)$ 3,643$ $ 0.12 6,736$ (1,841)$ 4,895$ $ 0.22 Plus amortization of intangible assets 9,441 (2,600) 6,841 0.21 2,811 (771) 2,040 0.09 Cash earnings per diluted share 13,362$ (2,878)$ 10,484$ $ 0.33 9,547$ (2,612)$ 6,935$ $ 0.31 Shares used in earnings per diluted share calculation 31,305 22,197 Three months Ended March 31, 2020 2019
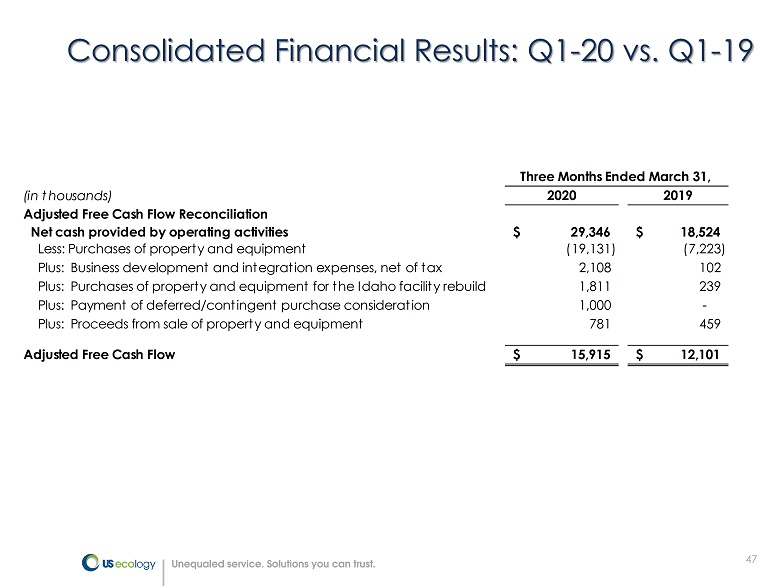
47 Consolidated Financial Results: Q1 - 20 vs. Q1 - 19 (in thousands) 2020 2019 Adjusted Free Cash Flow Reconciliation Net cash provided by operating activities 29,346$ 18,524$ Less: Purchases of property and equipment (19,131) (7,223) Plus: Business development and integration expenses, net of tax 2,108 102 Plus: Purchases of property and equipment for the Idaho facility rebuild 1,811 239 Plus: Payment of deferred/contingent purchase consideration 1,000 - Plus: Proceeds from sale of property and equipment 781 459 Adjusted Free Cash Flow 15,915$ 12,101$ Three Months Ended March 31,