Attached files
| file | filename |
|---|---|
| 8-K - 8-K - EQUITY LIFESTYLE PROPERTIES INC | d906174d8k.htm |
Exhibit 99.1

Investor Presentation June 2020 Equity LifeStyle Properties 1

ELS 2
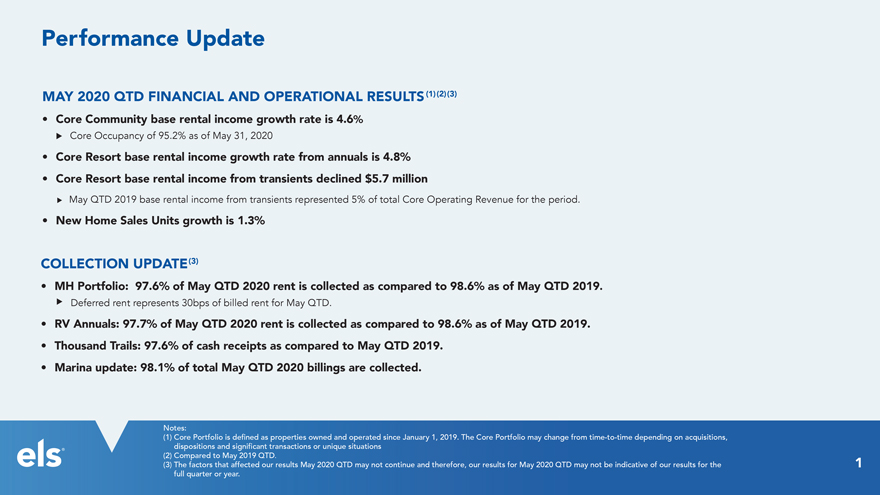
Performance Update MAY 2020 QTD FINANCIAL AND OPERATIONAL RESULTS(1)(2)(3) Core Community base rental income growth rate is 4.6% Core Occupancy of 95.2% as of May 31, 2020 Core Resort base rental income growth rate from annuals is 4.8% Core Resort base rental income from transients declined $5.7 million May QTD 2019 base rental income from transients represented 5% of total Core Operating Revenue for the period. New Home Sales Units growth is 1.3% COLLECTION UPDATE(3) MH Portfolio: 97.6% of May QTD 2020 rent is collected as compared to 98.6% as of May QTD 2019. Deferred rent represents 30bps of billed rent for May QTD. RV Annuals: 97.7% of May QTD 2020 rent is collected as compared to 98.6% as of May QTD 2019. Thousand Trails: 97.6% of cash receipts as compared to May QTD 2019. Marina update: 98.1% of total May QTD 2020 billings are collected. (1) Notes: Core Portfolio is defined as properties owned and operated since January 1, 2019. The Core Portfolio may change from time-to-time depending on acquisitions, (2) dispositions and significant transactions or unique situations (3) The Compared factors to that May affected 2019 QTD our .results May 2020 QTD may not continue and therefore, our results for May 2020 QTD may not be indicative of our results for the full quarter or year. 1
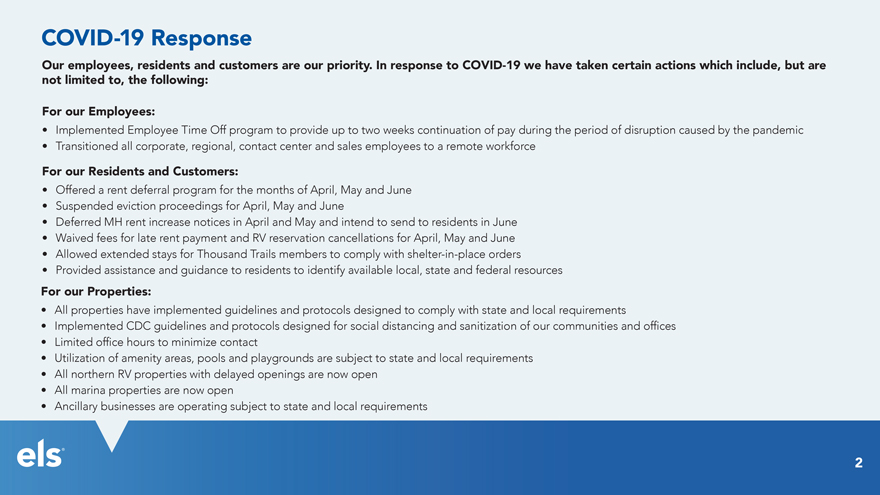
COVID -19 Response Our employees, residents and customers are our priority. In response to COVID-19 we have taken certain actions which include, but are not limited to, the following: For our Employees: Implemented Employee Time Off program to provide up to two weeks continuation of pay during the period of disruption caused by the pandemic Transitioned all corporate, regional, contact center and sales employees to a remote workforce For our Residents and Customers: Offered a rent deferral program for the months of April, May and June Suspended eviction proceedings for April, May and June Deferred MH rent increase notices in April and May and intend to send to residents in June Waived fees for late rent payment and RV reservation cancellations for April, May and June Allowed extended stays for Thousand Trails members to comply with shelter-in-place orders Provided assistance and guidance to residents to identify available local, state and federal resources For our Properties: All properties have implemented guidelines and protocols designed to comply with state and local requirements Implemented CDC guidelines and protocols designed for social distancing and sanitization of our communities and offices Limited office hours to minimize contact Utilization of amenity areas, pools and playgrounds are subject to state and local requirements All northern RV properties with delayed openings are now open All marina properties are now open Ancillary businesses are operating subject to state and local requirements 2
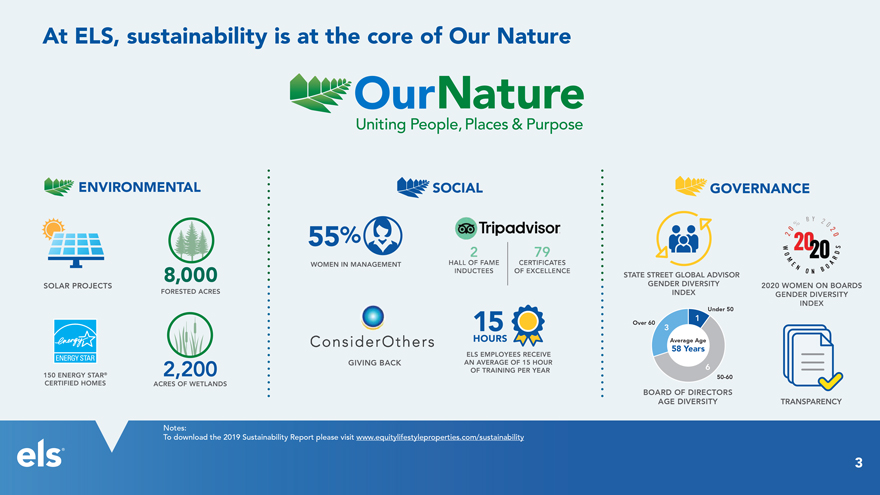
At ELS, sustainability is at the core of Our Nature ENVIRONMENTAL SOCIAL GOVERNANCE SOLAR PROJECTS Under 50 1 Over 60 3 Average Age 58 Years GIVING BACK 6 50-60 BOARD OF DIRECTORS AGE DIVERSITY To Notes: download the 2019 Sustainability Report please visit www.equitylifestyleproperties.com/sustainability 3 SOLAR PROJECTS 150 ENERGY STAR CERTIFIED HOMES WOMEN IN MANAGEMENT HALL OF FAME INDUCTEES CERTIFICATES OF EXCELLENCE Consider Others ELS EMPLOYEES RECEOVE AM AVERAGE PF 15 HOUR OF TRAINING PER YEAR STATE STREET GLOBAL ADVISOR GENDER DIVERSITY INDEX 2020 WOMEN ON BOARDS GENDER DIVERSITY INDEX
Our Story
• and One
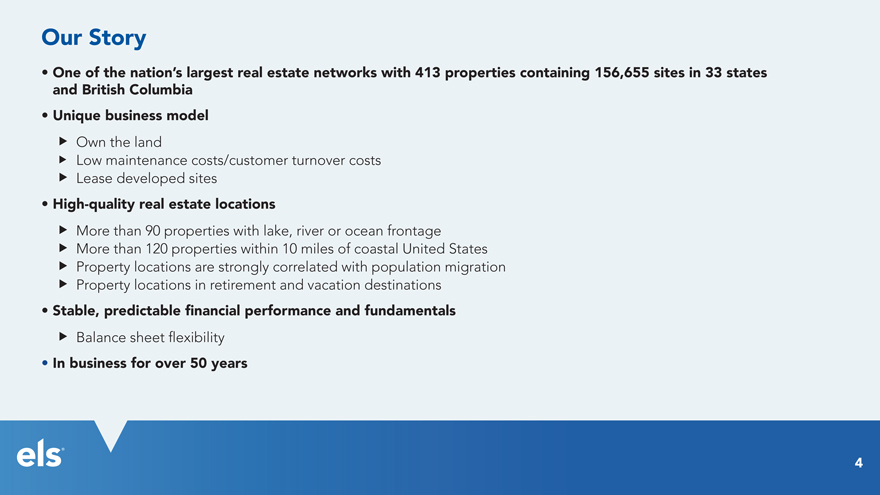
British of the Columbia nation’s largest real estate networks with 413 properties containing 156,655 sites in 33 states
• Unique business model u Own the
land u Low maintenance costs/customer turnover costs u Lease developed sites
• High-quality real estate locations u More than 90 properties with lake, river
or ocean frontage u More than 120 properties within 10 miles of coastal United States u Property locations are strongly correlated with population migration u Property locations in retirement and vacation destinations
• Stable, predictable financial performance and fundamentals u Balance sheet flexibility
• In business for over 50 years
6
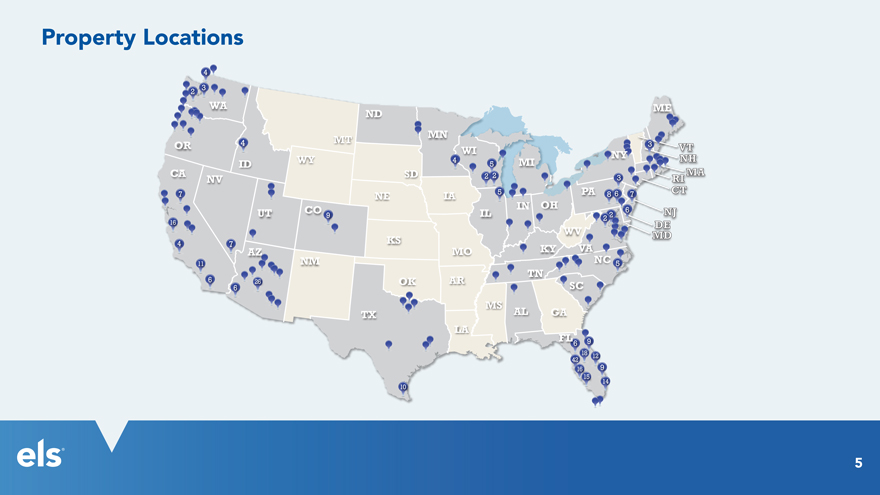
Property Locations 7
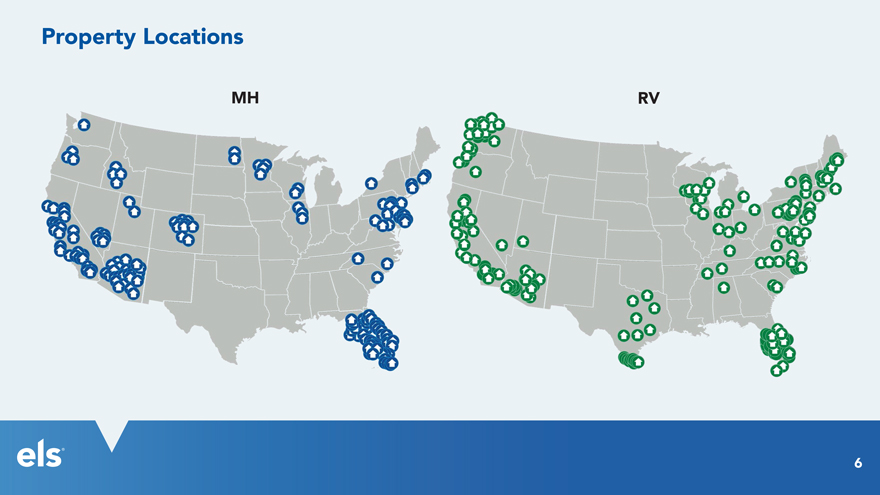
Property Locations Mh rv 8
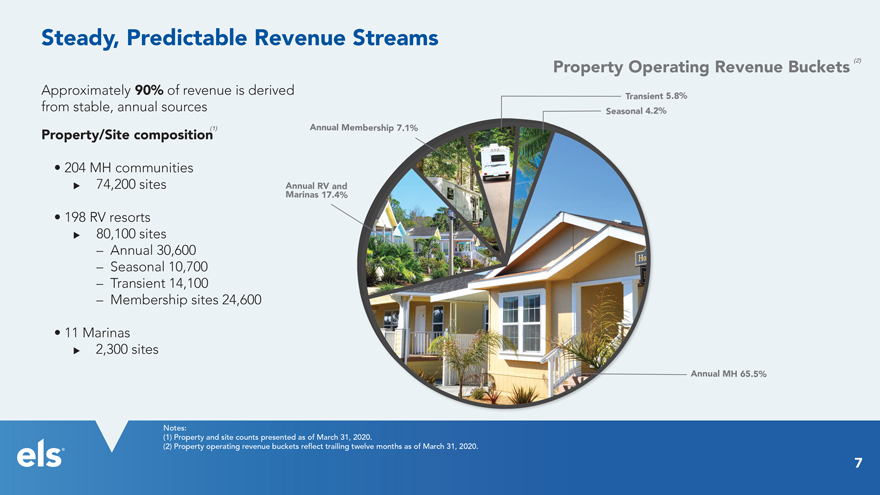
Steady, Predictable Revenue Streams Approximately 90% of revenue is derived from stable, annual sources Property/Site composition(1) 204 MH communities 74,200 sites 198 RV resorts 80,100 sites – Annual 30,600 – Seasonal 10,700 – Transient 14,100 – Membership sites 24,600 11 Marinas 2,300 sites Annual Membership 7.1% Annual RV and Marinas 17.4% Property Operating Revenue Buckets (2) Transient 5.8% Seasonal 4.2% Annual MH 65.5% (1) Notes: Property and site counts presented as of March 31, 2020. (2) Property operating revenue buckets reflect trailing twelve months as of March 31, 2020. 7

Our Lifestyle Options
• Customers own the units they place on our sites u Manufactured homes u Resort cottages (park models) uRecreational vehicles
• We offer a lifestyle and a variety of product options to meet our customers’ needs
• We seek to create long-term relationships with our customers
Manufactured Home Cottage
RV Resort RV Site Tiny House
Marinas
10
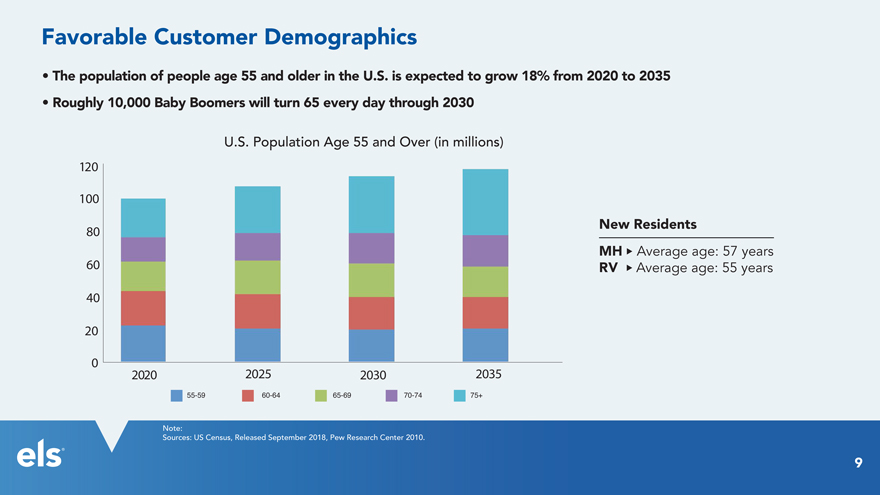
Favorable Customer Demographics
• The population of people age 55 and older in the U.S. is expected to grow 18% from 2020 to 2035
• Roughly 10,000 Baby Boomers will turn 65 every day through 2030
U.S. Population Age 55
and Over (in millions)
120
100
New Residents
80
MH u Average age: 57 years
60 RV u Average age: 55 years
40
20
0
2020 2025 2030 2035
55-59 60-64 65-69
70-74 75+
Sources: Note: US Census, Released September 2018, Pew Research Center 2010.
11

Digital Marketing Strategy myMHcommunity.com RVontheGo.com 12
Track Record
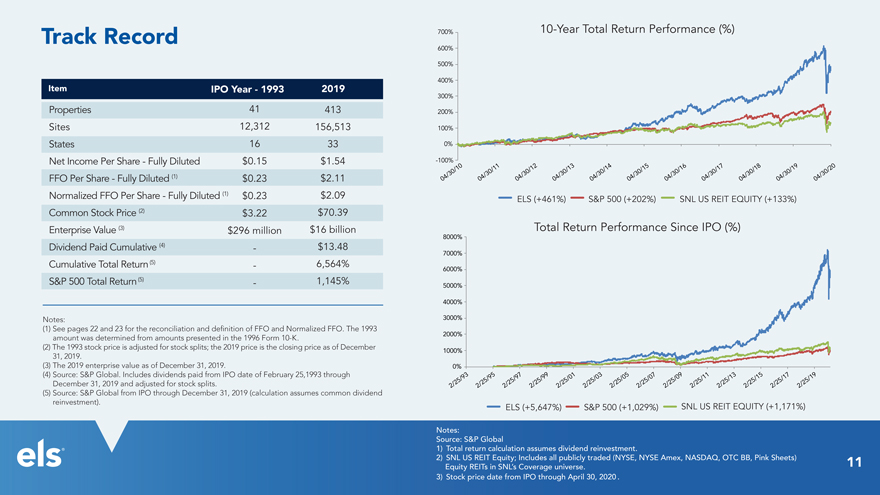
Item IPO
Year—1993 2019 Properties 41 413 Sites 12,312 156,513 States 16 33 Net Income Per Share—Fully Diluted $0.15 $1.54 FFO Per Share—Fully Diluted (1) $0.23 $2.11 Normalized FFO Per Share—Fully Diluted (1) $0.23 $2.09 Common Stock
Price (2) $3.22 $70.39 Enterprise Value (3) $296 million $16 billion Dividend Paid Cumulative (4)—$13.48 Cumulative Total Return (5)—6,564% S&P 500 Total Return (5)—1,145% Notes: (1) See pages 22 and 23 for the
reconciliation and definition of FFO and Normalized FFO. The 1993 amount was determined from amounts presented in the 1996 Form 10-K. (2) The 1993 stock price is adjusted for stock
splits; the 2019 price is the closing price as of December 31, 2019. (3) The 2019 enterprise value as of December 31, 2019. (4) Source: S&P Global. Includes dividends paid from IPO date of February 25,1993
through December 31, 2019 and adjusted for stock splits. (5) Source: S&P Global from IPO through December 31, 2019 (calculation assumes common dividend reinvestment).
700% 10-Year Total Return Performance (%) 600% 500% 400% 300% 200% 100% 0% -100% 0 1 2 3 4 5 6 7 8 9 0 / 1 / 1 / 1 / 1 / 1 / 1 / 1 / 1 / 1 /
1 / 2 3 0 3 0 3 0 3 0 3 0 3 0 3 0 3 0 3 0 3 0 3 0 4 / 4 / 4 / 4 / 4 / 4 / 4 / 4 / 4 / 4 / 4 / 0 0 0 0 0 0 0 0 0 0 0 ELS (+461%) S&P 500 (+202%) SNL US REIT EQUITY (+133%) Total Return Performance Since IPO (%)
8000% 7000% 6000% 5000% 4000% 3000% 2000% 1000% 0% 9 3 9 5 9 7 9 9 0 1 0 3 0 5 0 7 0 9 1 1 1 3 1 5 1 7 1 9 5 / 5 / 5 / 5 / 5 / 5 / 5 / 5 / 5 / 5 / 5 / 5 / 5 / 5 / / 2 / 2 / 2 / 2 /
2 / 2 / 2 / 2 / 2 / 2 / 2 / 2 / 2 / 2 2 2 2 2 2 2 2 2 2 2 2 2 2 2 ELS (+5,647%) S&P 500 (+1,029%) SNL US REIT EQUITY (+1,171%) Source: Notes: S&P
Global 2) 1) Total SNL US return REIT calculation Equity; Includes assumes all dividend publicly traded reinvestment.
(NYSE, NYSE Amex, NASDAQ, OTC BB, Pink Sheets) Equity REITs in SNL’s Coverage universe. 3) Stock price date from IPO through
April 30, 2020 . 13
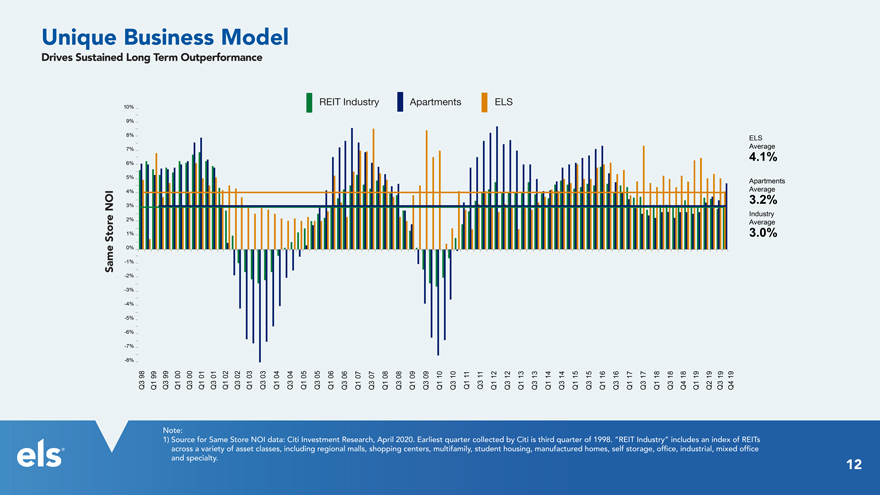
Unique Business Model Drives Sustained Long Term Outperformance
10% 9% 8% ELS 7% Average 4.1% 6%
5% Apartments 4% Average
NOI 3% 3.2% Industry 2% Average Store
1% 3.0% 0% Same -1% -2%
-3% -4% -5% -6% -7%
-8%
98 99 99 00 00 01 01 02 02 03 03 04 04 05 05 06 0607 0708 0809 0910 10111112121313141415151616171718 1818 1919
19 19
Q3 Q1 Q3 Q1 Q3 Q1 Q3 Q1 Q3 Q1 Q3 Q1 Q3 Q1 Q3 Q1 Q3 Q1 Q3Q1 Q3Q1 Q3Q1 Q3Q1Q3Q1Q3Q1Q3Q1Q3Q1Q3Q1Q3Q1Q3Q1 Q3Q4 Q1Q2 Q3 Q4
Note:
1) Source for Same Store NOI data: Citi Investment Research,
April 2020. Earliest quarter collected by Citi is third quarter of 1998. “REIT Industry” includes an index of REITs
across a
variety of asset classes, including regional malls, shopping centers, multifamily, student housing, manufactured homes, self storage, office, industrial, mixed office
and specialty. 12 14
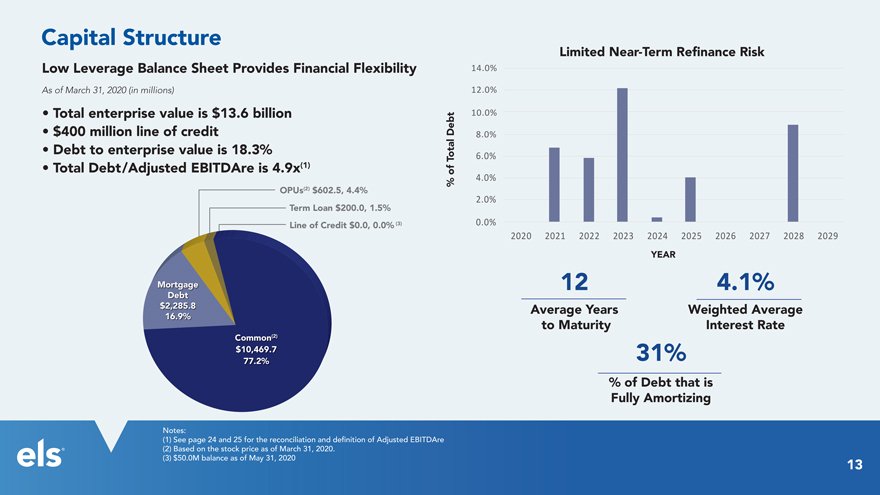
Capital Structure
Low
Leverage Balance Sheet Provides Financial Flexibility 14.
As of March 31, 2020 (in millions) 12.
• Total enterprise value is $13.6 billion 10.
• $400 million line of
credit Debt
• Debt to enterprise value is 18.3% Total
• Total
Debt/Adjusted EBITDAre is 4.9x(1)of
%
OPUs(2) $602.5, 4.4% Term Loan $200.0,
1.5% Line of Credit $0.0, 0.0% (3)
Mortgage Debt $16.9% 2,285.8
Common(2)
$10,469.7 77.2%
(1) Notes: See page 24 and 25 for the reconciliation and definition of Adjusted EBITDAre (3) (2) Based $50.0M on balance the stock as of price May
as 31, of 2020 March 31, 2020.
Limited Near-Term Refinance Risk
14.0%
12.0%
10.0% 8.0%
6.0% 4.0% 2.0% 0.0%
2020 2021 2022 2023 2024 2025 2026 2027 2028 2029
YEAR
12 4.1%
Average to Maturity Years Weighted Interest Average Rate
31%
% Fully of Debt Amortizing that is
15
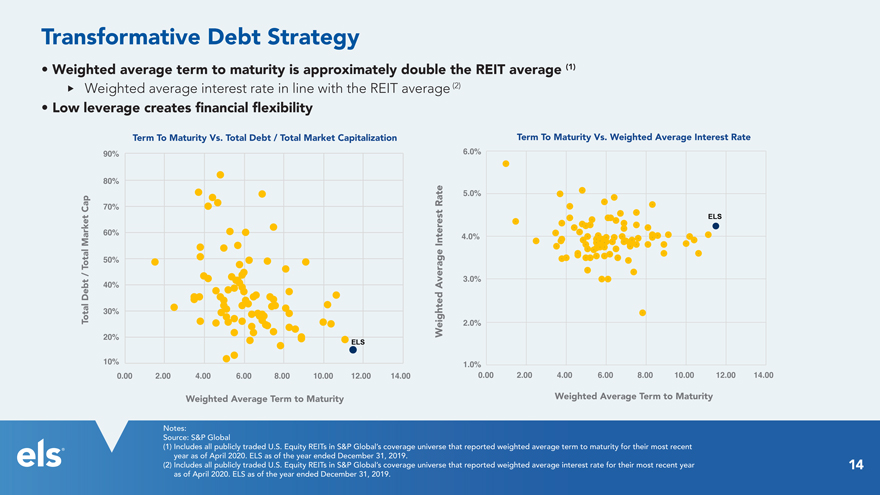
Transformative Debt Strategy
• Weighted average term to maturity is approximately double the REIT average (1) u Weighted average interest rate in line with the REIT average (2)
• Low leverage creates financial flexibility
Term To Maturity Vs. Total Debt / Total
Market Capitalization Term To Maturity Vs. Weighted Average Interest Rate
90% 6.0%
80%
Rate 5.0%
Cap 70%
ELS
Market 60% Interest 4.0%
Total 50% /
3.0%
40% Average
Debt Total 30%
Weighted 2.0%
20%
ELS
10% 1.0%
0.00 2.00 4.00 6.00 8.00 10.00 12.00 14.00 0.00 2.00 4.00 6.00 8.00
10.00 12.00 14.00
Weighted Average Term to Maturity Weighted Average Term to Maturity
Notes: Source: S&P Global
(1) Includes year as of all April publicly 2020. traded ELS as
U. of S. the Equity year REITs ended in S&P December Global’s 31, coverage 2019. universe that reported weighted average term to maturity for their most recent (2) Includes as of April all 2020. publicly ELS traded as of the U.S. year
Equity ended REITs December in S&P Global’s 31, 2019. coverage universe that reported weighted average interest rate for their most recent year
16
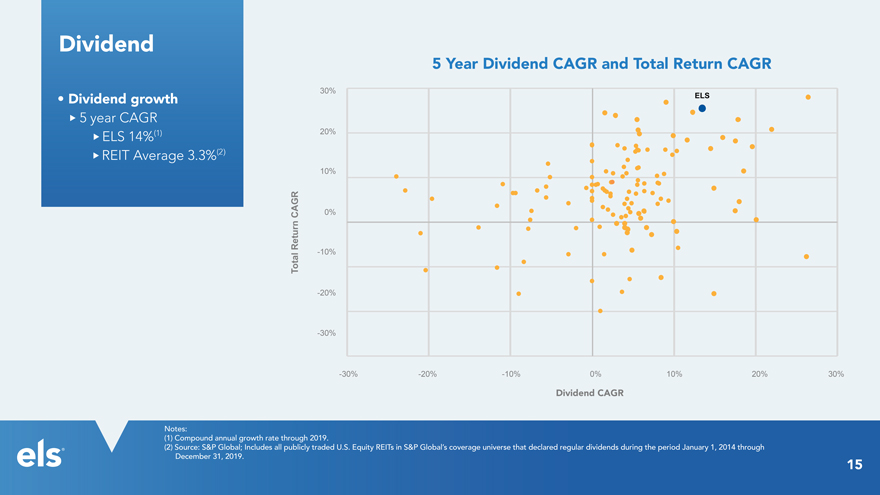
Dividend
5 Year Dividend
CAGR and Total Return CAGR
30%
• Dividend growth
ELS u 5 year CAGR
(1) 20%
u
ELS 14%
(2)
u REIT Average 3.3%
10%
CAGR 0% Return Total -10% -20%
-30%
-30%
-20%
-10%
0% 10%
20% 30%
Dividend CAGR
(1) Notes: Compound annual growth rate through 2019.
(2) Source:
December S&P 31, Global; 2019. Includes all publicly traded U.S. Equity REITs in S&P Global’s coverage universe that declared regular dividends during the period January 1, 2014 through
17
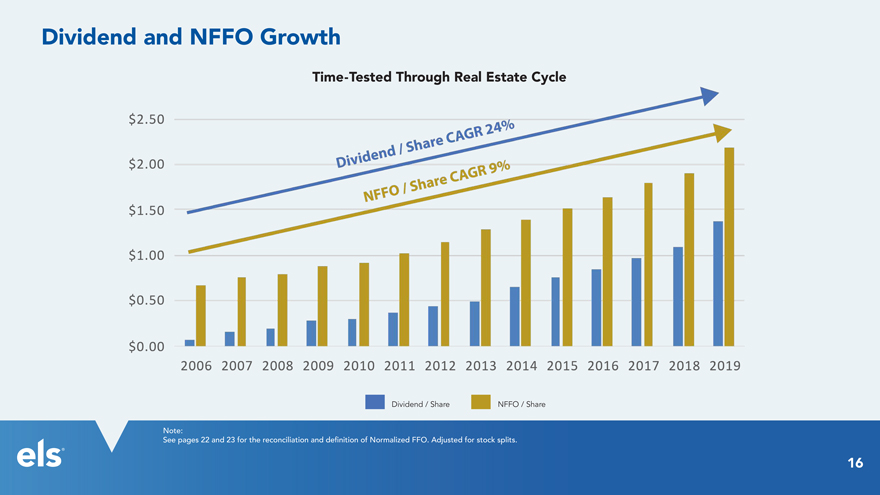
Dividend and NFFO Growth
Time-Tested Through Real Estate Cycle
Dividend / Share NFFO / Share
See Note: pages 22 and 23 for the reconciliation and definition of Normalized FFO. Adjusted for stock splits.
18
7
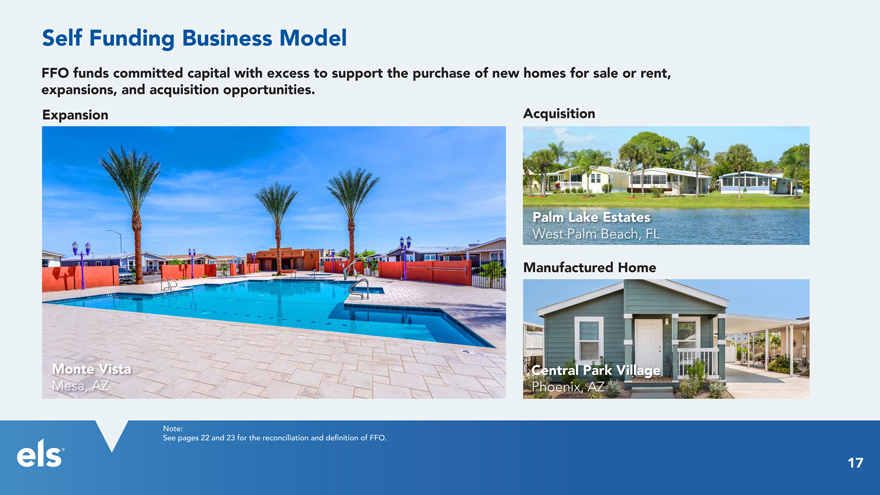
Self Funding Business Model
expansions, FFO funds committed and acquisition capital opportunities. with excess to support the purchase of new homes for sale or rent, Expansion Acquisition
Palm Lake Estates
West Palm Beach, FL
Manufactured Home
Monte Vista Central Park Village
Mesa, AZ Phoenix, AZ
See Note: pages 22 and 23 for the reconciliation and definition of FFO.
19

Manufactured Home Communities
Coral Cay
Margate, FL
Date Palm Country Club
Cathedral City, CA
Date Palm Country Club
Cathedral City, CA
20
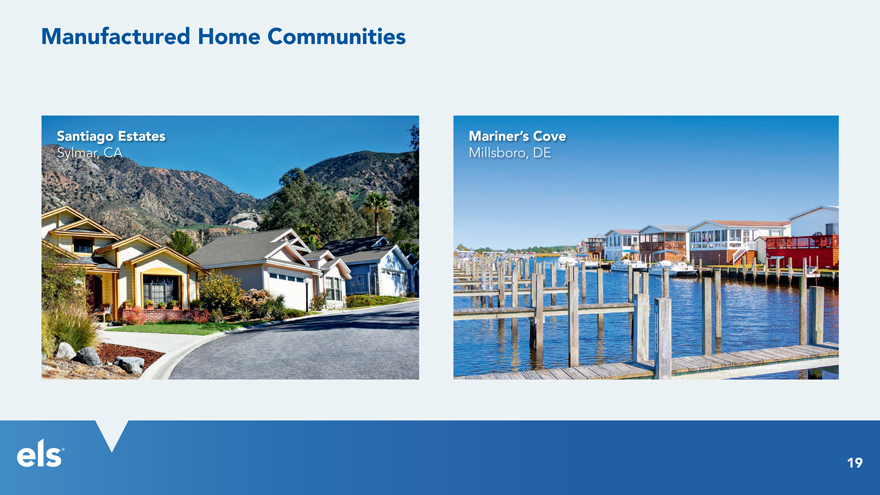
Manufactured Home Communities
Santiago Estates Mariner’s Cove
Sylmar, CA Millsboro, DE 21

RV Resorts
Palm Springs
RV Resort ViewPoint RV & Golf Resort
Palm Desert, CA Mesa, AZ 22

RV Resorts
Portland
Fairview Yosemite Lakes RV Campround
Fairview, OR Groveland, CA
23
Safe Harbor Statement
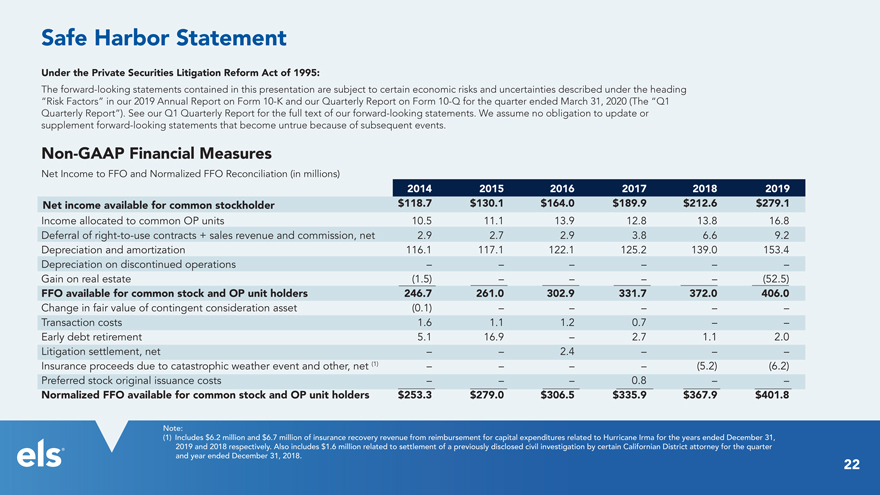
Under the Private Securities Litigation Reform Act of 1995:
The
forward-looking statements contained in this presentation are subject to certain economic risks and uncertainties described under the heading
“Risk
Factors” in our 2019 Annual Report on Form 10-K and our Quarterly Report on Form 10-Q for the quarter ended March 31, 2020 (The “Q1 Quarterly
Report”). See our Q1 Quarterly Report for the full text of our forward-looking statements. We assume no obligation to update or supplement forward-looking statements that become untrue because of subsequent events.
Non-GAAP Financial Measures
Net Income to FFO and
Normalized FFO Reconciliation (in millions)
2014 2015 2016 2017
2014 2015 2016201720182019
Net income available for
common stockholder $118.7 $130.1$164.0$189.9$212.6$279.1
Income allocated to common OP units 10.5
11.113.912.813.816.8
Deferral of right-to-use contracts + sales revenue and
commission, net 2.9 2.72.93.86.69.2
Depreciation and amortization 116.1 117.1122.1125.2139.0153.4
Depreciation on discontinued operations – –––––
Gain on real estate (1.5) ––––(52.5)
FFO available
for common stock and OP unit holders 246.7 261.0302.9331.7372.0406.0
Change in fair value of contingent consideration
asset (0.1) –––––
Transaction costs 1.6 1.11.20.7––
Early debt retirement 5.1 16.9–2.71.12.0
Litigation settlement,
net – –2.4–––
Insurance proceeds due to catastrophic weather event and other, net (1) –
–––(5.2)(6.2)
Preferred stock original issuance costs – ––0.8––
Normalized FFO available for common stock and OP unit holders $253.3 $279.0$306.5$335.9$367.9$401.8
Note:
(1) Includes $6.2 million and $6.7 million of
insurance recovery revenue from reimbursement for capital expenditures related to Hurricane Irma for the years ended December 31,
2019 and 2018 respectively.
Also includes $1.6 million related to settlement of a previously disclosed civil investigation by certain Californian District attorney for the quarter
and
year ended December 31, 2018.
24
Non-GAAP Financial Measures
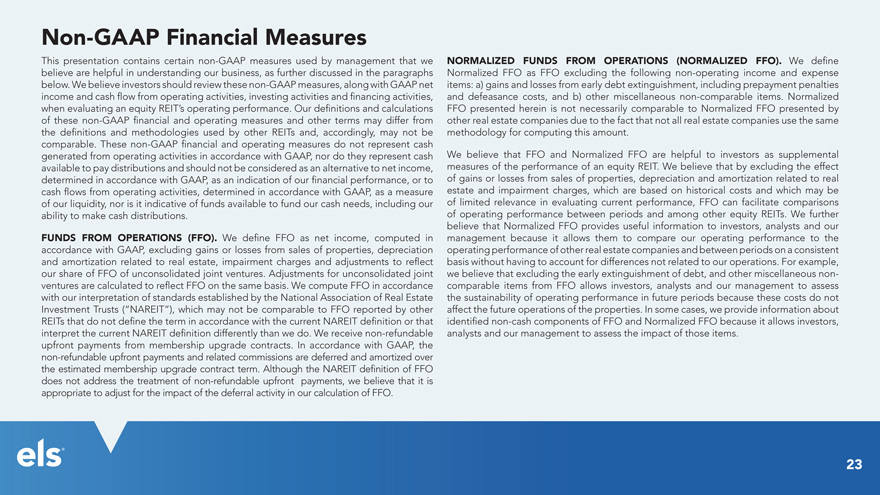
This presentation contains certain non-GAAP measures used by management that we believe are helpful in understanding our business, as
further discussed in the paragraphs below. We believe investors should review these non-GAAP measures, along with GAAP net income and cash flow from operating activities, investing activities and financing
activities, when evaluating an equity REIT’s operating performance. Our definitions and calculations of these non-GAAP financial and operating measures and other terms may differ from the definitions and
methodologies used by other REITs and, accordingly, may not be comparable. These non-GAAP financial and operating measures do not represent cash generated from operating activities in accordance with GAAP, nor
do they represent cash available to pay distributions and should not be considered as an alternative to net income, determined in accordance with GAAP, as an indication of our financial performance, or to cash flows from operating activities,
determined in accordance with GAAP, as a measure of our liquidity, nor is it indicative of funds available to fund our cash needs, including our ability to make cash distributions.
FUNDS FROM OPERATIONS (FFO). We define FFO as net income, computed in accordance with GAAP, excluding gains or losses from sales of properties, depreciation and amortization
related to real estate, impairment charges and adjustments to reflect our share of FFO of unconsolidated joint ventures. Adjustments for unconsolidated joint ventures are calculated to reflect FFO on the same basis. We compute FFO in accordance with
our interpretation of standards established by the National Association of Real Estate
Investment Trusts (“NAREIT”), which may not be comparable to FFO
reported by other REITs that do not define the term in accordance with the current NAREIT definition or that interpret the current NAREIT definition differently than we do. We receive non-refundable upfront
payments from membership upgrade contracts. In accordance with GAAP, the non-refundable upfront payments and related commissions are deferred and amortized over the estimated membership upgrade contract term.
Although the NAREIT definition of FFO does not address the treatment of non-refundable upfront payments, we believe that it is appropriate to adjust for the impact of the deferral activity in our calculation
of FFO.
NORMALIZED FUNDS FROM OPERATIONS (NORMALIZED FFO). We define Normalized FFO as FFO excluding the following
non-operating income and expense items: a) gains and losses from early debt extinguishment, including prepayment penalties and defeasance costs, and b) other miscellaneous
non-comparable items. Normalized
FFO presented herein is not necessarily comparable to Normalized FFO presented by other
real estate companies due to the fact that not all real estate companies use the same methodology for computing this amount.
We believe that FFO and Normalized FFO
are helpful to investors as supplemental measures of the performance of an equity REIT. We believe that by excluding the effect of gains or losses from sales of properties, depreciation and amortization related to real estate and impairment charges,
which are based on historical costs and which may be of limited relevance in evaluating current performance, FFO can facilitate comparisons of operating performance between periods and among other equity REITs. We further believe that Normalized FFO
provides useful information to investors, analysts and our management because it allows them to compare our operating performance to the operating performance of other real estate companies and between periods on a consistent basis without having to
account for differences not related to our operations. For example, we believe that excluding the early extinguishment of debt, and other miscellaneous non-comparable items from FFO allows investors, analysts
and our management to assess the sustainability of operating performance in future periods because these costs do not affect the future operations of the properties. In some cases, we provide information about identified non-cash components of FFO and Normalized FFO because it allows investors, analysts and our management to assess the impact of those items.
25
NON-GAAP FINANCIAL
MEASURES CONTINUED
EARNINGS BEFORE INTEREST, ADJUSTED TAX, DEPRECIATION EBITDARE. AND AMORTIZATION FOR REAL ESTATE
(EBITDARE) AND WE DEFINE EBITDARE AS NET INCOME OR LOSS EXCLUDING INTEREST
INCOME AND EXPENSE, INCOME TAXES, DEPRECIATION AND AMORTIZATION, GAINS OR LOSSES
FROM SALES OF PROPERTIES, IMPAIRMENTS CHARGES, AND ADJUSTMENTS TO REFLECT OUR
SHARE OF EBITDARE OF UNCONSOLIDATED JOINT VENTURES. WE COMPUTE EBITDARE IN
ACCORDANCE WITH OUR INTERPRETATION OF THE STANDARDS ESTABLISHED BY NAREIT, WHICH MAY
NOT BE COMPARABLE TO EBITDARE REPORTED BY OTHER REITS THAT DO NOT
DEFINE THE TERM IN ACCORDANCE WITH THE CURRENT NAREIT DEFINITION OR THAT
INTERPRET THE CURRENT NAREIT DEFINITION DIFFERENTLY THAN WE DO. WE RECEIVE NON-REFUNDABLE UPFRONT PAYMENTS FROM MEMBERSHIP UPGRADE CONTRACTS. IN ACCORDANCE
WITH GAAP, THE NON-REFUNDABLE UPFRONT PAYMENTS AND RELATED COMMISSIONS
ARE DEFERRED AND AMORTIZED OVER THE ESTIMATED CUSTOMER LIFE. ALTHOUGH THE NAREIT
DEFINITION OF EBITDARE DOES NOT ADDRESS THE TREATMENT OF
NON-REFUNDABLE UPFRONT PAYMENTS, WE BELIEVE THAT IT IS
APPROPRIATE TO ADJUST FOR THE IMPACT OF THE DEFERRAL ACTIVITY IN OUR
CALCULATION OF EBITDARE. WE DEFINE ADJUSTED EBITDARE AS
EBITDARE EXCLUDING NON-OPERATING INCOME AND
EXPENSE ITEMS, SUCH AS GAINS AND LOSSES FROM EARLY DEBT EXTINGUISHMENT,
INCLUDING PREPAYMENT PENALTIES AND DEFEASANCE COSTS, AND OTHER MISCELLANEOUS NON-COMPARABLE ITEMS. WE BELIEVE THAT EBITDARE AND ADJUSTED EBITDARE
MAY BE USEFUL TO AN INVESTOR IN EVALUATING OUR OPERATING PERFORMANCE
AND LIQUIDITY BECAUSE THE MEASURES ARE WIDELY USED TO MEASURE THE
OPERATING PERFORMANCE OF AN EQUITY REIT. 26
Non- GAAP Financial Measures Continued
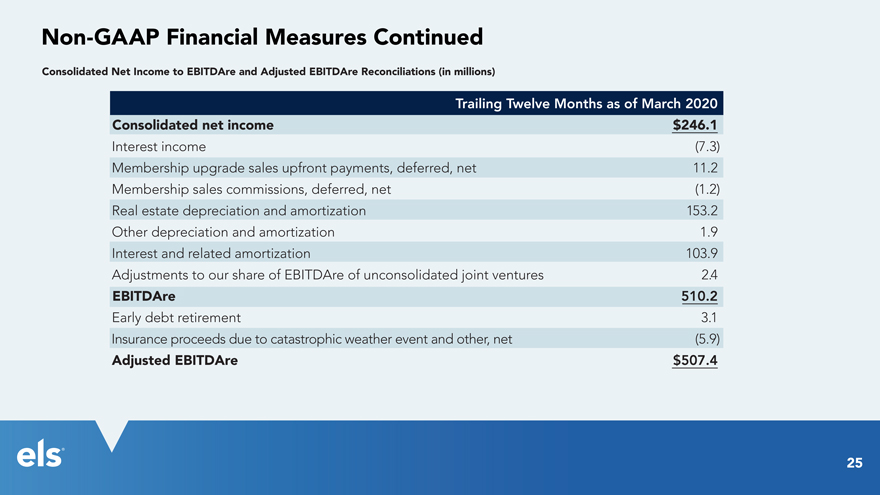
Consolidated Net Income to EBITDAre and Adjusted EBITDAre Reconciliations (in millions)
Trailing Twelve Months as of March 2020
Consolidated net income $246.1
Interest income (7.3)
Membership upgrade sales
upfront payments, deferred, net 11.2
Membership sales commissions, deferred, net (1.2)
Real estate depreciation and amortization 153.2
Other depreciation and
amortization 1.9
Interest and related amortization 103.9
Adjustments to our share of EBITDAre of unconsolidated joint ventures 2.4
EBITDAre 510.2
Early debt retirement 3.1
Insurance proceeds due to catastrophic weather event and other, net (5.9)
Adjusted EBITDAre $507.4
27

ELS 28

Equity LifeStyle Properties Two North Riverside Plaza, Chicago, Illinois 60606 • (800) 247-5279 • EquityLifeStyleProperties.com 06/20 29