Attached files
| file | filename |
|---|---|
| 8-K - 8-K - AILERON THERAPEUTICS INC | d830738d8k.htm |
Interim data from Phase 1b dose optimization trial Exhibit 99.1
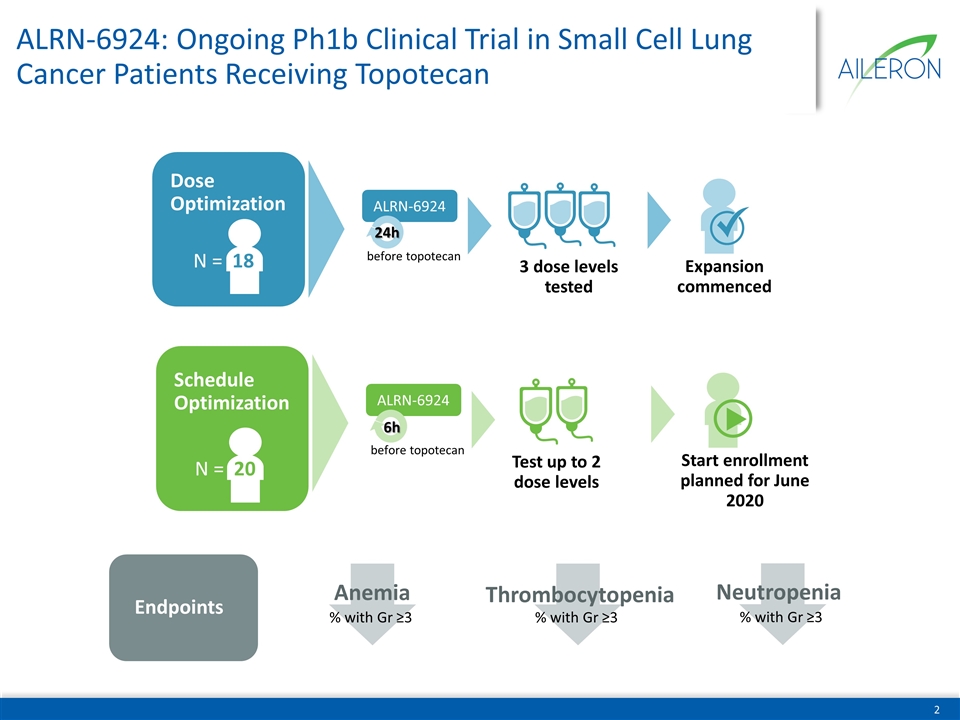
ALRN-6924: Ongoing Ph1b Clinical Trial in Small Cell Lung Cancer Patients Receiving Topotecan Dose Optimization N = 18 ALRN-6924 24h before topotecan 3 dose levels tested Expansion commenced Schedule Optimization N = 20 ALRN-6924 6h before topotecan Test up to 2 dose levels Start enrollment planned for June 2020 Endpoints % with Gr ≥3 Anemia % with Gr ≥3 Thrombocytopenia % with Gr ≥3 Neutropenia
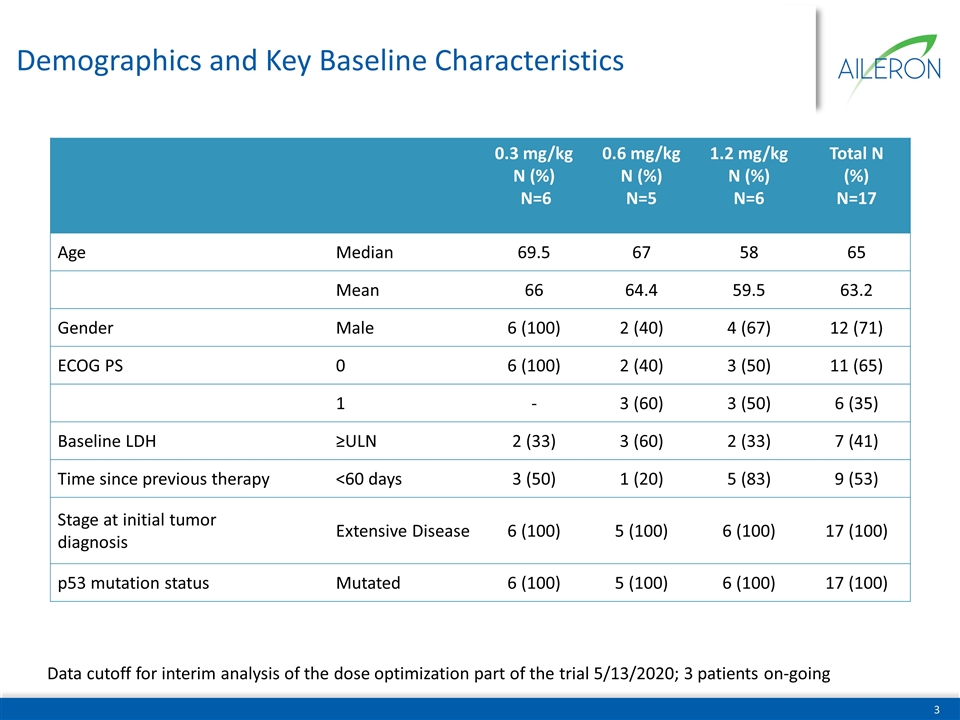
Demographics and Key Baseline Characteristics Data cutoff for interim analysis of the dose optimization part of the trial 5/13/2020; 3 patients on-going 0.3 mg/kg N (%) N=6 0.6 mg/kg N (%) N=5 1.2 mg/kg N (%) N=6 Total N (%) N=17 Age Median 69.5 67 58 65 Mean 66 64.4 59.5 63.2 Gender Male 6 (100) 2 (40) 4 (67) 12 (71) ECOG PS 0 6 (100) 2 (40) 3 (50) 11 (65) 1 - 3 (60) 3 (50) 6 (35) Baseline LDH ≥ULN 2 (33) 3 (60) 2 (33) 7 (41) Time since previous therapy <60 days 3 (50) 1 (20) 5 (83) 9 (53) Stage at initial tumor diagnosis Extensive Disease 6 (100) 5 (100) 6 (100) 17 (100) p53 mutation status Mutated 6 (100) 5 (100) 6 (100) 17 (100)
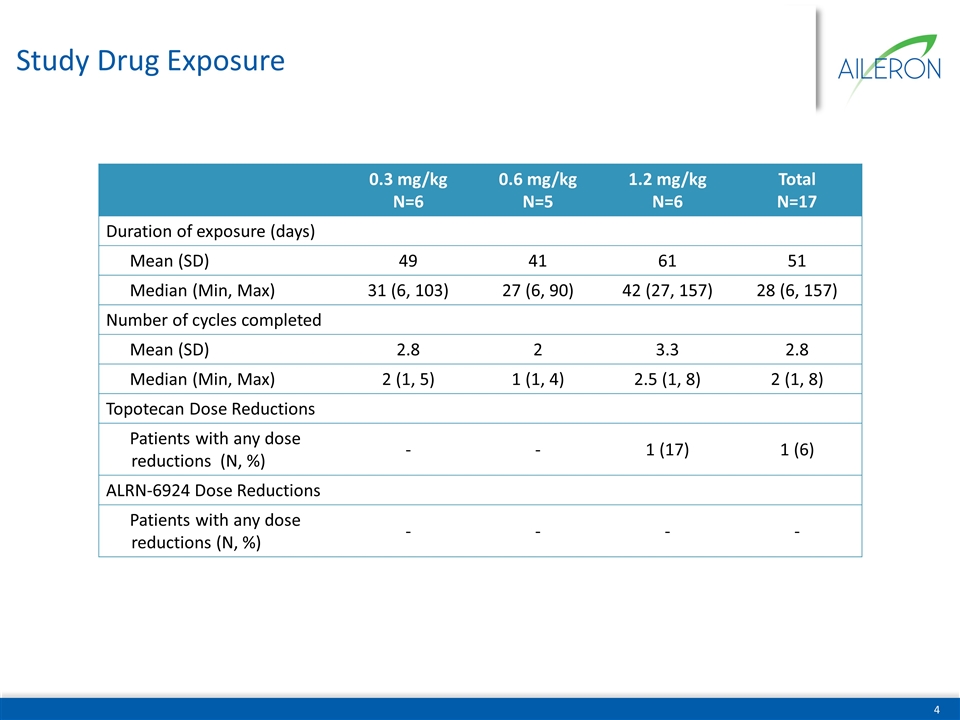
Study Drug Exposure 0.3 mg/kg N=6 0.6 mg/kg N=5 1.2 mg/kg N=6 Total N=17 Duration of exposure (days) Mean (SD) 49 41 61 51 Median (Min, Max) 31 (6, 103) 27 (6, 90) 42 (27, 157) 28 (6, 157) Number of cycles completed Mean (SD) 2.8 2 3.3 2.8 Median (Min, Max) 2 (1, 5) 1 (1, 4) 2.5 (1, 8) 2 (1, 8) Topotecan Dose Reductions Patients with any dose reductions (N, %) - - 1 (17) 1 (6) ALRN-6924 Dose Reductions Patients with any dose reductions (N, %) - - - -
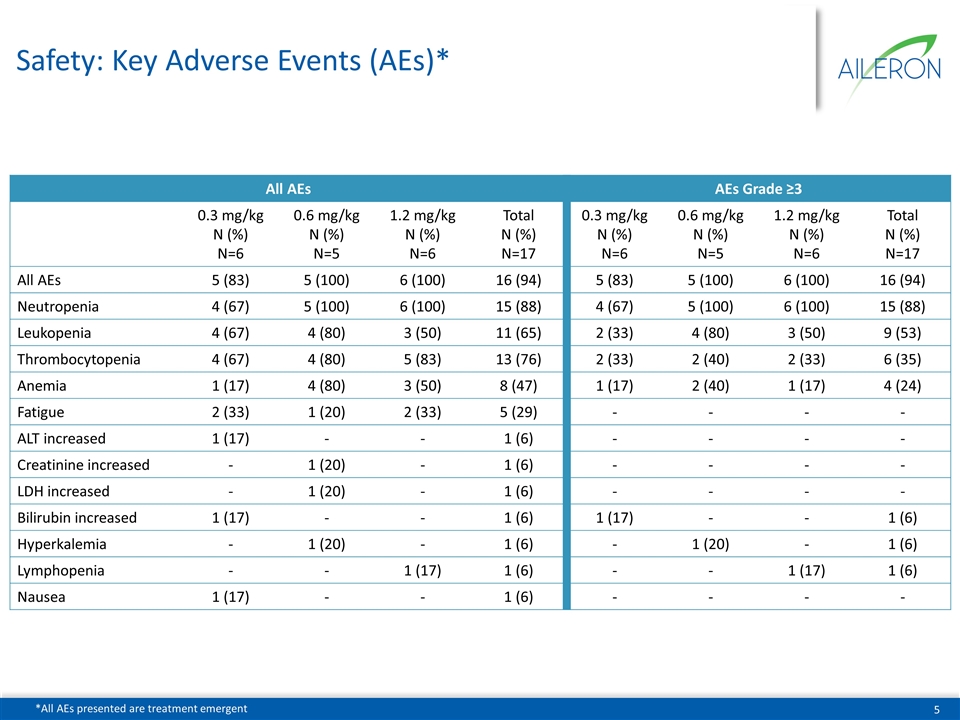
Safety: Key Adverse Events (AEs)* All AEs AEs Grade ≥3 0.3 mg/kg N (%) N=6 0.6 mg/kg N (%) N=5 1.2 mg/kg N (%) N=6 Total N (%) N=17 0.3 mg/kg N (%) N=6 0.6 mg/kg N (%) N=5 1.2 mg/kg N (%) N=6 Total N (%) N=17 All AEs 5 (83) 5 (100) 6 (100) 16 (94) 5 (83) 5 (100) 6 (100) 16 (94) Neutropenia 4 (67) 5 (100) 6 (100) 15 (88) 4 (67) 5 (100) 6 (100) 15 (88) Leukopenia 4 (67) 4 (80) 3 (50) 11 (65) 2 (33) 4 (80) 3 (50) 9 (53) Thrombocytopenia 4 (67) 4 (80) 5 (83) 13 (76) 2 (33) 2 (40) 2 (33) 6 (35) Anemia 1 (17) 4 (80) 3 (50) 8 (47) 1 (17) 2 (40) 1 (17) 4 (24) Fatigue 2 (33) 1 (20) 2 (33) 5 (29) - - - - ALT increased 1 (17) - - 1 (6) - - - - Creatinine increased - 1 (20) - 1 (6) - - - - LDH increased - 1 (20) - 1 (6) - - - - Bilirubin increased 1 (17) - - 1 (6) 1 (17) - - 1 (6) Hyperkalemia - 1 (20) - 1 (6) - 1 (20) - 1 (6) Lymphopenia - - 1 (17) 1 (6) - - 1 (17) 1 (6) Nausea 1 (17) - - 1 (6) - - - - *All AEs presented are treatment emergent
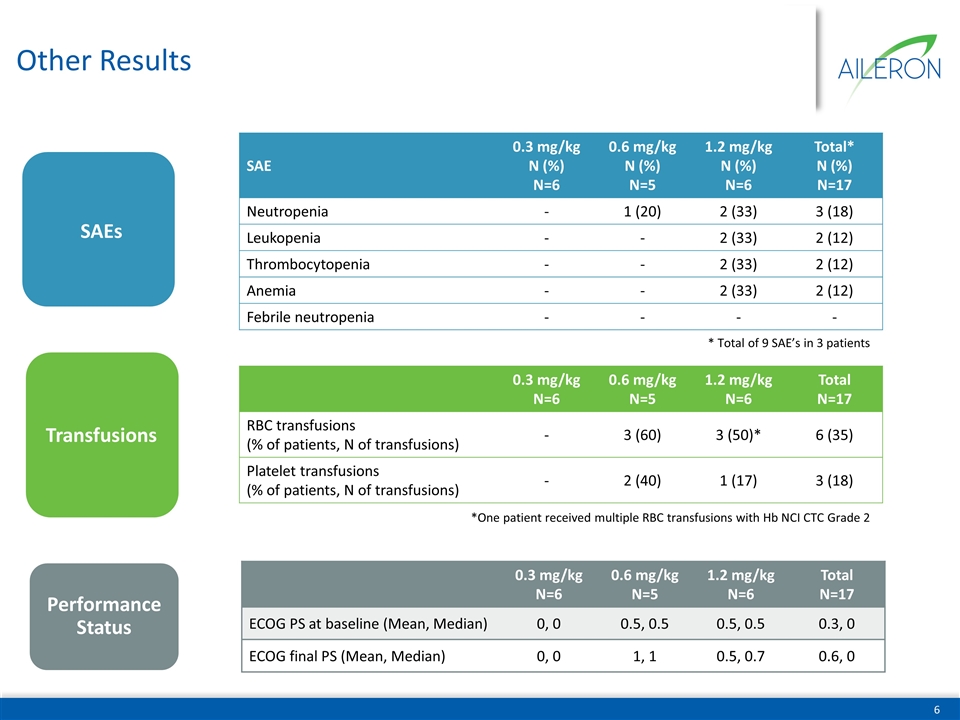
Other Results Performance Status SAEs 0.3 mg/kg N=6 0.6 mg/kg N=5 1.2 mg/kg N=6 Total N=17 RBC transfusions (% of patients, N of transfusions) - 3 (60) 3 (50)* 6 (35) Platelet transfusions (% of patients, N of transfusions) - 2 (40) 1 (17) 3 (18) *One patient received multiple RBC transfusions with Hb NCI CTC Grade 2 Transfusions SAE 0.3 mg/kg N (%) N=6 0.6 mg/kg N (%) N=5 1.2 mg/kg N (%) N=6 Total* N (%) N=17 Neutropenia - 1 (20) 2 (33) 3 (18) Leukopenia - - 2 (33) 2 (12) Thrombocytopenia - - 2 (33) 2 (12) Anemia - - 2 (33) 2 (12) Febrile neutropenia - - - - 0.3 mg/kg N=6 0.6 mg/kg N=5 1.2 mg/kg N=6 Total N=17 ECOG PS at baseline (Mean, Median) 0, 0 0.5, 0.5 0.5, 0.5 0.3, 0 ECOG final PS (Mean, Median) 0, 0 1, 1 0.5, 0.7 0.6, 0 * Total of 9 SAE’s in 3 patients
