Attached files
| file | filename |
|---|---|
| 8-K - 8-K - SOUTHWEST IOWA RENEWABLE ENERGY, LLC | form8k.htm |
Exhibit 99.1

2019 Fiscal Year Annual Meeting Friday, May 22, 2020 Virtual Presentation

This presentation contains certain forward-looking statements within the meaning of the Private
Securities Litigation Reform Act of 1995. Such statements are made in good faith by Southwest Iowa Renewable Energy, LLC (“SIRE,” “us” or “we”) and are identified by including terms such as “may,” “will,” “should,” “expects,” “anticipates,”
“estimates,” “plans,” or similar language. In connection with these safe-harbor provisions, SIRE has identified in its annual report on Form 10-K, and in its other filings with the SEC, important factors that could cause actual results to
differ materially from those contained in any forward-looking statement made by or on behalf of SIRE, including, without limitation, the risk and nature of our business and the effects of general economic conditions on us. We may experience
significant fluctuations in future operating results due to a number of economic conditions, including, but not limited to, competition in the ethanol industry, commodity market risks, financial market risks, counter-party risks, and risks
associated with changes to federal policy or regulation. The cautionary statements and risk factors in this disclaimer and our Form 10-K expressly qualify all of SIRE’s forward-looking statements in this presentation. The forward-looking
statements contained in this presentation are included in the safe harbor protection provided by Section 27A of the Securities Act of 1933. SIRE further cautions that such factors are not exhaustive or exclusive. SIRE does not undertake to
update any forward-looking statement which may be made from time to time by or on behalf of SIRE unless an update is required by applicable securities laws. Forward-Looking Statements and Disclaimer

Business Meeting Agenda Karol King – Chairman of the Board Call the Meeting to Order - Welcome
Introductions Report on Notice of Meeting/Quorum Adjournment of Business Meeting

Company UpdateMike Jerke – CEO/President

Voting progress….

Three components to manage:MarginEfficiencyExpensesKeys: Our core competency is ethanol production
along with it’s associated co-products.We must continue to generate value through efficient ethanol production.Evaluation of plant enhancement projects remains focused on ROI and increasing efficiency.Continuous evaluation of revenue
diversification is required. Review….
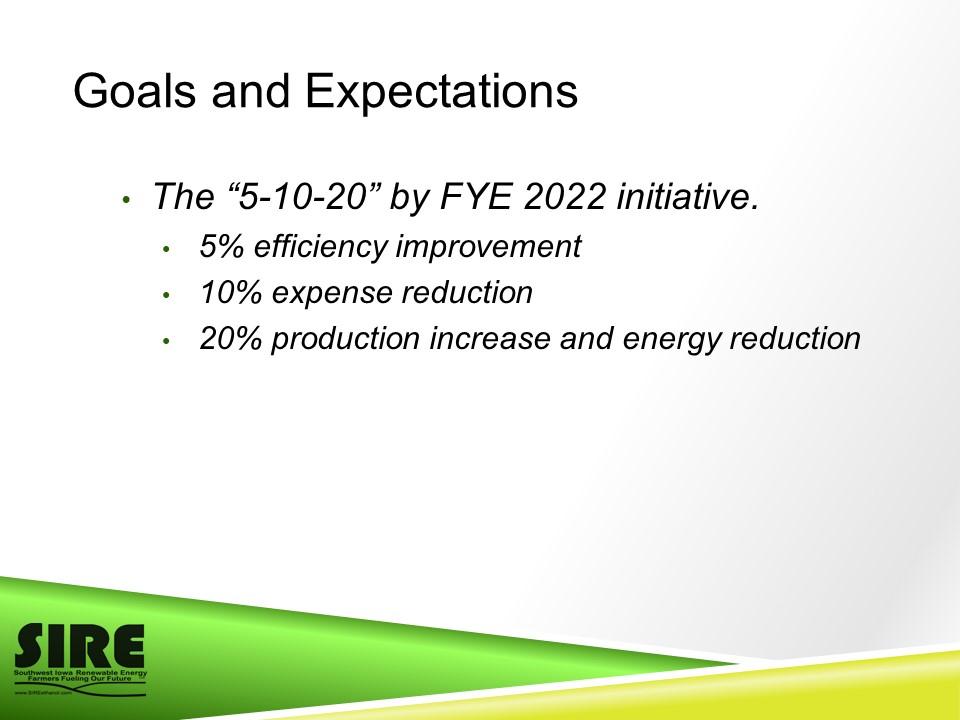
Goals and Expectations The “5-10-20” by FYE 2022 initiative.5% efficiency improvement10% expense
reduction 20% production increase and energy reduction
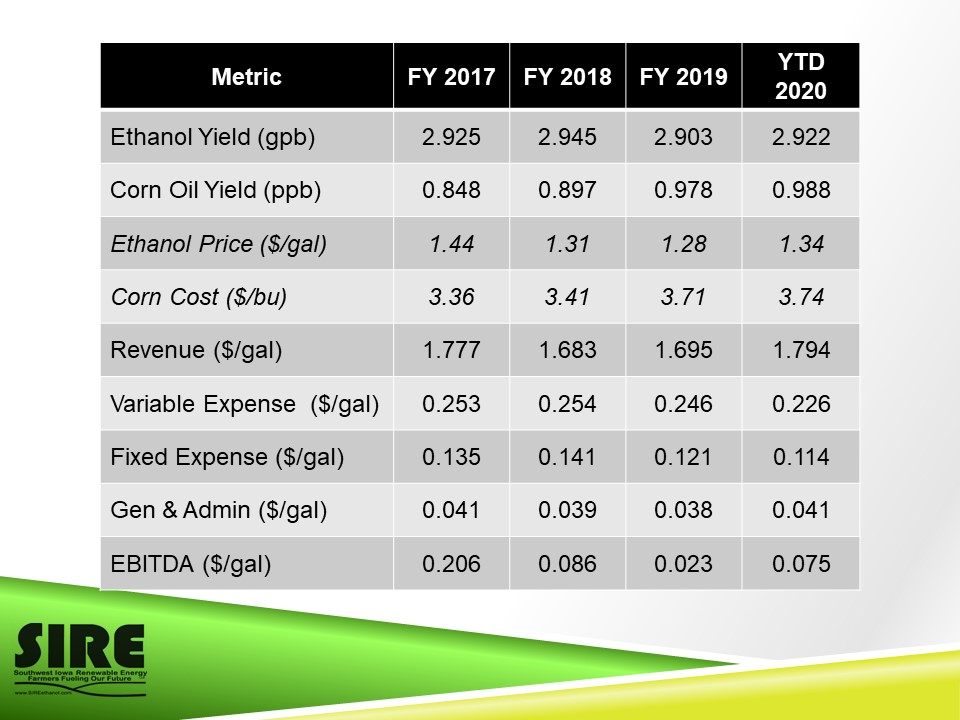
Metric FY 2017 FY 2018 FY 2019 YTD 2020 Ethanol Yield (gpb) 2.925 2.945 2.903 2.922 Corn Oil
Yield (ppb) 0.848 0.897 0.978 0.988 Ethanol Price ($/gal) 1.44 1.31 1.28 1.34 Corn Cost ($/bu) 3.36 3.41 3.71 3.74 Revenue ($/gal) 1.777 1.683 1.695 1.794 Variable Expense ($/gal) 0.253 0.254 0.246 0.226 Fixed Expense
($/gal) 0.135 0.141 0.121 0.114 Gen & Admin ($/gal) 0.041 0.039 0.038 0.041 EBITDA ($/gal) 0.206 0.086 0.023 0.075
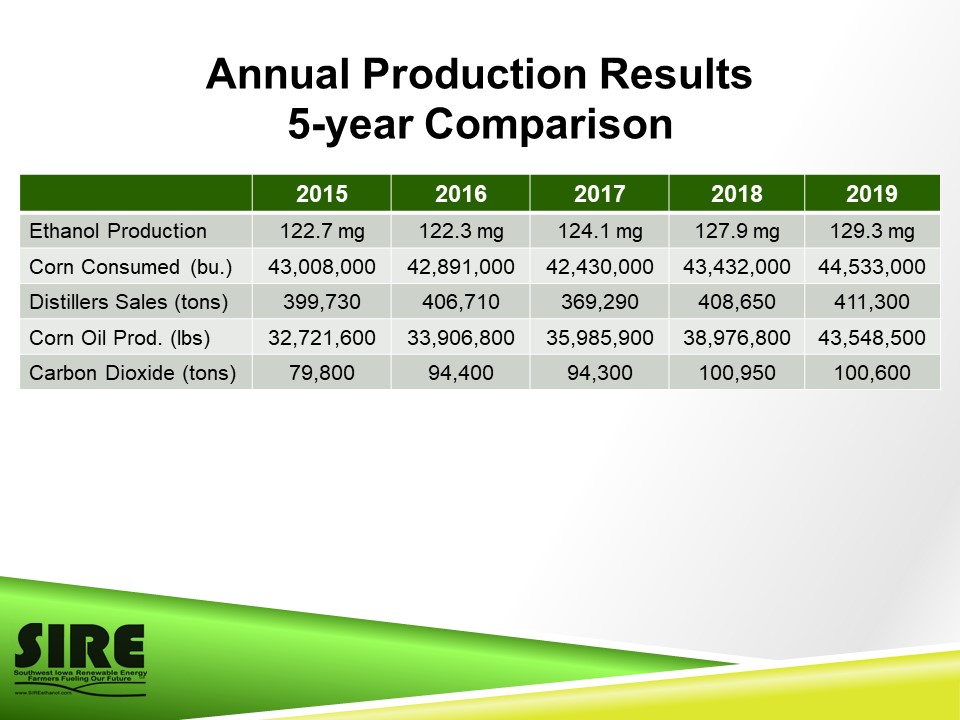
Annual Production Results5-year Comparison 2015 2016 2017 2018 2019 Ethanol Production 122.7
mg 122.3 mg 124.1 mg 127.9 mg 129.3 mg Corn Consumed (bu.) 43,008,000 42,891,000 42,430,000 43,432,000 44,533,000 Distillers Sales (tons) 399,730 406,710 369,290 408,650 411,300 Corn Oil Prod.
(lbs) 32,721,600 33,906,800 35,985,900 38,976,800 43,548,500 Carbon Dioxide (tons) 79,800 94,400 94,300 100,950 100,600


Refinanced in November 2019
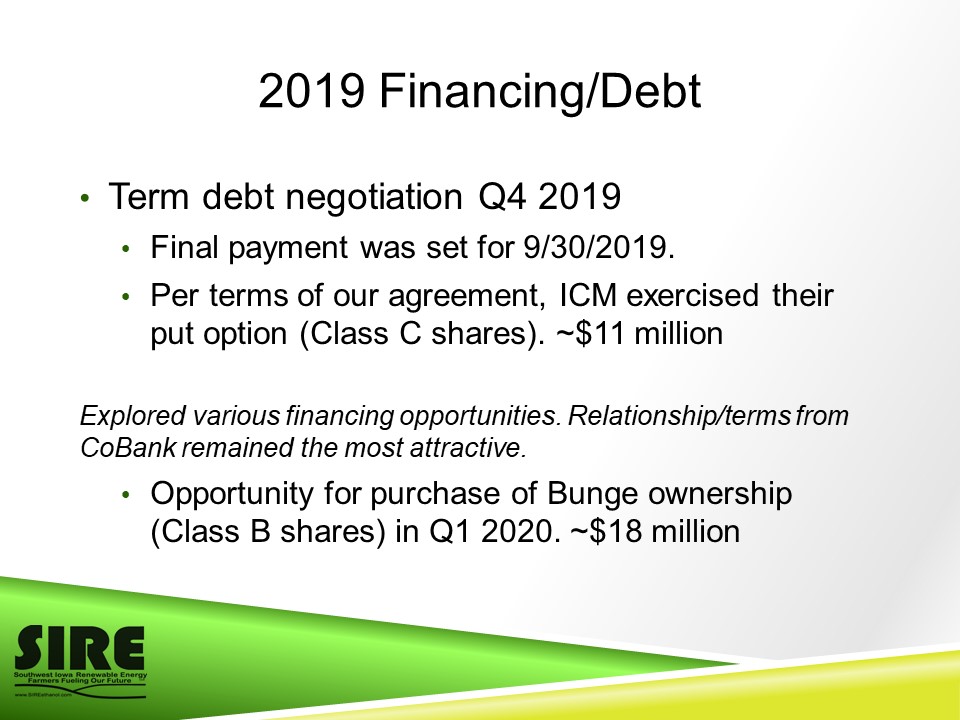
2019 Financing/Debt Term debt negotiation Q4 2019Final payment was set for 9/30/2019.Per terms of our
agreement, ICM exercised their put option (Class C shares). ~$11 millionExplored various financing opportunities. Relationship/terms from CoBank remained the most attractive. Opportunity for purchase of Bunge ownership (Class B shares) in Q1
2020. ~$18 million

Capital Expenditures - 2019 Whitefox $5.1 MMDCS Upgrade $0.2 MMTricanter Surge Tank $0.2 MM Total $5.5
MMCapital Expenditures/Upgrades through March 31, 2020Dryer Exhaust Energy Recovery $8.9 MM (~$11.0 total)Locomotive (lease) $0.4 MM (~$0.8 total)


Financial Summary Brett Frevert - CFO
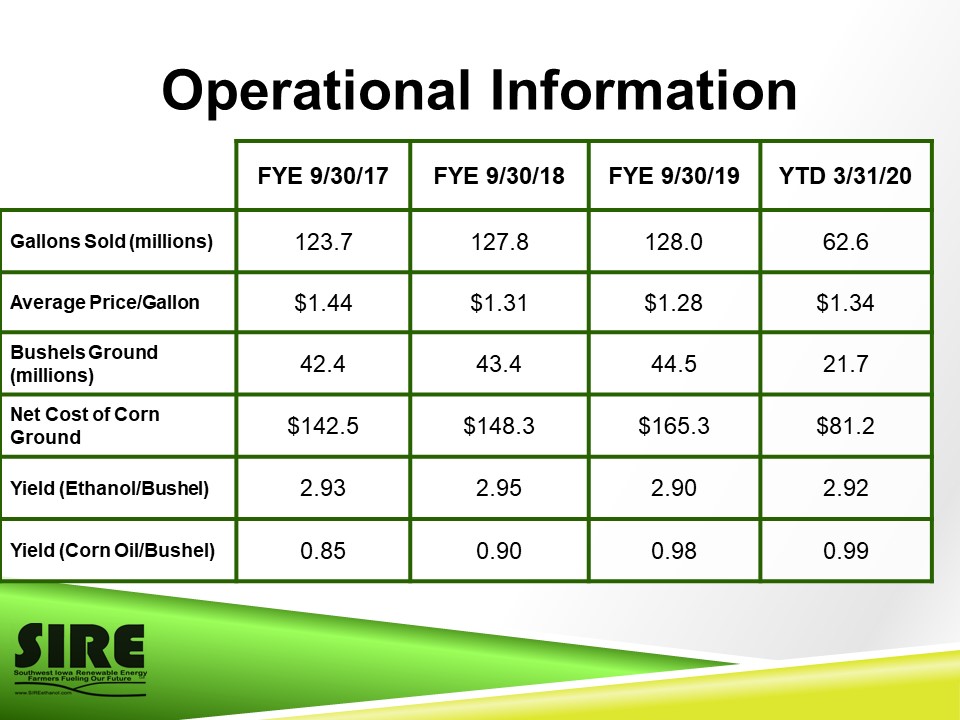
Operational Information FYE 9/30/17 FYE 9/30/18 FYE 9/30/19 YTD 3/31/20 Gallons Sold
(millions) 123.7 127.8 128.0 62.6 Average Price/Gallon $1.44 $1.31 $1.28 $1.34 Bushels Ground (millions) 42.4 43.4 44.5 21.7 Net Cost of Corn Ground $142.5 $148.3 $165.3 $81.2 Yield
(Ethanol/Bushel) 2.93 2.95 2.90 2.92 Yield (Corn Oil/Bushel) 0.85 0.90 0.98 0.99

Financial Highlights(millions, except per gallon) FYE 9/30/17 FYE 9/30/18 FYE 9/30/19 YTD
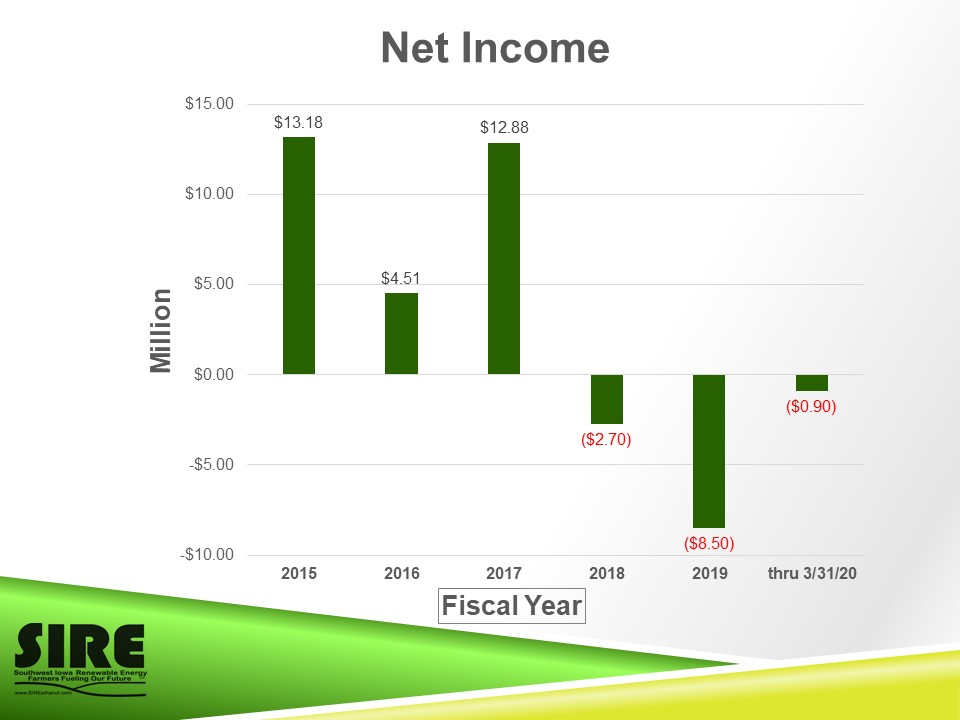
3/31/20 Revenue $219.8 215.0 $217.0 $112.4 Cost of Corn $142.5 $148.3 $165.3 $81.2 Crush Margin / Gallon $0.64 $0.52 $0.43 $0.47 MEBITDA $25.29 $9.61 $2.97 $4.76 Net Income $12.9 $(2.7) $(8.5) $(0.9)

Refinance Comparison Loan Original Loan Modified Loan Revolver Amount
($M) $36.0 $40.0 Maturity ($M annually) $6.0 November 2024 Interest Rate Libor +335 Libor +340 Term Loan Amount ($M) $30.0 $30.0 Payments ($M) $1.5 quarterly $3.75 semiannually Covenants Working Capital
($M) $20.0 $20.0 Distribution Limit 60% Prior Year GAAP Net Income 50% Prior Year GAAP Net Income
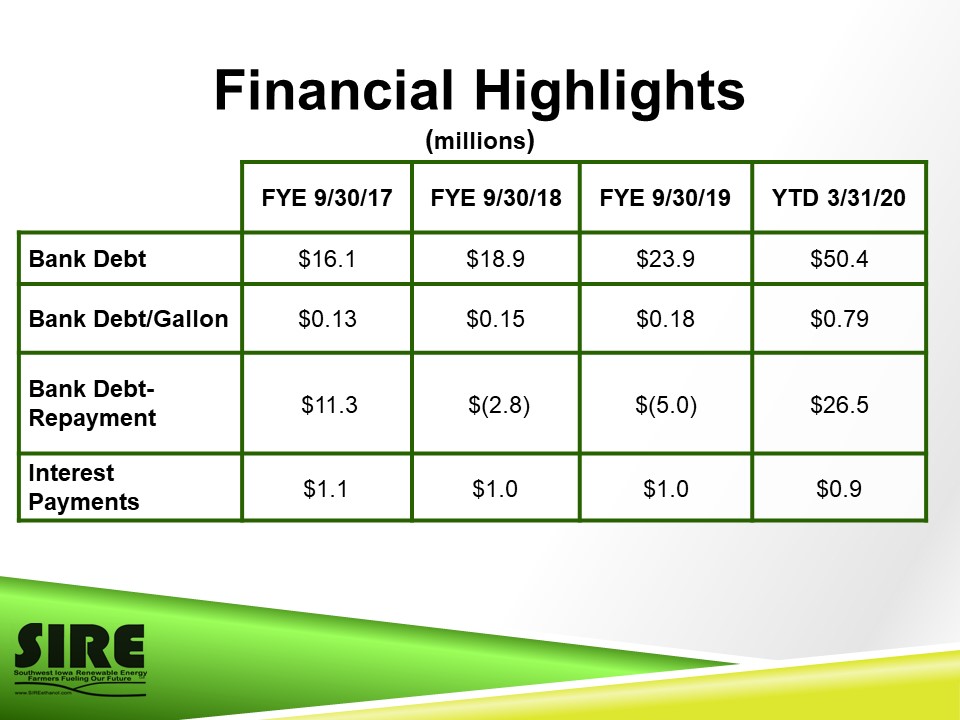
Financial Highlights(millions) FYE 9/30/17 FYE 9/30/18 FYE 9/30/19 YTD 3/31/20 Bank
Debt $16.1 $18.9 $23.9 $50.4 Bank Debt/Gallon $0.13 $0.15 $0.18 $0.79 Bank Debt-Repayment $11.3 $(2.8) $(5.0) $26.5 Interest Payments $1.1 $1.0 $1.0 $0.9

Financial Highlights(millions, except per unit) Calendar 12/31/15 Calendar 12/31/16 Calendar
12/31/17 Calendar 12/31/18 Calendar 12/31/19 Cumulative To Date Distributions $13.3 $3.3 $4.5 $6.7 $0.0 $28.9 Taxable Income $9.9 $18.2 $17.6 ($1.0) ($1.9) N/A Tax Loss Carryforward (adj 2019 ICM and
Bunge) $64.1 $45.9 $28.3 $29.3 $20.5 N/A Tax Loss Carryforward per Unit (adj 2019 ICM and Bunge) $4,952 $3,587 $2,268 $2,341 $2,236 N/A Distribution % of Prior Year Taxable Income 23% 33% 25% 38% 0% N/A

Quarterly Crush MarginPer Gallon of Ethanol Produced 9/30/18 12/31/18 3/31/19 6/30/19 12/30/19
12/31/19 3/31/20

LiquidityIn Millions $ 9/30/17 9/30/18 9/30/19 3/31/20

Nick Watson, Ag Stock Specialist

Industry Update Mike Jerke – CEO/President

COVID-19 Immediate impactFutures market Consumers~50% of ethanol production idledApril 24th reported
that, 75 plants shutdown and 79 plants at reduced capacity.Safety of employeesCapital preservationSIREtizer and undenatured sales to support hand sanitizer production.
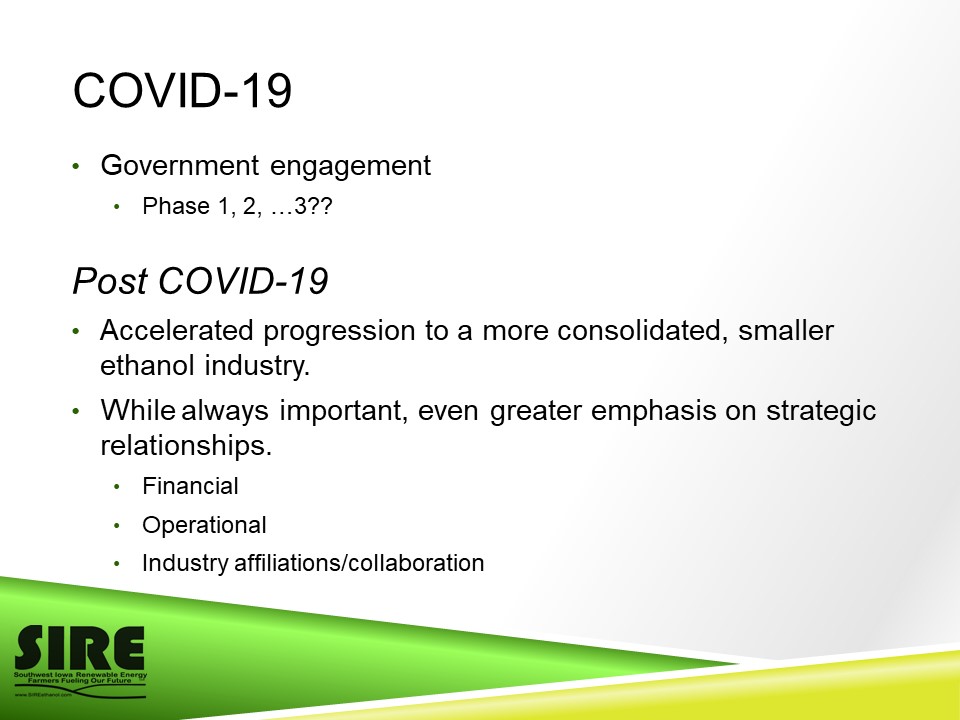
COVID-19 Government engagementPhase 1, 2, …3??Post COVID-19Accelerated progression to a more
consolidated, smaller ethanol industry.While always important, even greater emphasis on strategic relationships.FinancialOperationalIndustry affiliations/collaboration

Final Questions and Answers

Thank you!