Attached files
| file | filename |
|---|---|
| 8-K - 8-K - Old COPPER Company, Inc. | d926894d8k.htm |
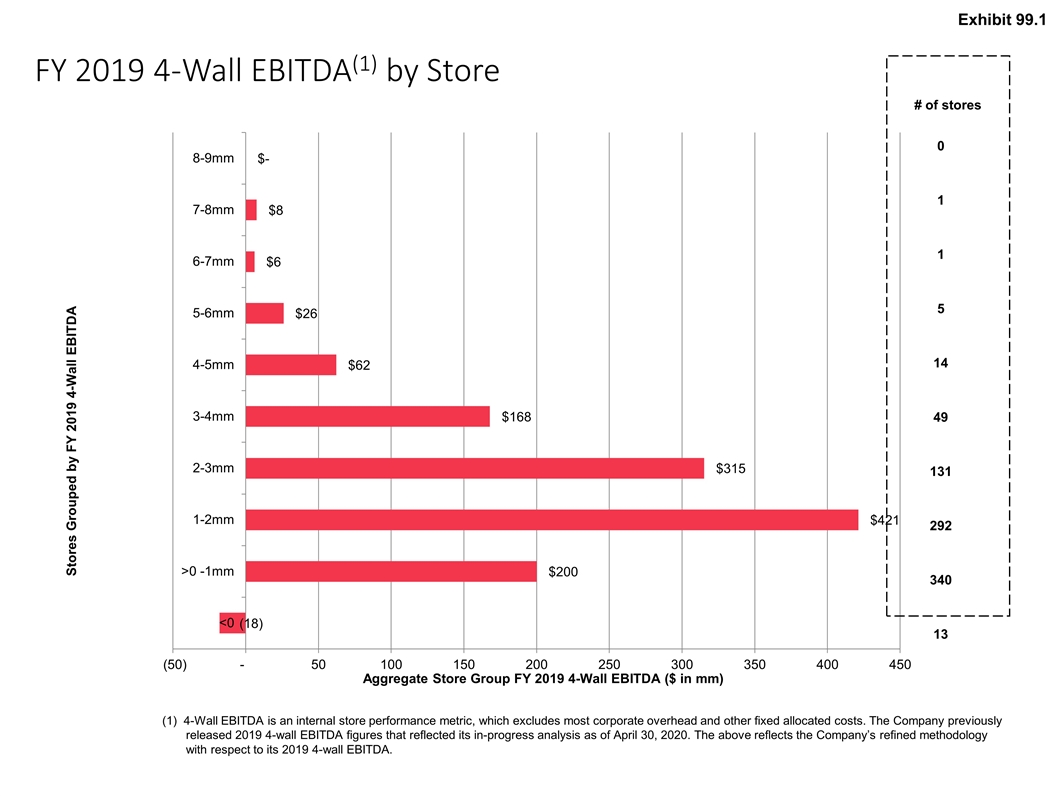
FY 2019 4-Wall EBITDA(1) by Store 2 # of stores 0 1 1 5 14 49 131 292 340 13 (1) 4-Wall EBITDA is an internal store performance metric, which excludes most corporate overhead and other fixed allocated costs. The Company previously released 2019 4-wall EBITDA figures that reflected its in-progress analysis as of April 30, 2020. The above reflects the Company’s refined methodology with respect to its 2019 4-wall EBITDA. Exhibit 99.1
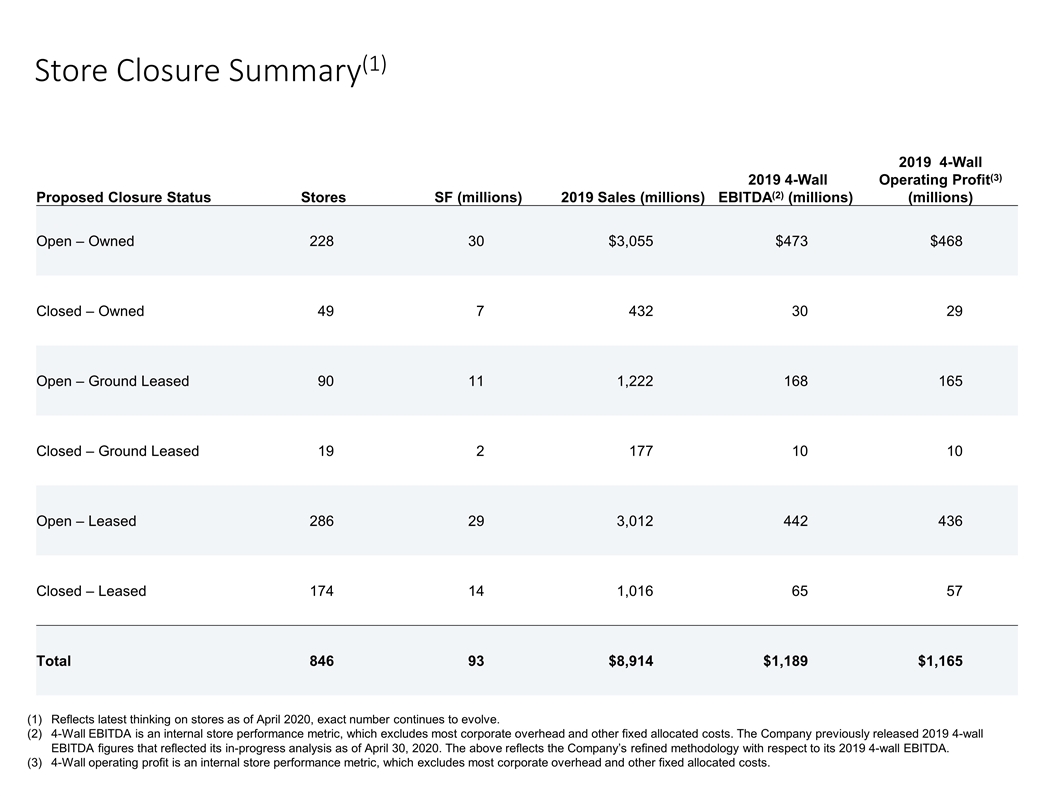
Store Closure Summary(1) 3 Reflects latest thinking on stores as of April 2020, exact number continues to evolve. 4-Wall EBITDA is an internal store performance metric, which excludes most corporate overhead and other fixed allocated costs. The Company previously released 2019 4-wall EBITDA figures that reflected its in-progress analysis as of April 30, 2020. The above reflects the Company’s refined methodology with respect to its 2019 4-wall EBITDA. 4-Wall operating profit is an internal store performance metric, which excludes most corporate overhead and other fixed allocated costs. Proposed Closure Status Stores SF (millions) 2019 Sales (millions) 2019 4-Wall EBITDA(2) (millions) 2019 4-Wall Operating Profit(3) (millions) Open – Owned 228 30 $3,055 $473 $468 Closed – Owned 49 7 432 30 29 Open – Ground Leased 90 11 1,222 168 165 Closed – Ground Leased 19 2 177 10 10 Open – Leased 286 29 3,012 442 436 Closed – Leased 174 14 1,016 65 57 Total 846 93 $8,914 $1,189 $1,165
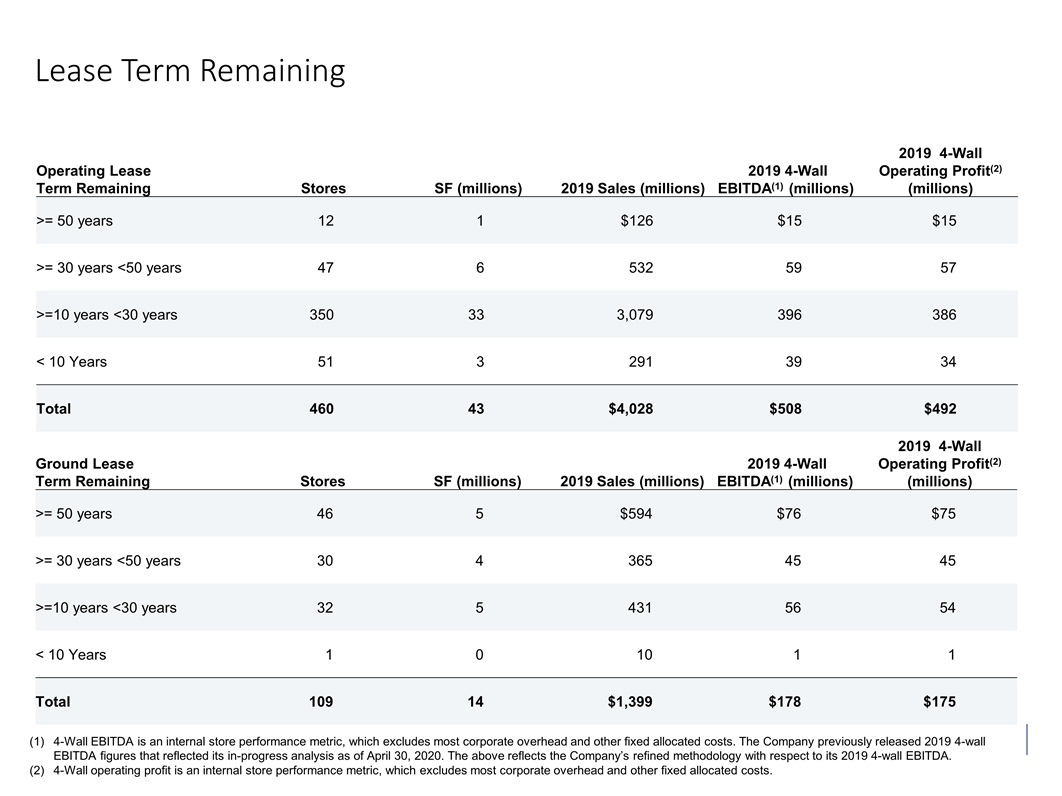
Lease Term Remaining 4 Operating Lease Term Remaining Stores SF (millions) 2019 Sales (millions) 2019 4-Wall EBITDA(1) (millions) 2019 4-Wall Operating Profit(2) (millions) >= 50 years 12 1 $126 $15 $15 >= 30 years <50 years 47 6 532 59 57 >=10 years <30 years 350 33 3,079 396 386 < 10 Years 51 3 291 39 34 Total 460 43 $4,028 $508 $492 Ground Lease Term Remaining Stores SF (millions) 2019 Sales (millions) 2019 4-Wall EBITDA(1) (millions) 2019 4-Wall Operating Profit(2) (millions) >= 50 years 46 5 $594 $76 $75 >= 30 years <50 years 30 4 365 45 45 >=10 years <30 years 32 5 431 56 54 < 10 Years 1 0 10 1 1 Total 109 14 $1,399 $178 $175 4-Wall EBITDA is an internal store performance metric, which excludes most corporate overhead and other fixed allocated costs. The Company previously released 2019 4-wall EBITDA figures that reflected its in-progress analysis as of April 30, 2020. The above reflects the Company’s refined methodology with respect to its 2019 4-wall EBITDA. 4-Wall operating profit is an internal store performance metric, which excludes most corporate overhead and other fixed allocated costs.
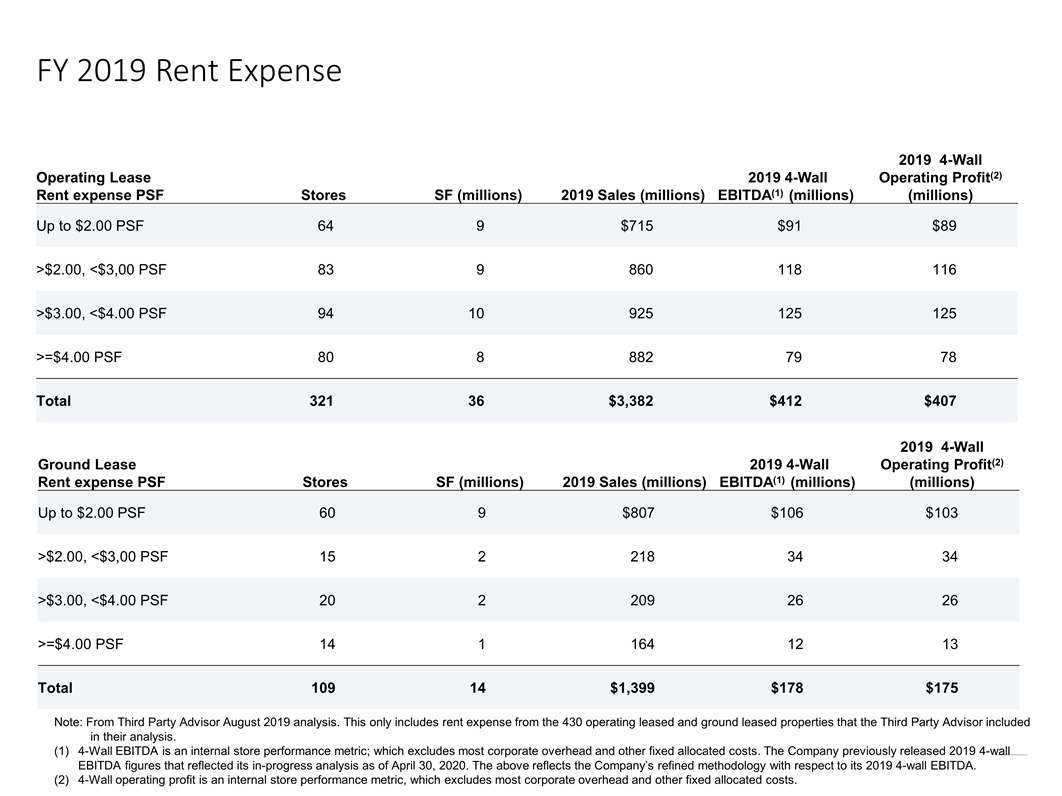
FY 2019 Rent Expense 5 Note: From Third Party Advisor August 2019 analysis. This only includes rent expense from the 430 operating leased and ground leased properties that the Third Party Advisor included in their analysis. 4-Wall EBITDA is an internal store performance metric; which excludes most corporate overhead and other fixed allocated costs. The Company previously released 2019 4-wall EBITDA figures that reflected its in-progress analysis as of April 30, 2020. The above reflects the Company’s refined methodology with respect to its 2019 4-wall EBITDA. 4-Wall operating profit is an internal store performance metric, which excludes most corporate overhead and other fixed allocated costs. Operating Lease Rent expense PSF Stores SF (millions) 2019 Sales (millions) 2019 4-Wall EBITDA(1) (millions) 2019 4-Wall Operating Profit(2) (millions) Up to $2.00 PSF 64 9 $715 $91 $89 >$2.00, <$3,00 PSF 83 9 860 118 116 >$3.00, <$4.00 PSF 94 10 925 125 125 >=$4.00 PSF 80 8 882 79 78 Total 321 36 $3,382 $412 $407 Ground Lease Rent expense PSF Stores SF (millions) 2019 Sales (millions) 2019 4-Wall EBITDA(1) (millions) 2019 4-Wall Operating Profit(2) (millions) Up to $2.00 PSF 60 9 $807 $106 $103 >$2.00, <$3,00 PSF 15 2 218 34 34 >$3.00, <$4.00 PSF 20 2 209 26 26 >=$4.00 PSF 14 1 164 12 13 Total 109 14 $1,399 $178 $175
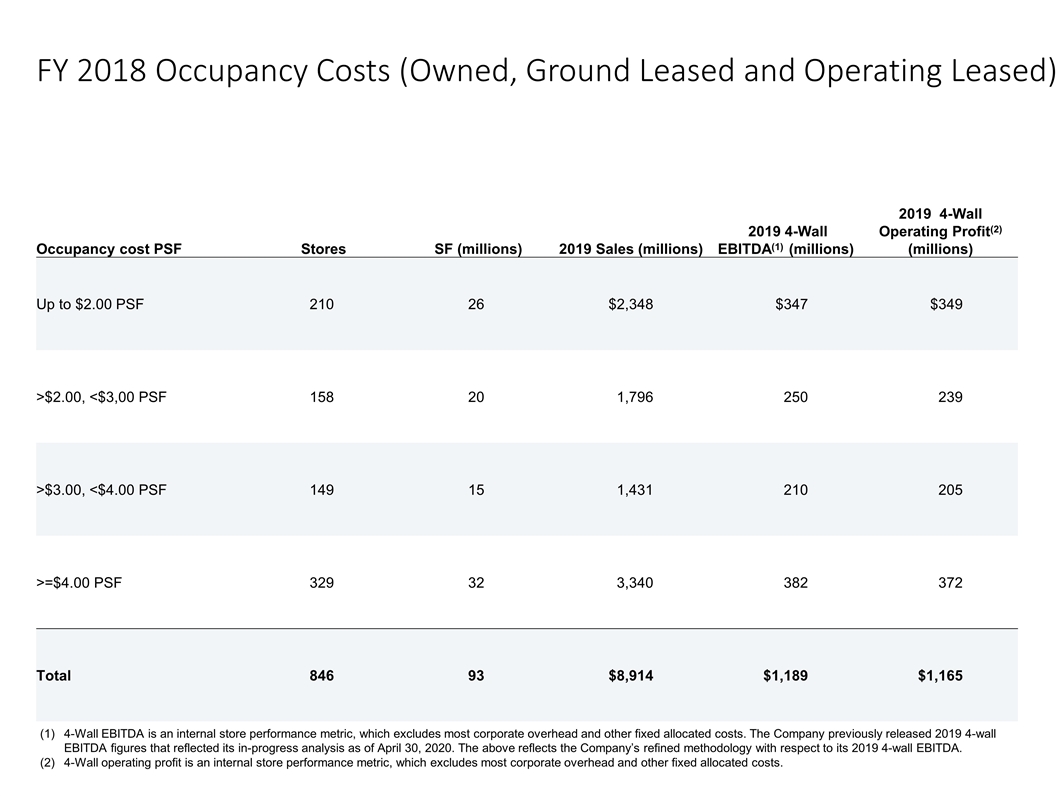
FY 2018 Occupancy Costs (Owned, Ground Leased and Operating Leased) 6 Occupancy cost PSF Stores SF (millions) 2019 Sales (millions) 2019 4-Wall EBITDA(1) (millions) 2019 4-Wall Operating Profit(2) (millions) Up to $2.00 PSF 210 26 $2,348 $347 $349 >$2.00, <$3,00 PSF 158 20 1,796 250 239 >$3.00, <$4.00 PSF 149 15 1,431 210 205 >=$4.00 PSF 329 32 3,340 382 372 Total 846 93 $8,914 $1,189 $1,165 4-Wall EBITDA is an internal store performance metric, which excludes most corporate overhead and other fixed allocated costs. The Company previously released 2019 4-wall EBITDA figures that reflected its in-progress analysis as of April 30, 2020. The above reflects the Company’s refined methodology with respect to its 2019 4-wall EBITDA. 4-Wall operating profit is an internal store performance metric, which excludes most corporate overhead and other fixed allocated costs.
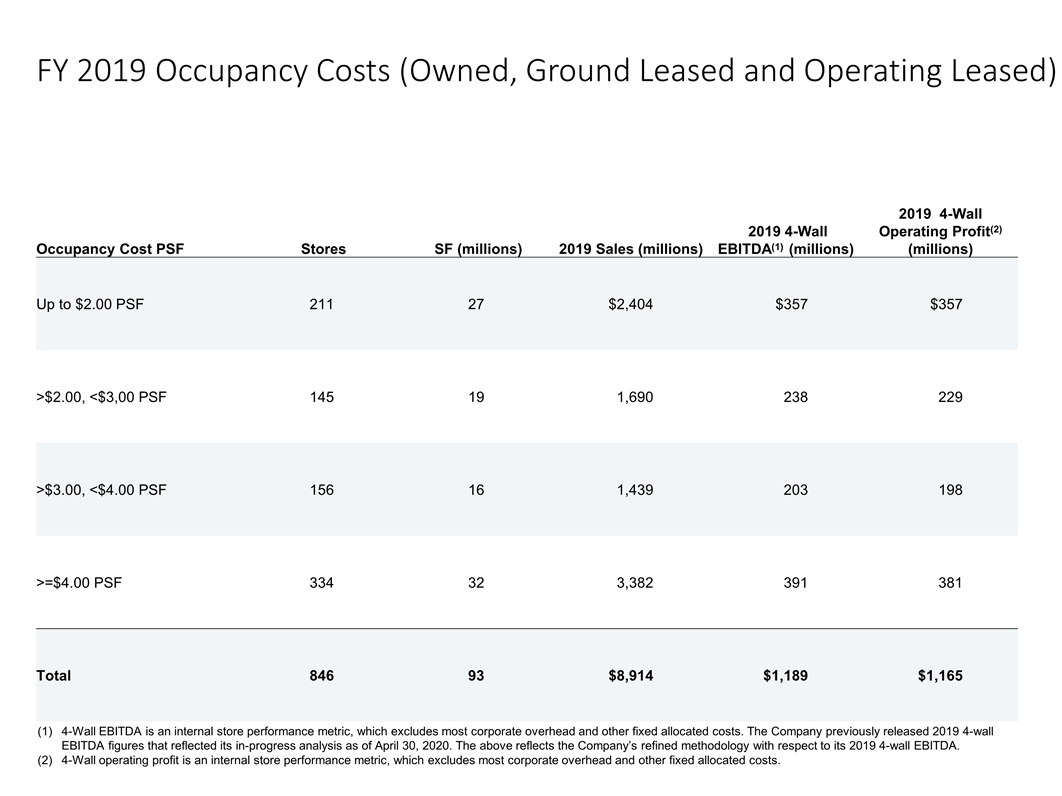
FY 2019 Occupancy Costs (Owned, Ground Leased and Operating Leased) 7 Occupancy Cost PSF Stores SF (millions) 2019 Sales (millions) 2019 4-Wall EBITDA(1) (millions) 2019 4-Wall Operating Profit(2) (millions) Up to $2.00 PSF 211 27 $2,404 $357 $357 >$2.00, <$3,00 PSF 145 19 1,690 238 229 >$3.00, <$4.00 PSF 156 16 1,439 203 198 >=$4.00 PSF 334 32 3,382 391 381 Total 846 93 $8,914 $1,189 $1,165 4-Wall EBITDA is an internal store performance metric, which excludes most corporate overhead and other fixed allocated costs. The Company previously released 2019 4-wall EBITDA figures that reflected its in-progress analysis as of April 30, 2020. The above reflects the Company’s refined methodology with respect to its 2019 4-wall EBITDA. 4-Wall operating profit is an internal store performance metric, which excludes most corporate overhead and other fixed allocated costs.
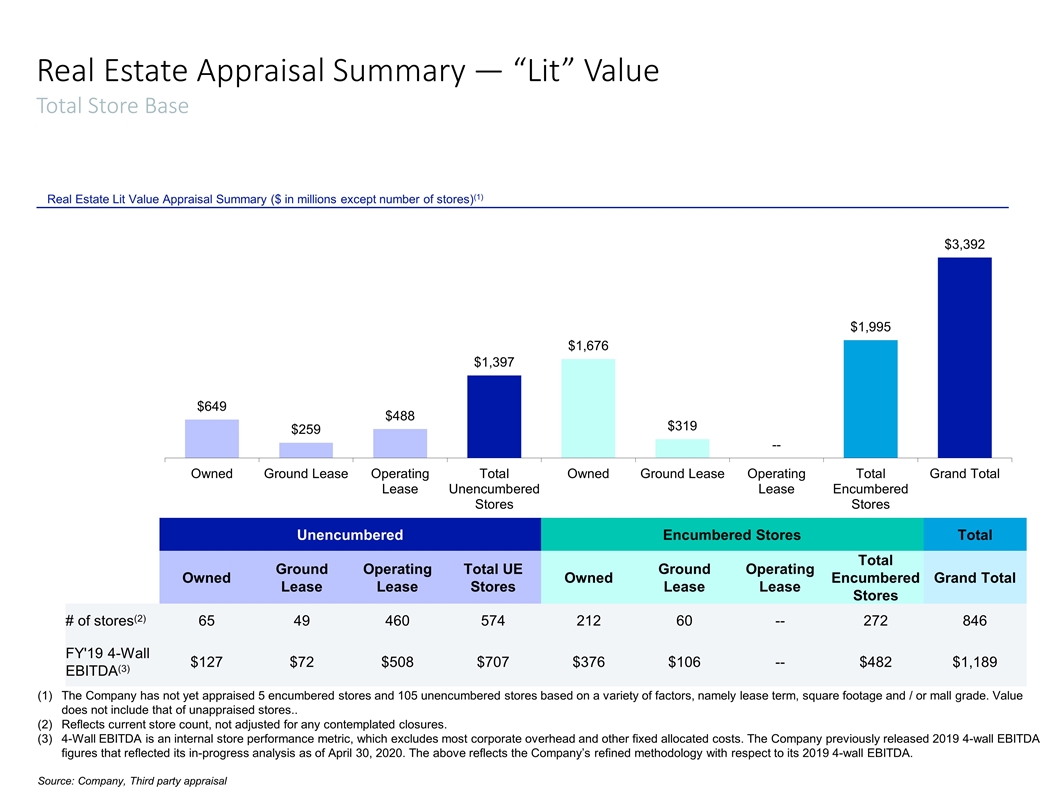
8 Real Estate Appraisal Summary — “Lit” Value Total Store Base Real Estate Lit Value Appraisal Summary ($ in millions except number of stores)(1) Unencumbered Encumbered Stores Total Owned Ground Lease Operating Lease Total UE Stores Owned Ground Lease Operating Lease Total Encumbered Stores Grand Total # of stores(2) 65 49 460 574 212 60 -- 272 846 FY'19 4-Wall EBITDA(3) $127 $72 $508 $707 $376 $106 -- $482 $1,189 Source: Company, Third Party appraisal The Company has not yet appraised 5 encumbered stores and 105 unencumbered stores based on a variety of factors, namely lease term, square footage and / or mall grade. Value does not include that of unappraised stores.. Reflects current store count, not adjusted for any contemplated closures. 4-Wall EBITDA is an internal store performance metric, which excludes most corporate overhead and other fixed allocated costs. The Company previously released 2019 4-wall EBITDA figures that reflected its in-progress analysis as of April 30, 2020. The above reflects the Company’s refined methodology with respect to its 2019 4-wall EBITDA. Source: Company, Third party appraisal
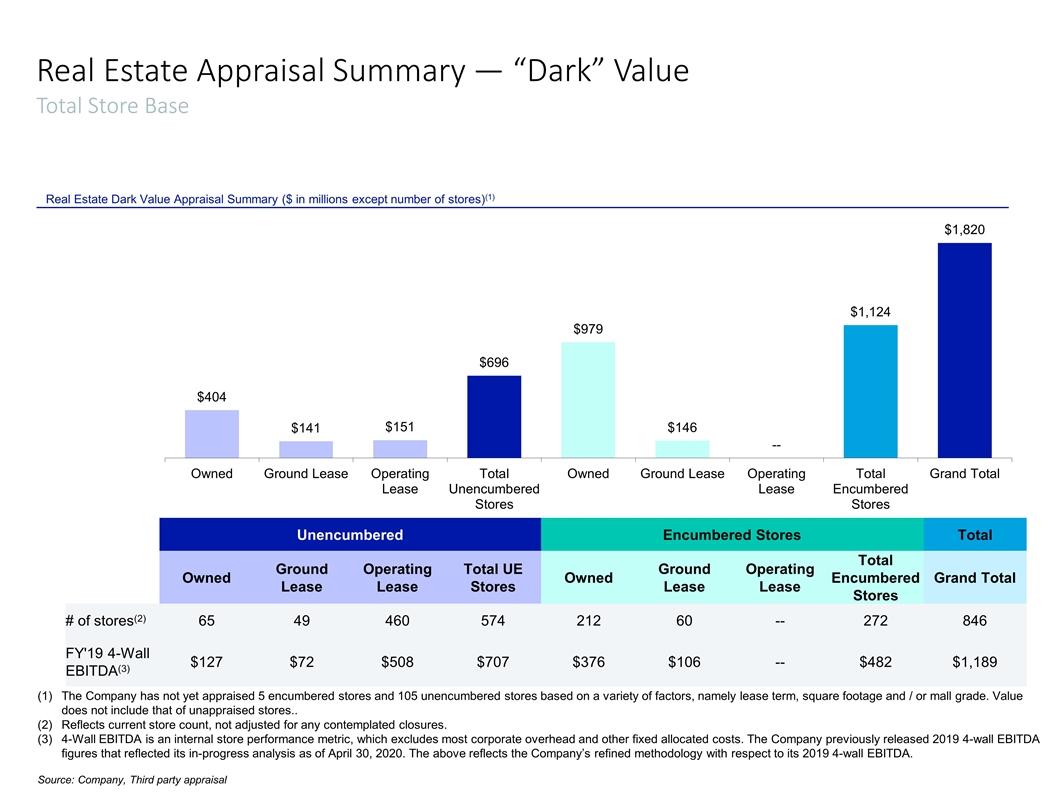
9 Real Estate Appraisal Summary — “Dark” Value Total Store Base Real Estate Dark Value Appraisal Summary ($ in millions except number of stores)(1) Unencumbered Encumbered Stores Total Owned Ground Lease Operating Lease Total UE Stores Owned Ground Lease Operating Lease Total Encumbered Stores Grand Total # of stores(2) 65 49 460 574 212 60 -- 272 846 FY'19 4-Wall EBITDA(3) $127 $72 $508 $707 $376 $106 -- $482 $1,189 The Company has not yet appraised 5 encumbered stores and 105 unencumbered stores based on a variety of factors, namely lease term, square footage and / or mall grade. Value does not include that of unappraised stores.. Reflects current store count, not adjusted for any contemplated closures. 4-Wall EBITDA is an internal store performance metric, which excludes most corporate overhead and other fixed allocated costs. The Company previously released 2019 4-wall EBITDA figures that reflected its in-progress analysis as of April 30, 2020. The above reflects the Company’s refined methodology with respect to its 2019 4-wall EBITDA. Source: Company, Third party appraisal
