Attached files
| file | filename |
|---|---|
| 8-K - 8-K - GUGGENHEIM CREDIT INCOME FUND 2016 T | overview2016tfund10q2020.htm |
Exhibit 99.1 | ||
GUGGENHEIM CREDIT INCOME FUND
FIRST QUARTER 2020 OVERVIEW
This overview contains details about the portfolio and operating results for the quarter ended March 31, 2020 of Guggenheim Credit Income Fund ("GCIF" or the "Master Fund") and its feeder funds, Guggenheim Credit Income Fund 2019 ("GCIF 2019") and Guggenheim Credit Income Fund 2016 T ("GCIF 2016 T") (together, the "Feeder Funds"). This overview should be read in conjunction with the GCIF 2019 and GCIF 2016 T Quarterly Reports on Form 10-Q, which each incorporate the GCIF Quarterly Report on Form 10-Q, as filed with the U.S. Securities and Exchange Commission (the "SEC") on May 14, 2020.
Three Months Ended March 31, 2020 Highlights
• | GCIF 2019 declared distributions of $0.46 per share and GCIF 2016 T declared distributions of $0.16 per share. This represented an annualized distribution rate of 7.87% on GCIF 2019’s Net Asset Value and 7.77% on GCIF 2016 T’s Net Asset Value as of December 31, 2019(1). |
• | GCIF's yield on total debt investments was 8.5%, compared to 8.9% as of December 31, 2019 (2). |
• | GCIF's yield on total investments was 8.4%, compared to 8.9% as of December 31, 2019 (3). |
• | GCIF's total investments at fair value totaled $319 million, of which 98% was in senior debt investments. The portfolio consisted of 143 investments across 86 portfolio companies. |
• | GCIF invested $33 million, 100% of which was in senior debt, with sales and paydowns totaling $52 million. |
• | GCIF had two debt investments on non-accrual status as of March 31, 2020. This represented 1.6% of the portfolio based on amortized cost. |
• | GCIF 2019’s net asset value per share as of March 31, 2020 was $19.66, compared to $23.37 as of December 31, 2019. |
• | GCIF 2016 T’s net asset value per share as of March 31, 2020 was $6.90, compared to $8.24 as of December 31, 2019. |
• | The reduction in net asset values as of March 31, 2020 as compared to net asset values as of December 31, 2019 was the result of significant unrealized depreciation across the fair value of our investments due primarily to the negative economic impact and the increased uncertainty caused by COVID-19 pandemic. |
Please see below for feeder fund-specific highlights:
Three Months Ended March 31, 2020 | ||||||
GCIF 2019 | GCIF 2016 T | |||||
Distributions declared per share | $0.46 | $0.16 | ||||
Total investment return(4) | (14.05 | )% | (14.42 | )% | ||
Total assets ($ in thousands) | $36,079 | $118,393 | ||||
Net asset value per share | $19.66 | $6.90 | ||||
________________________
(1) Future distributions are not guaranteed.
(2) Weighted average effective yield of the total debt investments is calculated as the effective yield of each investment and weighted by its amortized cost as compared to the aggregate amortized cost of all debt investments. Effective yield is the return earned on an investment net of any discount, premium, or issuance costs. Effective yield on total debt investments is calculated before considering the impact of leverage or any operating expenses.
(3) The total investment portfolio yield is calculated before considering the impact of leverage or any operating expenses, and includes all income generating investments, non-income generating investments and investments on non-accrual status.
(4) Total investment return is a measure of the change in total value for shareholders who held the Feeder Funds' common shares at the beginning and end of the period, including distributions declared during the period. Total investment return is based on (i) net asset value per share on the first day of the period, (ii) the net asset value per share on the last day of the period, plus any shares issued in connection with the reinvestment of monthly distributions, and (iii) distributions payable relating to the ownership of shares, if any, on the last day of the period. The total investment return calculation assumes that distributions are reinvested in accordance with the Feeder Funds' distribution reinvestment plan. Since there is no public market for the Feeder Funds' shares, terminal market value per share is assumed to be equal to net asset value per share on the last day of the period presented. Investment performance is presented without regard to sales load that may be incurred by shareholders in the purchase of the Feeder Funds' common shares. Total investment return is not annualized. The Feeder Funds' performance changes over time and currently may be different than that shown above. Past performance is no guarantee of future results.
1
Business Environment
The first quarter of 2020 brought one of the most volatile quarters for the loan market in history. After a strong January, in which new issue and repricing volumes surged, the loan market began to show cracks in February due to the global spread of the COVID-19 pandemic. In March, the combination of the pandemic breaking out on US soil and the dramatic fall in oil prices drove loan prices down to levels not seen since the global financial crisis. The Credit Suisse Leverage Loan Index ("Index") was well on its way to having its worst month in history, falling by over 19% through March 23rd, only to rebound and return nearly 9% through the rest of the month. This ultimately resulted in the second worst month in loan market history, with the Index returning -13.05%.
As COVID-19 started to become more of a global issue, and the equity markets started to experience volatility, the market began to slow, with total volume falling by about 70% from January to February. In March, the new issue market had its first month of zero new issue volume since December 2008. The outlook for the leveraged loan market, as well as the broader economy, has shifted dramatically since the end of 2019. At the end of 2019, it was looking as if the Fed’s rate cuts would be enough to stave off a recession in the near term. That view has now reversed and it is broadly agreed that we are firmly in a recession - with an ultimate tenor that remains unknown.
We cannot predict the full impact of the pandemic, including its duration in the United States and worldwide, and the magnitude of the economic impact of the outbreak. As such, we are unable to predict the duration of any business disruptions, the extent to which COVID-19 will negatively affect our portfolio companies’ operating results or the impact that such disruptions may have on our results of operations and financial condition. We are taking steps in actively overseeing all our individual portfolio companies. These measures include, among other things, enhanced monitoring/credit analysis of our portfolio, assessing each portfolio company’s operational and liquidity exposure and outlook, and frequent communication with our portfolio company management teams, industry consultants, and other lenders to understand the expected financial performance impact of the pandemic.
While we remain constructive on credit and will be opportunistic during times of dislocations in the syndicated and direct markets, we are monitoring the effects of the COVID-19 pandemic closely and are adjusting our underwriting criteria to focus on companies whose revenue streams are resilient in the face of rapidly shifting consumer and business demand trends.
2
Investment Activity, Investment Performance, and Portfolio Update
During the three months ended March 31, 2020, 100% of the Company's investments were sourced through direct origination channels, and none were sourced through the syndicated channels. While we remain constructive on credit and will be opportunistic during times of technical dislocations in the syndicated markets, we believe that direct origination will be the primary source of opportunity in the near term.
The following table presents our assets as of March 31, 2020 and our investment activity during the three months ended March 31, 2020 (dollars in thousands):
As of | |||
March 31, 2020 | |||
Total assets | $ | 340,493 | |
Yield on total debt investments | 8.5 | % | |
Yield on total investments | 8.4 | % | |
Leverage ratio (borrowings/adjusted total assets)(5) | 47 | % | |
Three Months Ended | |||
March 31, 2020 | |||
Investment activity segmented by access channel: | |||
Direct origination | $ | 21,269 | |
Total investment commitments entered during the period | 21,269 | ||
Investments sold or repaid | (51,697 | ) | |
Net investment activity | $ | (30,428 | ) |
Portfolio companies at beginning of period | 86 | ||
Number of added portfolio companies | 5 | ||
Number of exited portfolio companies | (5 | ) | |
Portfolio companies at period end | 86 | ||
(5) We expect that the market and business disruption created by the COVID-19 pandemic will impact certain aspects of our liquidity, and we are therefore continuously monitoring our operating results, liquidity and anticipated capital requirements. As of March 31, 2020, we were in compliance with our asset coverage requirements under the 1940 Act, as well as, all financial covenants within its credit facilities as of March 31, 2020. Any breach of these requirements may adversely affect our access to sufficient debt and equity capital.
3
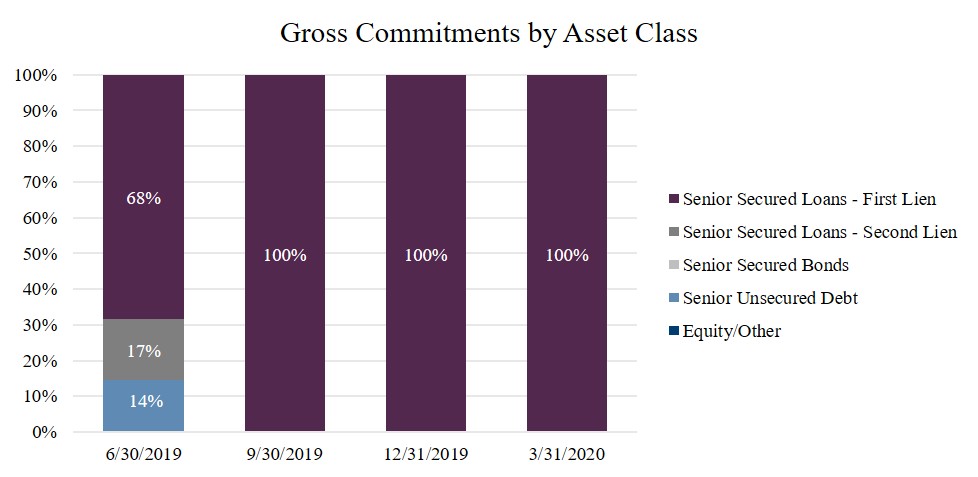
During the three months ended March 31, 2020, 100% of commitments were in senior secured first lien debt investments. The following chart presents the investment commitments by asset class during each of the last four quarters:
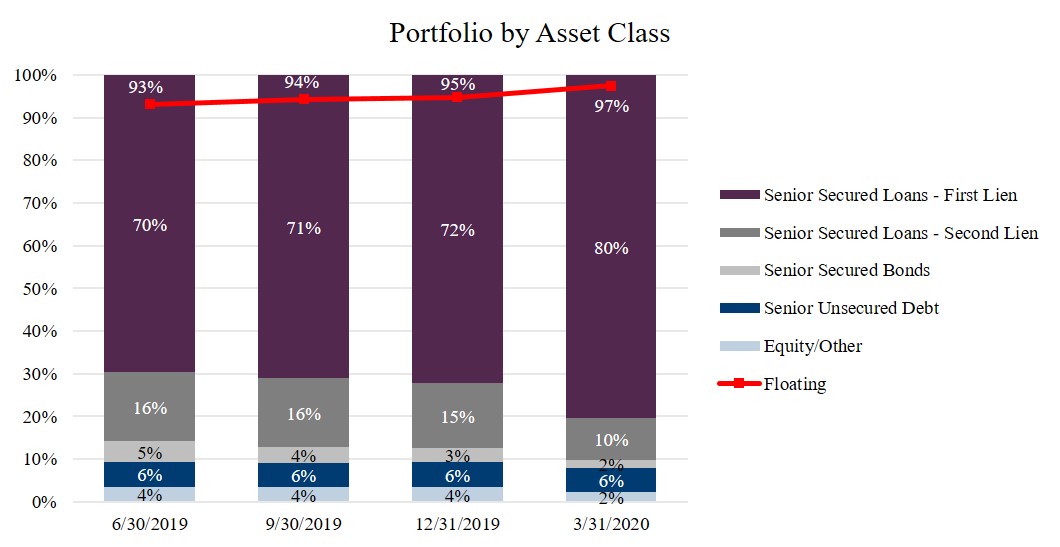
As of March 31, 2020, the investment portfolio consisted of $319 million at fair value and remained predominately invested in senior debt which represented 98% of the total portfolio at fair value. We believe senior debt investments provide for downside risk mitigation which is particularly important given today's credit environment.
The following chart presents the investment portfolio based on fair value by asset class at the end of each of the last four quarters:
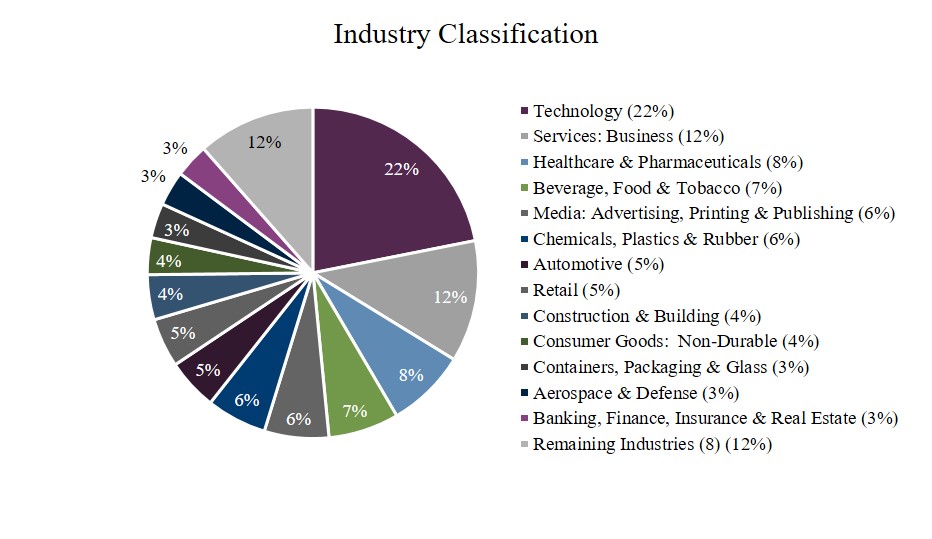
As of March 31, 2020, there were 86 portfolio companies in which GCIF held 143 investments. The weighted average portfolio company age, based on fair value, was 56 years as of March 31, 2020. Furthermore, and aligned with our strategy of seeking to mitigate industry-specific risk, the companies held in GCIF's portfolio were diversified across 21 industries.
4
The following chart presents the investment portfolio based on fair value by industry classification (based on Moody's standard industry classifications) as of March 31, 2020:
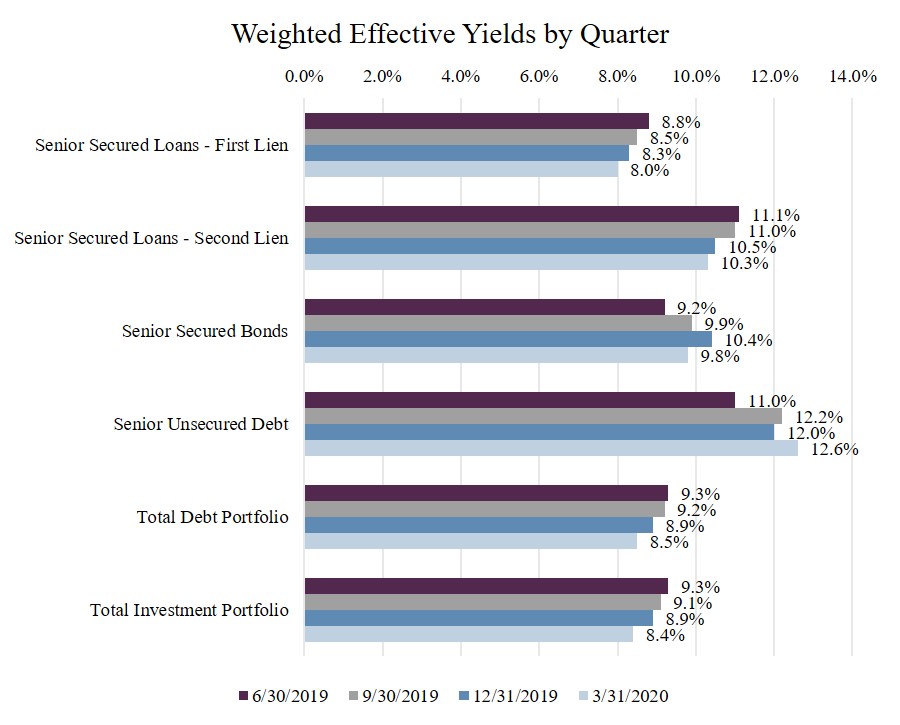
The yield on total debt investments was 8.5% as of March 31, 2020, compared to 8.9% as of December 31, 2019.
The following chart presents the weighted average effective yields by investment type at the end of each of the last four quarters:
5
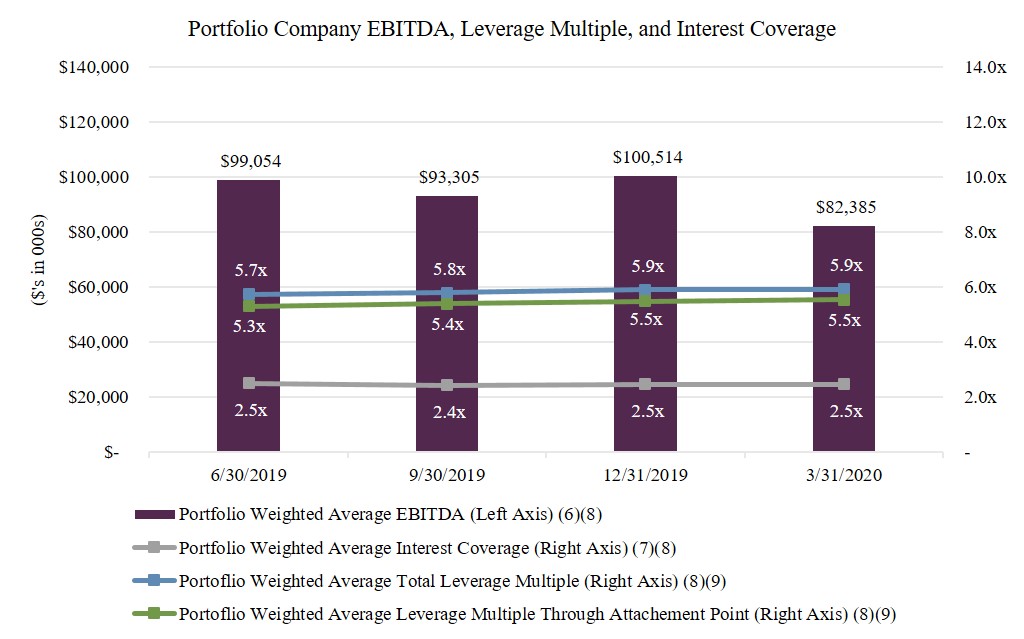
The following chart presents the weighted average EBITDA, weighted average total leverage multiple, and weighted average interest rate coverage of GCIF's portfolio companies for each of the last four quarters:
________________________
(6) | Based on trailing twelve months EBITDA as most recently reported by portfolio companies. Weighted average portfolio company EBITDA is calculated using weights based on fair value. The inputs and computations of EBITDA are not consistent across all portfolio companies. EBITDA is a non-GAAP financial measure. For a particular portfolio company, EBITDA is generally defined as net income before net interest expense, income tax expense, depreciation and amortization. EBITDA amounts are estimated from the most recent portfolio company's financial statements, have not been independently verified by GCIF or its Advisor, may reflect a normalized or adjusted amounts, typically exclude expenses deemed unusual or non-recurring, and typically include add backs for items deemed appropriate to present normalized earnings. Accordingly, neither GCIF nor its Advisor makes any representation or warranty in respect of this information. |
(7) | Weighted average interest coverage represents the portfolio company’s EBITDA as a multiple of interest expense. Portfolio company credit statistics are derived from the most recently available portfolio company financial statements, have not been independently verified by GCIF or its Advisors, and may reflect a normalized or adjusted amount. Accordingly, neither GCIF nor its Advisors makes any representation or warranty in respect of this information. |
(8) | Portfolio weighted average EBITDA, weighted average total leverage multiple, weighted average leverage multiple through tranche, and weighted average interest coverage ratio data includes information solely in respect of portfolio companies in which GCIF has a debt investment. |
(9) | Weighted average total leverage multiple represents the portfolio company’s total debt as a multiple of EBITDA. Weighted average leverage multiple through attachment point represents the portfolio company's debt through GCIF's position in the capital structure as a multiple of EBITDA. Portfolio company credit statistics are derived from the most recently available portfolio company financial statements, have not been independently verified by GCIF or its Advisors, and may reflect a normalized or adjusted amount. Accordingly, neither GCIF nor its Advisors makes any representation or warranty in respect of this information. |
6
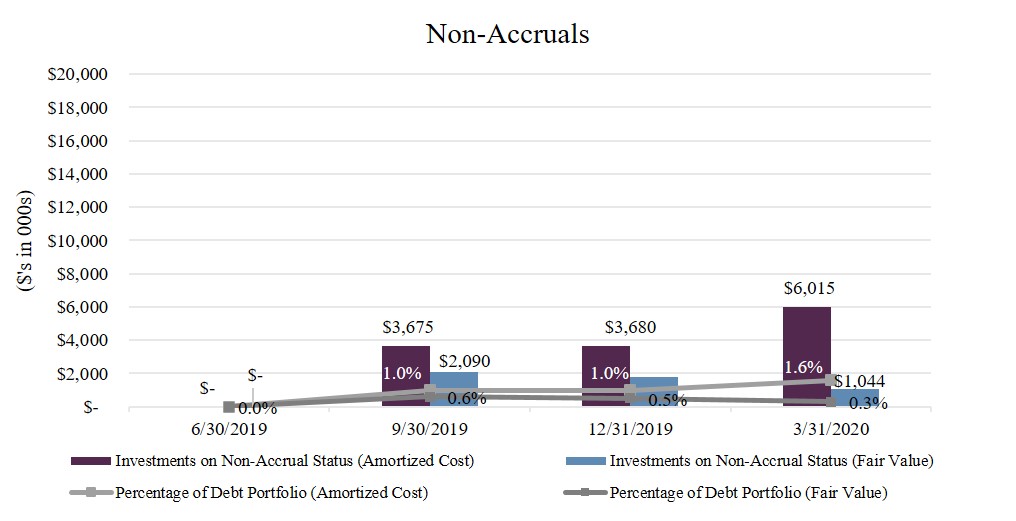
As of March 31, 2020, there were two debt investments on non-accrual status.
The following chart presents debt investments on non-accrual status based on amortized cost and fair value at the end of each of the last four quarters:
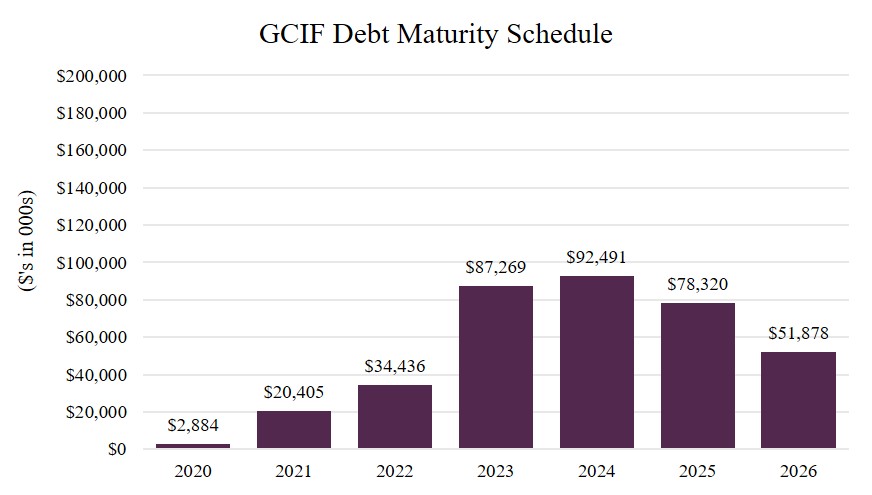
The following chart presents the maturity schedule of GCIF's debt investments, excluding unfunded commitments, based on their principal amount as of March 31, 2020.
7
GCIF's publicly offered feeder funds, GCIF 2019 and GCIF 2016 T, which have committed to seek liquidity events on or before December 31, 2021 and December 31, 2026, respectively, collectively represented 86% of GCIF's total ownership as of March 31, 2020. The following chart shows the liquidity schedule (10) of GCIF's publicly offered feeder funds as of March 31, 2020 based on the net assets of GCIF.
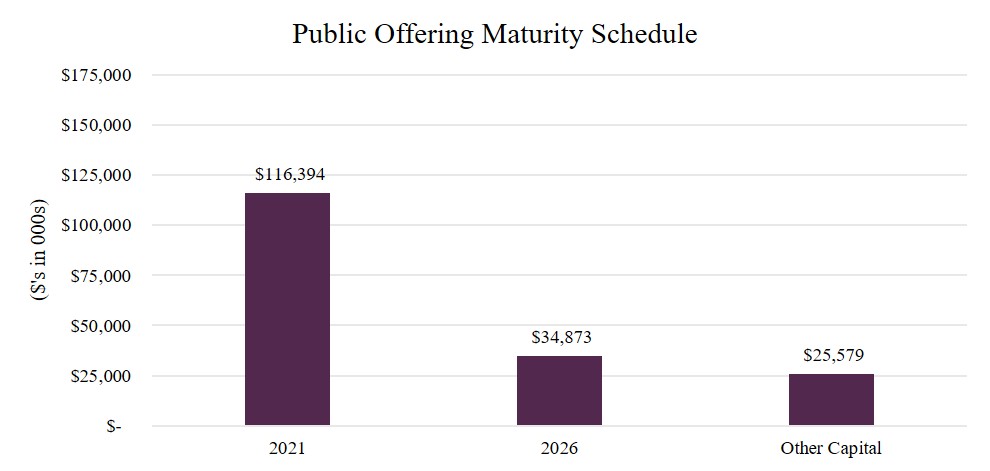
(10) | A liquidity event is not guaranteed. |
About Guggenheim Credit Income Fund
GCIF is a non-traded BDC that seeks to invest primarily in large, privately-negotiated loans to private middle market U.S. companies, with a focus on senior secured debt investments. GCIF is advised by Guggenheim Partners Investment Management, LLC ("Guggenheim Investments"), an affiliate of Guggenheim Partners, LLC ("Guggenheim Partners"). For more information, please visit https://www.guggenheimCIF.com
GCIF 2016 T is closed to new investors.
About Guggenheim Partners, LLC
Guggenheim Investments represents the investment management businesses of Guggenheim Partners and includes Guggenheim, an SEC-registered investment adviser. Guggenheim Partners is a privately-held, global financial services firm with over 2,400 employees and more than $270 billion in assets under management* as of March 31, 2020. It produces customized solutions for its clients, which include institutions, governments and agencies, corporations, insurance companies, investment advisors, family offices, and individual investors.
Guggenheim Investments manages more than $205 billion in assets** across fixed income, equity, and alternatives as of March 31, 2020. Its 300+ investment professionals perform research to understand market trends and identify undervalued opportunities in areas that are often complex and underfollowed. This approach to investment management has enabled Guggenheim to deliver long-term results to its clients.
Within Guggenheim Investments is the Guggenheim Corporate Credit Team, which is responsible for all corporate credit strategies and asset management of $69 billion. A unified credit platform is utilized for all strategies and is organized by industry as opposed to asset class, which increases its ability to uncover relative value opportunities and to identify and source opportunities. The scale of the platform, combined with the expertise across a wide range of industries and in-house legal resources, allows Guggenheim to be a solution provider to the market and maintain an active pipeline of investment opportunities.
*Assets under management are as of March 31, 2020 and include consulting services for clients whose assets are valued at approximately $69bn.
**Assets under management as of March 31, 2020 and include leverage of $12.9bn. Guggenheim Investments represents the following affiliated investment management businesses of Guggenheim Partners, LLC: Guggenheim Partners Investment Management, LLC, Security Investors, LLC, Guggenheim Funds Distributors, LLC, Guggenheim Funds Investment Advisors, LLC, Guggenheim Corporate Funding, LLC, Guggenheim Partners Europe Limited, GS GAMMA Advisors, LLC, and Guggenheim Partners India Management.
Cautionary Statement Concerning Forward-Looking Statements
This document contains forward-looking statements within the meaning of the Federal securities laws. These statements are not guarantees of future performance and are subject to risks, uncertainties and other factors, some of which are beyond our control, are difficult to predict and could cause actual results to differ materially from those expressed or forecasted in the forward-looking statements. GCIF, GCIF 2019, and GCIF 2016 T undertake no obligation to update any forward-looking statements contained herein to conform the statements to actual results or changes in their expectations. A number of factors may cause GCIF’s, GCIF 2019's and GCIF 2016 T's actual results, performance or achievement to differ materially from those anticipated. For further information on factors that could impact GCIF, GCIF 2019, and GCIF 2016 T performance, please review GCIF’s, GCIF 2019's, and GCIF 2016 T's respective filings at the SEC website at www.sec.gov.
8