Attached files
| file | filename |
|---|---|
| 8-K - FORM 8-K - CRAWFORD & CO | tm2020093d3_8k.htm |
Exhibit 99.1

Investor Presentation May 2020

2 Forward - Looking Statements and Additional Information Forward - Looking Statements This presentation contains forward - looking statements, including statements about the expected future financial condition, resul ts of operations and earnings outlook of Crawford & Company. Statements, both qualitative and quantitative, that are not statements of historical fact may be "forward - looking statements" as defined in the Private Securitie s Litigation Reform Act of 1995 and other securities laws. Forward - looking statements involve a number of risks and uncertainties that could cause actual results to differ materially from historical experience or Crawford & Company 's present expectations. Accordingly, no one should place undue reliance on forward - looking statements, which speak only as of the date on which they are made. Crawford & Company does not undertake to update forward - looking statements to reflect the impact of circumstances or events that may arise or not arise after the date the forward - looking statements are made. Results for any interim period presented herein are not necessarily indicative of results to be exp ected for the full year or for any other future period. For further information regarding Crawford & Company, and the risks and uncertainties involved in forward - looking statements, please read Crawford & Company's reports filed with the Securities and Exchange Commission and available at www.sec.gov or in the Investor Relations section of Crawford & Company's website at www.crawco.com. Crawford's business is dependent, to a significant extent, on case volumes. The Company cannot predict the future trend of ca se volumes for a number of reasons, including the fact that the frequency and severity of weather - related claims and the occurrence of natural and man - made disasters, which are a significant source of cases and revenue for the Company , are generally not subject to accurate forecasting, as well as the economic impact that COVID - 19 may have on global case volumes and the duration of any such impact. Revenues Before Reimbursements ("Revenues") Revenues Before Reimbursements are referred to as "Revenues" in both consolidated and segment charts, bullets and tables thro ugh out this presentation. Segment and Consolidated Operating Earnings Under the Financial Accounting Standards Board's Accounting Standards Codification ("ASC") Topic 280, "Segment Reporting," th e C ompany has defined segment operating earnings as the primary measure used by the Company to evaluate the results of each of its three operating segments. Segment operating earnings represent segment earnings, includin g t he direct and indirect costs of certain administrative functions required to operate our business, but excludes unallocated corporate and shared costs and credits, net corporate interest expense, stock option expense, amortizati on of customer - relationship intangible assets, goodwill impairment, restructuring costs, income taxes and net income or loss attributable to noncontrolling interests and redeemable noncontrolling interests. Earnings Per Share The Company's two classes of stock are substantially identical, except with respect to voting rights and the Company's abilit y t o pay greater cash dividends on the non - voting Class A Common Stock than on the voting Class B Common Stock, subject to certain limitations. In addition, with respect to mergers or similar transactions, holders of Class A Commo n S tock must receive the same type and amount of consideration as holders of Class B Common Stock, unless different consideration is approved by the holders of 75% of the Class A Common Stock, voting as a class. In certain periods, the Company has paid a higher dividend on CRD - A than on CRD - B. This may result in a different earnings per s hare ("EPS") for each class of stock due to the two - class method of computing EPS as required by ASC Topic 260 - "Earnings Per Share". The two - class method is an earnings allocation method under which EPS is calculated for each class o f common stock considering both dividends declared and participation rights in undistributed earnings as if all such earnings had been distributed during the period. Segment Gross Profit Segment gross profit is defined as revenues, less direct costs, which exclude indirect centralized administrative support cos ts allocated to the business. Indirect expenses consist of centralized administrative support costs, regional and local shared services that are allocated to each segment based on usage. Non - GAAP Financial Information For additional information about certain non - GAAP financial information presented herein, see the Appendix following this presen tation.
Crawford & Company Loss resolution for carriers, brokers and corporates Our Mission Restoring and enhancing lives, businesses and communities. Our Vision To be the leading provider and most trusted source for expert assistance , serving those who insure and self - insure the risks of businesses and communities anywhere in the world. 3
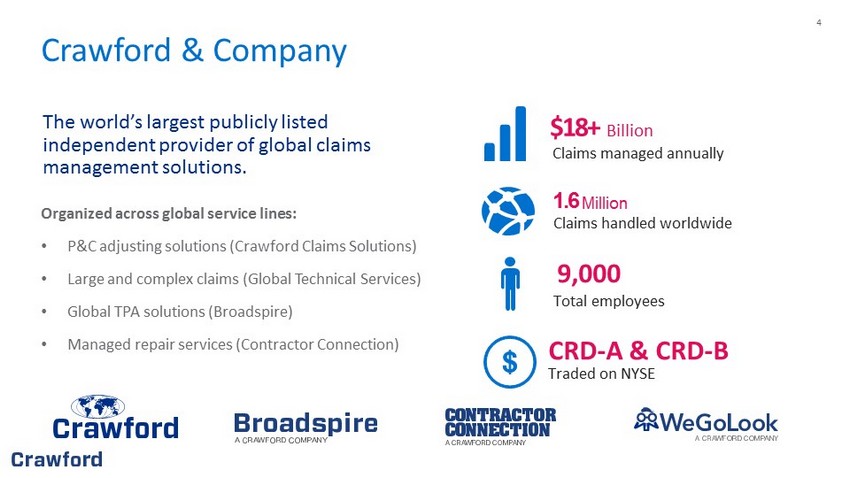
4 Crawford & Company The world’s largest publicly listed independent provider of global claims management solutions. Organized across global service lines: • P&C adjusting solutions (Crawford Claims Solutions) • Large and complex claims (Global Technical Services) • Global TPA solutions (Broadspire) • Managed repair services (Contractor Connection) 1.6 Million Claims handled worldwide $18+ Billion Claims managed annually CRD - A & CRD - B Traded on NYSE 9,000 Total employees

5 Scope and Scale of Operations Comprehensive experience across the spectrum of the claims world¹ Crawford Claims Solutions Global Technical Services Contractor Connection Broadspire P&C Adjusting Solutions Large or Complex Claims Managed Repair Services Global TPA 460,000+ P&C claims managed 400+ Global technical adjusters 6,000 Contractors in network $1.0 billion Managed medical spend $6.0 billion Indemnity dollars 2,500 Claims managed 500,000 Assignments $3.1 million Claims paid 50,000 Field resources $5.8 billion Indemnity dollars $3.0 billion Total project costs 813,000 Claims managed (1) Figures are approximate

6 Crawford’s Response to COVID - 19 Workforce Client Solutions Market Leadership Over 93% Switched to working remote within 7 to 10 days Remote Claims Management Rolled out globally Global Scale With Crawford teams serving clients across more than 70 countries PPE & Expert Training Provided to adjusters in the field YouGoLook App launched in Australia, Canada and the U.K. Competitive Position Established through our best - in - class client solutions Pre - Visit Screening To ensure the safety of adjusters Cleaning & Decontamination Services offered by Contractor Connection Financial Strength Proves Crawford’s resiliency Remote Cyber Security Training and precautions in place TPA Crisis Support For impacts on businesses and claims Key Initiatives Continue to maintain and extend leadership Business Interruption Advise on coronavirus insurance impacts

7 Investment Thesis Global Product and Geographic Diversification Financial Strength and Flexibility Competitive Market Position Goal: Achieve Sustained Revenue and Earnings Growth Largest Publicly - Listed Claims Service Provider 80 - Year History of Industry Leadership Blue - Chip Global Client Base Experienced Management Team Building for Future Growth

8 Positioned for Future Growth Noble mission that inspires our management team, clients and employees Unique ownership structure, providing both flexibility and resilience Consolidating a fragmented market Leveraging competitive excellence to deliver clients best - in - class solutions Growing brand awareness, proven by the variety of companies within our pipeline Looking ahead and remaining nimble to capitalize on changing industry trends

9 Experienced Executive Management Team With an average of over 30 years of experience Rohit Verma Chief Executive Officer Bruce Swain Chief Financial Officer Joseph Blanco President Danielle Lisenbey Global President, TPA Solutions: Broadspire Larry Thomas Global President, Crawford Specialty Solutions Kieran Rigby Global President, Crawford Claims Solutions

We bring together thoughtful experts from around the world to offer comprehensive, intelligent solutions to our customers. Loss Adjusting Third Party Administration Managed Repair Medical Management On - Demand Services Catastrophe Response 10

11 Insurance Industry Claims Trends Well - positioned to benefit from rising industry trends Increasing global claim volume and severity Rising level of carrier outsourcing Customer demand for scale Infusion of alternative capital Climate change
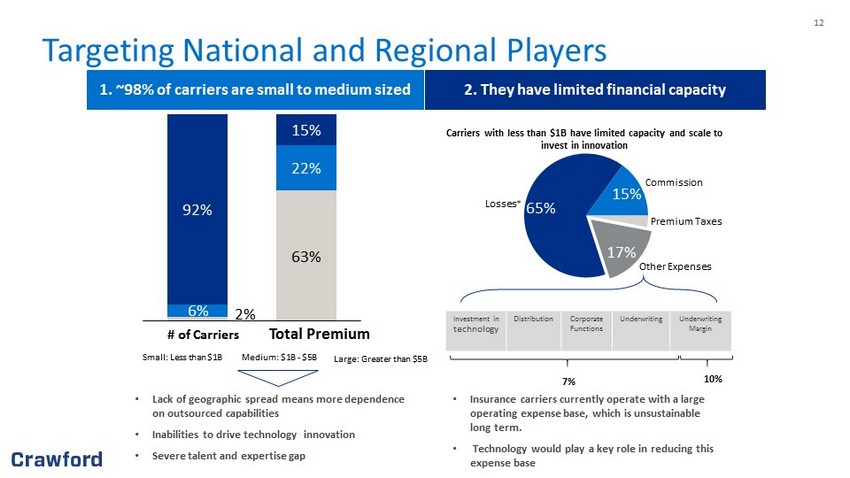
12 Targeting National and Regional Players 2 % 63 % 6% 22% 92% 15% # of Carriers Total Premium Medium: $1B - $5B Small: Less than $1B Large: Greater than $5B 1. ~98% of carriers are small to medium sized 2. They have limited financial capacity • Insurance carriers currently operate with a large operating expense base, which is unsustainable long term. • Technology would play a key role in reducing this expense base 65% 15% 17% Losses * Commission Premium Taxes Other Expenses Investment in technology Distribution Corporate Functions Underwriting Underwriting Margin Carriers with less than $1B have limited capacity and scale to invest in innovation 10% 7% • Lack of geographic spread means more dependence on outsourced capabilities • Inabilities to drive technology innovation • Severe talent and expertise gap
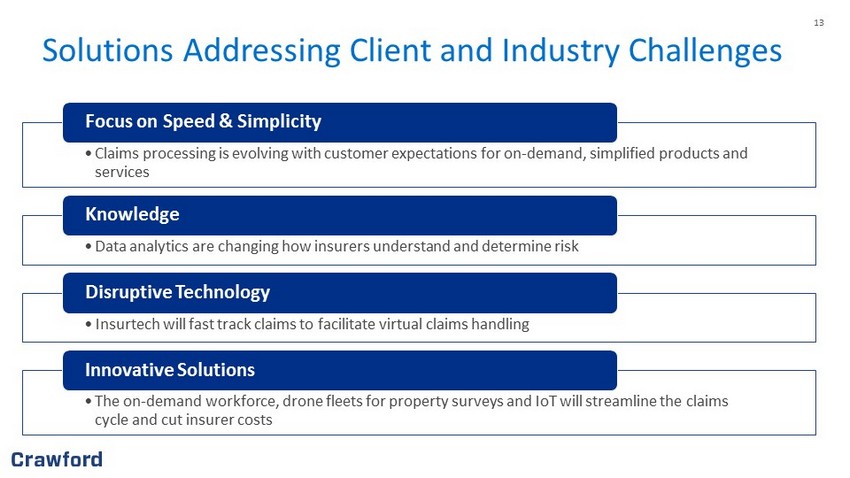
13 Solutions Addressing Client and Industry Challenges • Claims processing is evolving with customer expectations for on - demand, simplified products and services Focus on Speed & Simplicity • Data analytics are changing how insurers understand and determine risk Knowledge • Insurtech will fast track claims to facilitate virtual claims handling Disruptive Technology • The on - demand workforce, drone fleets for property surveys and IoT will streamline the claims cycle and cut insurer costs Innovative Solutions

14 Innovating to Accelerate Growth, Improve Client Experience and Reduce Costs Claims triage process leverages self - service app, WeGoLook Lookers and traditional field adjusters to reduce costs and improve cycle times Contractor Connection Industry Solutions Investing in Technology TruLook The industry’s largest contractor managed repair network of general and specialty contractors providing service in the U.S., U.K., Canada, Australia, and Germany Developing a range of specialized solutions designed to manage the risks of the targeted industry verticals, including construction, hospitality, retail, real estate and transportation Technology is driving the management of risk in new directions and Crawford has chosen to be a change leader which requires investing in technology focused on driving innovation
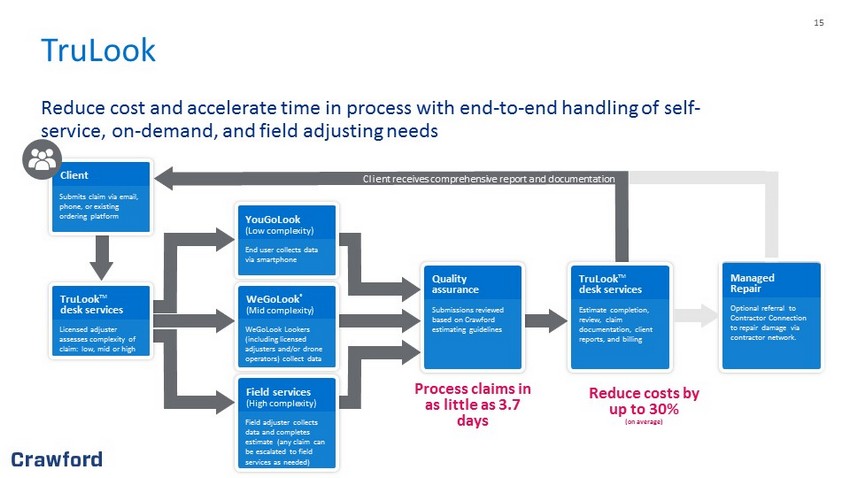
15 TruLook Reduce cost and accelerate time in process with end - to - end handling of self - service, on - demand, and field adjusting needs Client receives comprehensive report and documentation Client Submits claim via email, phone, or existing ordering platform TruLook TM desk services Licensed adjuster assesses complexity of claim: low, mid or high YouGoLook (Low complexity) End user collects data via smartphone WeGoLook ® (Mid complexity) WeGoLook Lookers (including licensed adjusters and/or drone operators) collect data Field services (High complexity) Field adjuster collects data and completes estimate (any claim can be escalated to field services as needed) Quality assurance Submissions reviewed based on Crawford estimating guidelines TruLook TM desk services Estimate completion, review, claim documentation, client reports, and billing Process claims in as little as 3.7 days Reduce costs by up to 30% (on average) Managed Repair Optional referral to Contractor Connection to repair damage via contractor network.

16 Contractor Connection “Quality Focused – Performance Driven” Faster Service Through rigorous performance management & consistent application of expectations, we improve cycle times & increase customer satisfaction. Accurate Estimates Leveraging technology, people, processes, and industry best practices, we deliver accurate estimates tailored to individual client estimating guidelines. Improved Efficiency By assessing damage & estimating repair in a single step, our trusted process supports our clients’ claim segmentation strategies & leads to better management of loss adjustment expenses. Unmatched Quality Our contractors deliver world - class quality & stand behind their work with a five - year workmanship warranty on all completed repairs. 6,000 General & Specialty Contractors 500,000 + Annual Assignments $3 Billion + Annual Project Cost 5 Countries Current Worldwide Operations

17 Tailored Industry Verticals and Solutions Focused on developing a complete range of specialized outsourced solutions focusing on industry verticals for managing risks specific to the targeted industry’s needs Industry Verticals Integrated Solutions Construction Hospitality Transportation Energy Hail (2020) Water Damage Total Property TruLook™ Recall 360

18 Leading Change with Investments in Market - Leading Technology • Drone Capabilities: WeGoLook has a network of over 2,000 licensed drone operators • YouGoLook Self - Service Application : Supports FNOL and claims documentation processes by policyholders for direct upload to claims systems • Escape of Water: Solution featuring leak detection sensors • Virtual Reality (VR): Supports our clients’ pre - and post - loss needs for accurate, detailed image capture • RENOVO : Crawford’s U.S. catastrophe adjuster portal • Robotic Process Automation (RPA): Driving efficiency and quality in the claims process • Variance Analytics: Developed tools to understand risk variance within metrics • Job Track tool: Interactive web accessed tool for the property repair process • Claims Fabric: Global claims platform supporting data and technology integrations within Crawford and with clients and suppliers • Global Digital FNOL (DFNOL) : Omni - channel platform to enhance and accelerate claims intake and information exchange via digital channels (e.g., web, chat bot, mobile, API, IoT, RPA, etc.) • Live Video Streaming : Enables Virtual Adjuster model by allowing adjusters to engage directly with policyholders in real time for collection of video, photographs, documents and official statements

19 Disciplined Capital Allocation Strong financial position to remain resilient, with liquidity in excess of $180 million¹ Streamlined various functions of our workforce resulting in $15 million of annualized savings Reprioritized capital expenditures, reducing spending by 25% Increased client and market leadership investments, while reducing non - strategic costs Paused share repurchase plans for the foreseeable future to preserve capital and cash (1) As of March 31, 2020
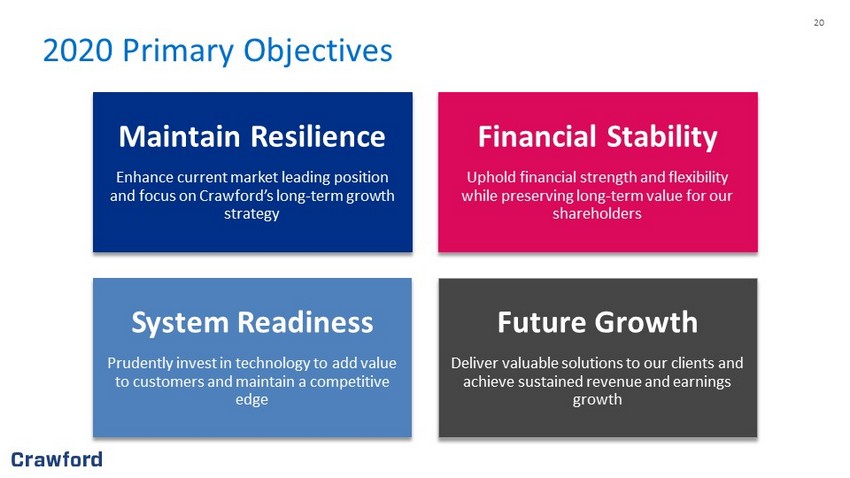
20 2020 Primary Objectives Maintain Resilience Enhance current market leading position and focus on Crawford’s long - term growth strategy Financial Stability Uphold financial strength and flexibility while preserving long - term value for our shareholders System Readiness Prudently invest in technology to add value to customers and maintain a competitive edge Future Growth Deliver valuable solutions to our clients and achieve sustained revenue and earnings growth

9,000 50,000+ 70 $18B+ employees Field Resources countries claims managed annually Crawford & Company The world’s largest publicly listed independent provider of global claims management and outsourcing solutions. 21

22 Appendix A: Global Service Lines 22

23 Crawford Claims Solutions Value Proposition • Most extensive network of field services in the world • Widest range of innovative, end - to - end outsourced claims management solutions • Scalable and mobile workforce can respond to catastrophes anywhere in the world • Globally deployed field assets supported by technical and specialist expertise • Leveraging crowd sourcing and mobile apps, data analytics, robotics and AI applications with key partners Enhancing the policy holder experience through scalable field adjusting solutions and optimizing claim expense for clients Vehicle & Heavy Equipment Inspections Surveying for Underwriting Centralized Intake/FNOL* Global Administration FNOL* to Final Payment Summary Value Delivery System • Current engagements in over 70 countries • Nearly 9,000 claims professionals + network of 46,000 Lookers Cutting - edge Capabilities • Multiple outsourced solutions for field and inspection services • Reduced claims handling costs and expedited service through WeGoLook • Catastrophe response, including disruptive technologies • Building consultancy and legal services Temporary Staffing On - Demand Services Drones Catastrophe Response Comprehensive Suite of Services Loss Adjusting Value Delivery System
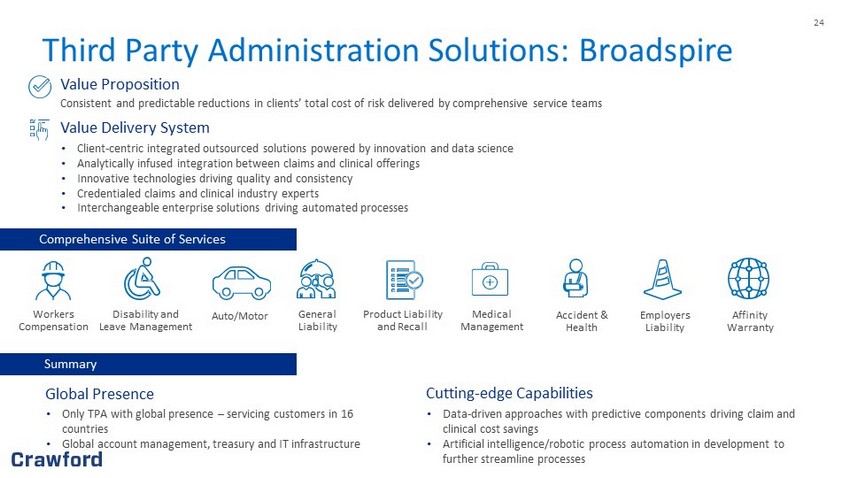
24 Third Party Administration Solutions: Broadspire Affinity Warranty Summary Employers Liability Global Presence • Only TPA with global presence – servicing customers in 16 countries • Global account management, treasury and IT infrastructure Cutting - edge Capabilities • Data - driven approaches with predictive components driving claim and clinical cost savings • Artificial intelligence/robotic process automation in development to further streamline processes Accident & Health Product Liability and Recall Medical Management Value Proposition Consistent and predictable reductions in clients’ total cost of risk delivered by comprehensive service teams Value Delivery System • Client - centric integrated outsourced solutions powered by innovation and data science • Analytically infused integration between claims and clinical offerings • Innovative technologies driving quality and consistency • Credentialed claims and clinical industry experts • Interchangeable enterprise solutions driving automated processes Comprehensive Suite of Services Workers Compensation Disability and Leave Management Auto/Motor General Liability
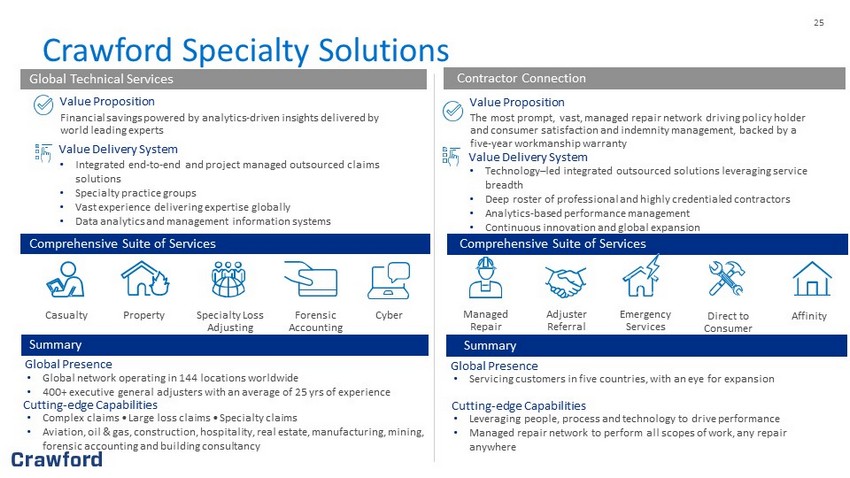
25 Crawford Specialty Solutions • Technology – led integrated outsourced solutions leveraging service breadth • Deep roster of professional and highly credentialed contractors • Analytics - based performance management • Continuous innovation and global expansion Value Proposition Financial savings powered by analytics - driven insights delivered by world leading experts Value Delivery System • Integrated end - to - end and project managed outsourced claims solutions • Specialty practice groups • Vast experience delivering expertise globally • Data analytics and management information systems Value Proposition The most prompt, vast, managed repair network driving policy holder and consumer satisfaction and indemnity management, backed by a five - year workmanship warranty Value Delivery System Global Technical Services Contractor Connection Casualty Property Specialty Loss Adjusting Forensic Accounting Cyber Managed Repair Adjuster Referral Emergency Services Direct to Consumer Affinity Comprehensive Suite of Services Comprehensive Suite of Services Summary Global Presence • Global network operating in 144 locations worldwide • 400+ executive general adjusters with an average of 25 yrs of experience Cutting - edge Capabilities • Complex claims • Large loss claims • Specialty claims • Aviation, oil & gas, construction, hospitality, real estate, manufacturing, mining, forensic accounting and building consultancy Summary Global Presence • Servicing customers in five countries, with an eye for expansion Cutting - edge Capabilities • Leveraging people, process and technology to drive performance • Managed repair network to perform all scopes of work, any repair anywhere

26 Outsourced Claims Advantage Case Study: A Vineyard impacted by the California wildfires Background o The 2017 California wildfires approached an unprecedented $12 billion of insured losses o A historic number of fires burned over 500,000 acres causing damage to almost 30 wineries in Napa, Sonoma and Mendocino The Value of Utilizing Crawford’s Methodology o In this case, a California vineyard initially claimed 60 acres as a total loss o While vineyards may appear damaged beyond salvageability, it takes time to determine whether grapes can grow from scorched vines o An expert from Crawford’s global network, a sought - after vineyard and soil science consultant, assisted with vine assessment and the determination of the vineyard’s damages o Through Crawford’s assistance, it was established that 69% of the vineyard was salvageable, with normal production and growth expected Savings for the Insurer o The average cost for this region to replant a vineyard acre is between $50,000 and $60,000 o With the initial assessment, the potential payout stood to be as high as $1.3 million o Crawford’s expert testing methodology unveiled a loss of only 31% of the initial claim — a payout of approximately $300,000, representing an approximate $1 million in savings

27 TPA Outsourcing Terminix: A case study in the value of transitioning to an outsourced TPA model Terminix • Terminix is one of the largest pest control companies in the world, operating in 47 states and 22 countries • With an internal third - party liability model, they faced two challenges: o The significant time commitment required for local branch managers to inspect alleged termite damage o Managing third - party contractors who perform necessary repairs The Value of Making the Transition to an Outsourced TPA Model • Integrating our field, TPA and property repair network capabilities, we delivered a TPA model for Terminix which achieved remarkable success, demonstrated by: o Reduced time needed for claim resolution o A decreased cost per claim and litigation rate

28 99 Cents Only Stores Background • 99 Cents Only Stores is a deep - discount retailer with more than 350 stores in four states • As a retailer with over 17,000 employees, 99 Cents Only Stores struggled to manage the large number of employee injuries caused by overexertion, repetitive strain, slips and falls, and cuts or breaks Utilizing Real World Experience Backed by Data and Analytics • Crawford’s Broadspire brand partnered with broker Beecher Carlson, implementing a series of programs that helped: o Mitigate the frequency and severity of claims o Reduce claim duration o Lower costs • 99 Cents Only Stores not only leveraged Broadspire’s retail claims expertise, but their capabilities in medical management, enabling them to treat many of the injuries before they became open claims Improved Efficiency and Cost Reduction • Broadspire partnered with broker Beecher Carlson to revamp and enhance the retailer’s safety and workers compensation programs resulting in: o Total cost reduction of over $18 million o A reduction of 52% in lost time days and 44% drop in total incurred since 2016 o 46% drop in the number of open claims o 42% drop in outstanding reserves
29 Belmond (UK) Limited Leveraging Crawford’s integrated solutions Background • Belmond La Samanna and Belmond Cap Juluca were left devastated by the powerful hurricanes of 2017 • Strong winds and sea surges caused significant property damage and interrupted business • As major employers in the local community, the resorts needed to be restored as soon as possible Identifying and Implementing a Solution • With a deep expertise in helping the hospitality industry and handling large - scale complex claims following weather - related catastrophes, Crawford Global Technical Services™ introduced the specialist skills of Crawford Forensic Accounting Services and WeGoLook® • During a time when communication was difficult, the drone capabilities of WeGoLook® captured footage of the resort properties the day after they were struck by the hurricanes • Crawford’s findings made Belmond immediately aware of the scale of the losses and the resources needed to restore the properties Return to Business • Crawford’s Global Technical Services adjuster managed all the parties involved to provide support and guidance throughout the claim • With Crawford’s support, Belmond received a swift settlement of insurance claims • Both luxury resorts were able to re - open in 2018

30 Appendix B: First Quarter 2020 Segment Results 30

31 Crawford TPA Solutions Segment Highlights • U.S. client renewal rate at 98% and several new client wins in the quarter • Economic weakness caused claims volume headwinds, with slight increase in claims from the healthcare sector Highlights • Revenues of $96.9 million versus $97.8 million • Constant dollar revenues of $97.3 million • Gross profit of $23.2 million versus $25.5 million • Gross profit margin of 24.0% versus 26.0% • Operating earnings of $6.3 million versus $6.7 million • Operating margin of 6.5% versus 6.9% Operating Results (1Q 2020 v. 1Q 2019) Three months ended (in thousands, except percentages) March 31, 2020 March 31, 201 9 Variance 20 20 Based on 201 9 rates Variance Revenues $9 6,935 $ 97 , 794 ( 0 . 9 %) $97, 278 ( 0 . 5 %) Direct expenses 73, 694 72, 331 1. 9 % 73, 944 2. 2 % Gross profit 23, 241 2 5 , 463 ( 8 . 7 %) 2 3 , 334 ( 8.4 %) Indirect expenses 1 6 , 956 1 8 , 730 (9.5%) 16,990 (9.3 % ) Operating earnings $6, 285 $ 6 , 733 ( 6.7 %) $6, 344 (5. 8 %) Gross profit margin 24. 0% 2 6.0% ( 2.0 %) 24. 0% ( 2.0 %) Operating margin 6. 5% 6.9% ( 0.4 %) 6. 5% ( 0 .4%) Total cases received 20 4 , 600 20 1 , 694 1 . 4 % Full time equivalent employees 3,2 30 3,1 58 2 . 3 %

32 Crawford Claims Solutions Segment Highlights • Secured new Dallas site with over 600 staff members to support our newest large carrier • Accelerated deployment of YouGoLook, video collaboration, and other new adjusting capabilities • Benign weather in North America with no named storms and warm temperatures Highlights • Revenues of $77.6 million versus $83.3 million • Constant dollars revenues of $78.2 million • Gross profit of $13.8 million versus $17.1 million • Gross profit margin of 17.8% versus 20.5% • Operating loss of ($3.7) million versus ($0.3) million • Operating margin of (4.7%) versus (0.4%) Operating Results (1Q 2020 v. 1Q 2019) Three months ended (in thousands, except percentages) March 31, 2020 March 31, 201 9 Variance 20 20 Based on 201 9 rates Variance Revenues $ 77,587 $ 83 , 319 ( 6.9 %) $ 78,211 ( 6.1 %) Direct expenses 63, 800 66 , 242 ( 3.7 %) 6 4,218 ( 3.1 %) Gross profit 13 , 787 17 , 077 ( 19.3 %) 13,993 (18.1%) Indirect expenses 1 7 , 466 17,390 0 .4% 17,560 1.0% Operating loss ( $3, 679) ( $ 313) nm ( $3, 567) nm Gross profit margin 17.8% 2 0.5% (2.7 % ) 17.9% (2.6%) Operating margin (4.7%) (0 . 4%) ( 4 . 3 %) ( 4. 6%) ( 4.2 %) Total cases received 1 11 , 407 119,182 ( 6.5 %) Full time equivalent employees 2, 748 2 , 908 (5. 5 %)

33 Crawford Specialty Solutions Segment Highlights • GTS added several new programs across the globe, and we expanded our presence in Japan, the world’s third largest insurance market • Beginning to see COVID - 19 - related BI claims activity • Lower assignments in North America for Contractor Connection driven by benign weather Highlights • Revenues of $63.0 million versus $65.9 million • Constant dollar revenues of $63.3 million • Gross profit of $19.0 million versus $22.4 million • Gross profit margin of 30.2% versus 34.0% • Operating earnings of $7.0 million versus $12.2 million • Operating margin of 11.0% versus 18.5% Operating Results (1Q 2020 v. 1Q 2019) Three months ended (in thousands, except percentages) March 31, 2020 March 31, 201 9 Variance 20 20 Based on 201 9 rates Variance Revenues $6 3 , 009 $6 5 , 945 ( 4.5 %) $6 3 , 310 ( 4 .0%) Direct expenses 4 4 , 007 43, 504 1.2% 44, 249 1.7 % Gross profit 19 , 002 2 2 , 441 (1 5 . 3 %) 19 , 061 ( 15 . 1 %) Indirect expenses 1 2 , 045 10, 246 17.6 % 12, 086 1 8 . 0 % Operating earnings $ 6 , 957 $ 12,195 ( 43.0 %) $ 6 , 975 ( 42 . 8 %) Gross profit margin 3 0.2% 34.0% ( 3 . 8 %) 3 0.1% ( 3.9 %) Operating margin 1 1 .0 % 18.5% ( 7 . 5 %) 11.0% ( 7.5 %) Total cases received 69, 521 86,387 (1 9 . 5 %) Full time equivalent employees 1,458 1,4 96 ( 2 . 5 %)

34 Appendix C: First Quarter 2020 Consolidated Financial Results 34

35 First Quarter 2020 Financial Summary (1) See appendix for non - GAAP explanation and reconciliation of non - GAAP measures. Quarter Ended March 31, March 31, ($ in millions, except per share amounts) 20 20 201 9 % Change Revenues $ 237.5 $ 247.1 ( 4)% Non - GAAP Revenues excluding foreign exchange fluctuations (1) $2 38.8 $2 47.1 ( 3)% Net (Loss) Income Attributable to Shareholders of Crawford & Company ($ 11.4 ) $ 6.1 ( 287)% Diluted (Loss) Earnings per Share CRD - A ($0. 21 ) $0. 1 2 ( 275)% CRD - B ($0. 23 ) $0. 1 0 ( 330)% Non - GAAP Diluted Earnings per Share 1 CRD - A $0. 03 $0. 1 2 ( 75)% CRD - B $0. 01 $0. 1 0 ( 90)% Adjusted Operating Earnings 1 $ 7.0 $ 14.7 ( 52)% Adjusted Operating Margin 1 2.9 % 5.9 % ( 300 ) b ps Adjusted EBITDA 1 $ 16.7 $ 21.1 ( 21)% Adjusted EBITDA Margin 1 7 .0% 8.5 % ( 150)b ps

36 (1) See Appendix for non - GAAP explanation and reconciliation Balance Sheet Highlights Unaudited ($ in thousands) March 31, 20 20 December 31, 201 9 Change Cash and cash equivalents $ 83,110 $ 51,802 $ 31,308 Accounts receivable, net 121,230 128,217 ( 6,987 ) Unbilled revenues, net 108,898 103,894 5,004 Total receivables 230,128 232,111 ( 1,983 ) Goodwill 62,883 80,642 ( 17,759 ) Intangible assets arising from business acquisitions, net 72,625 75,083 ( 2,458 ) Deferred revenues 55,307 5 2,368 2,939 Pension liabilities 60,548 65,909 ( 5,361 ) Short - term borrowings and current portion of finance leases 39,822 28,546 11,276 Long - term debt, less current portion 187,271 148,408 38,863 Total debt 227,093 1 76,954 50,139 Total stockholders' equity attributable to Crawford & Company 141,029 1 59,317 ( 18,288 ) Net debt 1 143,983 1 25,152 18,831

37 (1) See Appendix for non - GAAP explanation and reconciliation Operating and Free Cash Flow Unaudited ($ in thousands) 20 20 201 9 Change Net Income Attributable to Shareholders of Crawford & Company $ (11,399) $ 6,109 $ ( 17,508 ) Goodwill Impairment 17,674 — 17,674 Depreciation and Other Non - Cash Operating Items 9,180 9,037 143 Billed Receivables Change 6,084 1,571 4,513 Unbilled Receivables Change (7,240 ) ( 8,361 ) 1,121 Change in Accrued Compensation and 401K (10,928 ) ( 8,960 ) (1,968 ) Change in Accrued and Prepaid Income Taxes ( 10,355 ) 1,922 (12,277 ) Other Working Capital Changes 2,162 ( 602 ) 2,764 U.S. and U.K. Pension Contributions ( 3,156 ) ( 193 ) (2,963 ) Cash Flows from Operating Activities (7,978 ) 523 (8,501 ) Property & Equipment Purchases, net ( 2,708 ) ( 1,737 ) (971 ) Capitalized Software (internal and external costs) ( 4,803 ) ( 1,605 ) (3,198 ) Free Cash Flow 1 $ (15,489 ) $ (2,819 ) $ (12,670 ) For the year to date periods ended March 31 ,

38 Appendix D: Non - GAAP Financial Information 38
39 Appendix: Non - GAAP Financial Information Measurements of financial performance not calculated in accordance with GAAP should be considered as supplements to, and not sub stitutes for, performance measurements calculated or derived in accordance with GAAP. Any such measures are not necessarily comparable to o the r similarly - titled measurements employed by other companies. Reimbursements for Out - of - Pocket Expenses In the normal course of our business, our operating segments incur certain out - of - pocket expenses that are thereafter reimbursed by our clients. Under GAAP, these out - of - pocket expenses and associated reimbursements are required to be included when reporting expenses and revenues, respectiv ely, in our consolidated results of operations. In this presentation, we do not believe it is informative to include in reported revenues the amounts of reimb urs ed expenses and related revenues, as they offset each other in our consolidated results of operations with no impact to our net income or operating earnings. As a re sult, unless noted in this presentation, revenue and expense amounts exclude reimbursements for out - of - pocket expenses. Net Debt Net debt is computed as the sum of long - term debt, capital leases and short - term borrowings less cash and cash equivalents. Man agement believes that net debt is useful because it provides investors with an estimate of what the Company's debt would be if all available cash was used to p ay down the debt of the Company. The measure is not meant to imply that management plans to use all available cash to pay down debt . Free Cash Flow Management believes free cash flow is useful to investors as it presents the amount of cash the Company has generated that ca n b e used for other purposes, including additional contributions to the Company's defined benefit pension plans, discretionary prepayments of outstanding b orr owings under our credit agreement, and return of capital to shareholders, among other purposes. It does not represent the residual cash flow of the C omp any available for discretionary expenditures. Segment and Consolidated Operating Earnings Operating earnings is the primary financial performance measure used by our senior management and chief operating decision ma ker to evaluate the financial performance of our Company and operating segments, and make resource allocation and certain compensation decisions. Managemen t b elieves operating earnings is useful to others in that it allows them to evaluate segment and consolidated operating performance using the same criteria ou r management and chief operating decision maker use. Consolidated operating earnings represent segment earnings including certain unallocated corporate and sh are d costs and credits, but before net corporate interest expense, stock option expense, amortization of customer - relationship intangible assets, goodwill impairme nt, restructuring costs, income taxes and net income or loss attributable to noncontrolling interests.
40 Appendix: Non - GAAP Financial Information (cont.) Segment and Consolidated Gross Profit Gross profit is defined as revenues less direct expenses which exclude indirect overhead expenses allocated to the business. Ind irect expenses consist of centralized administrative support costs, regional and local shared services that are allocated to each segment based on usag e. Adjusted EBITDA Adjusted EBITDA is used by management to evaluate, assess and benchmark our operational results and the Company believes that ad justed EBITDA is relevant and useful information widely used by analysts, investors and other interested parties. Adjusted EBITDA is defined as net income attributable to shareholders of the Company with recurring adjustments for depreciation and amortization, net corporate interest expense, inc ome taxes and stock - based compensation expense and foreign exchange fluctuations. Additionally, adjustments for non - recurring expenses for goodwill impairment and restructuring costs have been included in the calculation of adjusted EBITDA. Adjusted EBITDA is not a term defined by GAAP a nd as a result our measure of adjusted EBITDA might not be comparable to similarly titled measures used by other companies. Adjusted Revenue, Operating Earnings, Pretax Earnings, Net Income, Diluted Earnings per Share and EBITDA Included in non - GAAP adjusted measurements as an add back or subtraction to GAAP measurements, are impacts of the goodwill impai rment, restructuring costs, and foreign exchange impacts, which arise from non - core items not directly related to our normal business o r operations, or our future performance. Management believes it is useful to exclude these charges when comparing net income and diluted earnings per share across periods, as these charges are not from ordinary operations.

41 Total Revenues Before Reimbursements by Major Currency The following table illustrates revenue as a percentage of total revenue in the major currencies of the geographic areas in which Crawford does business: T hre e Months Ended (in thousands) March 31, 20 20 March 3 1, 201 9 Geographic Area Currency USD equivalent % of total USD equivalent % of total U.S. USD $ 134,448 56.6 % $ 139,598 5 6 .5 % U.K. GBP 32,382 1 3 .6 % 31,581 12. 8 % Canada CAD 25,220 1 0.6 % 29,884 12.1 % Australia AUD 15,545 6.5 % 16,255 6.6 % Europe EUR 13,389 5. 6 % 12,865 5.2 % Rest of World Various 16,547 7. 0 % 16,875 6.8 % Total Revenues, before reimbursements $ 237,531 100 % $ 247,058 100 %

42 Reconciliation of Non - GAAP Items Revenues, Costs of Services Provided, and Operating Earnings Quarter Ended Quarter Ended March 31, March 31, Unaudited ($ in thousands) 20 20 201 9 Revenues Before Reimbursements Total Revenues $ 2 46,046 $ 2 56 , 377 Reimbursements ( 8,515 ) ( 9,319 ) Revenues Before Reimbursements $ 2 3 7, 531 $ 2 47 , 058 Costs of Services Provided, Before Reimbursements Total Costs of Services $ 18 6 , 119 $ 1 87 , 207 Reimbursements ( 8,515 ) ( 9,319 ) Costs of Services Provided, Before Reimbursements $ 177, 604 $ 1 77 , 888 Quarter Ended Quarter Ended March 31, March 31, Unaudited ($ in thousands) 20 20 2 019 Operating Earnings: Crawford Claims Solutions $ (3,679 ) $ (313 ) Crawford TPA Solutions 6, 285 6,733 Crawford Specialty Solutions 6,957 12,195 Unallocated corporate and shared costs and credits, net ( 2,550 ) ( 3,914 ) Consolidated Operating Earnings 7,013 14,701 (Deduct) Add: Net corporate interest expense (2, 224 ) (2,7 16 ) Stock option expense ( 290 ) ( 485 ) Amortization expense (2, 756 ) (2, 798 ) Goodwill i mpairment (17, 674 ) — Restructuring costs ( 5,714 ) — Income ta x benefit (provision) 8,486 ( 2,933 ) Net loss attributable to noncontrolling interests and redeemable noncontrolling interests 1,760 340 Net (Loss) Income Attributable to Shareholders of Crawford & Company $ ( 11,399 ) $ 6,109

43 Reconciliation of Non - GAAP Items (cont.) Quarter Ended March 31, March 31, Unaudited ($ in thousands) 20 20 201 9 Net (loss) income attributable to shareholders of Crawford & Company $ ( 11,399 ) $ 6,109 Add: Depreciation and amortization 10, 060 9,624 Stock - based compensation 880 (247 ) Net corporate interest expense 2, 224 2,7 16 Goodwill impairment 17, 674 — Restructuring costs 5,714 — Income tax (benefit) provision (8,486 ) 2,933 Foreign exchange impacts 1 6 — Adjusted EBITDA $ 16,683 $ 21,135 Adjusted EBITDA
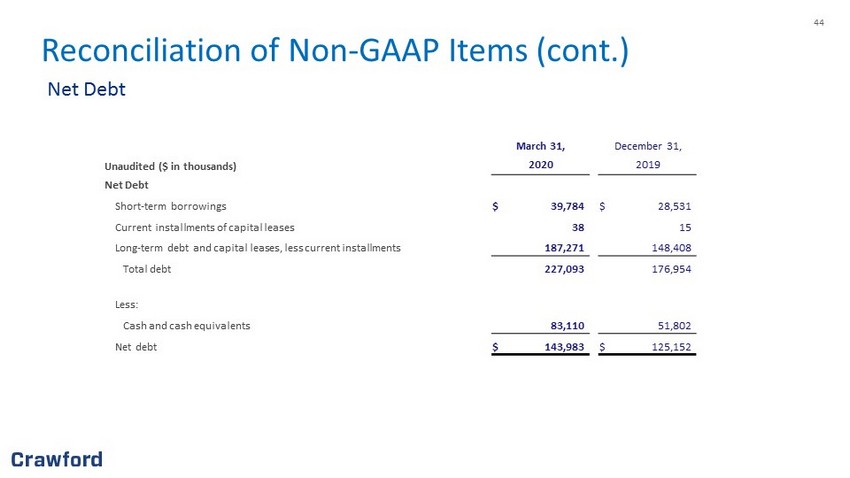
44 Reconciliation of Non - GAAP Items (cont.) March 31, December 31, Unaudited ($ in thousands) 20 20 201 9 Net Debt Short - term borrowings $ 39,784 $ 2 8,531 Current installments of capital leases 38 15 Long - term debt and capital leases, less current installments 187,271 1 48 , 408 Total debt 227,093 1 76 , 954 Less: Cash and cash equivalents 83,110 51,802 Net debt $ 143,983 $ 125,152 Net Debt

45 Reconciliation of Non - GAAP Items (cont.) Three months ended ( $ in thousands) March 31, 20 20 March 31, 201 9 Segment gross profit: Crawford TPA Solutions $ 23, 241 $ 2 5,463 Crawford Claims Solutions 13 , 787 17,077 Crawford Specialty Solutions 19 , 002 2 2,441 Segment gross profit 56 , 030 64,981 Segment indirect costs: Crawford TPA Solutions (1 6 , 95 6 ) (1 8 , 730 ) Crawford Claims Solutions (1 7 , 466 ) (1 7 , 390 ) Crawford Specialty Solutions (1 2 , 045 ) (10, 246 ) Unallocated corporate and shared costs, net ( 2 , 550 ) ( 3,914 ) Consolidated operating earnings 7 , 013 14,701 Net corporate interest expense (2, 224 ) (2,7 16 ) Stock option expense ( 290 ) ( 485 ) Amortization expense (2, 756 ) (2, 798 ) Goodwill impairmen t (17, 674 ) — Restructuring costs ( 5,714 ) — Income tax benefit (provision) 8,486 ( 2,933 ) Net loss attributable to noncontrolling interests and redeemable noncontrolling interests 1,760 340 Net (loss) income attributable to shareholders of Crawford & Company $ ( 11,399 ) $ 6,109 Segment Gross Profit

46 Reconciliation of First Quarter Non - GAAP Results Three Months Ended March 31, 20 20 Unaudited ($ in thousands) Revenues Non - GAAP Operating Earnings Pretax Loss Net (Loss) Income Attributable to Crawford & Company Diluted (Loss) Earnings per CRD - A Share Diluted (Loss) Earnings per CRD - B Share GAAP $ 237,531 $ 7,013 $ ( 21,645 ) $ ( 11,399 ) $ (0. 21 ) $ (0. 23 ) Adjustments: Goodwill impairment — — 17, 674 9,133 0. 18 0. 18 Restructuring costs — — 5,714 3,263 0.0 6 0.0 6 Foreign exchange fluctuations 1,268 9 16 (10 ) — — Non - GAAP Adjusted $ 2 38,799 $ 7 , 022 $ 1, 759 $ 987 $ 0. 03 $ 0. 01 Three Months Ended March 31, 201 9 Unaudited ($ in thousands) Revenues Non - GAAP Operating Earnings Pretax Earnings Net Income Attributable to Crawford & Company Diluted Earnings per CRD - A Share Diluted Earnings per CRD - B Share GAAP $ 2 47,058 $ 14,701 $ 8,702 $ 6,109 $ 0. 1 2 $ 0. 1 0 Adjustments: — — — — — — Non - GAAP Adjusted $ 2 47,058 $ 14,701 $ 8,702 $ 6,109 $ 0. 1 2 $ 0. 1 0