Attached files
| file | filename |
|---|---|
| 8-K - CURRENT REPORT - Western New England Bancorp, Inc. | wneb-8k_051920.htm |
Western New England Bancorp, Inc. 8-K
Exhibit 99.1
Local banking is better than ever. FIRST QUARTER 2020 INVESTOR PRESENTATION
FORWARD - LOOKING STATEMENTS 2 We may, from time to time, make written or oral “forward - looking statements” within the meaning of the Private Securities Litigation Reform Act of 1995 , including statements contained in our filings with the Securities and Exchange Commission (the “SEC”), our reports to shareholders and in other communications by us . This presentation contains “forward - looking statements” with respect to the Company’s financial condition, liquidity, results of operations, future performance, business, measures being taken in response to the coronavirus disease 2019 (“COVID - 19 ”) pandemic and the impact of COVID - 19 on the Company’s business . Forward - looking statements may be identified by the use of such words as “believe,” “expect,” “anticipate,” “should,” “planned,” “estimated,” and “potential . ” Examples of forward - looking statements include, but are not limited to, estimates with respect to our financial condition, results of operations and business that are subject to various factors which could cause actual results to differ materially from these estimates . These factors include, but are not limited to : • the duration and scope of the COVID - 19 pandemic and the local, national and global impact of COVID - 19; • actions governments, businesses and individuals take in response to the COVID - 19 pandemic; • the pace of recovery when the COVID - 19 pandemic subsides; • changes in the interest rate environment that reduce margins; • the effect on our operations of governmental legislation and regulation, including changes in accounting regulation or standa rds , the nature and timing of the adoption and effectiveness of new requirements under the Dodd - Frank Act Wall Street Reform and Consumer Protection Act of 2010 (“Dodd - Frank Act”), Basel guidelines, capital requirements and other applicable laws and regulations; • the highly competitive industry and market area in which we operate; • general economic conditions, either nationally or regionally, resulting in, among other things, a deterioration in credit qua lit y; • changes in business conditions and inflation; • changes in credit market conditions; • the inability to realize expected cost savings or achieve other anticipated benefits in connection with business combinations an d other acquisitions; • changes in the securities markets which affect investment management revenues; • increases in Federal Deposit Insurance Corporation deposit insurance premiums and assessments; • changes in technology used in the banking business; • the soundness of other financial services institutions which may adversely affect our credit risk; • certain of our intangible assets may become impaired in the future; • our controls and procedures may fail or be circumvented; • new lines of business or new products and services, which may subject us to additional risks; • changes in key management personnel which may adversely impact our operations; • severe weather, natural disasters, acts of war or terrorism and other external events which could significantly impact our bu sin ess; and • other factors detailed from time to time in our SEC filings. Although we believe that the expectations reflected in such forward - looking statements are reasonable, actual results may differ materially from the results discussed in these forward - looking statements . You are cautioned not to place undue reliance on these forward - looking statements, which speak only as of the date hereof . We do not undertake any obligation to republish revised forward - looking statements to reflect events or circumstances after the date hereof or to reflect the occurrence of unanticipated events, except to the extent required by law .
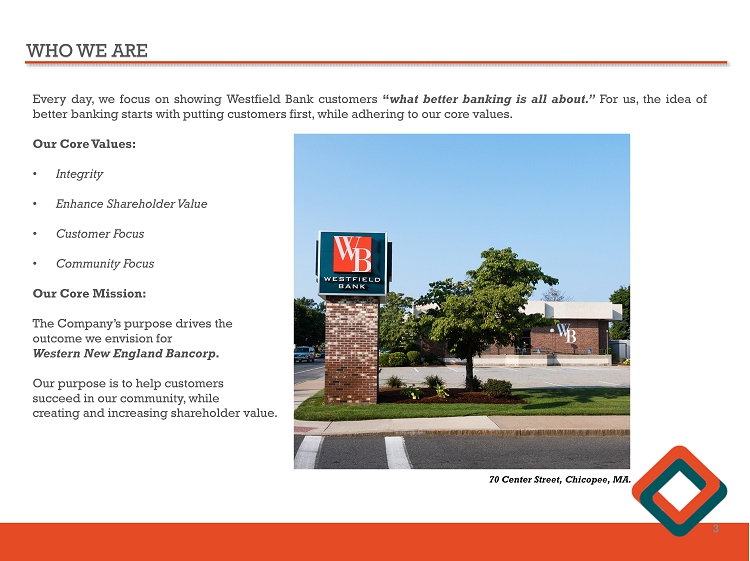
WHO WE ARE Every day, we focus on showing Westfield Bank customers “ what better banking is all about . ” For us, the idea of better banking starts with putting customers first, while adhering to our core values . Our Core Values : • Integrity • Enhance Shareholder Value • Customer Focus • Community Focus Our Core Mission : The Company’s purpose drives the outcome we envision for Western New England Bancorp . Our purpose is to help customers succeed in our community, while creating and increasing shareholder value . 3 70 Center Street, Chicopee, MA.

SENIOR MANAGEMENT TEAM James C . Hagan, President & Chief Executive Officer Guida R . Sajdak, Executive Vice President, Chief Financial Officer & Treasurer Allen J . Miles III, Executive Vice President & Chief Lender Officer Kevin C . O’Connor, Executive Vice President & Chief Banking Officer Leo R . Sagan, Jr . , Senior Vice President & Chief Risk Officer Darlene Libiszewski , Senior Vice President & Chief Information Officer Gerald P . Ciejka , Senior Vice President, General Counsel & Director of Human Resources Louis O . Gorman, Senior Vice President & Chief Credit Officer Deborah J . McCarthy, Senior Vice President, Deposit Operations & Electronic Banking Cidalia Inacio , Senior Vice President, Retail Banking & Wealth Management 4
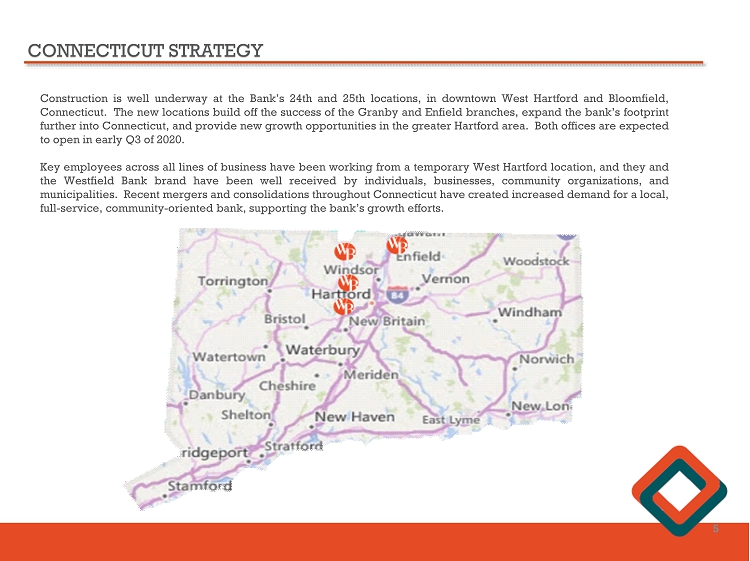
CONNECTICUT STRATEGY Construction is well underway at the Bank’s 24 th and 25 th locations, in downtown West Hartford and Bloomfield, Connecticut . The new locations build off the success of the Granby and Enfield branches, expand the bank’s footprint further into Connecticut, and provide new growth opportunities in the greater Hartford area . Both offices are expected to open in early Q 3 of 2020 . Key employees across all lines of business have been working from a temporary West Hartford location, and they and the Westfield Bank brand have been well received by individuals, businesses, community organizations, and municipalities . Recent mergers and consolidations throughout Connecticut have created increased demand for a local, full - service , community - oriented bank, supporting the bank’s growth efforts . 5
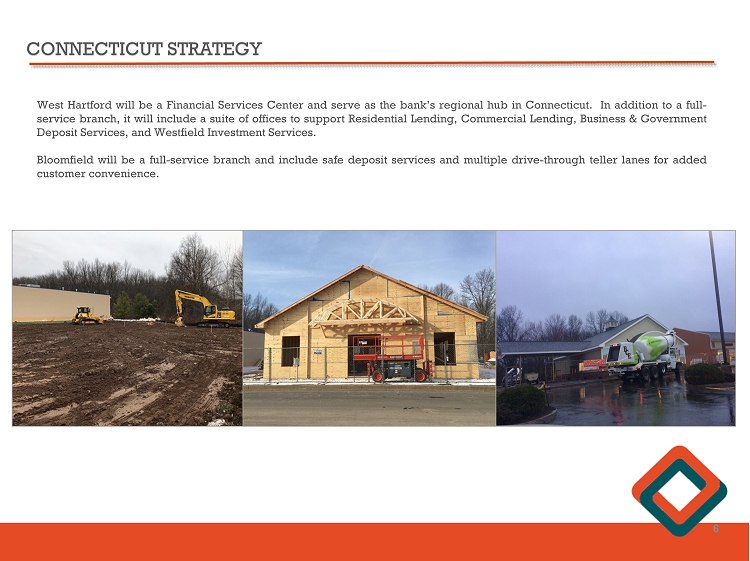
CONNECTICUT STRATEGY West Hartford will be a Financial Services Center and serve as the bank’s regional hub in Connecticut . In addition to a full - service branch, it will include a suite of offices to support Residential Lending, Commercial Lending, Business & Government Deposit Services, and Westfield Investment Services . Bloomfield will be a full - service branch and include safe deposit services and multiple drive - through teller lanes for added customer convenience . 6
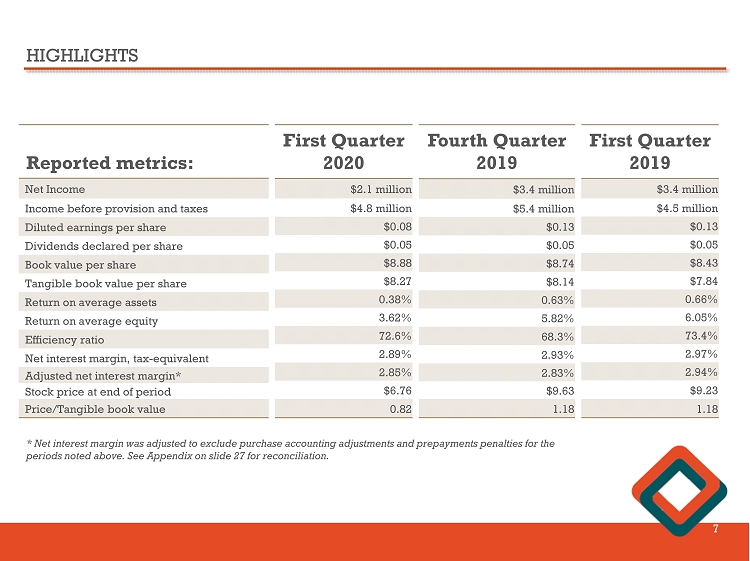
HIGHLIGHTS 7 Reported metrics: Net Income Income before provision and taxes Diluted earnings per share Dividends declared per share Book value per share Tangible book value per share Return on average assets Return on average equity Efficiency ratio Net interest margin, tax - equivalent Adjusted n et i nterest margin* Stock price at end of period Price/Tangible book value First Q uarter 2020 $2.1 million $4.8 million $0.08 $0.05 $8.88 $8.27 0.38% 3.62% 72.6% 2.89% 2.85% $6.76 0.82 Fourth Q uarter 2019 $3.4 million $5.4 million $0.13 $0.05 $8.74 $8.14 0.63% 5.82% 68.3% 2.93% 2.83% $9.63 1.18 First Q uarter 2019 $3.4 million $4.5 million $0.13 $0.05 $8.43 $7.84 0.66% 6.05% 73.4% 2.97% 2.94% $9.23 1.18 * Net interest margin was adjusted to exclude purchase accounting adjustments and prepayments penalties for the periods noted above. See Appendix on slide 27 for reconciliation.
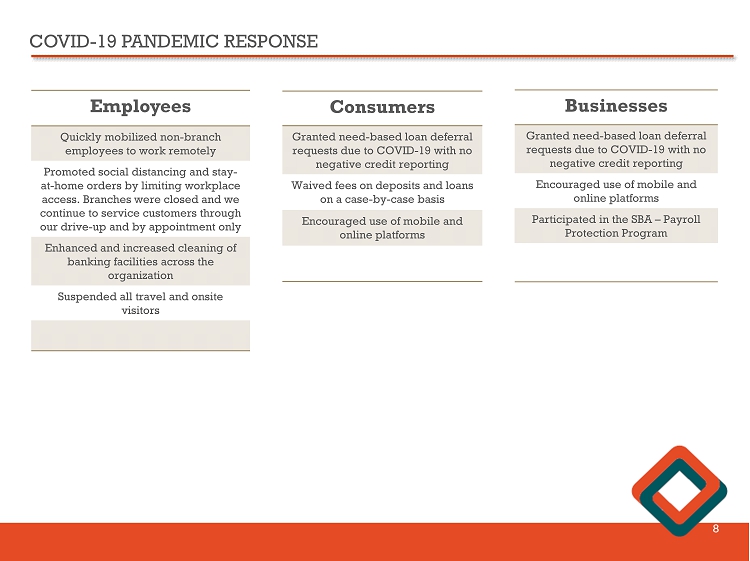
COVID - 19 PANDEMIC RESPONSE 8 Employees Quickly mobilized non - branch employees to work remotely Promoted social distancing and stay - at - home orders by limiting workplace access. Branches were closed and we continue to service customers through our drive - up and by appointment only Enhanced and i ncreased cleaning of banking facilities across the organization Suspended all travel and onsite visitors Consumers Granted need - based loan deferral requests due to COVID - 19 with no negative credit reporting Waived fees on deposits and loans on a case - by - case basis Encouraged use of mobile and online platforms Businesses Granted need - based loan deferral requests due to COVID - 19 with no negative credit reporting Encouraged use of mobile and online platforms Participated in the SBA – Payroll Protection Program
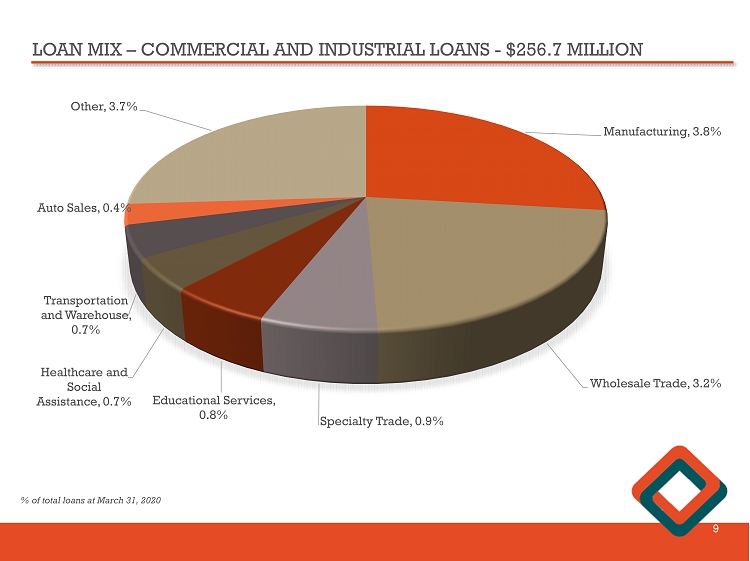
LOAN MIX – COMMERCIAL AND INDUSTRIAL LOANS - $256.7 MILLION 9 Manufacturing , 3.8% Wholesale Trade , 3.2% Specialty Trade , 0.9% Educational Services , 0.8% Healthcare and Social Assistance, 0.7% Transportation and Warehouse, 0.7% Auto Sales , 0.4% Other , 3.7% % of total loans at March 31, 2020
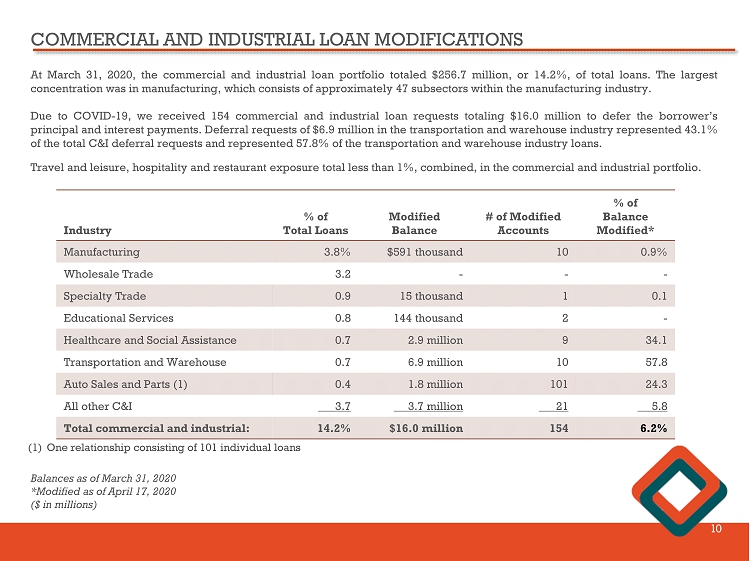
COMMERCIAL AND INDUSTRIAL LOAN MODIFICATIONS 10 Industry % of Total Loans Modified Balance # of Modified Accounts % of Balance Modified* Manufacturing 3.8% $591 thousand 10 0.9% Wholesale Trade 3.2 - - - Specialty Trade 0.9 15 thousand 1 0.1 Educational Services 0.8 144 thousand 2 - Health care and Social Assistance 0.7 2.9 million 9 34.1 Transportation and Warehouse 0.7 6.9 million 10 57.8 Auto Sales and Parts (1) 0.4 1.8 million 101 24.3 All other C&I 3.7 3.7 million 21 5.8 Total commercial and industrial: 14.2% $16.0 million 154 6.2% Balances as of March 31, 2020 *Modified as of April 17, 2020 ($ in millions) At March 31 , 2020 , the commercial and industrial loan portfolio totaled $ 256 . 7 million, or 14 . 2 % , of total loans . The largest concentration was in manufacturing, which consists of approximately 47 subsectors within the manufacturing industry . Due to COVID - 19 , we received 154 commercial and industrial loan requests totaling $ 16 . 0 million to defer the borrower’s principal and interest payments . Deferral requests of $ 6 . 9 million in the transportation and warehouse industry represented 43 . 1 % of the total C&I deferral requests and represented 57 . 8 % of the transportation and warehouse industry loans . (1) One relationship consisting of 101 individual loans Travel and leisure, hospitality and restaurant exposure total less than 1%, combined, in the commercial and industrial portfolio.
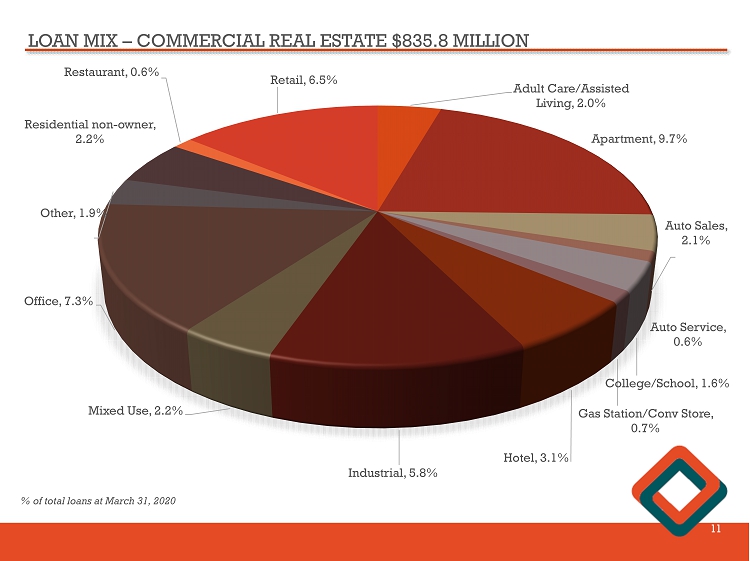
LOAN MIX – COMMERCIAL REAL ESTATE $835.8 MILLION 11 Adult Care/Assisted Living , 2.0% Apartment , 9.7% Auto Sales , 2.1% Auto Service , 0.6% College/School , 1.6% Gas Station/Conv Store , 0.7% Hotel , 3.1% Industrial , 5.8% Mixed Use , 2.2% Office , 7.3% Other , 1.9% Residential non - owner , 2.2% Restaurant , 0.6% Retail , 6.5% % of total loans at March 31, 2020
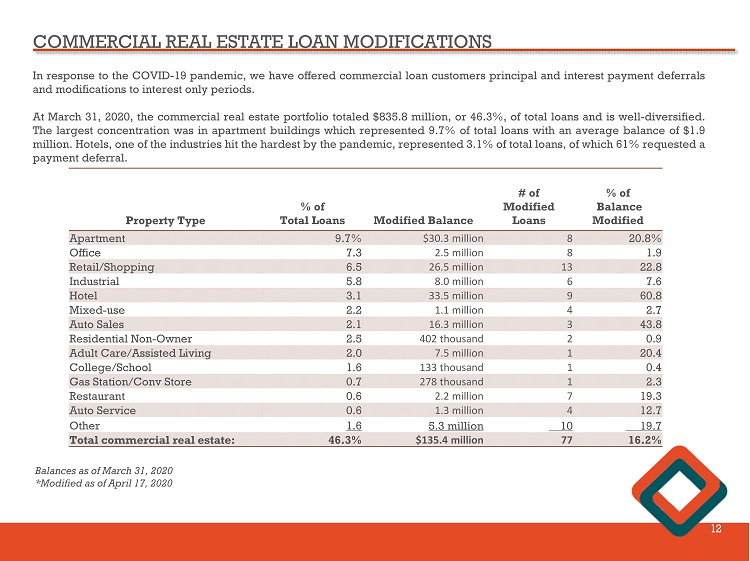
COMMERCIAL REAL ESTATE LOAN MODIFICATIONS 12 In response to the COVID - 19 pandemic, we have offered commercial loan customers principal and interest payment deferrals and modifications to interest only periods . At March 31 , 2020 , the commercial real estate portfolio totaled $ 835 . 8 million, or 46 . 3 % , of total loans and is well - diversified . The largest concentration was in apartment buildings which represented 9 . 7 % of total loans with an average balance of $ 1 . 9 million . Hotels, one of the industries hit the hardest by the pandemic, represented 3 . 1 % of total loans, of which 61 % requested a payment deferral . Property Type % of Total Loans Modified Balance # of Modified Loans % of Balance Modified Apartment 9.7% $30.3 million 8 20.8% Office 7.3 2.5 million 8 1.9 Retail/Shopping 6.5 26.5 million 13 22.8 Industrial 5.8 8.0 million 6 7.6 Hotel 3.1 33.5 million 9 60.8 Mixed - use 2.2 1.1 million 4 2.7 Auto Sales 2.1 16.3 million 3 43.8 Residential Non - Owner 2.5 402 thousand 2 0.9 Adult Care/Assisted Living 2.0 7.5 million 1 20.4 College/School 1.6 133 thousand 1 0.4 Gas Station/Conv Store 0.7 278 thousand 1 2.3 Restaurant 0.6 2.2 million 7 19.3 Auto Service 0.6 1.3 million 4 12.7 Other 1.6 5.3 million 10 19.7 Total commercial real estate: 46.3% $135.4 million 77 16.2% Balances as of March 31, 2020 *Modified as of April 17, 2020
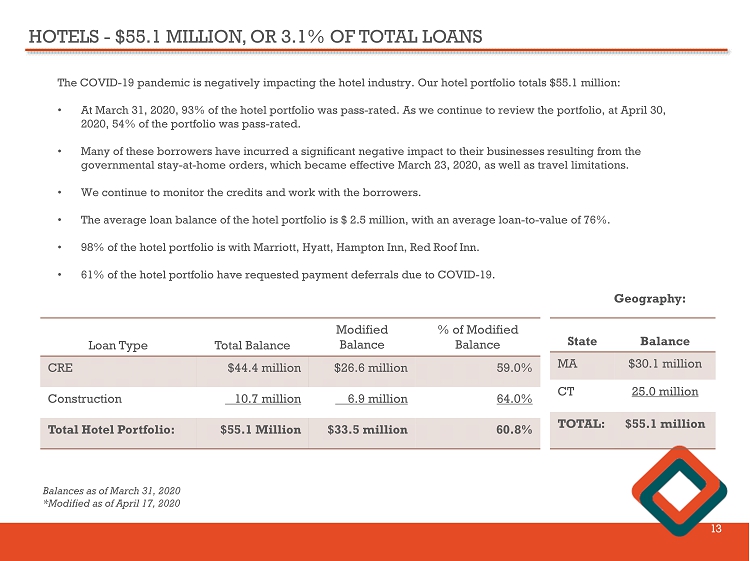
HOTELS - $55.1 MILLION, OR 3.1% OF TOTAL LOANS 13 The COVID - 19 pandemic is negatively impacting the hotel industry. Our hotel portfolio totals $55.1 million: • At March 31, 2020, 93% of the hotel portfolio was pass - rated. As we continue to review the portfolio, at April 30, 2020, 54% of the portfolio was pass - rated. • Many of these borrowers have incurred a significant negative impact to their businesses resulting from the governmental stay - at - home orders, which became effective March 23, 2020, as well as travel limitations. • We continue to monitor the credits and work with the borrowers. • The average loan balance of the hotel portfolio is $ 2.5 million, with an average loan - to - value of 76%. • 98% of the hotel portfolio is with Marriott, Hyatt, Hampton Inn, Red Roof Inn. • 61% of the hotel portfolio have requested payment deferrals due to COVID - 19. Loan Type Total Balance Modified Balance % of Modified Balance CRE $44.4 million $26.6 million 59.0% Construction 10.7 million 6.9 million 64.0% Total Hotel Portfolio: $55.1 Million $33.5 million 60.8% State Balance MA $30.1 million CT 25.0 million TOTAL: $55.1 million Geography: Balances as of March 31, 2020 *Modified as of April 17, 2020
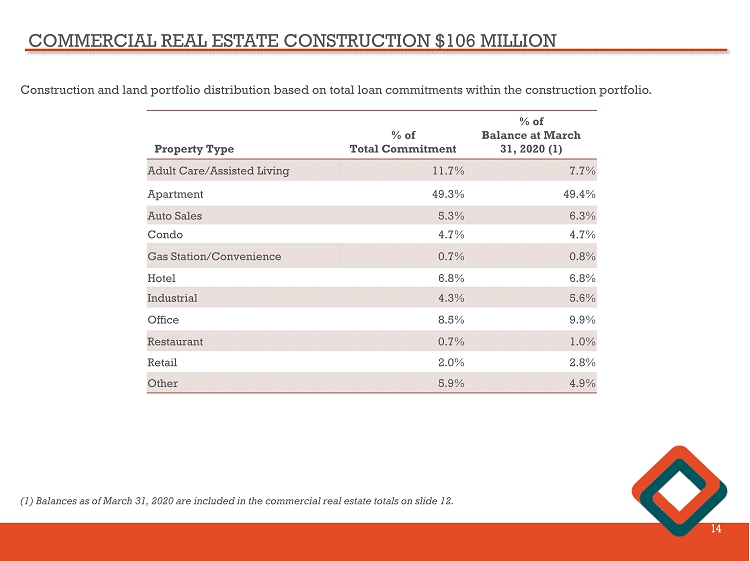
COMMERCIAL REAL ESTATE CONSTRUCTION $106 MILLION 14 (1) Balances as of March 31, 2020 are included in the commercial real estate totals on slide 12. Construction and land portfolio distribution based on total loan commitments within the construction portfolio. Property Type % of Total Commitment % of Balance at March 31, 2020 (1) Adult Care/Assisted Living 11.7% 7.7% Apartment 49.3% 49.4% Auto Sales 5.3% 6.3% Condo 4.7% 4.7% Gas Station/Convenience 0.7% 0.8% Hotel 6.8% 6.8% Industrial 4.3% 5.6% Office 8.5% 9.9% Restaurant 0.7% 1.0% Retail 2.0% 2.8% Other 5.9% 4.9%
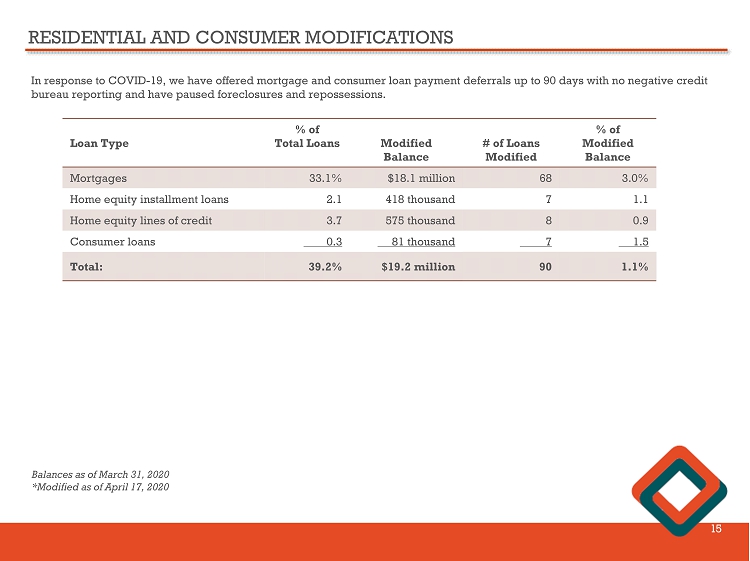
RESIDENTIAL AND CONSUMER MODIFICATIONS 15 In response to COVID - 19, we have offered mortgage and consumer loan payment deferrals up to 90 days with no negative credit bureau reporting and have paused foreclosures and repossessions. Loan Type % of Total Loans Modified Balance # of Loans Modified % of Modified Balance Mortgages 33.1% $18.1 million 68 3.0% Home equity installment loans 2.1 418 thousand 7 1.1 Home equity lines of credit 3.7 575 thousand 8 0.9 Consumer loans 0.3 81 thousand 7 1.5 Total: 39.2% $19.2 million 90 1.1% Balances as of March 31, 2020 *Modified as of April 17, 2020
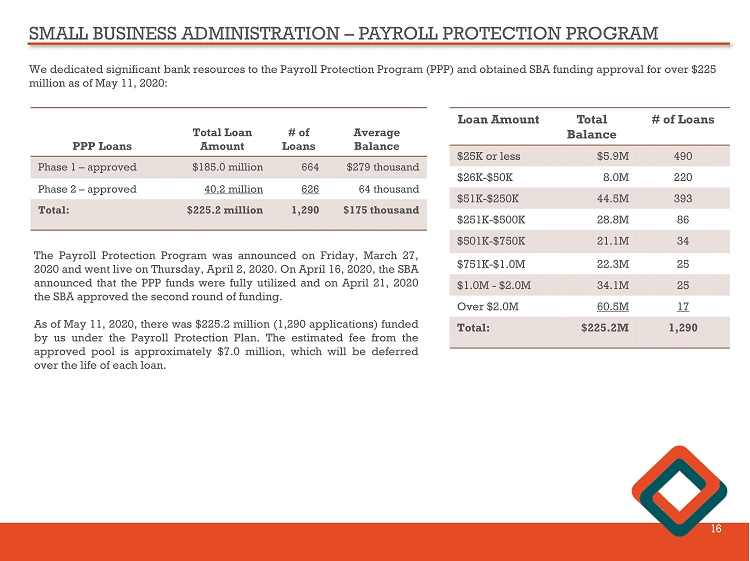
SMALL BUSINESS ADMINISTRATION – PAYROLL PROTECTION PROGRAM 16 We dedicated significant bank resources to the Payroll Protection Program (PPP) and obtained SBA funding approval for over $2 25 million as of May 11, 2020: PPP Loans Total Loan Amount # of Loans Average Balance Phase 1 – approved $185.0 million 664 $279 thousand Phase 2 – approved 40.2 million 626 64 thousand Total: $225.2 million 1,290 $175 thousand The Payroll Protection Program was announced on Friday, March 27 , 2020 and went live on Thursday, April 2 , 2020 . On April 16 , 2020 , the SBA announced that the PPP funds were fully utilized and on April 21 , 2020 the SBA approved the second round of funding . As of May 11 , 2020 , there was $ 225 . 2 million ( 1 , 290 applications) funded by us under the Payroll Protection Plan . The estimated fee from the approved pool is approximately $ 7 . 0 million, which will be deferred over the life of each loan . Loan Amount Total Balance # of Loans $25K or less $5.9M 490 $26K - $50K 8.0M 220 $51K - $250K 44.5M 393 $251K - $500K 28.8M 86 $501K - $750K 21.1M 34 $751K - $1.0M 22.3M 25 $1.0M - $2.0M 34.1M 25 Over $2.0M 60.5M 17 Total: $225.2M 1,290
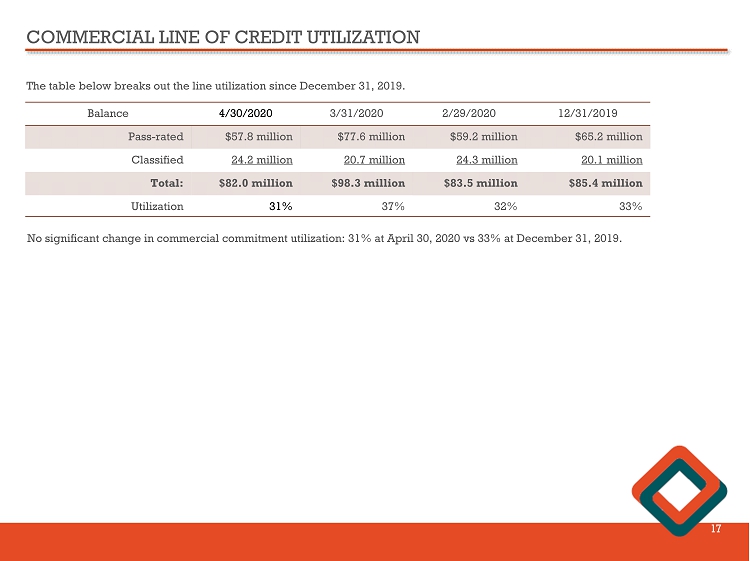
COMMERCIAL LINE OF CREDIT UTILIZATION 17 The table below breaks out the line utilization since December 31, 2019. Balance 4/30/2020 3/31/2020 2/29/2020 12/31/2019 Pass - rated $57.8 million $77.6 million $59.2 million $65.2 million Classified 24.2 million 20.7 million 24.3 million 20.1 million Total: $82.0 million $98.3 million $83.5 million $85.4 million Utilization 31% 37% 32% 33% No significant change in commercial commitment utilization: 31% at April 30, 2020 vs 33% at December 31, 2019.
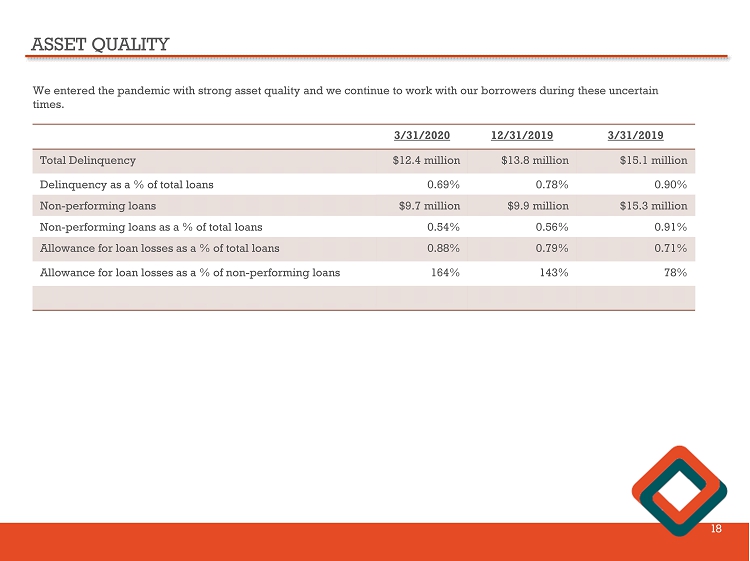
ASSET QUALITY 18 We entered the pandemic with strong asset quality and we continue to work with our borrowers during these uncertain times. 3/31/2020 12/31/2019 3/31/2019 Total Delinquency $12.4 million $13.8 million $15.1 million Delinquency as a % of total loans 0.69% 0.78% 0.90% Non - performing loans $9.7 million $9.9 million $15.3 million Non - performing loans as a % of total loans 0.54% 0.56% 0.91% Allowance for loan losses as a % of total loans 0.88% 0.79% 0.71% Allowance for loan losses as a % of non - performing loans 164% 143% 78%
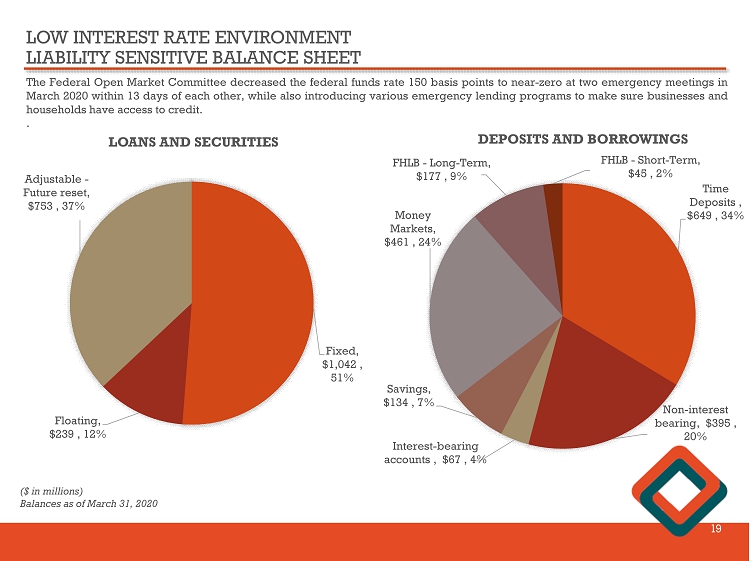
LOW INTEREST RATE ENVIRONMENT LIABILITY SENSITIVE BALANCE SHEET 19 The Federal Open Market Committee decreased the federal funds rate 150 basis points to near - zero at two emergency meetings in March 2020 within 13 days of each other, while also introducing various emergency lending programs to make sure businesses and households have access to credit . . Fixed , $1,042 , 51% Floating , $239 , 12% Adjustable - Future reset , $753 , 37% LOANS AND SECURITIES Time Deposits , $649 , 34% Non - interest bearing , $395 , 20% Interest - bearing accounts , $67 , 4% Savings , $134 , 7% Money Markets , $461 , 24% FHLB - Long - Term , $177 , 9% FHLB - Short - Term , $45 , 2% DEPOSITS AND BORROWINGS ($ in millions) Balances as of March 31, 2020
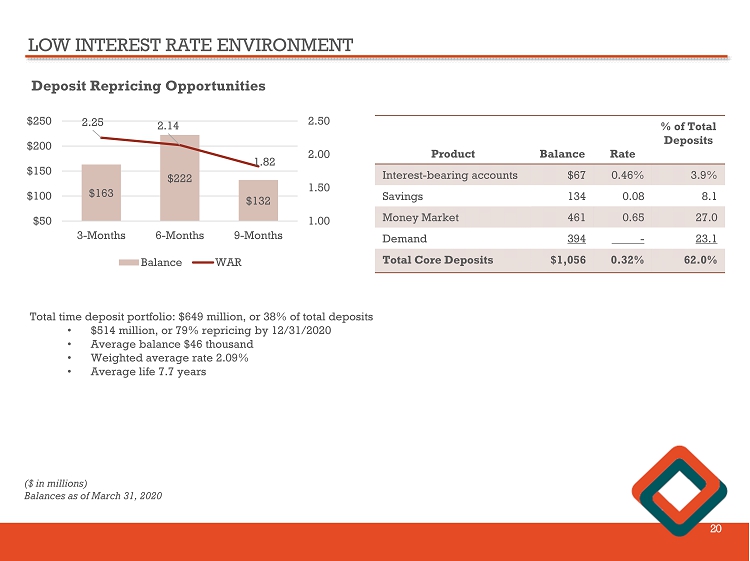
LOW INTEREST RATE ENVIRONMENT 20 $163 $222 $132 2.25 2.14 1.82 1.00 1.50 2.00 2.50 $50 $100 $150 $200 $250 3-Months 6-Months 9-Months Balance WAR Deposit Repricing Opportunities Total time deposit portfolio: $649 million, or 38% of total deposits • $514 million, or 79% repricing by 12/31/2020 • Average balance $46 thousand • Weighted average rate 2.09% • Average life 7.7 years Product Balance Rate % of Total Deposits Interest - bearing accounts $67 0.46% 3.9% Savings 134 0.08 8.1 Money Market 461 0.65 27.0 Demand 394 - 23.1 Total Core Deposits $1,056 0.32% 62.0% ($ in millions) Balances as of March 31, 2020
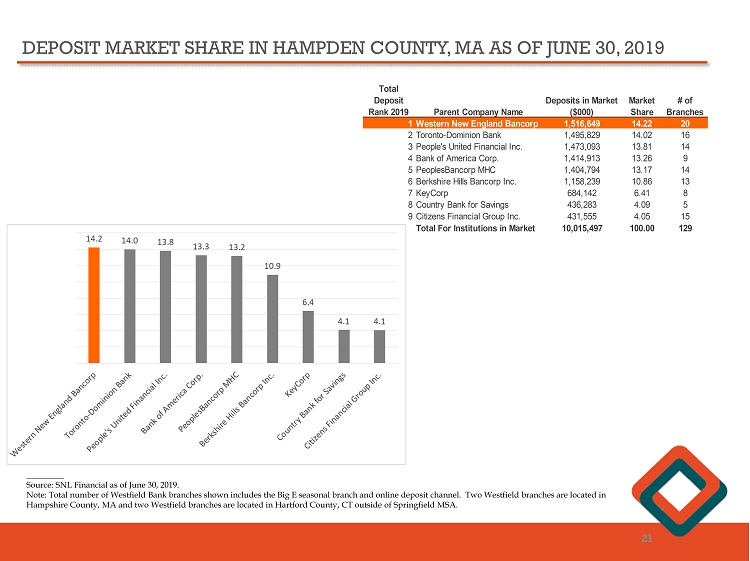
________ Source: SNL Financial as of June 30, 2019. Note: Total number of Westfield Bank branches shown includes the Big E seasonal branch and online deposit channel. Two Westf iel d branches are located in Hampshire County, MA and two Westfield branches are located in Hartford County, CT outside of Springfield MSA. DEPOSIT MARKET SHARE IN HAMPDEN COUNTY, MA AS OF JUNE 30, 2019 21 % % Total Deposit Rank 2019 Parent Company Name Deposits in Market ($000) Market Share # of Branches 1Western New England Bancorp 1,516,649 14.22 20 2Toronto-Dominion Bank 1,495,829 14.02 16 3People's United Financial Inc. 1,473,093 13.81 14 4Bank of America Corp. 1,414,913 13.26 9 5PeoplesBancorp MHC 1,404,794 13.17 14 6Berkshire Hills Bancorp Inc. 1,158,239 10.86 13 7KeyCorp 684,142 6.41 8 8Country Bank for Savings 436,283 4.09 5 9Citizens Financial Group Inc. 431,555 4.05 15 Total For Institutions in Market 10,015,497 100.00 129
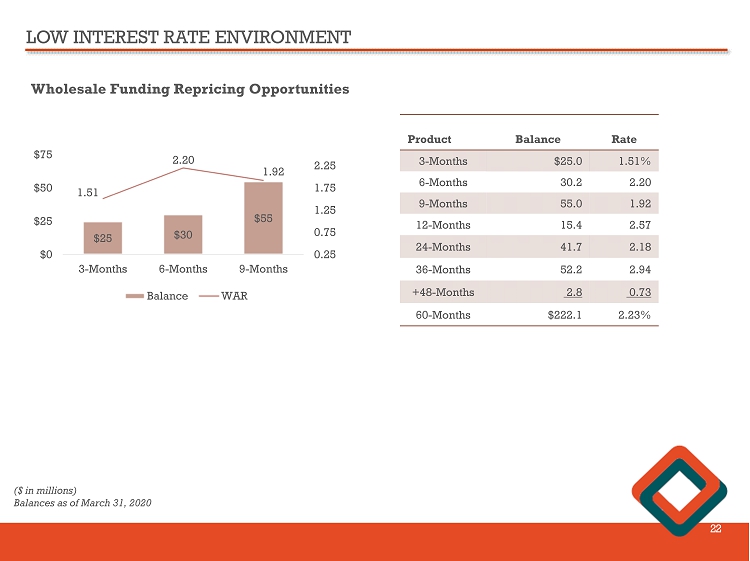
LOW INTEREST RATE ENVIRONMENT 22 $25 $30 $55 1.51 2.20 1.92 0.25 0.75 1.25 1.75 2.25 $0 $25 $50 $75 3-Months 6-Months 9-Months Balance WAR Wholesale Funding Repricing Opportunities Product Balance Rate 3 - Months $25.0 1.51% 6 - Months 30.2 2.20 9 - Months 55.0 1.92 12 - Months 15.4 2.57 24 - Months 41.7 2.18 36 - Months 52.2 2.94 +48 - Months 2.8 0.73 60 - Months $222.1 2.23% ($ in millions) Balances as of March 31, 2020
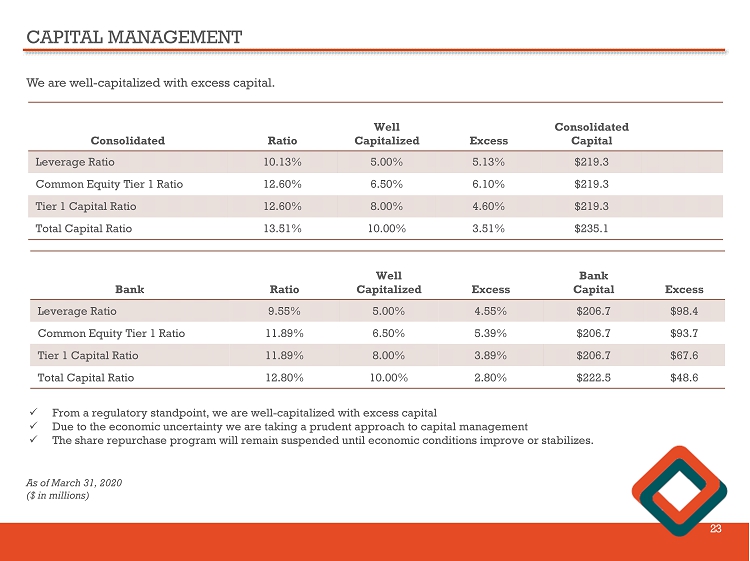
CAPITAL MANAGEMENT 23 We are well - capitalized with excess capital. Consolidated Ratio Well Capitalized Excess Consolidated Capital Leverage Ratio 10.13% 5.00% 5.13% $219.3 Common Equity Tier 1 Ratio 12.60% 6.50% 6.10% $219.3 Tier 1 Capital Ratio 12.60% 8.00% 4.60% $219.3 Total Capital Ratio 13.51% 10.00% 3.51% $235.1 x From a regulatory standpoint, we are well - capitalized with excess capital x Due to the economic uncertainty we are taking a prudent approach to capital management x The share repurchase program will remain suspended until economic conditions improve or stabilizes. As of March 31, 2020 ($ in millions) Bank Ratio Well Capitalized Excess Bank Capital Excess Leverage Ratio 9.55% 5.00% 4.55% $206.7 $98.4 Common Equity Tier 1 Ratio 11.89% 6.50% 5.39% $206.7 $93.7 Tier 1 Capital Ratio 11.89% 8.00% 3.89% $206.7 $67.6 Total Capital Ratio 12.80% 10.00% 2.80% $222.5 $48.6
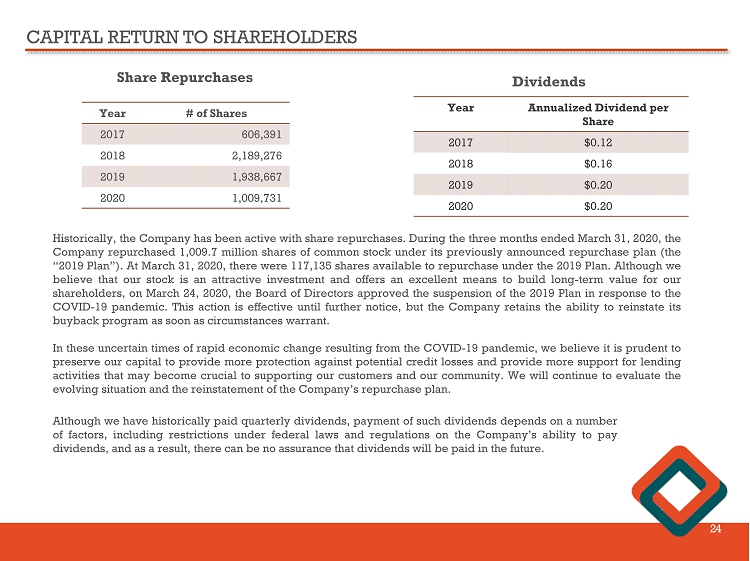
CAPITAL RETURN TO SHAREHOLDERS 24 Year # of Shares 2017 606,391 2018 2,189,276 2019 1,938,667 2020 1,009,731 Year Annualized Dividend per Share 2017 $0.12 2018 $0.16 2019 $0.20 2020 $0.20 Although we have historically paid quarterly dividends, payment of such dividends depends on a number of factors, including restrictions under federal laws and regulations on the Company’s ability to pay dividends, and as a result, there can be no assurance that dividends will be paid in the future . Share Repurchases Dividends Historically, the Company has been active with share repurchases . During the three months ended March 31 , 2020 , the Company repurchased 1 , 009 . 7 million shares of common stock under its previously announced repurchase plan (the “ 2019 Plan”) . At March 31 , 2020 , there were 117 , 135 shares available to repurchase under the 2019 Plan . Although we believe that our stock is an attractive investment and offers an excellent means to build long - term value for our shareholders, on March 24 , 2020 , the Board of Directors approved the suspension of the 2019 Plan in response to the COVID - 19 pandemic . This action is effective until further notice, but the Company retains the ability to reinstate its buyback program as soon as circumstances warrant . In these uncertain times of rapid economic change resulting from the COVID - 19 pandemic, we believe it is prudent to preserve our capital to provide more protection against potential credit losses and provide more support for lending activities that may become crucial to supporting our customers and our community . We will continue to evaluate the evolving situation and the reinstatement of the Company’s repurchase plan .
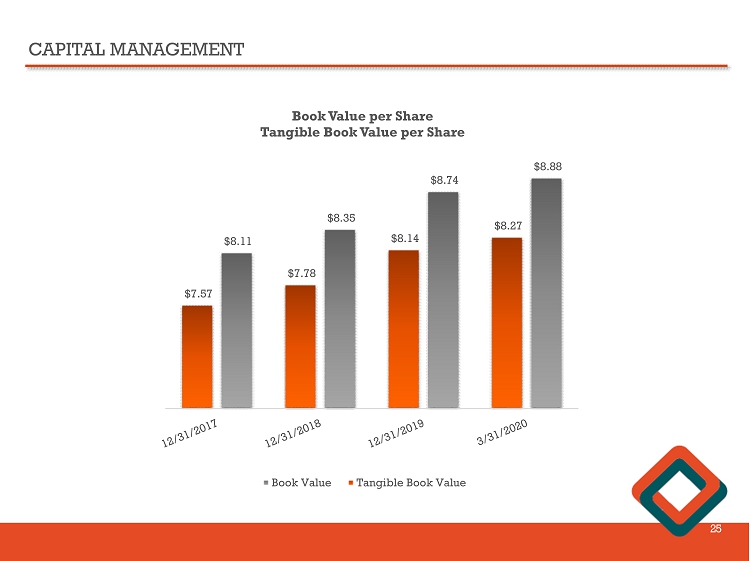
CAPITAL MANAGEMENT 25 $8.88 $8.74 $8.35 $8.11 $8.27 $8.14 $7.78 $7.57 Book Value per Share Tangible Book Value per Share Book Value Tangible Book Value
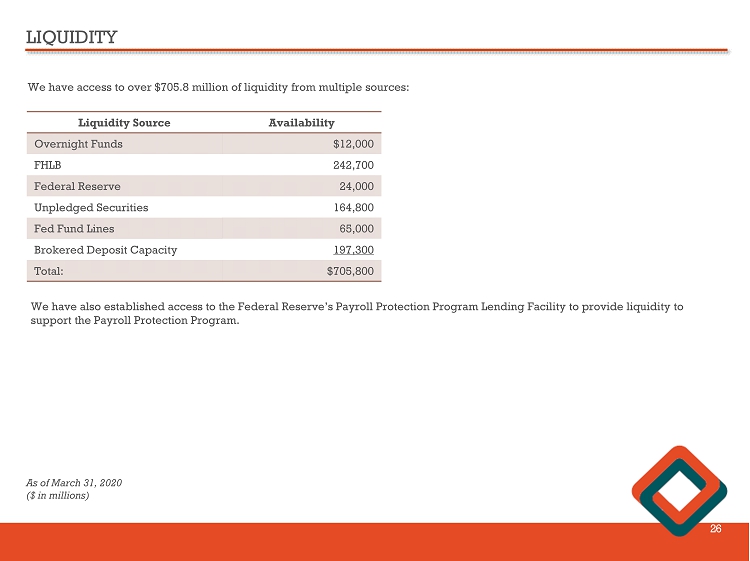
LIQUIDITY 26 We have access to over $705.8 million of liquidity from multiple sources: Liquidity Source Availability Overnight Funds $12,000 FHLB 242,700 Federal Reserve 24,000 Unpledged Securities 164,800 Fed Fund Lines 65,000 Brokered Deposit Capacity 197,300 Total: $705,800 We have also established access to the Federal Reserve’s Payroll Protection Program Lending Facility to provide liquidity to support the Payroll Protection Program. As of March 31, 2020 ($ in millions)
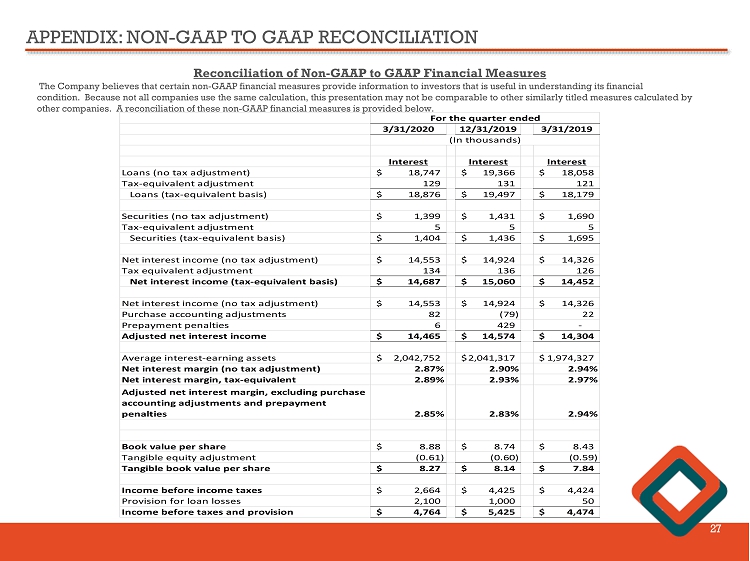
APPENDIX: NON - GAAP TO GAAP RECONCILIATION 27 Reconciliation of Non - GAAP to GAAP Financial Measures The Company believes that certain non - GAAP financial measures provide information to investors that is useful in understanding i ts financial condition. Because not all companies use the same calculation, this presentation may not be comparable to other similarly title d measures calculated by other companies. A reconciliation of these non - GAAP financial measures is provided below. 3/31/2020 12/31/2019 3/31/2019 Interest Interest Interest Loans (no tax adjustment) 18,747$ 19,366$ 18,058$ Tax-equivalent adjustment 129 131 121 Loans (tax-equivalent basis) 18,876$ 19,497$ 18,179$ Securities (no tax adjustment) 1,399$ 1,431$ 1,690$ Tax-equivalent adjustment 5 5 5 Securities (tax-equivalent basis) 1,404$ 1,436$ 1,695$ Net interest income (no tax adjustment) 14,553$ 14,924$ 14,326$ Tax equivalent adjustment 134 136 126 Net interest income (tax-equivalent basis) 14,687$ 15,060$ 14,452$ Net interest income (no tax adjustment) 14,553$ 14,924$ 14,326$ Purchase accounting adjustments 82 (79) 22 Prepayment penalties 6 429 - Adjusted net interest income 14,465$ 14,574$ 14,304$ Average interest-earning assets 2,042,752$ 2,041,317$ 1,974,327$ Net interest margin (no tax adjustment) 2.87% 2.90% 2.94% Net interest margin, tax-equivalent 2.89% 2.93% 2.97% Adjusted net interest margin, excluding purchase accounting adjustments and prepayment penalties 2.85% 2.83% 2.94% Book value per share 8.88$ 8.74$ 8.43$ Tangible equity adjustment (0.61) (0.60) (0.59) Tangible book value per share 8.27$ 8.14$ 7.84$ Income before income taxes 2,664$ 4,425$ 4,424$ Provision for loan losses 2,100 1,000 50 Income before taxes and provision 4,764$ 5,425$ 4,474$ For the quarter ended (In thousands)
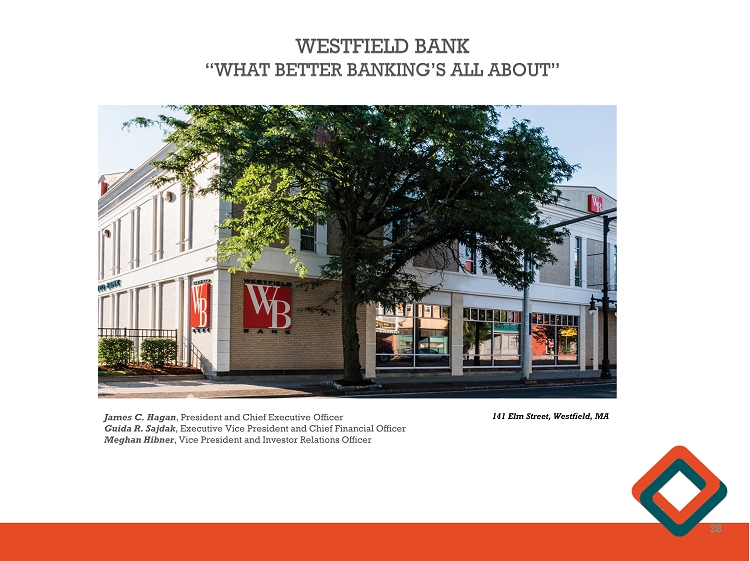
WESTFIELD BANK “WHAT BETTER BANKING’S ALL ABOUT” James C. Hagan , President and Chief Executive Officer Guida R. Sajdak , Executive Vice President and Chief Financial Officer Meghan Hibner , Vice President and Investor Relations Officer 28 141 Elm Street, Westfield, MA