Attached files
| file | filename |
|---|---|
| 8-K - 8-K - JUNIATA VALLEY FINANCIAL CORP | tmb-20200519x8k.htm |
Exhibit 99.1
| HERE TO HELP JUNIATA VALLEY FINANCIAL CORP. 2020 ANNUAL MEETING MAY 19, 2020 |

| Shareholders’ Business Meeting Chairman, Timothy Havice |

| Agenda • Call to Order • Rules of Conduct • Introduction of Members of the Board of Directors • Determine Presence of Quorum, Approval of Minutes, Appointment of Tellers • Nominations • Voting Tabulation • President Marcie Barber’s Address –“Here to Help” • CFO JoAnn McMinn – Financial Presentation • Questions/Comments • Adjournment |

| Board of Directors • Chairman, Timothy I. Havice • Vice Chairman, Philip E. Gingerich, Jr. • Bradley J. Wagner • Marcie A. Barber • Martin L. Dreibelbis • Gary E. Kelsey • Michael A. Buffington • Dr. Richard M. Scanlon |

| Agenda Call to Order ✓ Rules of Conduct ✓ Introduction of Members of the Board of Directors • Determine Presence of Quorum, Approval of Minutes, Appointment of Tellers • Nominations • Voting Tabulation • President Marcie Barber’s Address –“Here to Help” • CFO JoAnn McMinn – Financial Presentation • Questions/Comments • Adjournment |

| Forward Looking Statements This presentation may contain “forward looking” information as defined by the Private Securities Litigation Reform Act of 1995. When words such as “believes”, “expects”, “anticipates” or similar expressions are used in this presentation, Juniata is making forward-looking statements. Such information is based on Juniata’s current expectations, estimates and projections about future events and financial trends affecting the financial condition of its business. These statements are not historical facts or guarantees of future performance, events or results. Such statements involve potential risks and uncertainties and, accordingly, actual results may differ materially from this forward-looking information. Many factors could affect future financial results. Juniata undertakes no obligation to publicly update or revise forward looking information, whether as a result of new or updated information, future events, or otherwise. For a more complete discussion of certain risks and uncertainties affecting Juniata, please see the sections entitled “Risk Factors” and “Management’s Discussion and Analysis of Financial Condition and Results of Operations – Forward-Looking Statements” set forth in the Juniata’s filings with the Securities and Exchange Commission. |

| PRESIDENT’S ADDRESS– HERE TO HELP President and CEO, Marcie A. Barber |

| 2019 FINANCIAL PERFORMANCE EVP and CFO, JoAnn McMinn |

| Presentation Information The presentation that follows contains some supplemental financial information determined by methods other than in accordance with U.S. generally accepted accounting principles (GAAP). Some tables that follow present reconciliations of certain non-GAAP measures to the most directly comparable GAAP measures. These reconciliations exclude certain charges incurred and income recorded during the years ended December 31, 2018 and 2019, which the Company believes do not reflect the operating performance of the Company during that period. The charges include costs associated with the acquisition of Liverpool Community Bank and the Defined Benefit Settlement accounting effects. The Company’s management uses these non-GAAP measures to evaluate the performance of the Company and believes this presentation also increases the comparability of period-to-period results. The Company believes these non-GAAP measures, in addition to GAAP measures, provide useful information for investors to evaluate the Company’s results. These non-GAAP measures should not be considered a substitute of GAAP measures, nor are they necessarily comparable to non- GAAP measures that may be presented by other companies. Throughout the presentation, non-GAAP measures as described above are referred to as “Core” and a reconciliation of GAAP to non-GAAP measures is included in this presentation. |

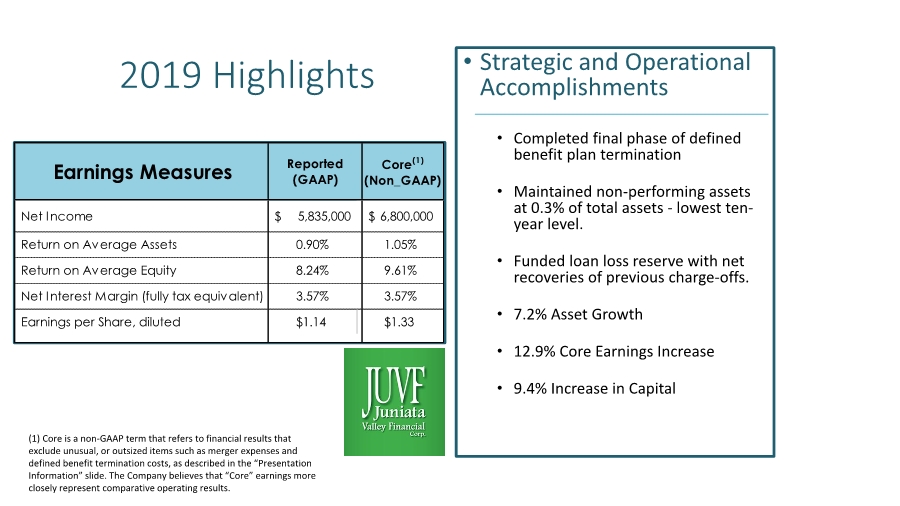
| 2019 Highlights • Strategic and Operational Accomplishments • Completed final phase of defined benefit plan termination • Maintained non-performing assets at 0.3% of total assets - lowest ten- year level. • Funded loan loss reserve with net recoveries of previous charge-offs. • 7.2% Asset Growth • 12.9% Core Earnings Increase • 9.4% Increase in Capital Earnings Measures Net Income 5,835,000 $ 6,800,000 $ Return on Average Assets 0.90% 1.05% Return on Average Equity 8.24% 9.61% Net Interest Margin (fully tax equivalent) 3.57% 3.57% Earnings per Share, diluted $1.14 $1.33 Reported (GAAP) Core(1) (Non_GAAP) (1) Core is a non-GAAP term that refers to financial results that exclude unusual, or outsized items such as merger expenses and defined benefit termination costs, as described in the “Presentation Information” slide. The Company believes that “Core” earnings more closely represent comparative operating results. |
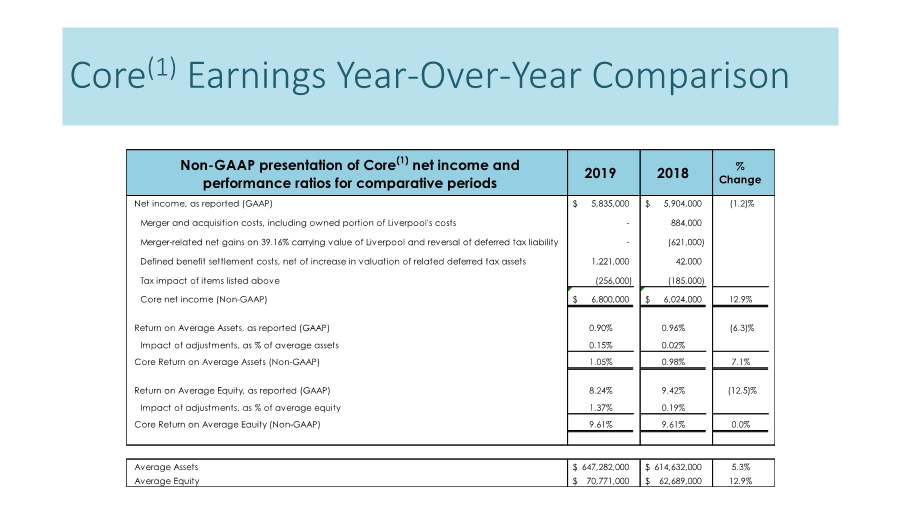
| Core(1) Earnings Year-Over-Year Comparison Non-GAAP presentation of Core(1) net income and performance ratios for comparative periods 2019 2018 % Change Net income, as reported (GAAP) 5,835,000 $ 5,904,000 $ (1.2)% Merger and acquisition costs, including owned portion of Liverpool's costs - 884,000 Merger-related net gains on 39.16% carrying value of Liverpool and reversal of deferred tax liability - (621,000) Defined benefit settlement costs, net of increase in valuation of related deferred tax assets 1,221,000 42,000 Tax impact of items listed above (256,000) (185,000) Core net income (Non-GAAP) 6,800,000 $ 6,024,000 $ 12.9% Return on Average Assets, as reported (GAAP) 0.90% 0.96% (6.3)% Impact of adjustments, as % of average assets 0.15% 0.02% Core Return on Average Assets (Non-GAAP) 1.05% 0.98% 7.1% Return on Average Equity, as reported (GAAP) 8.24% 9.42% (12.5)% Impact of adjustments, as % of average equity 1.37% 0.19% Core Return on Average Eauity (Non-GAAP) 9.61% 9.61% 0.0% Average Assets 647,282,000 $ 614,632,000 $ 5.3% Average Equity 70,771,000 $ 62,689,000 $ 12.9% |
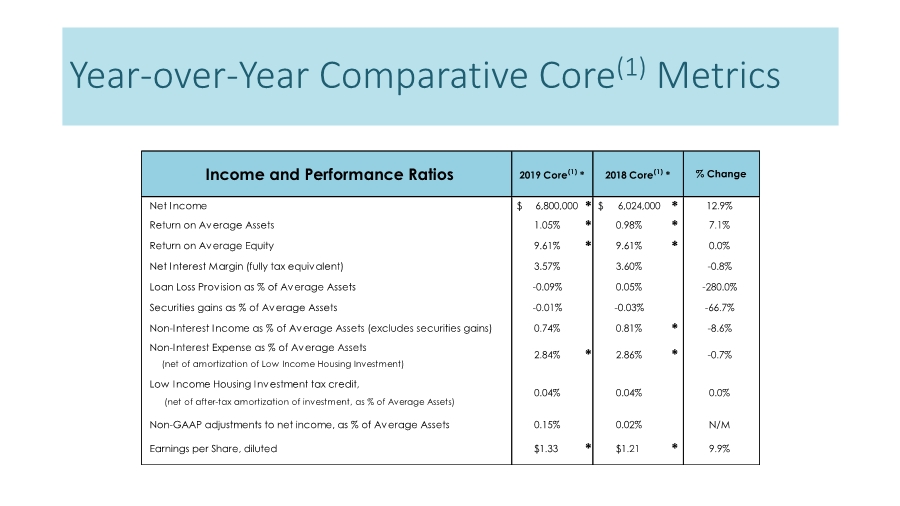
| Year-over-Year Comparative Core(1) Metrics Income and Performance Ratios Net Income 6,800,000 $ * 6,024,000 $ * 12.9% Return on Average Assets 1.05% * 0.98% * 7.1% Return on Average Equity 9.61% * 9.61% * 0.0% Net Interest Margin (fully tax equivalent) 3.57% 3.60% -0.8% Loan Loss Provision as % of Average Assets -0.09% 0.05% -280.0% Securities gains as % of Average Assets -0.01% -0.03% -66.7% Non-Interest Income as % of Average Assets (excludes securities gains) 0.74% 0.81% *-8.6% Non-Interest Expense as % of Average Assets (net of amortization of Low Income Housing Investment) Low Income Housing Investment tax credit, (net of after-tax amortization of investment, as % of Average Assets) Non-GAAP adjustments to net income, as % of Average Assets 0.15% 0.02% N/M Earnings per Share, diluted $1.33 * $1.21 * 9.9% % Change -0.7% 0.0% 2018 Core(1) * 2019 Core(1) * * 2.84% 2.86% 0.04% 0.04% * |
| 2019 Strategic and Operational Accomplishments |

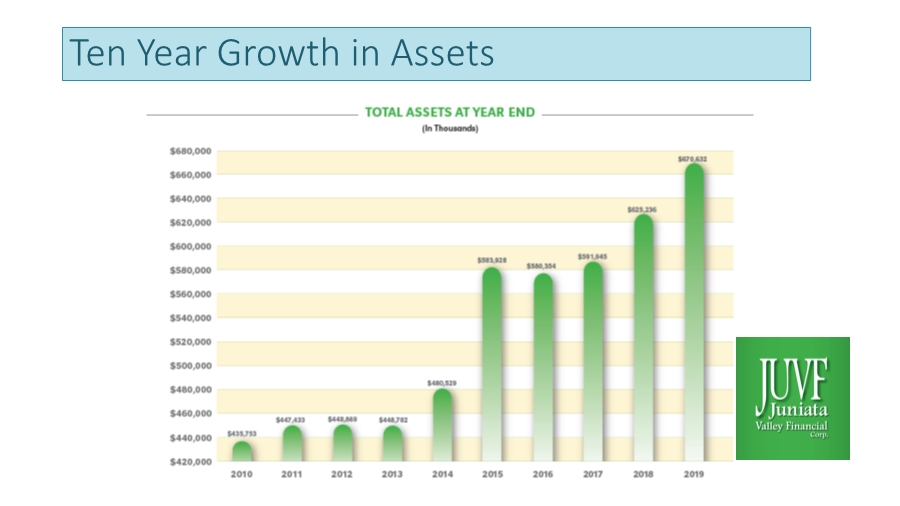
| Ten Year Growth in Assets |
| Defined Benefit Plan Termination Completion of three-year strategy to reduce the liability and volatility associated with a legacy Defined Benefit Plan |

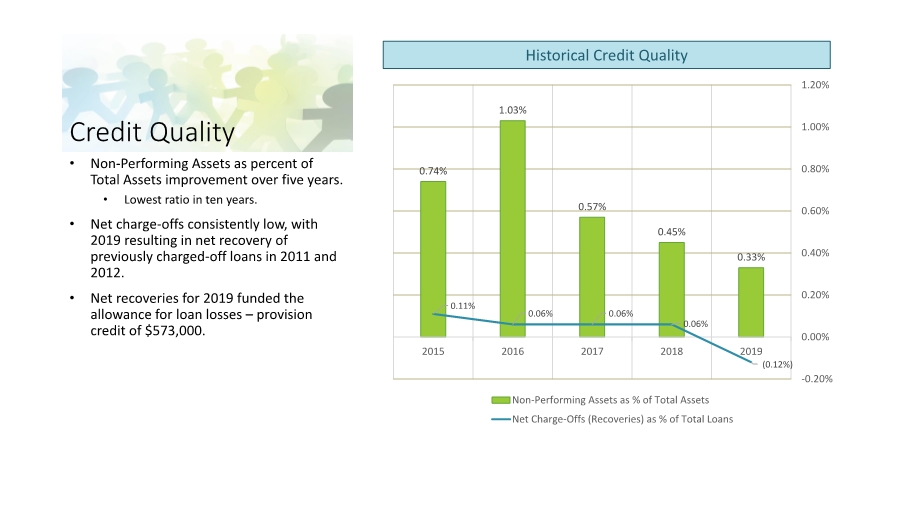
| Credit Quality 0.74% 1.03% 0.57% 0.45% 0.33% 0.11% 0.06% 0.06% 0.06% (0.12%) 2015 2016 2017 2018 2019 -0.20% 0.00% 0.20% 0.40% 0.60% 0.80% 1.00% 1.20% Non-Performing Assets as % of Total Assets Net Charge-Offs (Recoveries) as % of Total Loans • Non-Performing Assets as percent of Total Assets improvement over five years. • Lowest ratio in ten years. • Net charge-offs consistently low, with 2019 resulting in net recovery of previously charged-off loans in 2011 and 2012. • Net recoveries for 2019 funded the allowance for loan losses – provision credit of $573,000. Historical Credit Quality |
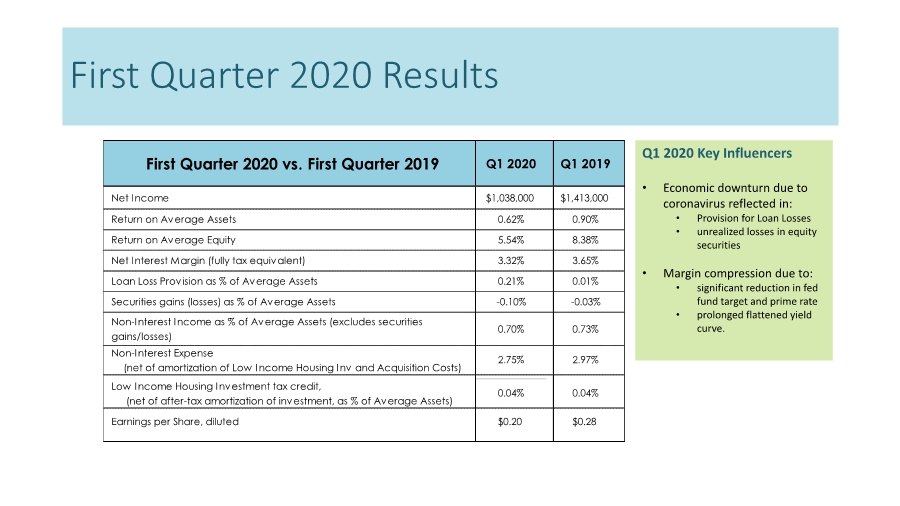
| First Quarter 2020 Results Q1 2020 Key Influencers • Economic downturn due to coronavirus reflected in: • Provision for Loan Losses • unrealized losses in equity securities • Margin compression due to: • significant reduction in fed fund target and prime rate • prolonged flattened yield curve. First Quarter 2020 vs. First Quarter 2019 Q1 2020 Q1 2019 Net Income $1,038,000 $1,413,000 Return on Average Assets 0.62% 0.90% Return on Average Equity 5.54% 8.38% Net Interest Margin (fully tax equivalent) 3.32% 3.65% Loan Loss Provision as % of Average Assets 0.21% 0.01% Securities gains (losses) as % of Average Assets -0.10% -0.03% Non-Interest Income as % of Average Assets (excludes securities gains/losses) 0.70% 0.73% Non-Interest Expense (net of amortization of Low Income Housing Inv and Acquisition Costs) Low Income Housing Investment tax credit, (net of after-tax amortization of investment, as % of Average Assets) Earnings per Share, diluted $0.20 $0.28 2.75% 2.97% 0.04% 0.04% |
| Looking Ahead for 2020 Refer to Forward-Looking Statement Disclaimer |

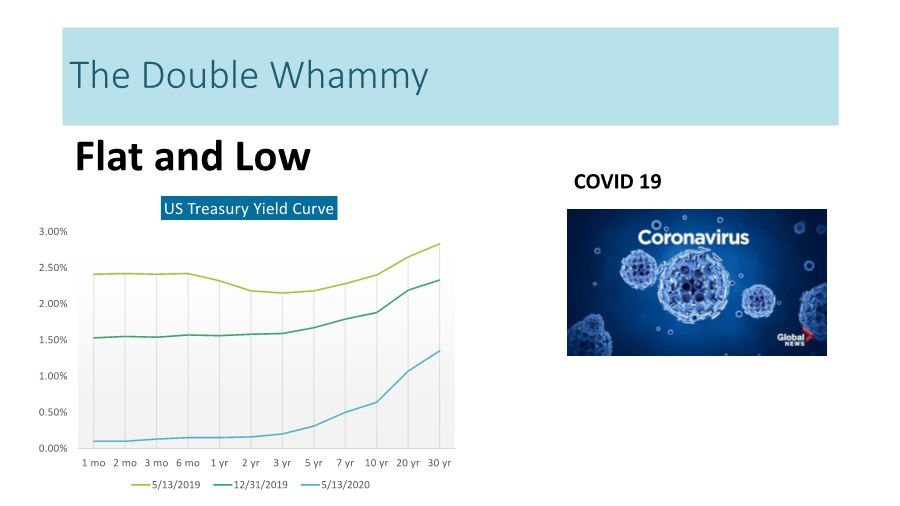
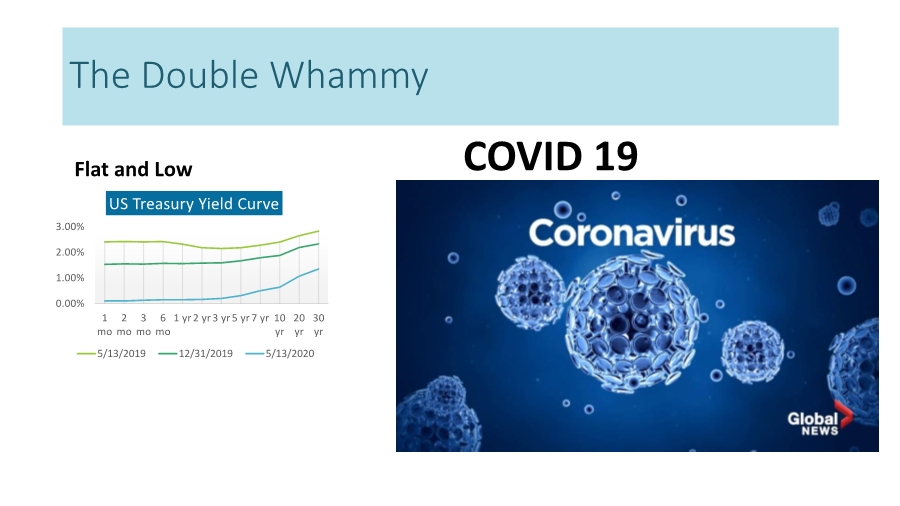
| The Double Whammy Flat and Low COVID 19 0.00% 0.50% 1.00% 1.50% 2.00% 2.50% 3.00% 1 mo 2 mo 3 mo 6 mo 1 yr 2 yr 3 yr 5 yr 7 yr 10 yr 20 yr 30 yr US Treasury Yield Curve 5/13/2019 12/31/2019 5/13/2020 |
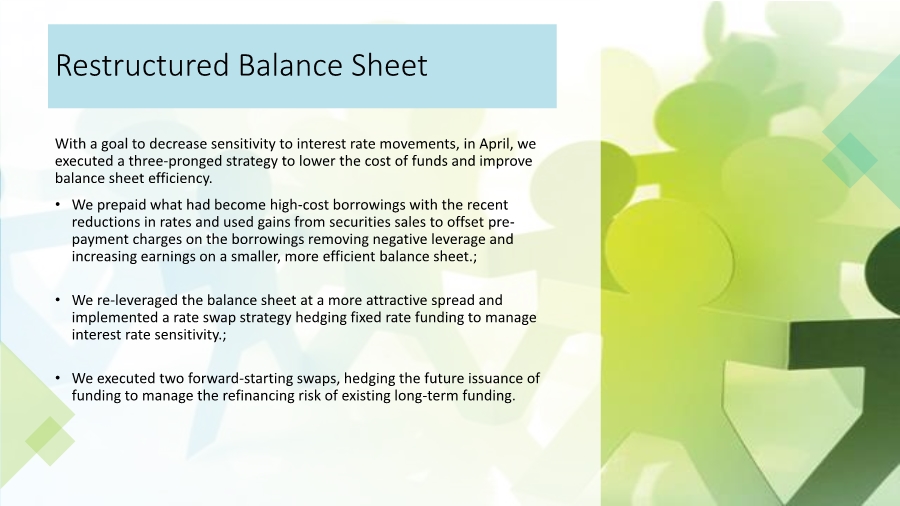
| Restructured Balance Sheet With a goal to decrease sensitivity to interest rate movements, in April, we executed a three-pronged strategy to lower the cost of funds and improve balance sheet efficiency. • We prepaid what had become high-cost borrowings with the recent reductions in rates and used gains from securities sales to offset pre- payment charges on the borrowings removing negative leverage and increasing earnings on a smaller, more efficient balance sheet.; • We re-leveraged the balance sheet at a more attractive spread and implemented a rate swap strategy hedging fixed rate funding to manage interest rate sensitivity.; • We executed two forward-starting swaps, hedging the future issuance of funding to manage the refinancing risk of existing long-term funding. |
| The Double Whammy Flat and Low 0.00% 1.00% 2.00% 3.00% 1 mo 2 mo 3 mo 6 mo 1 yr2 yr3 yr5 yr7 yr 10 yr 20 yr 30 yr US Treasury Yield Curve 5/13/2019 12/31/2019 5/13/2020 COVID 19 |
| Paycheck Protection Program |

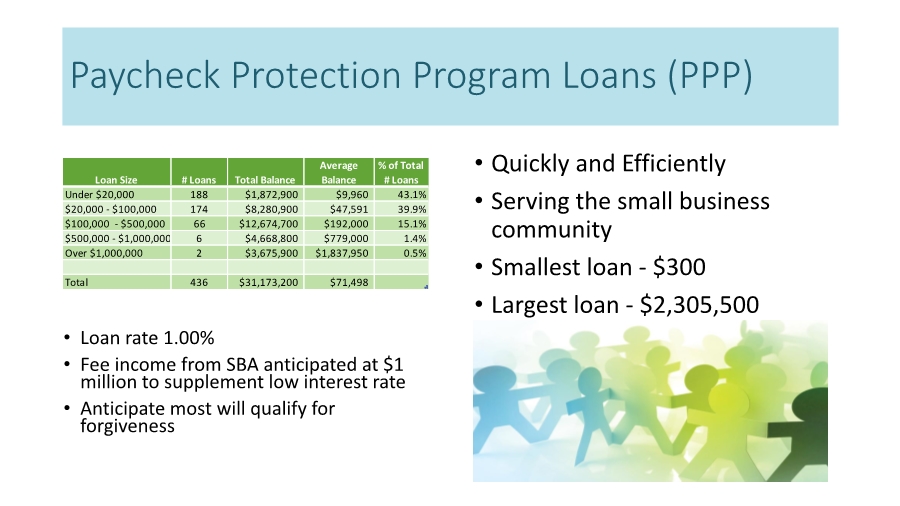
| Paycheck Protection Program Loans (PPP) • Loan rate 1.00% • Fee income from SBA anticipated at $1 million to supplement low interest rate • Anticipate most will qualify for forgiveness • Quickly and Efficiently • Serving the small business community • Smallest loan - $300 • Largest loan - $2,305,500 Loan Size # Loans Total Balance Average Balance % of Total # Loans Under $20,000 188 $1,872,900 $9,960 43.1% $20,000 - $100,000 174 $8,280,900 $47,591 39.9% $100,000 - $500,000 66 $12,674,700 $192,000 15.1% $500,000 - $1,000,000 6 $4,668,800 $779,000 1.4% Over $1,000,000 2 $3,675,900 $1,837,950 0.5% Total 436 $31,173,200 $71,498 |
| Additional Opportunities.. • Enhanced Digital Marketing • Expanded Meeting Platforms • Customer Preferences •Operating Efficiencies |

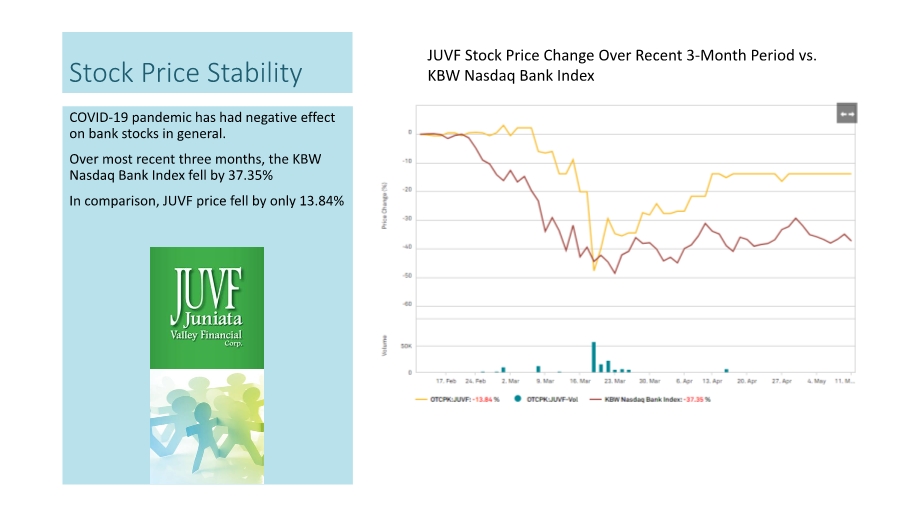
| Stock Price Stability COVID-19 pandemic has had negative effect on bank stocks in general. Over most recent three months, the KBW Nasdaq Bank Index fell by 37.35% In comparison, JUVF price fell by only 13.84% JUVF Stock Price Change Over Recent 3-Month Period vs. KBW Nasdaq Bank Index |
| Questions / Comments Note that this presentation has been recorded and will be available for one year on our Investor Website Additionally, this presentation has been filed with the SEC on a Form 8-K |

| Vote Tabulation Report Lisa Snyder |

| Meeting Adjournment JUNIATA VALLEY FINANCIAL CORP. 2020 ANNUAL MEETING MAY 19, 2020 |