Attached files
| file | filename |
|---|---|
| EX-32.2 - CERTIFICATION - China Green Agriculture, Inc. | f10q0320ex32-2_chinagreen.htm |
| EX-32.1 - CERTIFICATION - China Green Agriculture, Inc. | f10q0320ex32-1_chinagreen.htm |
| EX-31.2 - CERTIFICATION - China Green Agriculture, Inc. | f10q0320ex31-2_chinagreen.htm |
| EX-31.1 - CERTIFICATION - China Green Agriculture, Inc. | f10q0320ex31-1_chinagreen.htm |
| EX-21.1 - LIST OF SUBSIDIARIES OF THE COMPANY - China Green Agriculture, Inc. | f10q0320ex21-1_chinagreen.htm |
UNITED STATES
SECURITIES AND EXCHANGE COMMISSION
WASHINGTON, D.C. 20549
FORM 10-Q
(Mark One)
☒ QUARTERLY REPORT PURSUANT TO SECTION 13 or 15(d) OF THE SECURITIES EXCHANGE ACT OF 1934.
For the quarterly period ended March 31, 2020
☐ TRANSITION REPORT PURSUANT TO SECTION 13 OR 15(d) OF THE SECURITIES EXCHANGE ACT OF 1934.
For the transition period from ____________ to ____________
Commission File Number 001-34260
CHINA GREEN AGRICULTURE, INC.
(Exact name of registrant as specified in its charter)
| Nevada | 36-3526027 | |
| (State or other jurisdiction of | (IRS Employer | |
| incorporation or organization) | Identification No.) |
3rd floor, Borough A, Block A. No. 181, South Taibai
Road, Xi’an, Shaanxi province, PRC 710065
(Address of principal executive offices) (Zip Code)
+86-29-88266368
(Issuer’s telephone number, including area code)
Indicate by check mark whether the issuer (1) filed all reports required to be filed by Section 13 or 15(d) of the Securities Exchange Act of 1934 during the preceding 12 months (or for such shorter period that the registrant was required to file such reports), and (2) has been subject to such filing requirements for the past 90 days. Yes ☒ No ☐
Indicate by check mark whether the registrant has submitted electronically and posted on its corporate Web site, if any, every Interactive Data File required to be submitted and posted pursuant to Rule 405 of Regulation S-T (§232.405 of this chapter) during the preceding 12 months (or for such shorter period that the registrant was required to submit and post such files). Yes ☒ No ☐
Indicate by check mark whether the registrant is a large accelerated filer, an accelerated filer, a non-accelerated filer, smaller reporting company, or an emerging growth company. See the definitions of “large accelerated filer,” “accelerated filer,” “smaller reporting company,” and “emerging growth company” in Rule 12b-2 of the Exchange Act.
| Large accelerated filer | ☐ | Accelerated filer | ☐ | |
| Non-accelerated filer | ☐ | Smaller reporting company | ☒ | |
| Emerging growth company | ☐ | |||
If an emerging growth company, indicate by check mark if the registrant has elected not to use the extended transition period for complying with any new or revised financial accounting standards provided pursuant to Section 13(a) of the Exchange Act. ☐
Indicate by check mark whether the registrant is a shell company (as defined in Rule 12b-2 of the Exchange Act). Yes ☐ No ☒
Securities registered pursuant to Section 12(b) of the Act:
| Title of each class | Trading Symbol(s) | Name of each exchange on which registered | ||
| Common Stock | CGA | NYSE |
APPLICABLE ONLY TO CORPORATE ISSUERS:
Indicate the number of shares outstanding of each of the issuer’s classes of common stock, as of the latest practicable date: 6,350,129 shares of common stock, $0.001 par value, as of May 15, 2020.
TABLE OF CONTENTS
i
INFORMATION RELATING TO FORWARD-LOOKING STATEMENTS
In addition to historical information, this report contains forward-looking statements within the meaning of Section 27A of the Securities Act and Section 21E of the Exchange Act. You can identify such forward-looking statements by terms such as “anticipates,” “believes,” “could,” “estimates,” “expects,” “intends,” “may,” “plans,” “potential,” “predicts,” “projects,” “should,” “would” and similar expressions intended to identify forward-looking statements. Forward-looking statements reflect our current views with respect to future events and are based on assumptions and subject to risks and uncertainties. Given these uncertainties, you should not place undue reliance on these forward-looking statements. These forward-looking statements may include, among other things, statements relating to:
| ● | COVID-19 on our financial condition and operations, which adversely affects our ability to obtain acceptable financing in an amount equal to the resulting reduction in cash from operations, and the current, and uncertain future, other impacts of the COVID-19 outbreak, including its effect on operations, outlook, plans, goals, growth, reputation, cash flows, liquidity, and share price; |
| ● | our expectations regarding the market for our products and services; |
| ● | our expectations regarding the continued growth of our industry; |
| ● | our beliefs regarding the competitiveness of our products; |
| ● | our expectations regarding the expansion of our manufacturing capacity; |
| ● | our expectations with respect to increased revenue growth and our ability to maintain profitability resulting from increases in our production volumes; |
| ● | our future business development, results of operations and financial condition; |
| ● | competition from other fertilizer and plant producers; |
| ● | the loss of any member of our management team; |
| ● | our ability to integrate acquired subsidiaries and operations into existing operations; |
| ● | market conditions affecting our equity capital; |
| ● | our ability to successfully implement our selective acquisition strategy; |
| ● | changes in general economic conditions; |
| ● | changes in accounting rules or the application of such rules; |
| ● | any failure to comply with the periodic filing and other requirements of The New York Stock Exchange, or NYSE, for continued listing, |
| ● | any failure to identify and remediate the material weaknesses or other deficiencies in our internal control and disclosure control over financial reporting; |
Also, forward-looking statements represent our estimates and assumptions only as of the date of this report. You should read this report and the documents that we reference in this report, or that we filed as exhibits to this report, in their entirety and with the understanding that our actual future results may be materially different from what we expect.
Additionally, many of these risks and uncertainties are currently amplified by and will continue to be amplified by, or in the future may be amplified by, the COVID-19 outbreak. It is not possible to predict or identify all such risks. There may be additional risks that we consider immaterial or which are unknown.
Except as required by law, we assume no obligation to update any forward-looking statements publicly, or to update the reasons actual results could differ materially from those anticipated in any forward-looking statements, even if new information becomes available in the future.
ii
PART I – FINANCIAL INFORMATION
CHINA GREEN AGRICULTURE, INC. AND SUBSIDIARIES
CONSOLIDATED BALANCE SHEETS
(UNAUDITED)
| March 31, 2020 | June 30, 2019 | |||||||
| ASSETS | ||||||||
| Current Assets | ||||||||
| Cash and cash equivalents | $ | 41,311,137 | $ | 72,259,804 | ||||
| Accounts receivable, net | 166,452,189 | 145,190,160 | ||||||
| Inventories | 62,234,682 | 162,013,889 | ||||||
| Prepaid expenses and other current assets | 3,363,721 | 2,776,370 | ||||||
| Advances to suppliers, net | 62,935,130 | 32,713,817 | ||||||
| Total Current Assets | 336,296,859 | 414,954,039 | ||||||
| Plant, Property and Equipment, Net | 23,595,885 | 26,669,938 | ||||||
| Other Assets | 259,627 | 267,907 | ||||||
| Other Non-current Assets | 11,387,890 | 13,352,645 | ||||||
| Intangible Assets, Net | 16,103,409 | 17,881,449 | ||||||
| Goodwill | 7,631,050 | 7,874,421 | ||||||
| Total Assets | $ | 395,274,720 | $ | 481,000,399 | ||||
| LIABILITIES AND STOCKHOLDERS’ EQUITY | ||||||||
| Current Liabilities | ||||||||
| Accounts payable | $ | 20,310,699 | $ | 19,004,548 | ||||
| Customer deposits | 7,713,614 | 6,514,619 | ||||||
| Accrued expenses and other payables | 12,287,124 | 12,029,722 | ||||||
| Amount due to related parties | 4,209,526 | 3,641,945 | ||||||
| Taxes payable | 30,627,985 | 31,357,690 | ||||||
| Short term loans | 3,809,700 | 3,640,000 | ||||||
| Interest payable | 723,843 | 720,720 | ||||||
| Derivative liability | - | 18,162 | ||||||
| Convertible notes payable | - | 7,517,307 | ||||||
| Total Current Liabilities | 79,682,492 | 84,444,714 | ||||||
| Long-term Liabilities | - | - | ||||||
| Total Liabilities | $ | 79,682,492 | $ | 84,444,714 | ||||
| Stockholders’ Equity | ||||||||
| Preferred Stock, $.001 par value, 20,000,000 shares authorized, zero shares issued and outstanding | - | - | ||||||
| Common stock, $.001 par value, 115,197,165 shares authorized, 6,350,129 and 3,986,912 shares issued and outstanding as of March 31, 2020 and June 30, 2019, respectively | 6,350 | 3,987 | ||||||
| Additional paid-in capital | 155,455,332 | 138,012,445 | ||||||
| Statutory reserve | 30,240,593 | 31,237,891 | ||||||
| Retained earnings | 163,500,883 | 247,122,574 | ||||||
| Accumulated other comprehensive income | (33,610,930 | ) | (19,821,211 | ) | ||||
| Total Stockholders’ Equity | 315,592,228 | 396,555,686 | ||||||
| Total Liabilities and Stockholders’ Equity | $ | 395,274,720 | $ | 481,000,399 | ||||
The accompanying notes are an integral part of these consolidated financial statements.
1
CHINA GREEN AGRICULTURE, INC. AND SUBSIDIARIES
CONSOLIDATED STATEMENTS OF INCOME AND COMPREHENSIVE INCOME (LOSS)
(UNAUDITED)
| Three Months Ended March 31, | Nine Months Ended March 31, | |||||||||||||||
| 2020 | 2019 | 2020 | 2019 | |||||||||||||
| Sales | ||||||||||||||||
| Jinong | $ | 11,266,437 | $ | 22,077,336 | 44,842,738 | $ | 61,561,229 | |||||||||
| Gufeng | 57,094,310 | 67,167,427 | 95,684,076 | 106,996,368 | ||||||||||||
| Yuxing | 2,014,987 | 2,817,942 | 7,016,208 | 7,828,981 | ||||||||||||
| VIEs - others | 15,450,955 | 16,057,865 | 38,670,247 | 41,943,261 | ||||||||||||
| Net sales | 85,826,689 | 108,120,570 | 186,213,269 | 218,329,839 | ||||||||||||
| Cost of goods sold | ||||||||||||||||
| Jinong | 8,193,579 | 11,091,419 | 28,814,001 | 31,289,473 | ||||||||||||
| Gufeng | 50,097,056 | 59,475,263 | 84,307,031 | 94,544,943 | ||||||||||||
| Yuxing | 1,847,112 | 2,445,246 | 6,009,429 | 6,658,975 | ||||||||||||
| VIEs - others | 13,071,508 | 13,951,667 | 32,485,642 | 35,965,608 | ||||||||||||
| Cost of goods sold | 73,209,255 | 86,963,595 | 151,616,103 | 168,458,999 | ||||||||||||
| Gross profit | 12,617,434 | 21,156,975 | 34,597,166 | 49,870,840 | ||||||||||||
| Operating expenses | ||||||||||||||||
| Selling expenses | 2,273,818 | 6,880,994 | 9,761,145 | 18,370,524 | ||||||||||||
| General and administrative expenses | 58,807,987 | 6,826,669 | 107,911,310 | 9,036,397 | ||||||||||||
| Total operating expenses | 61,081,805 | 13,707,663 | 117,672,455 | 27,406,921 | ||||||||||||
| Income from operations | (48,464,371 | ) | 7,449,312 | (83,075,289 | ) | 22,463,919 | ||||||||||
| Other income (expense) | ||||||||||||||||
| Other income (expense) | (18,558 | ) | (101,350 | ) | (122,012 | ) | (327,433 | ) | ||||||||
| Interest income | 53,943 | 55,168 | 160,829 | 278,509 | ||||||||||||
| Interest expense | (76,306 | ) | (145,621 | ) | (241,004 | ) | (457,885 | ) | ||||||||
| Total other income (expense) | (40,921 | ) | (191,803 | ) | (202,187 | ) | (506,809 | ) | ||||||||
| Income before income taxes | (48,505,292 | ) | 7,257,509 | (83,277,476 | ) | 21,957,110 | ||||||||||
| Provision for income taxes | 1,717,017 | 2,139,610 | 1,341,513 | 5,321,671 | ||||||||||||
| Net income | (50,222,309 | ) | 5,117,899 | (84,618,989 | ) | 16,635,439 | ||||||||||
| Other comprehensive income (loss) | ||||||||||||||||
| Foreign currency translation gain (loss) | (6,753,216 | ) | 10,564,053 | (13,789,719 | ) | (5,895,808 | ) | |||||||||
| Comprehensive income (loss) | $ | (56,975,525 | ) | $ | 15,681,952 | (98,408,708 | ) | $ | 10,739,631 | |||||||
| Basic weighted average shares outstanding | 6,143,159 | 3,295,579 | 5,371,420 | 3,263,751 | ||||||||||||
| Basic net earnings per share | $ | (8.18 | ) | $ | 1.55 | (15.75 | ) | $ | 5.10 | |||||||
| Diluted weighted average shares outstanding | 6,143,159 | 3,295,579 | 5,371,420 | 3,263,751 | ||||||||||||
| Diluted net earnings per share | (8.18 | ) | 1.55 | (15.75 | ) | 5.10 | ||||||||||
The accompanying notes are an integral part of these consolidated financial statements.
2
CHINA GREEN AGRICULTURE, INC. AND SUBSIDIARIES
STATEMENTS OF STOCKHOLDERS’ EQUITY
FOR THE NINE MONTHS ENDED MARCH 31, 2020 AND 2019
| Number | Additional | Accumulated Other | Total | |||||||||||||||||||||||||
| Of | Common | Paid In | Statutory | Retained | Comprehensive | Stockholders’ | ||||||||||||||||||||||
| Shares | Stock | Capital | Reserve | Earnings | Income | Equity | ||||||||||||||||||||||
| BALANCE, JUNE 30, 2019 | 3,986,912 | $ | 3,987 | $ | 138,012,445 | 31,237,891 | 247,122,574 | (19,821,211 | ) | 396,555,685 | ||||||||||||||||||
| Net income | (84,618,989 | ) | (84,618,989 | ) | ||||||||||||||||||||||||
| Issuance of stock for consulting services | 931,000 | 931 | 10,251,069 | 10,252,000 | ||||||||||||||||||||||||
| Issuance of stock for convertible notes | 1,372,650 | 1,373 | 6,861,877 | 6,863,250 | ||||||||||||||||||||||||
| Stock based compensation | 59,567 | 60 | 329,940 | 330,000 | ||||||||||||||||||||||||
| Transfer to statutory reserve | (997,299 | ) | 997,299 | - | ||||||||||||||||||||||||
| Other comprehensive income | (13,789,719 | ) | (13,789,719 | ) | ||||||||||||||||||||||||
| BALANCE, MARCH 31, 2020 | 6,350,129 | $ | 6,350 | $ | 155,455,332 | $ | 30,240,593 | $ | 163,500,883 | $ | (33,610,930 | ) | $ | 315,592,228 | ||||||||||||||
| Number | Additional | Accumulated Other | Total | |||||||||||||||||||||||||
| Of | Common | Paid In | Statutory | Retained | Comprehensive | Stockholders’ | ||||||||||||||||||||||
| Shares | Stock | Capital | Reserve | Earnings | Income | Equity | ||||||||||||||||||||||
| BALANCE, JUNE 30, 2018 | 3,241,413 | $ | 3,242 | $ | 129,372,690 | 30,947,344 | 235,822,726 | (3,598,215 | ) | 392,547,786 | ||||||||||||||||||
| Net income | 16,635,439 | 16,635,439 | ||||||||||||||||||||||||||
| Issuance of stock for consulting services | 54,167 | 54 | 30,821 | 30,875 | ||||||||||||||||||||||||
| Stock based compensation | ||||||||||||||||||||||||||||
| 1 for 12 reverse stock split | ||||||||||||||||||||||||||||
| Transfer to statutory reserve | 248,672 | (248,672 | ) | |||||||||||||||||||||||||
| Other comprehensive income | (5,895,808 | ) | (5,895,808 | ) | ||||||||||||||||||||||||
| BALANCE, MARCH 31, 2019 | 3,295,580 | $ | 3,296 | $ | 129,403,511 | $ | 31,196,016 | $ | 252,209,492 | $ | (9,494,023 | ) | $ | 403,318,292 | ||||||||||||||
The accompanying notes are an integral part of these consolidated financial statements.
3
CHINA GREEN AGRICULTURE, INC. AND SUBSIDIARIES
CONSOLIDATED STATEMENTS OF CASH FLOWS
(UNAUDITED)
| Nine Months Ended March 31, | ||||||||
| 2020 | 2019 | |||||||
| Cash flows from operating activities | ||||||||
| Net income | $ | (84,618,989 | ) | $ | 16,635,439 | |||
| Adjustments to reconcile net income to net cash provided by operating activities | ||||||||
| Depreciation and amortization | 3,543,104 | 3,671,827 | ||||||
| Gain (Loss) on disposal of property, plant and equipment | 33,923 | 4,524 | ||||||
| Provision for losses on accounts receivable | 76,346,104 | 488,806 | ||||||
| Amortization of debt discount | 41,814 | 308,815 | ||||||
| Issuance of common stock for consulting services fee | 0 | 370,500 | ||||||
| Change in fair value of derivative liability | (17,782 | ) | (62,539 | ) | ||||
| Changes in operating assets | ||||||||
| Accounts receivable | (103,436,382 | ) | 16,893,932 | |||||
| Amount due from related parties | - | 228,635 | ||||||
| Other current assets | (681,319 | ) | (408,198 | ) | ||||
| Inventories | 95,744,236 | (78,208,217 | ) | |||||
| Advances to suppliers | (30,473,093 | ) | (26,287,635 | ) | ||||
| Other assets | 1,414,043 | (481,965 | ) | |||||
| Changes in operating liabilities | ||||||||
| Accounts payable | 1,906,246 | (17,053,253 | ) | |||||
| Customer deposits | 1,414,707 | 627,242 | ||||||
| Tax payables | (663,905 | ) | 3,183,956 | |||||
| Accrued expenses and other payables | 744,750 | 1,045,892 | ||||||
| Interest payable | 25,659 | 207,758 | ||||||
| Net cash provided by (used in) operating activities | (38,676,884 | ) | (77,964,267 | ) | ||||
| Cash flows from investing activities | ||||||||
| Purchase of plant, property, and equipment | (66,210 | ) | (59,096 | ) | ||||
| Change in construction in process | - | 16,216 | ||||||
| Net cash provided by (used in) investing activities | (66,210 | ) | (42,880 | ) | ||||
| Cash flows from financing activities | ||||||||
| Proceeds from the sale of common stock | 10,252,000 | - | ||||||
| Proceeds from loans | 282,200 | - | ||||||
| Advance from related party | 600,000 | 409,230 | ||||||
| Repayment of loans | - | (190,536 | ) | |||||
| Net cash provided by (used in) financing activities | 11,134,200 | 218,694 | ||||||
| Effect of exchange rate change on cash and cash equivalents | (3,339,772 | ) | (3,775,148 | ) | ||||
| Net increase (decrease) in cash and cash equivalents | (30,948,665 | ) | (81,563,601 | ) | ||||
| Cash and cash equivalents, beginning balance | 72,259,804 | 150,805,639 | ||||||
| Cash and cash equivalents, ending balance | $ | 41,311,138 | $ | 69,242,037 | ||||
| Supplement disclosure of cash flow information | ||||||||
| Interest expense paid | $ | 215,195 | $ | 106,307 | ||||
| Income taxes paid | $ | 2,802,117 | $ | 2,137,715 | ||||
The accompanying notes are an integral part of these consolidated financial statements.
4
NOTE 1 – ORGANIZATION AND DESCRIPTION OF BUSINESS
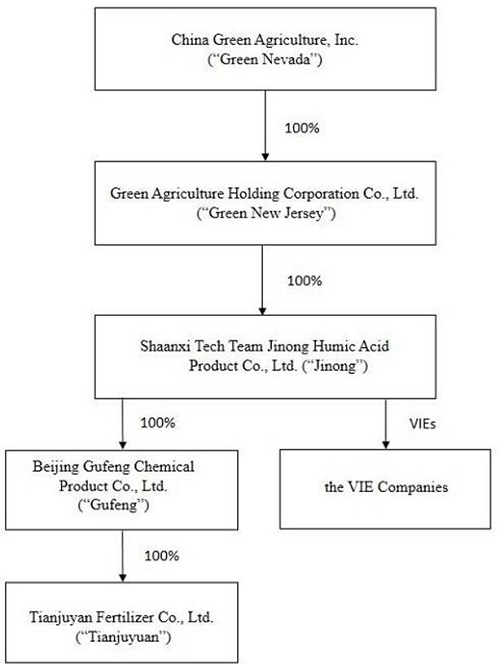
China Green Agriculture, Inc. (the “Company”, “Parent Company” or “Green Nevada”), through its subsidiaries, is engaged in the research, development, production, distribution and sale of humic acid-based compound fertilizer, compound fertilizer, blended fertilizer, organic compound fertilizer, slow-release fertilizers, highly-concentrated water-soluble fertilizers and mixed organic-inorganic compound fertilizer and the development, production and distribution of agricultural products.
Unless the context indicates otherwise, as used in this Report, the following are the references herein of all the subsidiaries of the Company (i) Green Agriculture Holding Corporation (“Green New Jersey”), a wholly-owned subsidiary of Green Nevada, incorporated in the State of New Jersey; (ii) Shaanxi TechTeam Jinong Humic Acid Product Co., Ltd. (“Jinong”), a wholly-owned subsidiary of Green New Jersey organized under the laws of the PRC; (iii) Xi’an Hu County Yuxing Agriculture Technology Development Co., Ltd. (“Yuxing”), a Variable Interest Entity (“VIE”) in the in the People’s Republic of China (the “PRC”) controlled by Jinong through a series of contractual agreements; (iv) Beijing Gufeng Chemical Products Co., Ltd., a wholly-owned subsidiary of Jinong in the PRC (“Gufeng”), and (v) Beijing Tianjuyuan Fertilizer Co., Ltd., Gufeng’s wholly-owned subsidiary in the PRC (“Tianjuyuan”).
On June 30, 2016 the Company, through its wholly-owned subsidiary Jinong, entered into strategic acquisition agreements and a series of contractual agreements with the shareholders of the following six companies that are organized under the laws of the PRC and would be deemed VIEs: Shaanxi Lishijie Agrochemical Co., Ltd. (“Lishijie”), Songyuan Jinyangguang Sannong Service Co., Ltd. (“Jinyangguang”), Shenqiu County Zhenbai Agriculture Co., Ltd. (“Zhenbai”), Weinan City Linwei District Wangtian Agricultural Materials Co., Ltd. (“Wangtian”), Aksu Xindeguo Agricultural Materials Co., Ltd. (“Xindeguo”), and Xinjiang Xinyulei Eco-agriculture Science and Technology co., Ltd. (“Xinyulei”). On January 1, 2017, the Company, through its wholly-owned subsidiary Jinong, entered into strategic acquisition agreements and a series of contractual agreements with the shareholders of the following two companies that are organized under the laws of the PRC and would be deemed VIEs, Sunwu County Xiangrong Agricultural Materials Co., Ltd. (“Xiangrong”), and Anhui Fengnong Seed Co., Ltd. (“Fengnong”).
On November 30, 2017, the Company, through its wholly-owned subsidiary Jinong, discontinued the strategic acquisition agreements and the series of contractual agreements with the shareholders of Zhenbai.
Yuxing, Lishijie, Jinyangguang, Wangtian, Xindeguo, Xinyulei, Xiangrong and Fengnong may also collectively be referred to as the “the VIE Companies”; Lishijie, Jinyangguang, Wangtian, Xindeguo, Xinyulei, Xiangrong and Fengnong may also collectively be referred to as “the sales VIEs” or “the sales VIE companies”.
5
The Company’s corporate structure as of March 31, 2020 is set forth in the diagram below:
6
NOTE 2 – BASIS OF PRESENTATION AND SUMMARY OF SIGNIFICANT ACCOUNTING POLICIES
Principle of consolidation
The accompanying consolidated financial statements include the accounts of the Company and its wholly-owned subsidiaries, Green New Jersey, Jinong, Gufeng, Tianjuyuan, and the VIE Companies. All significant inter-company accounts and transactions have been eliminated in consolidation.
Effective June 16, 2013, Yuxing was converted from being a wholly-owned foreign enterprise 100% owned by Jinong to a domestic enterprise 100% owned one natural person, who is not affiliated to the Company (“Yuxing’s Owner”). Effective the same day, Yuxing’s Owner entered into a series of contractual agreements with Jinong pursuant to which Yuxing became the VIE of Jinong.
VIE assessment
A VIE is an entity (1) that has total equity at risk that is not sufficient to finance its activities without additional subordinated financial support from other entities, (2) where the group of equity holders does not have the power to direct the activities of the entity that most significantly impact the entity’s economic performance, or the obligation to absorb the entity’s expected losses or the right to receive the entity’s expected residual returns, or both, or (3) where the voting rights of some investors are not proportional to their obligations to absorb the expected losses of the entity, their rights to receive the expected residual returns of the entity, or both, and substantially all of the entity’s activities either involve or are conducted on behalf of an investor that has disproportionately few voting rights. In order to determine if an entity is considered a VIE, the Company first performs a qualitative analysis, which requires certain subjective decisions regarding its assessments, including, but not limited to, the design of the entity, the variability that the entity was designed to create and pass along to its interest holders, the rights of the parties, and the purpose of the arrangement. If the Company cannot conclude after a qualitative analysis whether an entity is a VIE, it performs a quantitative analysis. The qualitative analysis considered the design of the entity, the risks that cause variability, the purpose for which the entity was created, and the variability that the entity was designed to pass along to its variable interest holders. When the primary beneficiary could not be identified through a qualitative analysis, we used internal cash flow models to compute and allocate expected losses or expected residual returns to each variable interest holder based upon the relative contractual rights and preferences of each interest holder in the VIE’s capital structure.
Use of estimates
The preparation of consolidated financial statements in conformity with accounting principles generally accepted in the United States of America requires management to make estimates and assumptions that affect the reported amounts of assets and liabilities and disclosure of contingent assets and liabilities at the date of the consolidated financial statements and the amount of revenues and expenses during the reporting periods. Management makes these estimates using the best information available at the time the estimates are made. However, actual results could differ materially from those results.
Cash and cash equivalents and concentration of cash
For statement of cash flows purposes, the Company considers all cash on hand and in banks, certificates of deposit with state owned banks in the Peoples Republic of China (“PRC”) and banks in the United States, and other highly-liquid investments with maturities of three months or less, when purchased, to be cash and cash equivalents. The Company maintains large sums of cash in three major banks in China. The aggregate cash in such accounts and on hand as of March 31, 2020 and June 30, 2019 were $41,220,912 and $72,178,448, respectively. There is no insurance securing these deposits in China. In addition, the Company also had $90,225 and $81,356 in cash in two banks in the United States as of March 31, 2020 and June 30, 2019 respectively. Cash overdraft as of balance sheet date will be reflected as liabilities in the balance sheet. The Company has not experienced any losses in such accounts and believes it is not exposed to any significant risks on its cash in bank accounts.
Accounts receivable
The Company’s policy is to maintain reserves for potential credit losses on accounts receivable. Management regularly reviews the composition of accounts receivable and analyzes customer credit worthiness, current economic trends and changes in customer payment patterns to evaluate the adequacy of these reserves at each year-end. Accounts considered uncollectible are written off through a charge to the valuation allowance. As of March 31, 2020, and June 30, 2019, the Company had accounts receivable of $166,452,189 and $145,190,160, net of allowance for doubtful accounts of $34,494,969 and $33,515,410, respectively. The Company adopts no policy to accept product returns after the sales delivery.
7
Inventories
Inventory is valued at the lower of cost (determined on a weighted average basis) or market. Inventories consist of raw materials, work in process, finished goods and packaging materials. The Company reviews its inventories regularly for possible obsolete goods and establishes reserves when determined necessary. At March 31, 2020 and 2019, the Company had no reserve for obsolete goods.
Intangible Assets
The Company records intangible assets acquired individually or as part of a group at fair value. Intangible assets with definitive lives are amortized over the useful life of the intangible asset, which is the period over which the asset is expected to contribute directly or indirectly to the entity’s future cash flows. The Company evaluates intangible assets for impairment at least annually and more often whenever events or changes in circumstances indicate that the carrying value may not be recoverable. Whenever any such impairment exists, an impairment loss will be recognized for the amount by which the carrying value exceeds the fair value. The Company has not recorded impairment of intangible assets as of March 31, 2020 and 2019 respectively.
Customer deposits
Payments received before all the relevant criteria for revenue recognition are satisfied are recorded as customer deposits. When all revenue recognition criteria are met, the customer deposits are recognized as revenue. As of March 31, 2020, and June 30, 2019, the Company had customer deposits of $7,713,614 and $6,514,619, respectively.
Earnings per share
Basic earnings per share is computed based on the weighted average number of shares of common stock outstanding during the period. Diluted earnings per share is computed based on the weighted average number of shares of common stock plus the effect of dilutive potential common shares outstanding during the period using the treasury stock method. Dilutive potential common shares include outstanding stock options and stock awards.
The components of basic and diluted earnings per share consist of the following:
| Three Months Ended | ||||||||
| March 31, | ||||||||
| 2020 | 2019 | |||||||
| Net Income for Basic Earnings Per Share | $ | (50,222,309 | ) | $ | 5,117,899 | |||
| Basic Weighted Average Number of Shares | 6,143,159 | 3,295,579 | ||||||
| Net Income Per Share – Basic | $ | (8.18 | ) | $ | 1.55 | |||
| Net Income for Diluted Earnings Per Share | $ | (50,222,309 | ) | $ | 5,117,899 | |||
| Diluted Weighted Average Number of Shares | 6,143,159 | 3,295,579 | ||||||
| Net Income Per Share – Diluted | $ | (8.18 | ) | $ | 1.55 | |||
| Nine Months Ended | ||||||||
| March 31, | ||||||||
| 2020 | 2019 | |||||||
| Net Income for Basic Earnings Per Share | $ | (83,277,476 | ) | $ | 16,635,439 | |||
| Basic Weighted Average Number of Shares | 5,371,420 | 3,263,751 | ||||||
| Net Income Per Share – Basic | $ | (15.75 | ) | $ | 5.10 | |||
| Net Income for Diluted Earnings Per Share | $ | (83,277,476 | ) | $ | 16,635,439 | |||
| Diluted Weighted Average Number of Shares | 5,371,420 | 3,263,751 | ||||||
| Net Income Per Share – Diluted | $ | (15.75 | ) | $ | 5.10 | |||
8
Recent accounting pronouncements
Leases: In February 2016, the FASB issued ASU No. 2016-02, Leases (Topic 842) (“ASU 2016-2”), which provides guidance on lease amendments to the FASB Accounting Standard Codification. This ASU will be effective for us beginning in May 1, 2019. We are currently in the process of evaluating the impact of the adoption of ASU 2016-2 on our consolidated financial statements.
Financial Instruments - Credit Losses: In June 2016, the FASB issued ASU 2016-13, Financial Instruments - Credit Losses (Topic 326): The amendments in this Update require a financial asset (or a group of financial assets) measured at amortized cost basis to be presented at the net amount expected to be collected. The amendments broaden the information that an entity must consider in developing its expected credit loss estimate for assets measured either collectively or individually. The use of forecasted information incorporates more timely information in the estimate of expected credit loss, which will be more decision useful to users of the financial statements. ASU 2016-13 is effective for the Company for fiscal years beginning after December 15, 2019, including interim periods within those fiscal years. Early adoption is allowed as of the fiscal years beginning after December 15, 2018, including interim periods within those fiscal years. The Company is still evaluating the effect that this guidance will have on the Company’s consolidated financial statements and related disclosures.
Other recent accounting pronouncements issued by the FASB, including its Emerging Issues Task Force, the American Institute of Certified Public Accountants, and the Securities and Exchange Commission did not or are not believed by management to have a material impact on the Company’s present or future financial statements.
Income Tax: In March 2018, the FASB issued ASU 2018-05 which amends ASC 740, “Income Taxes,” to provide guidance on accounting for the tax effects of the Tax Cuts and Jobs Act enacted on December 22, 2017 (the “Tax Act”) pursuant to Staff Accounting Bulletin No. 118, “Income Tax Accounting Implications of the Tax Cuts and Jobs Act” (“SAB 118”), which provides guidance on accounting for the tax effects of the Tax Act. Under SAB 118, companies are able to record a reasonable estimate of the impact of the Tax Act if one is able to be determined and report it as a provisional amount during the measurement period. The measurement period is not to extend beyond one year from the enactment date.
9
NOTE 3 – INVENTORIES
Inventories consisted of the following:
| March 31, | June 30, | |||||||
| 2020 | 2019 | |||||||
| Raw materials | $ | 12,933,158 | $ | 102,268,620 | ||||
| Supplies and packing materials | $ | 440,790 | $ | 496,138 | ||||
| Work in progress | $ | 373,931 | $ | 390,708 | ||||
| Finished goods | $ | 48,486,803 | $ | 58,858,423 | ||||
| Total | $ | 62,234,682 | $ | 162,013,889 | ||||
NOTE 4 – PROPERTY, PLANT AND EQUIPMENT
Property, plant and equipment consisted of the following:
| March 31, | June 30, | |||||||
| 2020 | 2019 | |||||||
| Building and improvements | $ | 37,692,796 | $ | 38,877,508 | ||||
| Auto | 3,194,958 | 3,391,040 | ||||||
| Machinery and equipment | 17,544,531 | 18,125,539 | ||||||
| Agriculture assets | 0 | 741,044 | ||||||
| Total property, plant and equipment | 58,432,286 | 61,135,130 | ||||||
| Less: accumulated depreciation | (34,836,401 | ) | (34,465,192 | ) | ||||
| Total | $ | 23,595,885 | $ | 26,669,938 | ||||
NOTE 5 – INTANGIBLE ASSETS
Intangible assets consisted of the following:
| March 31, | June 30, | |||||||
| 2020 | 2019 | |||||||
| Land use rights, net | $ | 8,882,568 | $ | 9,341,327 | ||||
| Technology patent, net | 2,169 | 3,004 | ||||||
| Customer relationships, net | 1,197,605 | 2,174,564 | ||||||
| Non-compete agreement | 278,296 | 436,634 | ||||||
| Trademarks | 5,742,771 | 5,925,920 | ||||||
| Total | $ | 16,103,409 | $ | 17,881,449 | ||||
LAND USE RIGHT
On September 25, 2009, Yuxing was granted a land use right for approximately 88 acres (353,000 square meters or 3.8 million square feet) by the People’s Government and Land & Resources Bureau of Hu County, Xi’an, Shaanxi Province. The fair value of the related intangible asset was determined to be the respective cost of RMB73, 184,895 (or $10,326,389). The intangible asset is being amortized over the grant period of 50 years using the straight-line method.
On August 13, 2003, Tianjuyuan was granted a certificate of Land Use Right for a parcel of land of approximately 11 acres (42,726 square meters or 459,898 square feet) at Ping Gu District, Beijing. The purchase cost was recorded at RMB1,045,950 (or $147,584). The intangible asset is being amortized over the grant period of 50 years.
On August 16, 2001, Jinong received a land use right as a contribution from a shareholder, which was granted by the People’s Government and Land & Resources Bureau of Yangling District, Shaanxi Province. The fair value of the related intangible asset at the time of the contribution was determined to be RMB7,285,099 (or $1,027,927). The intangible asset is being amortized over the grant period of 50 years.
10
The Land Use Rights consisted of the following:
| March 31, | June 30, | |||||||
| 2020 | 2019 | |||||||
| Land use rights | $ | 11,501,900 | 11,868,721 | |||||
| Less: accumulated amortization | (2,619,331 | ) | (2,527,394 | ) | ||||
| Total land use rights, net | $ | 8,882,568 | 9,341,327 | |||||
TECHNOLOGY PATENT
On August 16, 2001, Jinong was issued a technology patent related to a proprietary formula used in the production of humic acid. The fair value of the related intangible asset was determined to be the respective cost of RMB 5,875,068 (or $828,972) and is being amortized over the patent period of 10 years using the straight-line method. This technology patent has been fully amortized.
On July 2, 2010, the Company acquired Gufeng and its wholly-owned subsidiary Tianjuyuan. The fair value of the acquired technology patent was estimated to be RMB9,200,000 (or $1,298,120) and is amortized over the remaining useful life of six years using the straight-line method. As of June 30, 2019, this technology patent is fully amortized.
The technology know-how consisted of the following:
| March 31, | June 30, | |||||||
| 2020 | 2019 | |||||||
| Technology know-how | $ | 2,131,275 | $ | 2,199,247 | ||||
| Less: accumulated amortization | (2,129,106 | ) | (2,196,243 | ) | ||||
| Total technology know-how, net | $ | 2,169 | $ | 3,004 | ||||
CUSTOMER RELATIONSHIPS
On July 2, 2010, the Company acquired Gufeng and its wholly-owned subsidiary Tianjuyuan. The fair value of the acquired customer relationships was estimated to be RMB65,000,000 (or $9,171,500) and is amortized over the remaining useful life of ten years. On June 30, 2016 and January 1, 2017, the Company acquired the sales VIE Companies. The fair value of the acquired customer relationships was estimated to be RMB16,472,179 (or $2,324,224) and is amortized over the remaining useful life of seven to ten years.
| March 31, | June 30, | |||||||
| 2020 | 2019 | |||||||
| Customer relationships | $ | 11,249,847 | $ | 11,608,629 | ||||
| Less: accumulated amortization | (10,052,242 | ) | (9,434,065 | ) | ||||
| Total customer relationships, net | $ | 1,197,605 | $ | 2,174,564 | ||||
NON-COMPETE AGREEMENT
On July 2, 2010, the Company acquired Gufeng and its wholly-owned subsidiary Tianjuyuan. The fair value of the acquired non-compete agreement was estimated to be RMB1,320,000 (or $186,252) and is amortized over the remaining useful life of five years using the straight line method. On June 30, 2016 and January 1, 2017, the Company acquired the sales VIE Companies. The fair value of the acquired non-compete agreements was estimated to be RMB6, 150,683 (or $867,861) and is amortized over the remaining useful life of five years using the straight line method.
| March 31, | June 30, | |||||||
| 2020 | 2019 | |||||||
| Non-compete agreement | $ | 1,151,861 | $ | 1,188,597 | ||||
| Less: accumulated amortization | (873,565) | (751,963 | ) | |||||
| Total non-compete agreement, net | $ | 278,296 | $ | 436,634 | ||||
TRADEMARKS
On July 2, 2010, the Company acquired Gufeng and its wholly-owned subsidiary Tianjuyuan. The preliminary fair value of the acquired trademarks was estimated to be RMB40,700,000 (or $5,742,770) and is subject to an annual impairment test.
11
AMORTIZATION EXPENSE
Estimated amortization expenses of intangible assets for the next five twelve months periods ended March 31, are as follows:
| Twelve Months Ended on March 31, | Expense ($) | |||
| 2021 | 1,039,582 | |||
| 2022 | 646,908 | |||
| 2023 | 547,709 | |||
| 2024 | 436,703 | |||
| 2025 | 339,859 | |||
NOTE 6 – OTHER NON-CURRENT ASSETS
Other non-current assets mainly include advance payments related to leasing land for use by the Company. As of March 31, 2020, the balance of other non-current assets was $13,282,157, which was the lease fee advances for agriculture lands that the Company engaged in Shiquan County from 2020 to 2027.
In March 2017, Jinong entered into a lease agreement for approximately 3,400 mu, and 2600 hectare agriculture lands in Shiquan County, Shaanxi Province. The lease was from April 2017 and was renewable for every ten-year period up to 2066. The aggregate leasing fee was approximately RMB 13 million per annum, The Company had made 10-year advances of leasing fee per lease terms. The Company has amortized $1.4 million as expenses for the Nine Months ended March 31, 2020.
Estimated amortization expenses of the lease advance payments for the next four twelve-month periods ended March 31 and thereafter are as follows:
| Twelve months ending March 31, | ||||
| 2021 | $ | 1,894,268 | ||
| 2022 | $ | 1,894,268 | ||
| 2023 | $ | 1,894,268 | ||
| 2024 | $ | 1,894,268 | ||
| 2025 and thereafter | $ | 5,705,087 | ||
NOTE 7 – ACCRUED EXPENSES AND OTHER PAYABLES
Accrued expenses and other payables consisted of the following:
| March 31, | June 30, | |||||||
| 2020 | 2019 | |||||||
| Payroll payable | $ | 23,369 | $ | 24,891 | ||||
| Welfare payable | 144,859 | 149,479 | ||||||
| Accrued expenses | 7,346,774 | 6,847,041 | ||||||
| Other payables | 4,653,786 | 4,886,202 | ||||||
| Other levy payable | 118,336 | 122,109 | ||||||
| Total | $ | 12,287,124 | $ | 12,029,722 | ||||
NOTE 8 – AMOUNT DUE TO RELATED PARTIES
At the end of December 2015, Yuxing entered into a sales agreement with the Company’s affiliate, 900LH.com Food Co., Ltd. (“900LH.com”, previously announced as Xi’an Gem Grain Co., Ltd) pursuant to which Yuxing is to supply various vegetables to 900LH.com for its incoming seasonal sales at the holidays and year ends (the “Sales Agreement”). The contingent contracted value of the Sales Agreement is RMB 25,500,000 (approximately $3,598,050). For the Nine Months Ended March 31, 2020 and 2019, Yuxing has sold approximately $294,983 and $300,210 products to 900LH.com.
As of March 31, 2020, and June 30, 2019, the amount due to related parties was $4,209,526 and $3,641,945, respectively. As of March 31, 2020, and June 30, 2019, $987,700 and $1,019,200, respectively were amounts that Gufeng borrowed from a related party, Xi’an Techteam Science & Technology Industry (Group) Co. Ltd., a company controlled by Mr. Zhuoyu Li, Chairman and CEO of the Company, representing unsecured, non-interest-bearing loans that are due on demand. These loans are not subject to written agreements.
As of March 31, 2020, and June 30, 2019, the Company’s subsidiary, Jinong, owed 900LH.com $11,785 and $400,225, respectively.
On July 1, 2018, Jinong signed an office lease with Kingtone Information Technology Co., Ltd. (“Kingtone Information”), of which Mr. Zhuoyu Li, Chairman and CEO of the Company, served as Chairman. Pursuant to the lease, Jinong rented 612 square meters (approximately 6,588 square feet) of office space from Kingtone Information. The lease provides for a two-year term effective as of July 1, 2018 with monthly rent of RMB24,480 (approximately $3,454).
12
NOTE 9 – LOAN PAYABLES
As of March 31, 2020, the short-term loan payables consisted of three loans which mature on dates ranging from June 2, 2020 through June 27, 2020 with interest rates ranging from 5.22% to 6.31%. All loans are collateralized by Tianjuyuan’s land use right and building ownership right.
| No. | Payee | Loan period per agreement | Interest Rate | March 31, 2018 | ||||||||
| 1 | Postal Saving Bank of China - Pinggu Branch | June 3, 2019-June 2, 2020 | 6.31 | % | 2,822,000 | |||||||
| 2 | Beijing Bank - Pinggu Branch | June 28, 2019-June 27, 2020 | 5.22 | % | 705,500 | |||||||
| 3 | Beijing Bank - Pinggu Branch | August 14, 2019-June 27, 2020 | 5.22 | % | 282,200 | |||||||
| Total | $ | 3,809,700 | ||||||||||
The interest expense from short-term loans was $215,241 and $250,127 for the Nine Months ended March 31, 2020 and 2019 respectively.
NOTE 10 – CONVERTIBLE NOTES PAYABLE
Relating to the acquisition of the VIE Companies, the Company subsidiary, Jinong, issued to the VIE Companies shareholders convertible notes payable twice, in the aggregate notional amount of RMB 51,000,000 ($7,196,100) with a term of three years and an annual interest rate of 3%.
| No. | Related Acquisitions of Sales VIEs | Issuance Date | Maturity Date | Notional Interest Rate | Conversion Price | Notional Amount (in RMB) | ||||||||||||
| 1 | Wangtian, Lishijie, Xindeguo, Xinyulei, Jinyangguang | June 30, 2016 | June 30, 2019 | 3 | % | $ | 5.00 | 39,000,000 | ||||||||||
| 2 | Fengnong, Xiangrong | January 1, 2017 | December 31, 2019 | 3 | % | $ | 5.00 | 12,000,000 | ||||||||||
The convertible notes take priority over the preferred stock and common stock of Jinong, and any other class or series of capital stocks Jinong issues in the future in terms of interests and payments in the event of any liquidation, dissolution or winding up of Jinong. On or after the third anniversary of the issuance date of the note, noteholders may request Jinong to process the note conversion to convert the note into shares of the Company’s common stock. The notes cannot be converted prior to the mature date. The per share conversion price of the notes is the higher of the following: (i) $5.00 per share or (ii) 75% of the closing price of the Company’s common stock on the date the noteholder delivers the conversion notice. Due to the discontinuation of VIE agreements with Zhenbai’s shareholders, certain convertible notes issued on June 30, 2016 with a face amount of RMB 12,000,000 ($1,693,200) were tendered back to the Company. All outstanding balance of unpaid principal and accrued interest in the tendered convertible notes were forfeited.
On November 15, 2019, the Company issued 995,000 shares of common stock at the price of $5.00 per share for the total amount of $4,975,000 to the holders of the Company’s convertible notes payable in connection with the payment of the convertible notes’ principal and interests. The convertible notes were issued on June 30, 2016 and matured on June 30, 2019.
On February 14, 2020, the Company issued 377,650 shares of common stock at the price of $5.00 per share for the total amount of $1,888,250 to the holders of the Company’s convertible notes payable in connection with the payment of the convertible notes’ principal and interests. The convertible notes were issued on January 1, 2017 and matured on January 1, 2020.
The Company determined that the fair value of the convertible notes payable was RMB 0 ($0) and RMB 51,629,859 ($7,284,973) as of March 31, 2020 and June 30, 2019, respectively. Aside from the forfeiture of the convertible notes previously issued to Zhenbai’s shareholders and the matured convertible notes on June, 2019, the difference between the fair value of the notes and the face amount of the notes is being amortized to accretion implied interest expense over the three-year life of the notes. As of March 31, 2020, the accumulated amortization of this discount into accretion expenses was $1,375,606.
13
NOTE 11 – TAXES PAYABLE
Enterprise Income Tax
Effective January 1, 2008, the Enterprise Income Tax (“EIT”) law of the PRC replaced the tax laws for Domestic Enterprises (“DEs”) and Foreign Invested Enterprises (“FIEs”). The EIT rate of 25% replaced the 33% rate that was applicable to both DEs and FIEs. The two-year tax exemption and three-year 50% tax reduction tax holiday for production-oriented FIEs was eliminated. Since January 1, 2008, Jinong became subject to income tax in China at a rate of 15% as a high-tech company, because of the expiration of its tax exemption on March 31, 2007. Accordingly, it made provision for income taxes for the six-month period ended March 31, 2020 and 2019 of $0 and $1,007,503, respectively. Gufeng is subject to a 25% EIT rate and thus it made provision for income taxes of $0 and $2,768,465 for the Nine Months ended March 31, 2020 and 2019, respectively.
Value-Added Tax
All of the Company’s fertilizer products that are produced and sold in the PRC were subject to a Chinese Value-Added Tax (VAT) of 13% of the gross sales price. On April 29, 2008, the PRC State of Administration of Taxation (SAT) released Notice #56, “Exemption of VAT for Organic Fertilizer Products”, which allows certain fertilizer products to be exempt from VAT beginning June 1, 2008. The Company submitted the application for exemption in May 2009, which was granted effective September 1, 2009, continuing through March 31, 2015. On August 10, 2015 and August 28, 2015, the SAT released Notice #90. “Reinstatement of VAT for Fertilizer Products”, and Notice #97, “Supplementary Reinstatement of VAT for Fertilizer Products”, which restore the VAT of 13% of the gross sales price on certain fertilizer products includes non-organic fertilizer products starting from September 1, 2015, but granted taxpayers a reduced rate of 3% from September 1, 2015 through June 30, 2016.
On April 28, 2017, the PRC State of Administration of Taxation (SAT) released Notice 2017 #37, “Notice on Policy of Reduced Value Added Tax Rate,” under which, effective July 1, 2017, all of the Company’s fertilizer products that are produced and sold in the PRC are subject to a Chinese Value-Added Tax (VAT) of 11% of the gross sales price. The tax rate was reduced 2% from 13%.
On April 4, 2018, the PRC State of Administration of Taxation (SAT) released Notice 2018 #32, “Notice on Adjustment of VAT Tax Rate,” under which, effective May 1, 2018, all of the Company’s fertilizer products that are produced and sold in the PRC are subject to a Chinese Value-Added Tax (VAT) of 10% of the gross sales price. The tax rate was reduced 1% from 11%.
On March 20, 2019, the PRC State of Administration of Taxation (SAT) released Notice 2019 #39, “Announcement on Policies Concerning Deepening the Reform of Value Added Tax,” under which, effective April 1, 2019, all of the Company’s fertilizer products that are produced and sold in the PRC are subject to a Chinese Value-Added Tax (VAT) of 9% of the gross sales price. The tax rate was reduced 1% from 10%.
Income Taxes and Related Payables
| March 31, | June 30, | |||||||
| 2020 | 2019 | |||||||
| VAT provision | $ | (279,835 | ) | $ | (424,535 | ) | ||
| Income tax payable | 700,574 | 1,550,830 | ||||||
| Other levies | 1,196,711 | 1,220,859 | ||||||
| Total | $ | 1,617,450 | $ | 2,347,154 | ||||
The provision for income taxes consists of the following
| March 31, | June 30, | |||||||
| 2020 | 2019 | |||||||
| Current tax - foreign | $ | 1,341,513 | $ | 1,654,416 | ||||
| Deferred tax | - | - | ||||||
| Total | $ | 1,341,513 | $ | 1,654,416 | ||||
14
Tax Rate Reconciliation
Our effective tax rates were approximately -1.6% and 24.2% for the Nine Months ended March 31, 2020 and 2019, respectively. Substantially all of the Company’s income before income taxes and related tax expense are from PRC sources. Actual income tax benefit reported in the consolidated statements of income and comprehensive income differ from the amounts computed by applying the US statutory income tax rate of 21% to income before income taxes for the three months Ended March 31, 2020 and 2019 for the following reasons:
March 31, 2020
| China 15% - 25% | United States 21% | Total | ||||||||||||||||||||||
| Pretax income (loss) | $ | (82,037,196 | ) | (1,240,280 | ) | $ | (83,277,476 | ) | ||||||||||||||||
| Expected income tax expense (benefit) | (20,509,299 | ) | 25.0 | % | (260,459 | ) | 21.0 | % | (20,769,758 | ) | ||||||||||||||
| High-tech income benefits on Jinong | 2,561,450 | (3.1 | )% | - | - | 2,561,450 | ||||||||||||||||||
| Losses from subsidiaries in which no benefit is recognized | 19,289,362 | (23.5 | )% | - | - | 19,289,362 | ||||||||||||||||||
| Change in valuation allowance on deferred tax asset from US tax benefit | - | 260,459 | (21.0 | )% | 260,459 | |||||||||||||||||||
| Actual tax expense | $ | 1,341,513 | (1.6 | )% | $ | - | - | % | $ | 1,341,513 | (1.6 | )% | ||||||||||||
| March 31, 2019 | ||||||||||||||||||||||||
| China | United States | |||||||||||||||||||||||
| 15% - 25% | 34% | Total | ||||||||||||||||||||||
| Pretax income (loss) | $ | 23,320,275 | - | (1,363,166 | ) | - | $ | 21,957,109 | ||||||||||||||||
| Expected income tax expense (benefit) | 5,830,069 | 25.0 | % | (286,265 | ) | 21.0 | % | 5,543,804 | ||||||||||||||||
| High-tech income benefits on Jinong | (671,669 | ) | (2.9 | )% | - | (671,669 | ) | |||||||||||||||||
| Losses from subsidiaries in which no benefit is recognized | 163,271 | 0.7 | % | - | 163,271 | |||||||||||||||||||
| Change in valuation allowance on deferred tax asset from US tax benefit | - | - | 286,265 | (21.0 | )% | 286,265 | ||||||||||||||||||
| Actual tax expense | $ | 5,321,671 | 22.8 | % | $ | - | - | % | $ | 5,321,671 | 24.2 | % | ||||||||||||
NOTE 12 – STOCKHOLDERS’ EQUITY
Common Stock
On November 15, 2019, the Company issued 995,000 shares of common stock at the price of $5.00 per share for the total amount of $4,975,000 to the holders of the Company’s convertible notes payable in connection with the payment of the convertible notes’ principal and interests. The convertible notes were issued on June 30, 2016 and matured on June 30, 2019.
On February 14, 2020, the Company issued 377,650 shares of common stock at the price of $5.00 per share to the holders of the Company’s convertible notes payable in connection with the payment of the convertible notes’ principal and interests. The convertible notes were issued on January 1, 2017 and matured on January 1, 2020.
As of March 31, 2020, and June 30, 2019, there were 6,350,129 and 3,986,912 shares of common stock issued and outstanding, respectively.
15
Preferred Stock
Under the Company’s Articles of Incorporation, the Board has the authority, without further action by stockholders, to designate up to 20,000,000 shares of preferred stock in one or more series and to fix the rights, preferences, privileges, qualifications and restrictions granted to or imposed upon the preferred stock, including dividend rights, conversion rights, voting rights, rights and terms of redemption, liquidation preference and sinking fund terms, any or all of which may be greater than the rights of the common stock.
As of March 31, 2020, the Company has 20,000,000 shares of preferred stock authorized, with a par value of $.001 per share, of which no shares are issued or outstanding.
NOTE 13 – CONCENTRATIONS AND LITIGATION
Market Concentration
All the Company’s revenue-generating operations are conducted in the PRC. Accordingly, the Company’s business, financial condition and results of operations may be influenced by the political, economic and legal environments in the PRC, and by the general state of the PRC’s economy.
The Company’s operations in the PRC are subject to specific considerations and significant risks not typically associated with companies in North America and Western Europe. These include risks associated with, among other things, the political, economic and legal environment and foreign currency exchange. The Company’s results may be adversely affected by, among other things, changes in governmental policies with respect to laws and regulations, anti-inflationary measures, currency conversion and remittance abroad, and rates and methods of taxation.
Vendor and Customer Concentration
None of the vendors accounted over 10% of the Company’s purchase of raw materials and supplies for the nine months ended March 31, 2020.
There were three vendors, from which the Company purchased 14.2%, 13.7% and 11.8% of its raw materials for fertilizer manufacturing during the year ended March 31, 2019. Total purchase from these three vendors was amounted to $58,658,521 as March 31, 2019.
There were two customers, from which the Company sold 10.6% and 10.4% of its products during the year ended March 31, 2020. Total sales from these two customers was amounted to $33,957,707 as March 31, 2020.
No customer accounted for over 10% of the Company’s sales for the Nine Months Ended March 31, 2019.
Litigation
On October 9, 2019, a lawsuit was filed against the Company and certain of our officers in the United States District Court for the District of Nevada (the “Nevada Federal Court”) by Plaintiff Glenn Little. The complaint alleges breach of fiduciary duty and shareholder oppression. The Company believes the action is without merit and vigorously opposed it.
On December 31, 2019, the lawsuit was dismissed.
NOTE 14 – SEGMENT REPORTING
The Company is organized into four main business segments, based on location and product: Jinong (fertilizer production), Gufeng (fertilizer production), Yuxing (agricultural products production) and the sales VIEs. Each of the four operating segments referenced above has separate and distinct general ledgers. The chief operating decision maker (“CODM”) receives financial information, including revenue, gross margin, operating income and net income produced from the various general ledger systems to make decisions about allocating resources and assessing performance; however, the principal measure of segment profitability or loss used by the CODM is net income by segment.
16
| Three Months Ended | Three Months Ended | Nine Months Ended | Nine Months Ended | |||||||||||||
| 2020 | 2019 | 2020 | 2019 | |||||||||||||
| Revenues from unaffiliated customers: | ||||||||||||||||
| Jinong | $ | 11,266,437 | $ | 22,077,336 | $ | 44,842,738 | $ | 61,561,229 | ||||||||
| Gufeng | 57,094,310 | 67,167,427 | 95,684,076 | 106,996,368 | ||||||||||||
| Yuxing | 2,014,987 | 2,817,942 | 7,016,208 | 7,828,981 | ||||||||||||
| Sales VIEs | 15,450,955 | 16,057,865 | 38,670,247 | 41,943,261 | ||||||||||||
| Consolidated | $ | 85,826,689 | $ | 108,120,570 | $ | 186,213,269 | $ | 218,329,839 | ||||||||
| Operating income: | ||||||||||||||||
| Jinong | $ | (4,567,306 | ) | $ | (2,210,904 | ) | $ | (10,335,081 | ) | $ | 6,888,634 | |||||
| Gufeng | (44,325,347 | ) | 7,111,832 | (77,454,456 | ) | 11,214,341 | ||||||||||
| Yuxing | 5,003 | 125,839 | 300,952 | (3,477,668 | ) | |||||||||||
| Sales VIEs | 812,350 | 2,821,741 | 5,653,582 | 9,201,792 | ||||||||||||
| Reconciling item (1) | - | - | - | - | ||||||||||||
| Reconciling item (2) | (389,072 | ) | (399,196 | ) | (1,240,286 | ) | (1,363,180 | ) | ||||||||
| Consolidated | $ | (48,464,372 | ) | $ | 7,449,312 | $ | (83,075,289 | ) | $ | 22,463,919 | ||||||
| Net income: | ||||||||||||||||
| Jinong | $ | (5,388,358 | ) | $ | (1,980,471 | ) | $ | (10,245,799 | ) | $ | 5,709,185 | |||||
| Gufeng | (44,538,320 | ) | 5,260,432 | (77,733,209 | ) | 8,111,897 | ||||||||||
| Yuxing | 4,204 | 125,259 | 299,702 | (3,478,089 | ) | |||||||||||
| Sales VIEs | 89,265 | 2,111,941 | 4,312,975 | 7,668,280 | ||||||||||||
| Reconciling item (1) | (1 | ) | 4 | 6 | 14 | |||||||||||
| Reconciling item (2) | (389,072 | ) | (399,196 | ) | (1,240,286 | ) | (1,363,180 | ) | ||||||||
| Reconciling item (3) | (28 | ) | (68 | ) | (12,379 | ) | (12,667 | ) | ||||||||
| Consolidated | $ | (50,222,309 | ) | $ | 5,117,901 | $ | (84,618,989 | ) | $ | 16,635,441 | ||||||
| Depreciation and Amortization: | ||||||||||||||||
| Jinong | $ | 190,739 | $ | 199,460 | $ | 572,587 | $ | 592,424 | ||||||||
| Gufeng | 521,051 | 542,033 | 1,557,909 | 1,607,957 | ||||||||||||
| Yuxing | 296,863 | 307,835 | 886,512 | 912,554 | ||||||||||||
| Sales VIEs | 182,658 | 188,309 | 526,096 | 558,892 | ||||||||||||
| Consolidated | $ | 1,172,886 | $ | 1,237,638 | $ | 3,543,104 | $ | 3,671,827 | ||||||||
| Interest expense: | ||||||||||||||||
| Jinong | 59 | 70,000 | 25,659 | 207,758 | ||||||||||||
| Gufeng | 76,248 | 75,621 | 215,241 | 250,127 | ||||||||||||
| Yuxing | - | - | - | - | ||||||||||||
| Sales VIEs | (87,497 | ) | - | (164,594 | ) | - | ||||||||||
| Consolidated | $ | (11,190 | ) | $ | 145,621 | $ | 76,306 | $ | 457,885 | |||||||
| Capital Expenditure: | ||||||||||||||||
| Jinong | $ | 57 | $ | 781 | $ | 25,005 | $ | 4,273 | ||||||||
| Gufeng | 698 | 394 | 698 | 45,998 | ||||||||||||
| Yuxing | 268 | 726 | 25,852 | 8,825 | ||||||||||||
| Sales VIEs | 14,654 | - | 14,654 | - | ||||||||||||
| Consolidated | $ | 15,677 | $ | 1,901 | $ | 66,210 | $ | 59,096 | ||||||||
| As of | ||||||||
| March 31, | June 30, | |||||||
| 2020 | 2019 | |||||||
| Identifiable assets: | ||||||||
| Jinong | $ | 113,770,025 | $ | 149,166,251 | ||||
| Gufeng | 195,938,075 | 253,149,321 | ||||||
| Yuxing | 35,184,546 | 35,900,242 | ||||||
| Sales VIEs | 49,854,815 | 42,269,307 | ||||||
| Reconciling item (1) | 361,138 | 518,158 | ||||||
| Reconciling item (2) | 166,121 | (2,879 | ) | |||||
| Consolidated | $ | 395,274,720 | $ | 481,000,399 | ||||
| (1) | Reconciling amounts refer to the unallocated assets or expenses of Green New Jersey. |
| (2) | Reconciling amounts refer to the unallocated assets or expenses of the Parent Company. |
17
NOTE 15 – COMMITMENTS AND CONTINGENCIES
On July 1, 2018, Jinong signed an office lease with Kingtone Information Technology Co., Ltd. (“Kingtone Information”), of which Mr. Zhuoyu Li, Chairman and CEO of the Company, served as Chairman. Pursuant to the lease, Jinong rented 612 square meters (approximately 6,588 square feet) of office space from Kingtone Information. The lease provides for a two-year term effective as of July 1, 2018 with monthly rent of RMB24,480 (approximately $3,490).
In February 2004, Tianjuyuan signed a fifty-year lease with the village committee of Dong Gao Village and Zhen Nan Zhang Dai Village in the Beijing Ping Gu District, at a monthly rent of RMB 2,958(approximately $422).
Accordingly, the Company recorded an aggregate of $35,201 and $36,794 as rent expenses from these committed property leases for the nine-month periods ended March 31, 2020 and 2019, respectively. The contingent rent expenses herein for the next five twelve-month periods ended March 31, are as follows:
| Years ending March 31, | ||||
| 2021 | $ | 46,935 | ||
| 2022 | 46,935 | |||
| 2023 | 46,935 | |||
| 2024 | 46,935 | |||
| 2025 | 46,935 | |||
NOTE 16 – VARIABLE INTEREST ENTITIES
In accordance with accounting standards regarding consolidation of variable interest entities, VIEs are generally entities that lack sufficient equity to finance their activities without additional financial support from other parties or whose equity holders lack adequate decision making ability. All VIEs with which a company is involved must be evaluated to determine the primary beneficiary of the risks and rewards of the VIE. The primary beneficiary is required to consolidate the VIE for financial reporting purposes.
Green Nevada through one of its subsidiaries, Jinong, entered into a series of agreements (the “VIE Agreements”) with Yuxing for it to qualify as a VIE, effective June 16, 2013.
The Company has concluded, based on the contractual arrangements, that Yuxing is a VIE and that the Company’s wholly-owned subsidiary, Jinong, absorbs a majority of the risk of loss from the activities of Yuxing, thereby enabling the Company, through Jinong, to receive a majority of Yuxing expected residual returns.
On June 30, 2016 and January 1, 2017, the Company, through its wholly-owned subsidiary Jinong, entered into strategic acquisition agreements and also into a series of contractual agreements to qualify as VIEs with the shareholders of the sales VIE Companies.
Jinong, the sales VIE Companies, and the shareholders of the sales VIE Companies also entered into a series of contractual agreements for the sales VIE Companies to qualify as VIEs (the “VIE Agreements”).
18
On November 30, 2017, the Company, through its wholly-owned subsidiary Jinong, exited the VIE agreements with the shareholders of Zhenbai.
As a result of these contractual arrangements, with Yuxing and the sales VIE Companies the Company is entitled to substantially all of the economic benefits of Yuxing and the VIE Companies. The following financial statement amounts and balances of the VIEs were included in the accompanying consolidated financial statements as of March 31, 2020 and June 30, 2019:
| March 31, | June 30, | |||||||
| 2020 | 2019 | |||||||
| ASSETS | ||||||||
| Current Assets | ||||||||
| Cash and cash equivalents | $ | 1,122,822 | $ | 818,312 | ||||
| Accounts receivable, net | 35,209,724 | 29,933,837 | ||||||
| Inventories | 26,070,040 | 19,944,011 | ||||||
| Other current assets | 625,112 | 475,001 | ||||||
| Related party receivable | 0 | (1,031 | ) | |||||
| Advances to suppliers | 576,795 | 3,606,384 | ||||||
| Total Current Assets | 63,604,493 | 54,776,514 | ||||||
| Plant, Property and Equipment, Net | 8,738,807 | 9,753,039 | ||||||
| Other assets | 59,406 | 218,549 | ||||||
| Intangible Assets, Net | 9,527,049 | 10,212,668 | ||||||
| Goodwill | 3,109,606 | 3,208,779 | ||||||
| Total Assets | $ | 85,039,361 | $ | 78,169,549 | ||||
| LIABILITIES AND STOCKHOLDERS’ EQUITY | ||||||||
| Current Liabilities | ||||||||
| Accounts payable | 18,770,058 | 17,250,276 | ||||||
| Customer deposits | 588,733 | 256,489 | ||||||
| Accrued expenses and other payables | 7,692,853 | 6,243,753 | ||||||
| Amount due to related parties | 42,045,369 | 42,680,723 | ||||||
| Total Current Liabilities | $ | 69,097,013 | $ | 66,431,241 | ||||
| Long-term Loan | - | - | ||||||
| Total Liabilities | $ | 69,097,013 | $ | 66,431,241 | ||||
| Stockholders’ equity | 15,942,348 | 11,738,308 | ||||||
| Total Liabilities and Stockholders’ Equity | 85,039,361 | $ | 78,169,549 | |||||
| Three Months Ended March 31, | ||||||||
| 2020 | 2019 | |||||||
| Revenue | $ | 17,465,942 | $ | 18,875,808 | ||||
| Expenses | 17,372,472 | 16,638,610 | ||||||
| Net income | $ | 93,470 | $ | 2,237,198 | ||||
| Nine Months Ended March 31, |
||||||||
| 2020 | 2019 | |||||||
| Revenue | $ | 45,686,455 | $ | 49,772,242 | ||||
| Expenses | 41,073,778 | 45,582,052 | ||||||
| Net income | $ | 4,612,677 | $ | 4,190,190 | ||||
19
NOTE 17 – BUSINESS COMBINATIONS
On June 30, 2016, the Company, through its wholly-owned subsidiary Jinong, entered into strategic acquisition agreements and also into a series of contractual agreements to qualify as VIEs with the shareholders of Shaanxi Lishijie Agrochemical Co., Ltd., Songyuan Jinyangguang Sannong Service Co., Ltd., Shenqiu County Zhenbai Agriculture Co., Ltd., Weinan City Linwei District Wangtian Agricultural Materials Co., Ltd., Aksu Xindeguo Agricultural Materials Co., Ltd., and Xinjiang Xinyulei Eco-agriculture Science and Technology Co., Ltd.
Subsequently, on January 1, 2017, Jinong entered into similar strategic acquisition agreements and a series of contractual agreements to qualify as VIEs with the shareholders of Sunwu County Xiangrong Agricultural Materials Co., Ltd., and Anhui Fengnong Seed Co., Ltd.
On November 30, 2017, the Company, through its wholly-owned subsidiary Jinong, discontinued the strategic acquisition agreements and the series of contractual agreements with the shareholders of Zhenbai.
The VIE Agreements are as follows:
Entrusted Management Agreements
Pursuant to the terms of certain Entrusted Management Agreements dated June 30, 2016 and January 1, 2017, between Jinong and the shareholders of the sales VIE Companies (the “Entrusted Management Agreements”), the sales VIE Companies and their shareholders agreed to entrust the operations and management of its business to Jinong. According to the Entrusted Management Agreement, Jinong possesses the full and exclusive right to manage the sales VIE Companies’ operations, assets and personnel, has the right to control all the sales VIE Companies’ cash flows through an entrusted bank account, is entitled to the sales VIE Companies’ net profits as a management fee, is obligated to pay all the sales VIE Companies’ payables and loan payments, and bears all losses of the sales VIE Companies. The Entrusted Management Agreements will remain in effect until (i) the parties mutually agree to terminate the agreement; (ii) the dissolution of the sales VIE Companies; or (iii) Jinong acquires all the assets or equity of the sales VIE Companies (as more fully described below under “Exclusive Option Agreements”).
Exclusive Technology Supply Agreements
Pursuant to the terms of certain Exclusive Technology Supply Agreements dated June 30, 2016 and January 1, 2017, between Jinong and the sales VIE companies (the “Exclusive Technology Supply Agreements”), Jinong is the exclusive technology provider to the sales VIE companies. The sales VIE companies agreed to pay Jinong all fees payable for technology supply prior to making any payments under the Entrusted Management Agreement. The Exclusive Technology Supply Agreements shall remain in effect until (i) the parties mutually agree to terminate the agreement; (ii) the dissolution of the sales VIE companies; or (iii) Jinong acquires the sales VIE companies (as more fully described below under “Exclusive Option Agreements”).
Shareholder’s Voting Proxy Agreements
Pursuant to the terms of certain Shareholder’s Voting Proxy Agreements dated June 30, 2016 and January 1, 2017, among Jinong and the shareholders of the sales VIE companies (the “Shareholder’s Voting Proxy Agreements”), the shareholders of the sales VIE companies irrevocably appointed Jinong as their proxy to exercise on such shareholders’ behalf all of their voting rights as shareholders pursuant to PRC law and the Articles of Association of the sales VIE companies, including the appointment and election of directors of the sales VIE companies. Jinong agreed that it shall maintain a board of directors, the composition and appointment of which shall be approved by the Board of the Company. The Shareholder’s Voting Proxy Agreements will remain in effect until Jinong acquires all the assets or equity of the sales VIE companies.
20
Exclusive Option Agreements
Pursuant to the terms of certain Exclusive Option Agreements dated June 30, 2016 and January 1, 2017, among Jinong, the sales VIE companies, and the shareholders of the sales VIE companies (the “Exclusive Option Agreements”), the shareholders of the sales VIE companies granted Jinong an irrevocable and exclusive purchase option (the “Option”) to acquire the sales VIE companies’ equity interests and/or remaining assets, but only to the extent that the acquisition does not violate limitations imposed by PRC law on such transactions. The Option is exercisable at any time at Jinong’s discretion so long as such exercise and subsequent acquisition of the sales VIE companies does not violate PRC law. The consideration for the exercise of the Option is to be determined by the parties and memorialized in the future by definitive agreements setting forth the kind and value of such consideration. Jinong may transfer all rights and obligations under the Exclusive Option Agreements to any third parties without the approval of the shareholders of the sales VIE companies so long as a written notice is provided. The Exclusive Option Agreements may be terminated by mutual agreements or by 30 days written notice by Jinong.
Equity Pledge Agreements
Pursuant to the terms of certain Equity Pledge Agreements dated June 30, 2016 and January 1, 2017, among Jinong and the shareholders of the sales VIE companies (the “Pledge Agreements”), the shareholders of the sales VIE companies pledged all of their equity interests in the sales VIE companies to Jinong, including the proceeds thereof, to guarantee all of Jinong’s rights and benefits under the Entrusted Management Agreements, the Exclusive Technology Supply Agreements, the Shareholder’ Voting Proxy Agreements and the Exclusive Option Agreements. Prior to termination of the Pledge Agreements, the pledged equity interests cannot be transferred without Jinong’s prior written consent. The Pledge Agreements may be terminated only upon the written agreement of the parties.
Non-Compete Agreements
Pursuant to the terms of certain Non-Compete Agreements dated June 30, 2016 and January 1, 2017, among Jinong and the shareholders of the sales VIE companies (the “Non-Compete Agreements”), the shareholders of the sales VIE companies agreed that during the period beginning on the initial date of their services with Jinong, and ending five (5) years after termination of their services with Jinong, without Jinong’s prior written consent, they will not provide services or accept positions including but not limited to partners, directors, shareholders, managers, proxies or consultants, provided by any profit making organizations with businesses that may compete with Jinong. They will not solicit or interfere with any of the Jinong’s customers, or solicit, induce, recruit or encourage any person engaged or employed by Jinong to terminate his or her service or engagement. If the shareholders of the sales VIE companies breach the non-compete obligations contained therein, Jinong is entitled to all loss and damages; if the damages are difficult to determine, remedies bore the shareholders of the sales VIE companies shall be no less than 50% of the salaries and other expenses Jinong provided in the past.
The Company entered into these VIE Agreements as a way for the Company to have more control over the distribution of its products. The transactions are accounted for as business combinations in accordance with ASC 805. A summary of the purchase price allocations at fair value is below:
For acquisitions made on June 30, 2016:
| Cash | $ | 708,737 | ||
| Accounts receivable | 6,422,850 | |||
| Advances to suppliers | 1,803,180 | |||
| Prepaid expenses and other current assets | 807,645 | |||
| Inventories | 7,787,043 | |||
| Machinery and equipment | 140,868 | |||
| Intangible assets | 270,900 | |||
| Other assets | 3,404,741 | |||
| Goodwill | 3,158,179 | |||
| Accounts payable | (3,962,670 | ) | ||
| Customer deposits | (3,486,150 | ) | ||
| Accrued expenses and other payables | (4,653,324 | ) | ||
| Taxes payable | (16,912 | ) | ||
| Purchase price | $ | 12,385,087 |
21
A summary of the purchase consideration paid is below:
| Cash | $ | 5,568,500 | ||
| Convertible notes | 6,671,769 | |||
| Derivative liability | 144,818 | |||
| $ | 12,385,087 |
The cash component of the purchase price for these acquisitions made on June 30, 2016 was paid in July and August 2016.
For acquisitions made on January 1, 2017:
| Working Capital | $ | 941,192 | ||
| Machinery and equipment | 222,875 | |||
| Intangible assets | 1440 | |||
| Goodwill | 684,400 | |||
| Customer Relationship | 522,028 | |||
| Non-compete Agreement | 392,852 | |||
| Purchase price | $ | 2,764,787 |
A summary of the purchase consideration paid is below:
| Cash | $ | 1,201,888 | ||
| Convertible notes | 1,559,350 | |||
| Derivative liability | 3,549 | |||
| $ | 2,764,787 |
The cash component of the purchase price for these acquisitions made on January 1, 2017 was paid during March 2017.
On November 30, 2017, the Company, through its wholly-owned subsidiary Jinong, discontinued the strategic acquisition agreements and the series of contractual agreements with the shareholders of Zhenbai. In return, the shareholders of Zhenbai agreed to tender the whole payment consideration in the SAA back to the Company with early termination penalties. The convertible notes paid to Zhenbai’s shareholders and the accrued interest has been forfeited.
For the discontinuation of Zhenbai made on November 30, 2017, the Company gave up the control of the following assets in Zhenbai:
| Working Capital | $ | 1,179,352 | ||
| Intangible assets | 896,559 | |||
| Customer Relationship | 684,727 | |||
| Non-compete Agreement | 211,833 | |||
| Goodwill | 538,488 | |||
| Total Asset | $ | 2,614,401 |
In return, the purchase consideration returned to the Company from Zhenbai’s shareholders is summarized below:
| Cash | $ | 461,330 | ||
| Interest Payable | 83,039 | |||
| Convertible notes | 1,724,683 | |||
| Derivative liability | 13,353 | |||
| Total Payback | $ | 2,282,406 | ||
| Net Loss | (331,995 | ) |
22
NOTE 18 – OTHER EVENTS
In December 2019, a novel strain of coronavirus was reported to have surfaced in Wuhan, China, which was continuing to spread throughout China and other parts of the world, including the United States. On January 30, 2020, the World Health Organization declared the outbreak of the coronavirus disease (COVID-19) a “Public Health Emergency of International Concern,” and on March 11, 2020, the World Health Organization characterized the outbreak as a “pandemic”. The epidemic has resulted in quarantines, travel restrictions, and the temporary closure of office buildings and facilities in China and in the U.S.
Xi’an City, where our headquarters are located, is one of the most affected areas in China. The Company has been following the orders of local government and health authorities to minimize exposure risk for its employees, including the closures of its offices and having employees work remotely from January of 2020 until March of 2020. An occurrence of an uncontrollable event such as the COVID-19 pandemic may negatively affect our operations and financial results.
Substantially all of our revenues are generated in China. Consequently, our results of operations were adversely and materially affected by COVID-19. Any potential impact to our results will depend on, to a large extent, future developments and new information that may emerge regarding the duration and severity of COVID-19 and the actions taken by government authorities and other entities to contain COVID-19 or treat its impact, almost all of which are beyond our control. Potential impacts include, but are not limited to, the following:
| ● | temporary closure of offices, travel restrictions or suspension of transportation of our products to our customers and our suppliers have been negatively affected, and could continue to be negatively affected, on their ability to supply our demands; |
| ● | our customers that are negatively impacted by the outbreak of COVID-19 may reduce their budgets to purchase our products and services, which may materially adversely impact our revenue; |
| ● | we may have to provide significant sales incentives to our customers in response to the outbreak, which may in turn materially adversely affect our financial condition and operating results; |
| ● | the business operations of our customers and suppliers have been and could continue to be negatively impacted by the outbreak, result in loss of customers or disruption of our services, which may in turn materially adversely affect our financial condition and operating results; |
| ● | any disruption of our supply chain, logistics providers or customers could adversely impact our business and results of operations, including causing our suppliers to cease manufacturing products for a period of time or materially delay delivery to customers, which may also lead to loss of customers, as well as reputational, competitive and business harm to us; |
| ● | many of our customers, distributors, suppliers and other partners are individuals and small and medium-sized enterprises (SMEs), which may not have strong cash flows or be well capitalized, and may be vulnerable to an epidemic outbreak and slowing macroeconomic conditions. If the SMEs that we work with cannot weather COVID-19 and the resulting economic impact, or cannot resume business as usual after a prolonged outbreak, our revenues and business operations may be materially and adversely impacted; |
| ● | the global stock markets have experienced, and may continue to experience, significant decline from the COVID-19 outbreak, which could materially adversely affect our stock price; |
Because of the uncertainty surrounding the COVID-19 outbreak, the financial impact related to the outbreak of and response to the coronavirus cannot be reasonably estimated at this time, but our results for the third quarter and full fiscal year of 2020 may be adversely affected.
In general, our business could be adversely affected by the effects of epidemics, including, but not limited to, COVID-19, avian influenza, severe acute respiratory syndrome (SARS), the influenza A virus, the Ebola virus, or other outbreaks. In response to an epidemic or other outbreaks, government and other organizations may adopt regulations and policies that could lead to severe disruption to our daily operations, including temporary closure of our offices and other facilities. These severe conditions may cause us and/or our partners to make internal adjustments, including but not limited to, temporarily closing down business, limiting business hours, and setting restrictions on travel and/or visits with clients and partners for a prolonged period of time. Various impacts arising from severe conditions may cause business disruption, resulting in material, adverse effects to our financial condition and results of operations.
We are taking significant measures to mitigate the financial and operational impacts of COVID-19 as well as additional actions to improve our liquidity through cost reduction and conservation measures.
23
Item 2. Management’s Discussion and Analysis of Financial Condition and Results of Operations
The following discussion and analysis of our financial condition and results of operations should be read in conjunction with our consolidated financial statements and the notes to those financial statements appearing elsewhere in this report. This discussion and analysis contain forward-looking statements that involve significant risks and uncertainties. As a result of many factors, such as the slow-down of the macro-economic environment in China and its impact on economic growth in general, the competition in the fertilizer industry and the impact of such competition on pricing, revenues and margins, the weather conditions in the areas where our customers are based, the cost of attracting and retaining highly skilled personnel, the prospects for future acquisitions, and the factors set forth elsewhere in this report, our actual results may differ materially from those anticipated in these forward-looking statements. In light of these risks and uncertainties, there can be no assurance that the forward-looking statements contained in this report will in fact occur. You should not place undue reliance on the forward-looking statements contained in this report.
The forward-looking statements speak only as of the date on which they are made, and, except to the extent required by U.S. federal securities laws, we undertake no obligation to update any forward-looking statement to reflect events or circumstances after the date on which the statement is made or to reflect the occurrence of unanticipated events. Further, the information about our intentions contained in this report is a statement of our intention as of the date of this report and is based upon, among other things, the existing regulatory environment, industry conditions, market conditions and prices, and our assumptions as of such date. We may change our intentions, at any time and without notice, based upon any changes in such factors, in our assumptions or otherwise.
Unless the context indicates otherwise, as used in the notes to the financial statements of the Company, the following are the references herein of all the subsidiaries of the Company (i) Green Agriculture Holding Corporation (“Green New Jersey”), a wholly-owned subsidiary of Green Nevada incorporated in the State of New Jersey; (ii) Shaanxi TechTeam Jinong Humic Acid Product Co., Ltd. (“Jinong”), a wholly-owned subsidiary of Green New Jersey organized under the laws of the PRC; (iii) Xi’an Hu County Yuxing Agriculture Technology Development Co., Ltd. (“Yuxing”), a Variable Interest Entity in the PRC (“VIE”) controlled by Jinong through contractual agreements; (iv) Shaanxi Lishijie Agrochemical Co., Ltd. (“Lishijie”), a VIE controlled by Jinong through contractual agreements; (v) Songyuan Jinyangguang Sannong Service Co., Ltd. (“Jinyangguang”), a VIE in the PRC controlled by Jinong through contractual agreements; (vi) Weinan City Linwei District Wangtian Agricultural Materials Co., Ltd. (“Wangtian”), a VIE controlled by Jinong through contractual agreements; (vii) Aksu Xindeguo Agricultural Materials Co., Ltd. (“Xindeguo”), a VIE controlled by Jinong through contractual agreements; (vii) Xinjiang Xinyulei Eco-agriculture Science and Technology Co., Ltd (“Xinyulei”), a VIE controlled by Jinong through contractual agreements; (ix) Sunwu County Xiangrong Agricultural Materials Co., Ltd. (“Xiangrong”), a VIE controlled by Jinong through contractual agreements; (x) Anhui Fengnong Seed Co., Ltd. (“Fengnong”), a VIE controlled by Jinong through contractual agreements; (xi) Beijing Gufeng Chemical Products Co., Ltd., a wholly-owned subsidiary of Jinong in the PRC (“Gufeng”); and (xii) Beijing Tianjuyuan Fertilizer Co., Ltd., Gufeng’s wholly-owned subsidiary in the PRC (“Tianjuyuan”). Yuxing, Lishijie, Jinyangguang, Wangtian, Xindeguo, Xinyulei, Xiangrong and Fengnong may also collectively be referred to as the “the VIE Companies”; Lishijie, Jinyangguang, Wangtian, Xindeguo, Xinyulei, Xiangrong and Fengnong may also collectively be referred to as “the sales VIEs” or “the sales VIE companies”.
Unless the context otherwise requires, all references to (i) “PRC” and “China” are to the People’s Republic of China; (ii) “U.S. dollar,” “$” and “US$” are to United States dollars; and (iii) “RMB”, “Yuan” and Renminbi are to the currency of the PRC or China.
Overview
We are engaged in research, development, production and sale of various types of fertilizers and agricultural products in the PRC through our wholly-owned Chinese subsidiaries, Jinong and Gufeng (including Gufeng’s subsidiary Tianjuyuan), and our VIE, Yuxing. Our primary business is fertilizer products, specifically humic-acid based compound fertilizer produced by Jinong and compound fertilizer, blended fertilizer, organic compound fertilizer, slow-release fertilizer, highly-concentrated water-soluble fertilizer and mixed organic-inorganic compound fertilizer produced by Gufeng. In addition, through Yuxing, we develop and produce various agricultural products, such as top-grade fruits, vegetables, flowers and colored seedlings. For financial reporting purposes, our operations are organized into three business segments: fertilizer products (Jinong), fertilizer products (Gufeng) and agricultural products production (Yuxing).
The fertilizer business conducted by Jinong and Gufeng generated approximately 79.6% and 82.5% of our total revenues for the Nine Months Ended March 31, 2020 and 2019, respectively. The sales VIEs generated 18.0% and 14.9% of our revenues for the Nine Months Ended March 31, 2020 and 2019, respectively. Yuxing serves as a research and development base for our fertilizer products.
COVID-19 Update
The novel coronavirus (“COVID-19”) spread rapidly across the world in the first quarter of 2020 and was declared a pandemic by the World Health Organization. The government and private sector responses to contain its spread began to significantly affect our operating businesses in February and March and will likely adversely affect nearly all of our operations in the second quarter, although such effects may vary significantly. The duration and extent of the effects over longer terms cannot be reasonably estimated at this time. The risks and uncertainties resulting from the pandemic that may affect our future earnings, cash flows and financial condition include the closure of our various office buildings and facilities and the long-term effect on the demand for our products and services. Accordingly, significant estimates used in the preparation of our financial statements including the evaluations of bad debts expense. More information concerning effects of COVID-19 is included in Note 18.
24
Fertilizer Products
As of March 31, 2020, we had developed and produced a total of 730 different fertilizer products in use, of which 145 were developed and produced by Jinong, 334 by Gufeng, and 251 by the VIE Companies.
Below is a table that shows the metric tons of fertilizer sold by Jinong and Gufeng and the revenue per ton for the periods indicated:
| Three Months Ended | ||||||||||||||||
| March 31, | Change 2019 to 2020 | |||||||||||||||
| 2020 | 2019 | Amount | % | |||||||||||||
| (metric tons) | ||||||||||||||||
| Jinong | 14,350 | 17,014 | (2,664 | ) | (15.7 | )% | ||||||||||
| Gufeng | 167,125 | 190,691 | (23,566 | ) | (12.4 | )% | ||||||||||
| 181,475 | 207,705 | (26,230 | ) | (12.6 | )% | |||||||||||
| Three Months Ended March 31, | ||||||||
| 2020 | 2019 | |||||||
| (revenue per tons) | ||||||||
| Jinong | $ | 793 | $ | 1,324 | ||||
| Gufeng | 341 | 357 | ||||||
| Nine Months Ended | ||||||||||||||||
| March 31, | Change 2019 to 2020 | |||||||||||||||
| 2020 | 2019 | Amount | % | |||||||||||||
| (metric tons) | ||||||||||||||||
| Jinong | 55,059 | 53,008 | 2,051 | 3.9 | % | |||||||||||
| Gufeng | 285,060 | 305,288 | (20,228 | ) | (6.6 | )% | ||||||||||
| 340,118 | 358,296 | (18,178 | ) | (5.1 | )% | |||||||||||
| Nine Months Ended March 31, | ||||||||
| 2020 | 2019 | |||||||
| (revenue per tons) | ||||||||
| Jinong | $ | 817 | $ | 1,209 | ||||
| Gufeng | 332 | 349 | ||||||
For the three months ended March 31, 2020, we sold approximately 181,475 tons of fertilizer products, as compared to 207,705 metric tons for the three months ended March 31, 2019. For the three months ended March 31, 2020, Jinong sold approximately 14,350 metric tons of fertilizer products, a decrease of 2,664 metric tons, or 15.7%, as compared to 17,014 metric tons for the three months ended March 31, 2019. For the three months ended March 31, 2020, Gufeng sold approximately 167,125 metric tons of fertilizer products, a decrease of 23,566 metric tons, or 12.4% as compared to 190,691 metric tons for the three months ended March 31, 2019.
For the Nine Months ended March 31, 2020, we sold approximately 340,118 metric tons of fertilizer products, as compared to 358,296 metric tons for the Nine Months ended March 31, 2019. For the Nine Months ended March 31, 2020, Jinong sold approximately 55,059 metric tons of fertilizer products, an increase of 2,051 metric tons, or 3.9%, as compared to 53,008 metric tons for the Nine Months ended March 31, 2019. For the Nine Months ended March 31, 2020, Gufeng sold approximately 285,060 metric tons of fertilizer products, a decrease of 20,228 metric tons, or 6.6% as compared to 305,288 metric tons for the Nine Months ended March 31, 2019.
25
Our sales of fertilizer products to customers in five provinces within China accounted for approximately 56.7% of our fertilizer revenue for the three months ended March 31, 2020. Specifically, the provinces and their respective percentage contributing to our fertilizer revenues were: Hebei (25.9%), Heilongjiang (10.9%), Inner Mongolia (9.0%), Liaoning (6.8%) and Shaanxi (4.1%).
As of March 31, 2020, we had a total of 1,983 distributors covering 22 provinces, 4 autonomous regions and 4 central government-controlled municipalities in China. Jinong had 1,157 distributors in China. Jinong’s sales are not dependent on any single distributor or any group of distributors. Jinong’s top five distributors accounted for 4.9% of its fertilizer revenues for the three months ended March 31, 2020. Gufeng had 328 distributors, including some large state-owned enterprises. Gufeng’s top five distributors accounted for 81.7% of its revenues for the three months ended March 31, 2020.
Agricultural Products
Through Yuxing, we develop, produce and sell high-quality flowers, green vegetables and fruits to local marketplaces and various horticulture and planting companies. We also use certain of Yuxing’s greenhouse facilities to conduct research and development activities for our fertilizer products. The three PRC provinces and municipalities that accounted for 94.1% of our agricultural products revenue for the three months ended March 31, 2020 were Shaanxi (88.3%), Shanghai (4.3%), and Shenzhen (1.4%).
Recent Developments
New Products
During the three months ended March 31, 2020, Jinong did not launch any new fertilizer product. During the three months ended March 31, 2020, Gufeng did not launch any new fertilizer products but added one new distributor.
Strategic Acquisitions
On June 30, 2016 and January 1, 2017, through Jinong, we entered into (i) Strategic Acquisition Agreements (the “SAA”), and (ii) Agreements for Convertible Notes (the “ACN”), with the shareholders of the companies as identified below (the “Targets”).
26
June 30, 2016:
| Cash | Principal of | |||||||||
| Payment for | Notes for | |||||||||
| Acquisition | Acquisition | |||||||||
| Company Name | Business Scope | (RMB[1]) | (RMB) | |||||||
| Shaanxi Lishijie Agrochemical Co., Ltd. | Sales of pesticides, agricultural chemicals, chemical fertilizers, agricultural materials; Manufacture and sales of mulches. | 10,000,000 | 3,000,000 | |||||||
| Songyuan Jinyangguang Sannong Service Co., Ltd. | Promotion and consulting services regarding agricultural technologies; Retail sales of chemical fertilizers (including compound fertilizers and organic fertilizers); Wholesale and retail sales of pesticides, agricultural machinery and accessories; Collection of agricultural information; Development of saline-alkali soil; Promotion and development of high-efficiency agriculture and related information technology solutions for agriculture, agricultural and biological engineering high technologies; E-commerce; Cultivation of freshwater fish, poultry, fruits, flowers, vegetables, and seeds; Recycling and complex utilization of straw and stalk; Technology transfer and training; Recycling of agricultural materials ; Ecological industry planning. | 8,000,000 | 12,000,000 | |||||||
| Shenqiu County Zhenbai Agriculture Co., Ltd. | Cultivation of crops; Storage, sales, preliminary processing and logistics distribution of agricultural by-products; Promotion and application of agricultural technologies; Purchase and sales of agricultural materials; Electronic commerce. | 3,000,000 | 12,000,000 | |||||||
| Weinan City Linwei District Wangtian Agricultural Materials Co., Ltd. | Promotion and application of new agricultural technologies; Professional prevention of plant diseases and insect pests; Sales of plant protection products, plastic mulches, material, chemical fertilizers, pesticides, agricultural medicines, micronutrient fertilizers, hormones, agricultural machinery and medicines, and gardening tools. | 6,000,000 | 12,000,000 | |||||||
| Aksu Xindeguo Agricultural Materials Co., Ltd. | Wholesale and retail sales of pesticides; Sales of chemical fertilizers, packaged seeds, agricultural mulches, micronutrient fertilizers, compound fertilizers, plant growth regulators, agricultural machineries, and water economizers; Consulting services for agricultural technologies; Purchase and sales of agricultural by- products. | 10,000,000 | 12,000,000 | |||||||
| Xinjiang Xinyulei Eco-agriculture Science and Technology Co., Ltd | Sales of chemical fertilizers, packaged seeds, agricultural mulches, micronutrient fertilizers, organic fertilizers, plant growth regulators, agricultural machineries, and water economizers; Purchase and sales of agricultural by-products; Cultivation of fruits and vegetables; Consulting services and training for agricultural technologies; Storage services; Sales of articles of daily use, food and oil; On-line sales of the above-mentioned products. | |||||||||
| Total | 37,000,000 | 51,000,000 | ||||||||
| (1) | The exchange rate between RMB and U.S. dollars on June 30, 2016 is RMB1=US$0.1508, according to the exchange rate published by Bank of China. |
| (2) | On November 30, 2017, the Company, through its wholly-owned subsidiary Jinong, discontinued the strategic acquisition agreements and the series of contractual agreements with the shareholders of Zhenbai. In return, the shareholders of Zhenbai agreed to tender the whole payment consideration in the SAA back to the Company with early termination penalties. The convertible notes paid to Zhenbai’s shareholders and the accrued interest has been forfeited. |
27
January 1, 2017:
| Cash Payment for | Principal of Notes for | |||||||||
| Acquisition | Acquisition | |||||||||
| Company Name | Business Scope | (RMB[1]) | (RMB) | |||||||
| Sunwu County Xiangrong Agricultural Materials Co., Ltd. | Sales of pesticides, agricultural chemicals, chemical fertilizers, agricultural materials; Manufacture and sales of mulches. | 4,000,000 | 6,000,000 | |||||||
| Anhui Fengnong Seed Co., Ltd. | Wholesale and retail sales of pesticides; Sales of chemical fertilizers, packaged seeds, agricultural mulches, micronutrient fertilizers, compound fertilizers and plant growth regulators | 4,000,000 | 6,000,000 | |||||||
| Total | 8,000,000 | 12,000,000 | ||||||||
| (1) | The exchange rate between RMB and U.S. dollars on January 1, 2017 is RMB1=US$0.144, according to the exchange rate published by Bank of China. |
Pursuant to the SAA and the ACN, the shareholders of the Targets, while retaining possession of the equity interests and continuing to be the legal owners of such interests, agreed to pledge and entrust all of their equity interests, including the proceeds thereof but excluding any claims or encumbrances, and the operations and management of its business to Jinong, in exchange of an aggregate amount of RMB45,000,000 (approximately $6349,500) to be paid by Jinong within three days following the execution of the SAA, ACN and the VIE Agreements, and convertible notes with an aggregate face value of RMB 63,000,000 (approximately $8,889,300) with an annual fixed compound interest rate of 3% and term of three years.
Jinong acquired the Targets using the VIE arrangement based on our need to further develop our business and comply with the regulatory requirements under the PRC laws.
As our business focuses on the production of fertilizer, all our business activities intertwine with those in the agriculture industry in China. Specifically, we deal with compliance, regulation, safety, inspection, and licenses in fertilizer production, farm land use and transfer, growing and distribution of agriculture goods, agriculture basic supplies, seeds, pesticides, and trades of grains. It is an industry in which heavy regulations get implemented and strictly enforced. In addition, E-commerce, which is also under strict government regulation in the PRC, has lately become a sales and distribution channel for agricultural products. Currently, we are developing an online platform to connect the physical distribution network we either own or lease.
Compared with the regulatory environment in other jurisdictions, the regulatory environment in the PRC is unique. For example, the “M&A Rules” purports to require that an offshore special purpose vehicle controlled directly or indirectly by PRC companies or individuals and formed for purposes of overseas listing through acquisition of PRC domestic interests held by such PRC companies or individuals obtain the approval of the China Securities Regulatory Commission (the “CSRC”) prior to the listing and trading of such special purpose vehicle’s securities on an overseas stock exchange. On September 21, 2006, the CSRC published procedures regarding its approval of overseas listings by special purpose vehicles.
For both e-commerce and agriculture industries, PRC regulators limit the investment from foreign entities and set particularly rules for foreign-owned entities to conduct business. We expect these limitations on foreign-owned entities will continue to exist in e-commerce and agriculture industries. The VIE arrangement, however, provides feasibility for obtaining administrative approval process and avoiding industry restrictions that can be imposed on an entity that is a wholly-owned subsidiary of a foreign entity. The VIE agreements reduce uncertainty and the current limitation risk. It is our understanding that the VIE agreements, as well as the control we obtained through VIE arrangement, are valid and enforceable. Such legal structure does not violate the known, published, and current PRC laws. While there are substantial uncertainties regarding the interpretation and application of PRC Laws and future PRC laws and regulations, and there can be no assurance that the PRC authorities will take a view that is not contrary to or otherwise different from our belief and understanding stated above, we believe the substantial difficulty that we experienced previously to conduct business in agriculture as a foreign ownership can be greatly reduced by the VIE arrangement. Further, as an integral part of the VIE arrangement, the underlying equity pledge agreements provide legal protection for the control we obtained. Pursuant to the equity pledge agreements, we have completed the equity pledge processes with the Targets to ensure the complete control of the interests in the Targets. The shareholders of the Targets are not entitled to transfer any shares to a third party under the exclusive option agreements. If necessary, they may transfer shares to our company without consideration.
While the VIE arrangement provides us with the feasibility to conduct our business in the E-Commerce and agriculture industries, validity and enforceability of VIE arrangement is subject to (i) any applicable bankruptcy, insolvency, fraudulent transfer, reorganization, moratorium or similar laws affecting creditors’ rights generally, (ii) possible judicial or administrative actions or any PRC Laws affecting creditors’ rights, (iii) certain equitable, legal or statutory principles affecting the validity and enforceability of contractual rights generally under concepts of public interest, interests of the State, national security, reasonableness, good faith and fair dealing, and applicable statutes of limitation; (iv) any circumstance in connection with formulation, execution or implementation of any legal documents that would be deemed materially mistaken, clearly unconscionable, fraudulent, coercive at the conclusions thereof; and (v) judicial discretion with respect to the availability of indemnifications, remedies or defenses, the calculation of damages, the entitlement to attorney’s fees and other costs, and the waiver of immunity from jurisdiction of any court or from legal process. Validity and enforceability of VIE arrangement is also subject to risk derived from the discretion of any competent PRC legislative, administrative or judicial bodies in exercising their authority in the PRC. As a result, there can no assurance that any of such PRC Laws will not be changed, amended or replaced in the immediate future or in the longer term with or without retrospective effect.
28
Results of Operations
Three Months ended March 31, 2020 Compared to the Three Months ended March 31, 2019.
| 2020 | 2019 | Change $ | Change % | |||||||||||||
| Sales | ||||||||||||||||
| Jinong | 11,266,437 | 22,077,336 | (10,810,899 | ) | -49.0 | % | ||||||||||
| Gufeng | 57,094,310 | 67,167,427 | (10,073,117 | ) | -15.0 | % | ||||||||||
| Yuxing | 2,014,987 | 2,817,942 | (802,955 | ) | -28.5 | % | ||||||||||
| Sales VIEs | 15,450,955 | 16,057,865 | (606,910 | ) | -3.8 | % | ||||||||||
| Net sales | 85,826,689 | 108,120,570 | (22,293,881 | ) | -20.6 | % | ||||||||||
| Cost of goods sold | ||||||||||||||||
| Jinong | 8,193,579 | 11,091,419 | (2,897,840 | ) | -26.1 | % | ||||||||||
| Gufeng | 50,097,056 | 59,475,263 | (9,378,207 | ) | -15.8 | % | ||||||||||
| Yuxing | 1,847,112 | 2,445,246 | (598,134 | ) | -24.5 | % | ||||||||||
| Sales VIEs | 13,071,508 | 13,951,667 | (880,159 | ) | -6.3 | % | ||||||||||
| Cost of goods sold | 73,209,255 | 86,963,595 | (13,754,340 | ) | -15.8 | % | ||||||||||
| Gross profit | 12,617,434 | 21,156,975 | (8,539,541 | ) | -40.4 | % | ||||||||||
| Operating expenses | ||||||||||||||||
| Selling expenses | 2,273,818 | 6,880,994 | (4,607,176 | ) | -67.0 | % | ||||||||||
| General and administrative expenses | 58,807,987 | 6,826,669 | 51,981,318 | 761.4 | % | |||||||||||
| Total operating expenses | 61,081,805 | 13,707,663 | 47,374,142 | 345.6 | % | |||||||||||
| Income from operations | (48,464,371 | ) | 7,449,312 | (55,913,683 | ) | -750.6 | % | |||||||||
| Other income (expense) | ||||||||||||||||
| Other income (expense) | (18,558 | ) | (101,350 | ) | 82,792 | -81.7 | % | |||||||||
| Interest income | 53,943 | 55,168 | (1,225 | ) | -2.2 | % | ||||||||||
| Interest expense | (76,306 | ) | (145,621 | ) | 69,315 | -47.6 | % | |||||||||
| Total other income (expense) | (40,921 | ) | (191,803 | ) | 150,882 | -78.7 | % | |||||||||
| Income before income taxes | (48,505,292 | ) | 7,257,509 | (55,762,801 | ) | -768.3 | % | |||||||||
| Provision for income taxes | 1,717,017 | 2,139,610 | (422,593 | ) | -19.8 | % | ||||||||||
| Net income | (50,222,309 | ) | 5,117,899 | (55,340,208 | ) | -1081.3 | % | |||||||||
| Other comprehensive income (loss) | ||||||||||||||||
| Foreign currency translation gain (loss) | (6,753,216 | ) | 10,564,053 | (17,317,269 | ) | -163.9 | % | |||||||||
| Comprehensive income (loss) | (56,975,525 | ) | 15,681,952 | (72,657,477 | ) | -463.3 | % | |||||||||
29
Net Sales
Total net sales for the three months ended March 31, 2020 were $85,826,689, a decrease of $22,293,881 or 20.6%, from $108,120,570 for the three months ended March 31, 2019. This decrease was principally a result of the negative impact on sales volumes of the COVID-19 pandemic in the first quarter of 2020, especially for Jinong’s and Gufeng’s net sales.
For the three months ended March 31, 2020, Jinong’s net sales decreased $10,810,899, or 49%, to $11,266,437 from $22,077,336 for the three months ended March 31, 2019. This decrease was mainly due to the effects of COVID-19 pandemic in the last three months.
For the three months ended March 31, 2020, Gufeng’s net sales were $57,094,310, a decrease of $10,073,117, or 15.0%, from $67,167,427 for the three months ended March 31, 2019. This decrease was mainly due to the effects of COVID-19 pandemic in the last three months.
For the three months ended March 31, 2020, Yuxing’s net sales were $2,014,987, a decrease of $802,955 or 28.5%, from $2,817,942 for the three months ended March 31, 2019. The decrease was mainly due to the effects of COVID-19 pandemic in the last three months.
For the three months ended March 31, 2020, VIEs’ net sales were $15,450,955, a decrease of $606,910 or 3.8%, from $16,057,865 for the three months ended March 31, 2019. The decrease was mainly due to the effects of COVID-19 pandemic in the last three months.
Cost of Goods Sold
Total cost of goods sold for the three months ended March 31, 2020 was $73,209,255, a decrease of $13,754,340, or 15.8%, from $86,963,595 for the three months ended March 31, 2019. The decrease was mainly due to the decrease in Gufeng’s cost of goods sold which decreased 15.8%, or $9,378,207.
Cost of goods sold by Jinong for the three months ended March 31, 2020 was $8,193,579, a decrease of $2,897,840, or 26.1%, from $11,091,419 for the three months ended March 31, 2019. The decrease in cost of goods was primarily due to the decrease in sale volume during the last three months primarily attributable to COVID-19.
Cost of goods sold by Gufeng for the three months ended March 31, 2020 was $50,097,056, a decrease of $9,378,207, or 15.8%, from $59,475,263 for the three months ended March 31, 2019. This decrease was mainly due to the decrease in Gufeng’s net sales during the last three months primarily attributable to COVID-19.
For three months ended March 31, 2020, cost of goods sold by Yuxing was $1,847,112, a decrease of $598,134, or 24.5%, from $2,445,246 for the three months ended March 31, 2019. This decrease was mainly due to the decrease in Yuxing’s net sales during the last three months primarily attributable to COVID-19.
Gross Profit
Total gross profit for the three months ended March 31, 2020 decreased by $8,539,541, or 40.4%, to $12,617,434, as compared to $21,156,975 for the three months ended March 31, 2019. Gross profit margin was 14.7% and 19.6% for the three Months Ended March 31, 2020 and 2019, respectively.
Gross profit generated by Jinong decreased by $7,913,059, or 72.0%, to $3,072,858 for the three months ended March 31, 2020 from $10,985,917 for the three months ended March 31, 2019. Gross profit margin from Jinong’s sales was approximately 27.3% and 49.8% for the three Months Ended March 31, 2020 and 2019, respectively. The decrease in gross profit margin was mainly due to the lower sales prices.
For the three months ended March 31, 2020, gross profit generated by Gufeng was $6,997,254, a decrease of $694,910, or 9.0%, from $7,692,164 for the three months ended March 31, 2019. Gross profit margin from Gufeng’s sales was approximately 12.3% and 11.5% for the three Months Ended March 31, 2020 and 2019, respectively. The decrease in gross profit was mainly due to the decrease in Gufeng’s net sales during the last three months.
30
For the three months ended March 31, 2020, gross profit generated by Yuxing was $167,875, a decrease of $204,821, or 55% from $372,696 for the three months ended March 31, 2019. The gross profit margin was approximately 8.3% and 13.2% for the three months Ended March 31, 2020 and 2019, respectively. The decrease in gross profit percentage was mainly due to the increase in product costs. The increased production costs were due to manufacturing inefficiencies primarily attributable to COVID-19.
Gross profit generated by VIEs increased by $273,249, or 13.0%, to $2,379,447 for the three months ended March 31, 2020 from $2,106,198 for the three months ended March 31, 2019. Gross profit margin from VIE’s sales was approximately 15.4% and 13.1% for the three months Ended March 31, 2020 and 2019, respectively. The increase in gross profit percentage was mainly due to the decrease in product costs.
Selling Expenses
Our selling expenses consisted primarily of salaries of sales personnel, advertising and promotion expenses, freight-out costs and related compensation. Selling expenses were $2,273,818, or 2.6%, of net sales for the three months ended March 31, 2020, as compared to $6,880,994, or 6.4%, of net sales for the three months ended March 31, 2019, a decrease of $4,607,176, or 67.0%.
The selling expenses of Jinong for the three months ended March 31, 2020 were $1,899,000 or 16.9% of Jinong’s net sales, as compared to selling expenses of $6,480,278, or 29.4% of Jinong’s net sales for the three months ended March 31, 2019.The selling expenses of Yuxing were $11,235 or 0.6% of Yuxing’s net sales for the three months ended March 31, 2020, as compared to $14,779, or 0.5% of Yuxing’s net sales for the three months ended March 31, 2019. The selling expenses of Gufeng were $67,190 or 0.1% of Gufeng’s net sales for the three months ended March 31, 2020, as compared to $46,228, or 0.1% of Gufeng’s net sales for the three months ended March 31, 2019.
Selling Expenses – amortization of deferred assets
Our selling expenses - amortization of our deferred assets were 0 for the three months ended March 31, 2020 and 2019. All of the deferred assets were fully amortized and therefore no amortization was recorded on the fully amortized assets for the three months ended March 31, 2020.
General and Administrative Expenses
General and administrative expenses consisted primarily of related salaries, rental expenses, business development, depreciation and travel expenses incurred by our general and administrative departments and legal and professional expenses including expenses incurred and accrued for certain litigation. General and administrative expenses were $58,807,987, or 68.5% of net sales for the three months ended March 31, 2020, as compared to $6,826,669, or 6.3% of net sales for the three months ended March 31, 2019, an increase of $51,981,318, or 761.4%.
Total Other Expenses
Total other expenses consisted of income from subsidies received from the PRC government, interest income, interest expenses and bank charges. Total other expense for the three months ended March 31, 2020 was $18,558, as compared to $101,350 for the three months ended March 31, 2019, a decrease in expense of $82,792, or 81.7%. The decrease in total other expense mainly resulted from the decrease in accretion expenses.
Income Taxes
Jinong is subject to a preferred tax rate of 15% as a result of its business being classified as a High-Tech project under the PRC Enterprise Income Tax Law (“EIT”) that became effective on January 1, 2008. Jinong incurred income tax expenses of $0 for the three months ended March 31, 2020, as compared to $0 for the three months ended March 31, 2019.
31
Gufeng is subject to a tax rate of 25%, incurred income tax expenses of $0 for the three months ended March 31, 2020, as compared to $1,775,037 for the three months ended March 31, 2019, a decrease of $1,775,037, or 100.0%, which was primarily due to Gufeng’s decreased net income.
Yuxing has no income tax for the three months Ended March 31, 2020 and 2019 as a result of being exempted from paying income tax due to its products fall into the tax exemption list set out in the EIT.
Net Income (loss)
Net income (loss) for the three months ended March 31, 2020 was $(50,222,309), a decrease of $55,340,208, or 1081.3%, compared to $5,117,899 for the three months ended March 31, 2019. Net income as a percentage of total net sales was approximately -58.5% and 4.7% for the three months Ended March 31, 2020 and 2019, respectively.
Nine Months ended March 31, 2020 Compared to the Nine Months ended March 31, 2019.
| 2020 | 2019 | Change $ | Change % | |||||||||||||
| Sales | ||||||||||||||||
| Jinong | 44,842,738 | 61,561,229 | (16,718,491 | ) | -27.2 | % | ||||||||||
| Gufeng | 95,684,076 | 106,996,368 | (11,312,292 | ) | -10.6 | % | ||||||||||
| Yuxing | 7,016,208 | 7,828,981 | (812,773 | ) | -10.4 | % | ||||||||||
| Sales VIEs | 38,670,247 | 41,943,261 | (3,273,014 | ) | -7.8 | % | ||||||||||
| Net sales | 186,213,269 | 218,329,839 | (32,116,570 | ) | -14.7 | % | ||||||||||
| Cost of goods sold | ||||||||||||||||
| Jinong | 28,814,001 | 31,289,473 | (2,475,472 | ) | -7.9 | % | ||||||||||
| Gufeng | 84,307,031 | 94,544,943 | (10,237,912 | ) | -10.8 | % | ||||||||||
| Yuxing | 6,009,429 | 6,658,975 | (649,546 | ) | -9.8 | % | ||||||||||
| Sales VIEs | 32,485,642 | 35,965,608 | (3,479,966 | ) | -9.7 | % | ||||||||||
| Cost of goods sold | 151,616,103 | 168,458,999 | (16,842,896 | ) | -10.0 | % | ||||||||||
| Gross profit | 34,597,166 | 49,870,840 | (15,273,674 | ) | -30.6 | % | ||||||||||
| Operating expenses | ||||||||||||||||
| Selling expenses | 9,761,145 | 18,370,524 | (8,609,379 | ) | -46.9 | % | ||||||||||
| General and administrative expenses | 107,911,310 | 9,036,397 | 98,874,913 | 1094.2 | % | |||||||||||
| Total operating expenses | 117,672,455 | 27,406,921 | 90,265,534 | 329.4 | % | |||||||||||
| Income from operations | (83,075,289 | ) | 22,463,919 | (105,539,208 | ) | -469.8 | % | |||||||||
| Other income (expense) | ||||||||||||||||
| Other income (expense) | (122,012 | ) | (327,433 | ) | 205,421 | -62.7 | % | |||||||||
| Interest income | 160,829 | 278,509 | (117,680 | ) | -42.3 | % | ||||||||||
| Interest expense | (241,004 | ) | (457,885 | ) | 216,881 | -47.4 | % | |||||||||
| Total other income (expense) | (202,187 | ) | (506,809 | ) | 304,622 | -60.1 | % | |||||||||
| Income before income taxes | (83,277,476 | ) | 21,957,110 | (105,234,586 | ) | -479.3 | % | |||||||||
| Provision for income taxes | 1,341,513 | 5,321,671 | (3,980,158 | ) | -74.8 | % | ||||||||||
| Net income | (84,618,989 | ) | 16,635,439 | (101,254,428 | ) | -608.7 | % | |||||||||
| Other comprehensive income (loss) | ||||||||||||||||
| Foreign currency translation gain (loss) | (13,789,719 | ) | (5,895,808 | ) | (7,893,911 | ) | 133.9 | % | ||||||||
| Comprehensive income (loss) | (98,408,708 | ) | 10,739,631 | (109,148,339 | ) | -1016.3 | % | |||||||||
32
Net Sales
Total net sales for the Nine Months ended March 31, 2020 were $186,213,269 a decrease of $32,116,570 or 14.7%, from $218,329,839 for the Nine Months ended March 31, 2019. This decrease was principally a result of the negative impact on sales volumes of the COVID-19 pandemic in the first quarter of 2020, especially for Jinong’s and Gufeng’s net sales.
For the Nine Months ended March 31, 2020, Jinong’s net sales decreased $16,718,491, or 27.2%, to $44,842,738 from $61,561,229 for the Nine Months ended March 31, 2019. This decrease was mainly due to the effects of COVID-19 pandemic in the last three months.
For the Nine Months ended March 31, 2020, Gufeng’s net sales were $95,684,076, a decrease of $11,312,292, or 10.6%, from $106,996,368 for the Nine Months ended March 31, 2019. This decrease was mainly due to the effects of COVID-19 pandemic in the last three months.
For the Nine Months ended March 31, 2020, Yuxing’s net sales were $7,016,208, a decrease of $812,773 or 10.4%, from $7,828,981 for the Nine Months ended March 31, 2019. This decrease was mainly due to the effects of COVID-19 pandemic in the last three months.
For the Nine Months ended March 31, 2020, VIEs’ net sales were $38,670,247, a decrease of $3,273,014, or 7.8%, from $41,943,261 for the Nine Months ended March 31, 2019. This decrease was mainly due to the effects of COVID-19 pandemic in the last three months.
Cost of Goods Sold
Total cost of goods sold for the Nine Months ended March 31, 2020 was $151,616,103, a decrease of $16,842,896, or 10.0%, from $168,458,999 for the Nine Months ended March 31, 2019. The decrease was mainly due to the decrease in Gufeng’s and VIEs’ cost of goods sold which decreased 10.8% and 9.7% respectively.
Cost of goods sold by Jinong for the Nine Months ended March 31, 2020 was $28,814,001, a decrease of $2,475,472, or 7.9%, from $31,289,473 for the Nine Months ended March 31, 2019. The decrease in cost of goods was primarily due to the decrease in sales volume during the last Nine Months primarily attributable to COVID-19.
Cost of goods sold by Gufeng for the Nine Months ended March 31, 2020 was $84,307,031, a decrease of $10,237,912, or 10.8%, from $94,544,943 for the Nine Months ended March 31, 2019. This decrease was primarily due to the 10.6% decrease in net sale during the last Nine Months primarily attributable to COVID-19.
For Nine Months ended March 31, 2020, cost of goods sold by Yuxing was $6,009,429, a decrease of $649,546, or 9.8%, from $6,658,975 for the Nine Months ended March 31, 2019. This decrease was mainly due to the decrease in Yuxing’s net sales during the last Nine Months primarily attributable to COVID-19.
For Nine Months ended March 31, 2020, cost of goods sold by VIEs was $32,485,642, a decrease of $3,479,966, or 9.7%, from $35,965,608 for the Nine Months ended March 31, 2019. This decrease was mainly due to the decrease in VIEs’ net sales during the last Nine Months primarily attributable to COVID-19.
Gross Profit
Total gross profit for the Nine Months ended March 31, 2020 decreased by $15,273,674, or 30.6%, to $34,597,166, as compared to $49,870,840 for the Nine Months ended March 31, 2019. Gross profit margin was 18.6% and 22.8% for the Nine Months Ended March 31, 2020 and 2019, respectively.
Gross profit generated by Jinong decreased by $14,243,019, or 47.1%, to $16,028,737 for the Nine Months ended March 31, 2020 from $30,271,756 for the Nine Months ended March 31, 2019. Gross profit margin from Jinong’s sales was approximately 35.7% and 49.2% for the Nine Months Ended March 31, 2020 and 2019, respectively. The decrease in gross profit margin was mainly due to the lower sales prices.
For the Nine Months ended March 31, 2020, gross profit generated by Gufeng was $11,377,045, a decrease of $1,074,380, or 8.6%, from $12,451,425 for the Nine Months ended March 31, 2019. Gross profit margin from Gufeng’s sales was approximately 11.9% and 11.6% for the Nine Months Ended March 31, 2020 and 2019, respectively. The decrease in gross profit was mainly due to the decrease in net sales.
33
For the Nine Months ended March 31, 2020, gross profit generated by Yuxing was $1,006,779, a decrease of $163,227, or 14.0% from $1,170,006 for the Nine Months ended March 31, 2019. The gross profit margin was approximately 14.3% and 14.9% for the Nine Months Ended March 31, 2020 and 2019, respectively. The decrease in gross profit percentage was mainly due to the increase in product costs.
Gross profit generated by VIEs increased by $206,952, or 3.5%, to $6,184,605 for the Nine Months ended March 31, 2020 from $5,977,653 for the Nine Months ended March 31, 2019. Gross profit margin from VIE’s sales was approximately 16.0% and 14.3% for the Nine Months Ended March 31, 2020 and 2019, respectively. The increase in gross profit percentage was mainly due to the decrease in product costs.
Selling Expenses
Our selling expenses consisted primarily of salaries of sales personnel, advertising and promotion expenses, freight-out costs and related compensation. Selling expenses were $9,761,145, or 5.2%, of net sales for the Nine Months ended March 31, 2020, as compared to $18,370,524, or 8.4%, of net sales for the Nine Months ended March 31, 2019, a decrease of $8,609,379 or 46.9%.
The selling expenses of Jinong for the Nine Months ended March 31, 2020 were $8,726,383 or 19.5% of Jinong’s net sales, as compared to selling expenses of $16,538,328, or 26.9% of Jinong’s net sales for the Nine Months ended March 31, 2019. The selling expenses of Yuxing were $29,459 or 0.4% of Yuxing’s net sales for the Nine Months ended March 31, 2020, as compared to $42,952 or 0.5% of Yuxing’s net sales for the Nine Months ended March 31, 2019. The selling expenses of Gufeng were $217,074 or 0.2% of Gufeng’s net sales for the Nine Months ended March 31, 2020, as compared to $331,949 or 0.3% of Gufeng’s net sales for the Nine Months ended March 31, 2019.
Selling Expenses – amortization of deferred assets
Our selling expenses - amortization of our deferred assets were 0 for the Nine Months ended March 31, 2020 and 2019. All of the deferred assets were fully amortized and therefore no amortization was recorded on the fully amortized assets for the Nine Months ended March 31, 2020.
General and Administrative Expenses
General and administrative expenses consisted primarily of related salaries, rental expenses, business development, depreciation and travel expenses incurred by our general and administrative departments and legal and professional expenses including expenses incurred and accrued for certain litigation. General and administrative expenses were $107,911,310, or 58.0% of net sales for the Nine Months ended March 31, 2020, as compared to $9,036,397, or 4.1% of net sales for the Nine Months ended March 31, 2019, an increase of $98,874,913, or 1094.2%.
Total Other Expenses
Total other expenses consisted of income from subsidies received from the PRC government, interest income, interest expenses and bank charges. Total other expense for the Nine Months ended March 31, 2020 was $122,012, as compared to $327,433 for the Nine Months ended March 31, 2019, a decrease in expense of $205,421, or 62.7%. The decrease in total other expense resulted from the decrease in accretion expenses.
Income Taxes
Jinong is subject to a preferred tax rate of 15% as a result of its business being classified as a High-Tech project under the PRC Enterprise Income Tax Law (“EIT”) that became effective on January 1, 2008. Jinong incurred income tax expenses of $0 for the Nine Months ended March 31, 2020, as compared to $ 1,007,503 for the Nine Months ended March 31, 2019, a decrease of 1,007,503, or 100.0%.
Gufeng is subject to a tax rate of 25%, incurred income tax expenses of $0 for the Nine Months ended March 31, 2020, as compared to $2,768,465 for the Nine Months ended March 31, 2019, a decrease of $2,768,465, or 100.0%, which was primarily due to Gufeng’s decreased net income.
Yuxing has no income tax for the Nine Months Ended March 31, 2020 and 2019 as a result of being exempted from paying income tax due to its products fall into the tax exemption list set out in the EIT.
Net Income (loss)
Net income (loss) for the Nine Months ended March 31, 2020 was $(84,618,989), a decrease of $101,254,428, or 608.7%, compared to $16,635,439 for the Nine Months ended March 31, 2019. Net income as a percentage of total net sales was approximately -45.4% and 7.6% for the Nine Months Ended March 31, 2020 and 2019, respectively.
Discussion of Segment Profitability Measures
As of March 31, 2020, we were engaged in the following businesses: the production and sale of fertilizers through Jinong and Gufeng, the production and sale of high-quality agricultural products by Yuxing, and the sales of agriculture materials by the sales VIEs. For financial reporting purpose, our operations were organized into four main business segments based on locations and products: Jinong (fertilizer production), Gufeng (fertilizer production) and Yuxing (agricultural products production) and the sales VIEs. Each of the segments has its own annual budget about development, production and sales.
34
Each of the four operating segments referenced above has separate and distinct general ledgers. The chief operating decision maker (“CODM”) makes decisions with respect to resources allocation and performance assessment upon receiving financial information, including revenue, gross margin, operating income and net income produced from the various general ledger systems; however, net income by segment is the principal benchmark to measure profit or loss adopted by the CODM.
For Jinong, the net income decreased by $15,954,984, or 279.5%, to $(10,245,799) for Nine Months ended March 31, 2020, from $5,709,185 for the Nine Months ended March 31, 2019. The decrease was principally due to the increase in general and administrative expense.
For Gufeng, the net income decreased by $85,845,106, or 1058.3%, to $(77,733,209) for Nine Months ended March 31, 2020 from $8,111,897 for Nine Months ended March 31, 2019. The decrease was principally due to the increase in general and administrative expense.
For Yuxing, the net income decreased $3,178,387, or 91.4%, to $299,702 for Nine Months ended March 31, 2020 from $3,478,089 for Nine Months ended March 31, 2019. The decrease was mainly due to the increase in general and administrative expense.
For the sales VIEs, the net income was $4,312,973 for period ended March 31, 2020, decreased by $3,355,307, or 43.8%, from $7,668,280 for Nine Months ended March 31, 2019. The decrease was mainly due to the increase in general and administrative expenses for the sales VIEs.
Liquidity and Capital Resources
Our principal sources of liquidity include cash from operations, borrowings from local commercial banks and net proceeds of offerings of our securities.
As of March 31, 2020, cash and cash equivalents were $41,311,137, a decrease of $30,948,666, or 42.8%, from $72,259,804 as of June 30, 2019.
We intend to use some of the remaining net proceeds from our securities offerings, as well as other working capital if required, to acquire new businesses, upgrade production lines and complete Yuxing’s new greenhouse facilities for agriculture products located on 88 acres of land in Hu County, 18 kilometers southeast of Xi’an city. Yuxing purchased a set of agricultural products testing equipment for the year of 2016. We believe that we have sufficient cash on hand and positive projected cash flow from operations to support our business growth for the next twelve months to the extent we do not have further significant acquisitions or expansions. However, if events or circumstances occur and we do not meet our operating plan as expected, we may be required to seek additional capital and/or to reduce certain discretionary spending, which could have a material adverse effect on our ability to achieve our business objectives. Notwithstanding the foregoing, we may seek additional financing as necessary for expansion purposes and when we believe market conditions are most advantageous, which may include additional debt and/or equity financings. There can be no assurance that any additional financing will be available on acceptable terms, if at all. Any equity financing may result in dilution to existing stockholders and any debt financing may include restrictive covenants.
The following table sets forth a summary of our cash flows for the periods indicated:
| Nine Months Ended | ||||||||
| March 31, | ||||||||
| 2020 | 2019 | |||||||
| Net cash provided by (used in) operating activities | (38,676,884 | ) | (77,964,267 | ) | ||||
| Net cash provided by (used in) investing activities | (66,210 | ) | (42,880 | ) | ||||
| Net cash provided by (used in) financing activities | 11,134,200 | 218,694 | ||||||
| Effect of exchange rate change on cash and cash equivalents | (3,339,772 | ) | (3,775,148 | ) | ||||
| Net increase (decrease) in cash and cash equivalents | (30,948,665 | ) | (81,563,601 | ) | ||||
| Cash and cash equivalents, beginning balance | 72,259,804 | 150,805,639 | ||||||
| Cash and cash equivalents, ending balance | $ | 41,311,138 | $ | 69,242,037 | ||||
Operating Activities
Net cash used in operating activities was $38,676,884 for the Nine Months ended March 31, 2020, a decrease of $39,287,383, or 50.4%, from cash provided by operating activities of $77,964,267 for the Nine Months ended March 31, 2019. The decrease was mainly due to decrease in inventories during the Nine Months ended March 31, 2020 as compared to the same period in 2019.
35
Investing Activities
Net cash used in investing activities for the Nine Months ended March 31, 2020 was $66,210, compared to cash used in investing activities of $42,880 for the Nine Months ended March 31, 2019. The difference was due to the company had less change in construction in process during the last Nine Months compared to the same period last year.
Financing Activities
Net cash provided by financing activities for the Nine Months ended March 31, 2020 was $11,134,200, compared to $218,694 net cash used in financing activities for the Nine Months ended March 31, 2019, which was largely attribute to $10,252,000 proceeds from the sale of common stock for the Nine Months ended March 31, 2020, compared to 0 in the same period last year.
As of March 31, 2020, and June 30, 2019, our loans payable was as follows:
| March 31, | June 30, | |||||||
| 2020 | 2019 | |||||||
| Short term loans payable: | $ | 3,809,700 | $ | 3,640,000 | ||||
| Total | $ | 3,809,700 | $ | 3,640,000 | ||||
Accounts Receivable
We had accounts receivable of $166,452,189 as of March 31, 2020, as compared to $145,190,160 as of June 30, 2019, an increase of $21,262,029, or 14.6%. The increase was primarily attributable to Gufeng’s accounts receivable. As of March 31, 2020, Gufeng’s accounts receivable was $101,718,824, an increase of $16,286,661, or 19.1%, compared to $85,432,163 as of June 30, 2019.
Allowance for doubtful accounts in accounts receivable as of March 31, 2020 was $34,494,969, an increase of $979,559, or 2.9%, from $33,515,410 as of June 30, 2019. The increase in allowance for doubtful accounts was primarily related to COVID-19. And the allowance for doubtful accounts as a percentage of accounts receivable was 17.2% as of March 31, 2020 and 18.8% as of June 30, 2019.
Deferred assets
We had no deferred assets as of March 31, 2020 and June 30, 2019. During the Nine Months, we assisted the distributors in certain marketing efforts and developing standard stores to expand our competitive advantage and market shares. Based on the distributor agreements, the amount owed by the distributors in certain marketing efforts and store development will be expensed over three years if the distributors are actively selling our products. If a distributor defaults, breaches, or terminates the agreement with us earlier than the contractual terms, the unamortized portion of the amount owed by the distributor is payable to us immediately. The deferred assets had been fully amortized as of March 31, 2020.
Inventories
We had inventories of $62,234,682 as of March 31, 2020, as compared to $162,013,889 as of June 30, 2019, a decrease of $99,779,207, or 61.6%. The decrease was primarily attributable to Gufeng’s inventory. As of March 31, 2020, Gufeng’s inventory was $35,385,274, compared to $141,210,160 as of June 30, 2019, a decrease of $105,824,886, or 74.9%.
Advances to Suppliers
We had advances to suppliers of $62,935,130 as of March 31, 2020 as compared to $32,713,817 as of June 30, 2019, representing an increase of $30,221,313, or 92.4%. Our inventory level may fluctuate from time to time, depending how quickly the raw material is consumed and replenished during the production process, and how soon the finished goods are sold. The replenishment of raw material relies on management’s estimate of numerous factors, including but not limited to, the raw materials future price, and spot price along with its volatility, as well as the seasonal demand and future price of finished fertilizer products. Such estimate may not be accurate, and the purchase decision of raw materials based on the estimate can cause excessive inventories in times of slow sales and insufficient inventories in peak times.
36
Accounts Payable
We had accounts payable of $20,310,699 as of March 31, 2020 as compared to $19,004,548 as of June 30, 2019, representing an increase of $1,306,151, or 6.9%. The increase was primarily due to the increase of accounts payable for VIEs. They have accounts payable of $18,669,353 as of March 31, 2020 as compared to $17,073,229 as of June 30, 2019, representing an increase of $1,596,124, or 9.3%.
Unearned Revenue (Customer Deposits)
We had customer deposits of $7,713,614 as of March 31, 2020 as compared to $6,514,619 as of June 30, 2019, representing an increase of $1,198,995, or 18.4%. The increase was mainly attributable to Gufeng’s $5,668,824 unearned revenue as of March 31, 2020, compared to $4,668,972 unearned revenue as of June 30, 2019, increased $999,852, or 21.4%, caused by the advance deposits made by clients. This increase was due to seasonal fluctuation and we expect to deliver products to our customers during the next three months at which time we will recognize the revenue.
Off-Balance Sheet Arrangements
We do not have any off-balance sheet arrangements.
Critical Accounting Policies and Estimates
Management’s discussion and analysis of its financial condition and results of operations are based upon our consolidated financial statements, which have been prepared in accordance with United States generally accepted accounting principles. Our financial statements reflect the selection and application of accounting policies which require management to make significant estimates and judgments. See Note 2 to our consolidated financial statements, “Basis of Presentation and Summary of Significant Accounting Policies.” We believe that the following paragraphs reflect the most critical accounting policies that currently affect our financial condition and results of operations:
Use of estimates
The preparation of consolidated financial statements in conformity with accounting principles generally accepted in the United States of America requires management to make estimates and assumptions that affect the reported amounts of assets and liabilities and disclosure of contingent assets and liabilities at the date of the consolidated financial statements and the amount of revenues and expenses during the reporting periods. Management makes these estimates using the best information available at the time the estimates are made. However, actual results could differ materially from those estimates due to the risks and uncertainties, including uncertainty in the current economic environment due to the recent outbreak of novel strain of the coronavirus (“COVID-19”).
Revenue recognition
Sales revenue is recognized at the date of shipment to customers when a formal arrangement exists, the price is fixed or determinable, the delivery is completed, we have no other significant obligations and collectability is reasonably assured. Payments received before all of the relevant criteria for revenue recognition are satisfied are recorded as unearned revenue.
Our revenue consists of invoiced value of goods, net of a value-added tax (VAT). No product return or sales discount allowance is made as products delivered and accepted by customers are normally not returnable and sales discounts are normally not granted after products are delivered.
Cash and cash equivalents
For statement of cash flows purposes, we consider all cash on hand and in banks, certificates of deposit and other highly liquid investments with maturities of three months or less, when purchased, to be cash and cash equivalents.
Accounts receivable
Our policy is to maintain reserves for potential credit losses on accounts receivable. Management reviews the composition of accounts receivable and analyzes historical bad debts, customer concentrations, customer credit worthiness, current economic trends and changes in customer payment patterns to evaluate the adequacy of these reserves. Any accounts receivable of Jinong and Gufeng that are outstanding for more than 180 days will be accounted as allowance for bad debts, and any accounts receivable of Yuxing that are outstanding for more than 90 days will be accounted as allowance for bad debts.
37
Deferred assets
Deferred assets represent amounts the Company advanced to the distributors in their marketing and stores development to expand our competitive advantage and market shares. Based on the distributor agreements, the amount owed by the distributors in certain marketing efforts and store development will be expensed over three years if the distributors are actively selling our products. If a distributor defaults, breaches, or terminates the agreement with us earlier than the realization of the contractual terms, the unamortized portion of the amount owed by the distributor is to be refunded to us immediately. The deferred assets had been fully amortized as of March 31, 2020.
Segment reporting
FASB ASC 280 requires use of the “management approach” model for segment reporting. The management approach model is based on the way a company’s management organizes segments within the company for making operating decisions and assessing performance. Reportable segments are based on products and services, geography, legal structure, management structure, or any other way management disaggregates a company.
As of March 31, 2020, we were organized into ten main business units: Jinong (fertilizer production), Gufeng (fertilizer production), Yuxing (agricultural products production), Lishijie (agriculture sales), Jinyangguang (agriculture sales), Wangtian (agriculture sales), Xindeguo (agriculture sales), Xinyulei (agriculture sales), Fengnong (agriculture sales) and Xiangrong (agriculture sales). For financial reporting purpose, our operations were organized into four main business segments based on locations and products: Jinong (fertilizer production), Gufeng (fertilizer production) and Yuxing (agricultural products production) and the sales VIEs. Each of the segments has its own annual budget regarding development, production and sales.
Item 3. Quantitative and Qualitative Disclosures About Market Risk
Disclosures About Market Risk
We may be exposed to changes in financial market conditions in the normal course of business. Market risk generally represents the risk that losses may occur as a result of movements in interest rates and equity prices. We currently do not, in the normal course of business, use financial instruments that are subject to changes in financial market conditions.
Currency Fluctuations and Foreign Currency Risk
Substantially all of our revenues and expenses are denominated in RMB. However, we use the U.S. dollar for financial reporting purposes. Conversion of RMB into foreign currencies is regulated by the People’s Bank of China through a unified floating exchange rate system. Although the PRC government has stated its intention to support the value of RMB, there can be no assurance that such exchange rate will not again become volatile or that RMB will not devalue significantly against U.S. dollar. Exchange rate fluctuations may adversely affect the value, in U.S. dollar terms, of our net assets and income derived from our operations in the PRC.
Our reporting currency is the U.S. dollar. Except for U.S. holding companies, all of our consolidated revenues, consolidated costs and expenses, and our assets are denominated in RMB. As a result, we are exposed to foreign exchange risk as our revenues and results of operations may be affected by fluctuations in the exchange rate between the U.S. dollars and RMB. If RMB depreciates against the U.S. dollar, the value of our RMB revenues, earnings and assets as expressed in our U.S. dollar financial statements will decline. Assets and liabilities are translated at the exchange rates as of the balance sheet dates, revenues and expenses are translated at the average exchange rates, and shareholders’ equity is translated at historical exchange rates. Any resulting translation adjustments are not included in determining net income but are included in determining other comprehensive income, a component of shareholders’ equity. As of March 31, 2020, our accumulated other comprehensive loss was $33 million. We have not entered into any hedging transactions in an effort to reduce our exposure to foreign exchange risk. The value of the RMB against the U.S. dollar and other currencies is affected by, among other things, changes in PRC’s political and economic conditions. Between July 1, 2019 and March 31, 2020, China’s currency dropped by a cumulative 3.3% against the U.S. dollar, making Chinese exports cheaper and imports into China more expensive by that percentage. The effect on trade can be substantial. Moreover, it is possible that in the future, the PRC authorities may lift restrictions on fluctuations in the RMB exchange rate and lessen intervention in the foreign exchange market.
Interest Rate Risk
We deposit surplus funds with Chinese banks earning daily interest. We do not invest in any instruments for trading purposes. All of our outstanding debt instruments carry fixed rates of interest. The amount of short-term debt outstanding as of March 31, 2020 and June 30, 2019 was $3.8 million and $3.6 million, respectively. We are exposed to interest rate risk primarily with respect to our short-term bank loans. Although the interest rates, which are based on the banks’ prime rates with respect to our short-term loans, are fixed for the terms of the loans, the terms are typically three to twelve months for short-term bank loans and interest rates are subject to change upon renewal. There was no material change in interest rates for short-term bank loans renewed during the Nine Months ended March 31, 2020. The original loan term on average is one year, and the remaining average life of the short term-loans is approximately three Months.
38
Management monitors the banks’ prime rates in conjunction with our cash requirements to determine the appropriate level of debt balances relative to other sources of funds. We have not entered into any hedging transactions in an effort to reduce our exposure to interest rate risk.
Credit Risk
We have not experienced significant credit risk, as most of our customers are long-term customers with superior payment records. Our receivables are monitored regularly by our credit managers.
Inflation Risk
Inflationary factors such as increases in the cost of our products and overhead costs may adversely affect our operating results. Although we do not believe that inflation has had a material impact on our financial position or results of operations to date, a high rate of inflation in the future may have an adverse effect on our ability to maintain current levels of gross margin and selling, general and administrative expenses as a percentage of net revenues if the selling prices of our products do not increase with these increased costs.
Epidemics, pandemics or other outbreaks Risk
The outbreak of COVID-19 has adversely affected, and in the future it or other epidemics, pandemics or outbreaks may adversely affect, our operations. This is or may be due to closures or restrictions requested or mandated by governmental authorities, disruption to supply chains and workforce, reduction of demand for our products and services, and credit losses when customers and other counterparties fail to satisfy their obligations to us. We share most of these risks with all businesses.
In addition, the COVID-19 outbreak has significantly increased economic and demand uncertainty. The current outbreak and continued spread of COVID-19 may cause a global recession, which would have a further adverse impact on our financial condition and operations, and this impact could exist for an extensive period of time.
The Company is continuing to monitor the situation and take appropriate actions in accordance with the recommendations and requirements of relevant authorities. The full extent of the impact of the COVID-19 pandemic on the Company’s operational and financial performance is currently uncertain and will depend on many factors outside the Company’s control, including, without limitation, the timing, extent, trajectory and duration of the pandemic, the development and availability of effective treatments and vaccines, the imposition of protective public safety measures, and the impact of the pandemic on the global economy and demand for consumer products.
Additional future impacts on the Company may include, but are not limited to, material adverse effects on: demand for the Company’s products and services; the Company’s supply chain and sales and distribution channels; the Company’s ability to execute its strategic plans; and the Company’s profitability and cost structure. To the extent the COVID-19 pandemic adversely affects the Company’s business, results of operations, financial condition and stock price, it may also have the effect of heightening many of the other risks described above.
Item 4. Controls and Procedures
(a) Evaluation of disclosure controls and procedures
Pursuant to Rule 13a-15(b) under the Securities Exchange Act of 1934 (“Exchange Act”), at the conclusion of the period ended March 31, 2020 we carried out an evaluation, under the supervision and with the participation of our management, including our Chief Executive Officer and Chief Financial Officer, of the effectiveness of the design and operation of our disclosure controls and procedures (as such term is defined in Rules 13a-15(e) and 15d-15(e) under the Securities Exchange Act of 1934 (the “Exchange Act”)). Based upon that evaluation, our Chief Executive Officer and Chief Financial Officer concluded that as of the end of the period covered by this Report, our disclosure controls and procedures were effective and adequately designed to ensure that the information required to be disclosed by us in the reports we submit under the Exchange Act is recorded, processed, summarized and reported within the time periods specified in the applicable rules and forms and that such information was accumulated and communicated to our Chief Executive Officer and Chief Financial Officer, in a manner that allowed for timely decisions regarding required disclosure.
(b) Changes in internal controls
There were no changes in our internal control over financial reporting identified in connection with the evaluation required by paragraph (d) of Exchange Act Rules 13a-15 or 15d-15 that occurred during the quarter ended March 31, 2020 that have materially affected, or are reasonably likely to materially affect, our internal control over financial reporting.
39
Item 1. Legal Proceedings
There are no other actions, suits, proceedings, inquiries or investigations before or by any court, public board, government agency, self-regulatory organization or body pending or, to the knowledge of the executive officers of our company or any of our subsidiaries, threatened against or affecting our company, our common stock, any of our subsidiaries or of our companies or our subsidiaries’ officers or directors in their capacities as such, in which an adverse decision could have a material adverse effect.
Item 2. Unregistered Sales of Equity Securities and Use of Proceeds
There were no unregistered sales of the Company’s equity securities during the Nine Months ended March 31, 2020, that were not otherwise disclosed in a Current Report on Form 8-K.
Item 3. Defaults Upon Senior Securities
There has been no default in the payment of principal, interest, sinking or purchase fund installment, or any other material default, with respect to any indebtedness of the Company.
Item 4. Mine Safety Disclosures
Not applicable.
Item 5. Other Information
There is no other information required to be disclosed under this item which was not previously disclosed.
The exhibits required by this item are set forth in the Exhibit Index attached hereto.
40
Pursuant to the requirements of the Securities Exchange Act of 1934, the Registrant has duly caused this report to be signed on its behalf by the undersigned thereunto duly authorized.
| CHINA GREEN AGRICULTURE, INC. | ||
| Date: May 15, 2020 | By: | /s/ Zhuoyu Li |
| Name: | Zhuoyu Li | |
| Title: | Chief Executive Officer | |
| (principal executive officer) | ||
| Date: May 15, 2020 | By: | /s/ Yongcheng Yang |
| Name: | Yongcheng Yang | |
| Title: | Chief Financial Officer | |
|
(principal financial officer and principal accounting officer) | ||
41
| No. | Description | |
| 21.1* | List of Subsidiaries of the Company | |
| 31.1* | Certification of Chief Executive Officer pursuant to Section 302 of the Sarbanes-Oxley Act of 2002. | |
| 31.2* | Certification of Chief Financial Officer pursuant to Section 302 of the Sarbanes-Oxley Act of 2002. | |
| 32.1+ | Certification of Chief Executive Officer pursuant to Section 906 of the Sarbanes-Oxley Act of 2002. | |
| 32.2+ | Certification of Chief Financial Officer pursuant to Section 906 of the Sarbanes-Oxley Act of 2002. | |
| 101.INS* | XBRL Instance Document | |
| 101.SCH* | XBRL Taxonomy Extension Schema Document | |
| 101.CAL* | XBRL Taxonomy Extension Calculation Linkbase Document | |
| 101.DEF* | XBRL Taxonomy Extension Definition Linkbase Document | |
| 101.LAB* | XBRL Taxonomy Extension Label Linkbase Document | |
| 101.PRE* | XBRL Taxonomy Extension Presentation Linkbase Document | |
| * | Filed herewith |
| + | In accordance with the SEC Release 33-8238, deemed being furnished and not filed. |
42