Attached files
| file | filename |
|---|---|
| EX-99.1 - EX-99.1 - Hostess Brands, Inc. | twnk-earningsrelease20.htm |
| 8-K - 8-K - Hostess Brands, Inc. | twnk-20200508.htm |
Investor Presentation May 8, 2020
Forward Looking Statements This investor presentation contains statements reflecting our views about the future performance of Hostess Brands, Inc. and its subsidiaries (referred to as “Hostess Brands” or the “Company”) that constitute “forward-looking statements” that involve substantial risks and uncertainties. Forward-looking statements are generally identified through the inclusion of words such as “believes,” “expects,” “intends,” “estimates,” “projects,” “anticipates,” “will,” “plan,” “may,” “should,” or similar language. Statements addressing our future operating performance and statements addressing events and developments that we expect or anticipate will occur are also considered forward-looking statements. All forward looking statements included herein are made only as of the date hereof. We undertake no obligation to update any forward-looking statement, whether as a result of new information, future events, or otherwise. These statements inherently involve risks and uncertainties that could cause actual results to differ materially from those anticipated in such forward-looking statements. These risks and uncertainties include, but are not limited to; our ability to maintain, extend or expand our reputation and brand image; failing to protect our intellectual property rights; our ability to leverage our brand value to compete against lower-priced alternative brands; our ability to correctly predict, identify and interpret changes in consumer preferences and demand and offering new products to meet those changes; our ability to operate in a highly competitive industry; our ability to maintain or add additional shelf or retail space for our products; our ability to continue to produce and successfully market products with extended shelf life; our ability to successfully integrate, achieve expected synergies and manage our acquired businesses and brands; our ability to drive revenue growth in our key products or add products that are faster-growing and more profitable; volatility in commodity, energy, and other input prices and our ability to adjust our pricing to cover any increased costs; the availability and pricing of transportation to distribute our products; our dependence on our major customers; our geographic focus could make us particularly vulnerable to economic and other events and trends in North America; consolidation of retail customers; increased costs to comply with governmental regulation; general political, social and economic conditions; increased healthcare and labor costs; the fact that a portion of our workforce belongs to unions and strikes or work stoppages could cause our business to suffer; product liability claims, product recalls, or regulatory enforcement actions; unanticipated business disruptions; dependence on third parties for significant services; inability to identify or complete strategic acquisitions; our insurance not providing adequate levels of coverage against claims; failures, unavailability, or disruptions of our information technology systems; departure of key personnel or a highly skilled and diverse workforce; and our ability to finance our indebtedness on terms favorable to us; and other risks as set forth under the caption “Risk Factors” from time to time in our Securities and Exchange Commission filings. The impact of COVID-19 may also exacerbate these risks, any of which could have a material effect on the Company. This situation is changing rapidly and additional impacts may arise that the Company is not aware of currently. All subsequent written or oral forward-looking statements attributable to us or persons acting on the Company's behalf are expressly qualified in their entirety by these risk factors. The Company undertakes no obligation to update any forward-looking statement, whether as a result of new information, future events, or otherwise. Industry and Market Data In this Investor Presentation, Hostess Brands relies on and refers to information and statistics regarding market shares in the sectors in which it competes and other industry data. Hostess Brands obtained this information and statistics from third-party sources, including reports by market research firms, such as Nielsen. Additionally, prior period Nielsen data was adjusted to exclude the Cloverhill® and Big Texas® brands in the periods they were not owned by Hostess. Hostess Brands has supplemented this information where necessary with information from discussions with Hostess customers and its own internal estimates, taking into account publicly available information about other industry participants and Hostess Brands’ management’s best view as to information that is not publicly available. Use of Non-GAAP Financial Measures Adjusted gross profit, adjusted operating income, adjusted net income, and adjusted EPS collectively referred to as “Non-GAAP Financial Measures,” are commonly used in the Company’s industry and should not be construed as an alternative to gross profit, operating income, net income or earnings per share as indicators of operating performance (as determined in accordance with GAAP). These Non-GAAP financial measures exclude certain items included in the comparable GAAP financial measure. This Investor Presentation also includes non-GAAP financial measures, including earnings before interest, taxes, depreciation, amortization and other adjustments to eliminate the impact of certain items that we do not consider indicative of our ongoing performance (“Adjusted EBITDA”) and Adjusted EBITDA Margin. Adjusted EBITDA Margin represents Adjusted EBITDA divided by net revenues. Hostess Brands believes that these Non-GAAP Financial Measures provide useful information to management and investors regarding certain financial and business trends relating to Hostess Brands’ financial condition and results of operations. Hostess Brands’ management uses these Non-GAAP Financial Measures to compare Hostess Brands’ performance to that of prior periods for trend analysis, for purposes of determining management incentive compensation, and for budgeting and planning purposes. Hostess Brands believes that the use of these Non-GAAP Financial Measures provides an additional tool for investors to use in evaluating ongoing operating results and trends. Management of Hostess Brands does not consider these Non-GAAP Financial Measures in isolation or as an alternative to financial measures determined in accordance with GAAP. Other companies may calculate non-GAAP measures differently, and therefore Hostess Brands’ Non-GAAP Measures may not be directly comparable to similarly titled measures of other companies. The Company does not provide a reconciliation of the forward-looking information to the most directly comparable GAAP measures because of the inherent difficulty in forecasting and quantifying certain amounts that are necessary for such reconciliations. Totals in this Investor Presentation may not add up due to rounding. 2
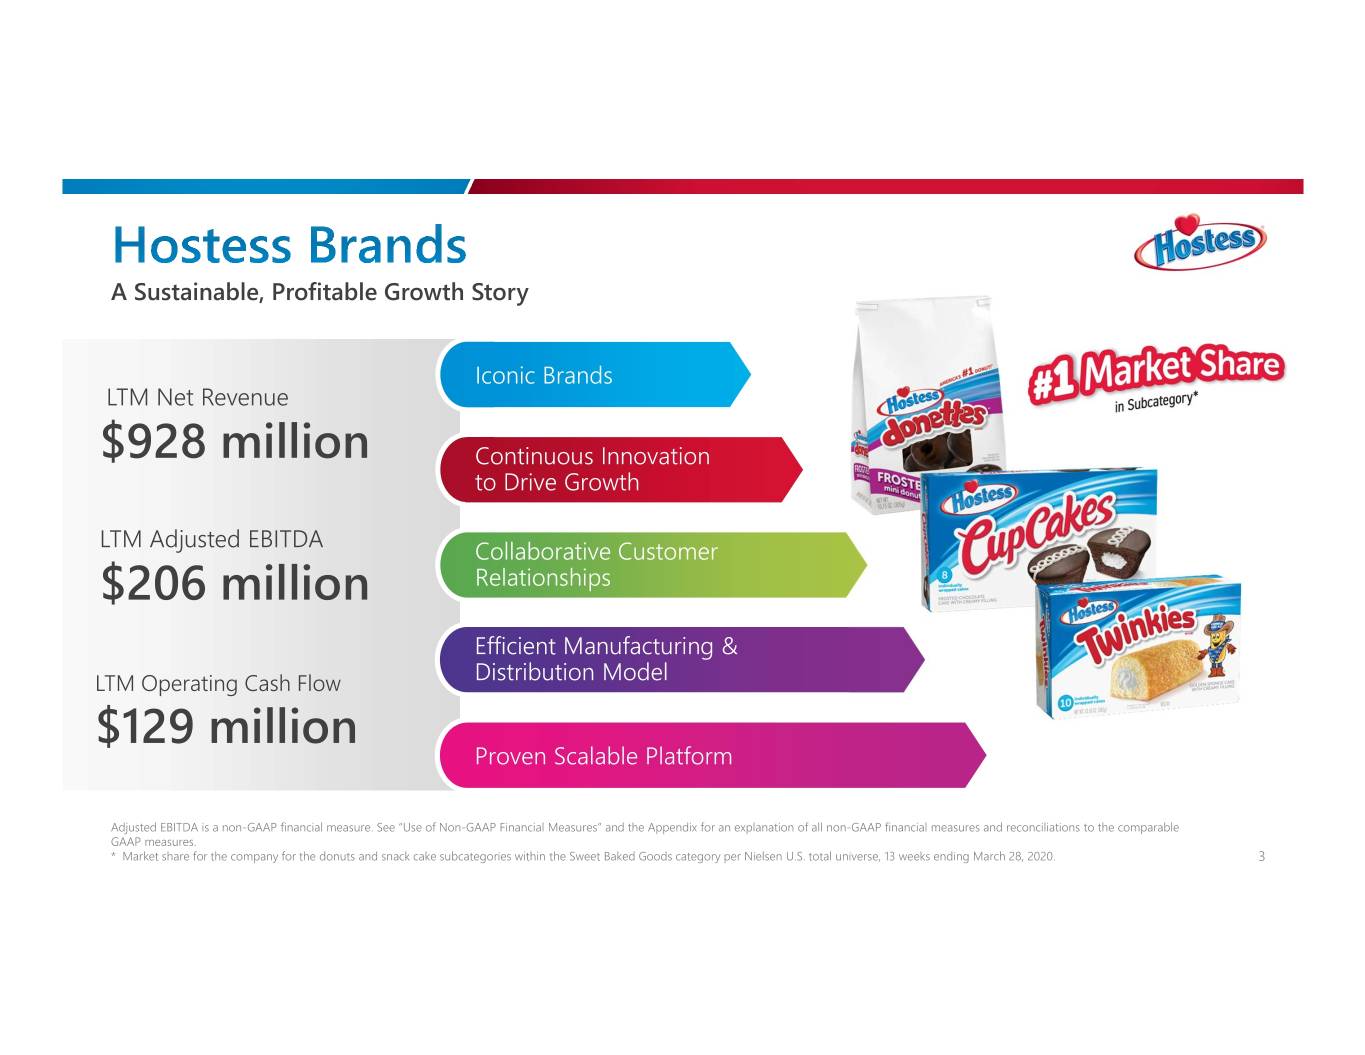
A Sustainable, Profitable Growth Story Iconic Brands LTM Net Revenue $928 million Continuous Innovation to Drive Growth LTM Adjusted EBITDA Collaborative Customer $206 million Relationships Efficient Manufacturing & LTM Operating Cash Flow Distribution Model $129 million Proven Scalable Platform Adjusted EBITDA is a non-GAAP financial measure. See “Use of Non-GAAP Financial Measures” and the Appendix for an explanation of all non-GAAP financial measures and reconciliations to the comparable GAAP measures. * Market share for the company for the donuts and snack cake subcategories within the Sweet Baked Goods category per Nielsen U.S. total universe, 13 weeks ending March 28, 2020. 3
We Appreciate the Dedication and Sacrifices of So Many Our hearts are with those affected by the COVID-19 pandemic and we are thankful for all those that are working tirelessly on the front-lines to support our communities including: − The Healthcare Community − Our Employees − Our Retail and Supply-Chain Partners − Our Consumers − All Who Are Working to Keep Us Safe We Thank You! 4
Executing during COVID-19 Pandemic Our Top Priorities in Response to the COVID-19 Outbreak: 1. Ensure the health and safety of our employees 2. Continue servicing our customers and consumers 3. Stay informed and nimble 4. Position ourselves to emerge a stronger and more resilient Company Dedicated to Bringing Consumers the Comfort and Joy of Hostess during this Difficult and Uncertain Time 5
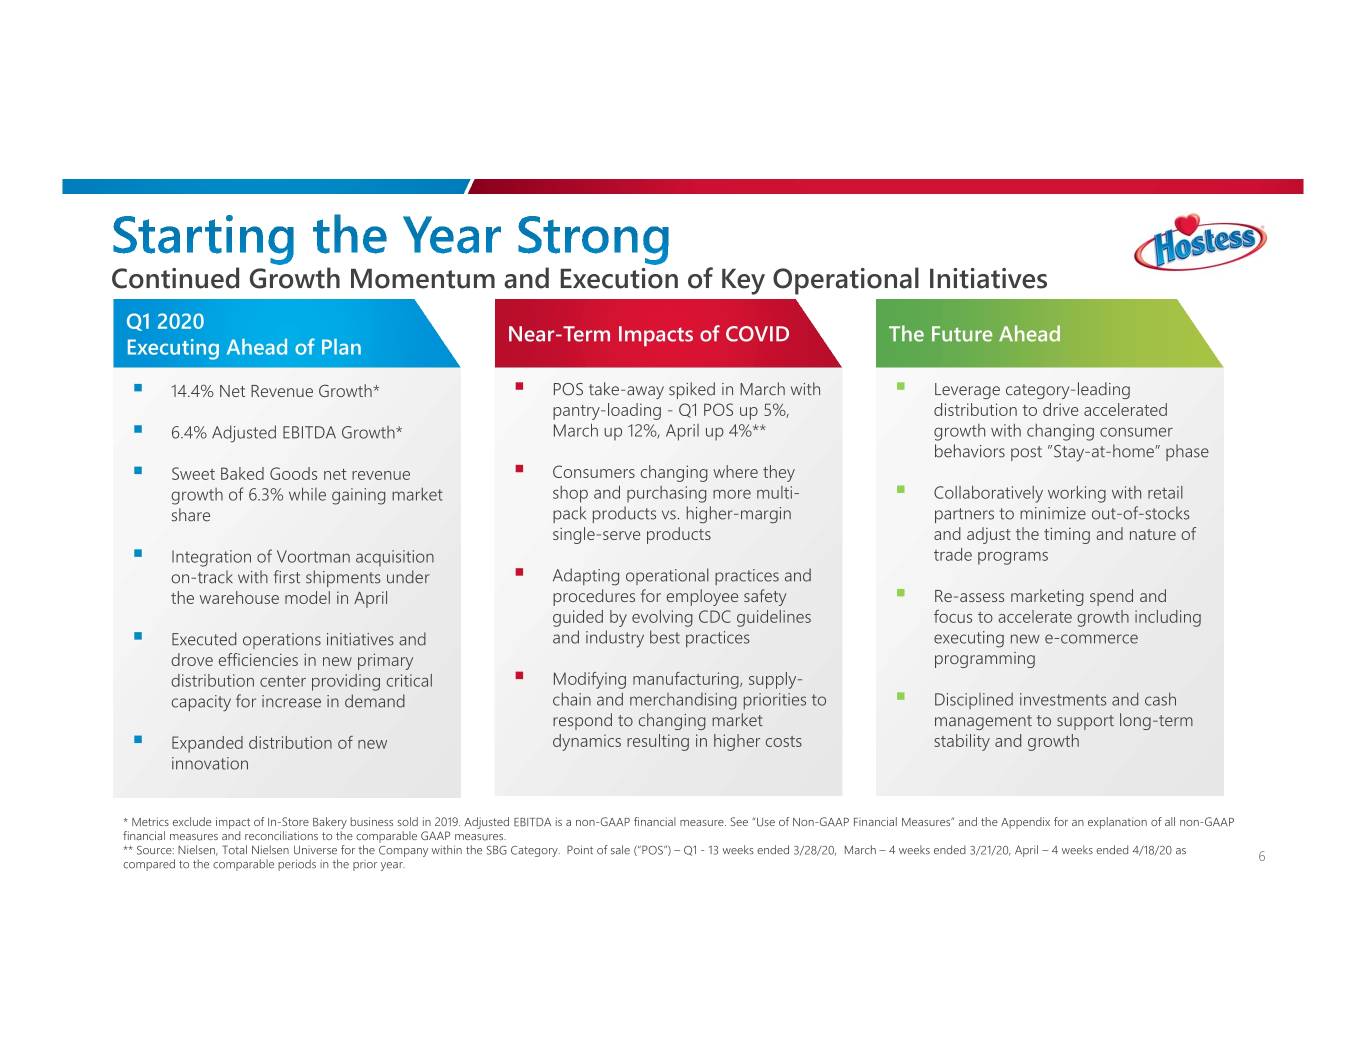
Continued Growth Momentum and Execution of Key Operational Initiatives Q1 2020 Near-Term Impacts of COVID The Future Ahead Executing Ahead of Plan . 14.4% Net Revenue Growth* . POS take-away spiked in March with . Leverage category-leading pantry-loading - Q1 POS up 5%, distribution to drive accelerated . 6.4% Adjusted EBITDA Growth* March up 12%, April up 4%** growth with changing consumer behaviors post ”Stay-at-home” phase . Sweet Baked Goods net revenue . Consumers changing where they growth of 6.3% while gaining market shop and purchasing more multi- . Collaboratively working with retail share pack products vs. higher-margin partners to minimize out-of-stocks single-serve products and adjust the timing and nature of . Integration of Voortman acquisition trade programs on-track with first shipments under . Adapting operational practices and the warehouse model in April procedures for employee safety . Re-assess marketing spend and guided by evolving CDC guidelines focus to accelerate growth including . Executed operations initiatives and and industry best practices executing new e-commerce drove efficiencies in new primary programming distribution center providing critical . Modifying manufacturing, supply- capacity for increase in demand chain and merchandising priorities to . Disciplined investments and cash respond to changing market management to support long-term . Expanded distribution of new dynamics resulting in higher costs stability and growth innovation * Metrics exclude impact of In-Store Bakery business sold in 2019. Adjusted EBITDA is a non-GAAP financial measure. See “Use of Non-GAAP Financial Measures” and the Appendix for an explanation of all non-GAAP financial measures and reconciliations to the comparable GAAP measures. ** Source: Nielsen, Total Nielsen Universe for the Company within the SBG Category. Point of sale (“POS”) – Q1 - 13 weeks ended 3/28/20, March – 4 weeks ended 3/21/20, April – 4 weeks ended 4/18/20 as 6 compared to the comparable periods in the prior year.
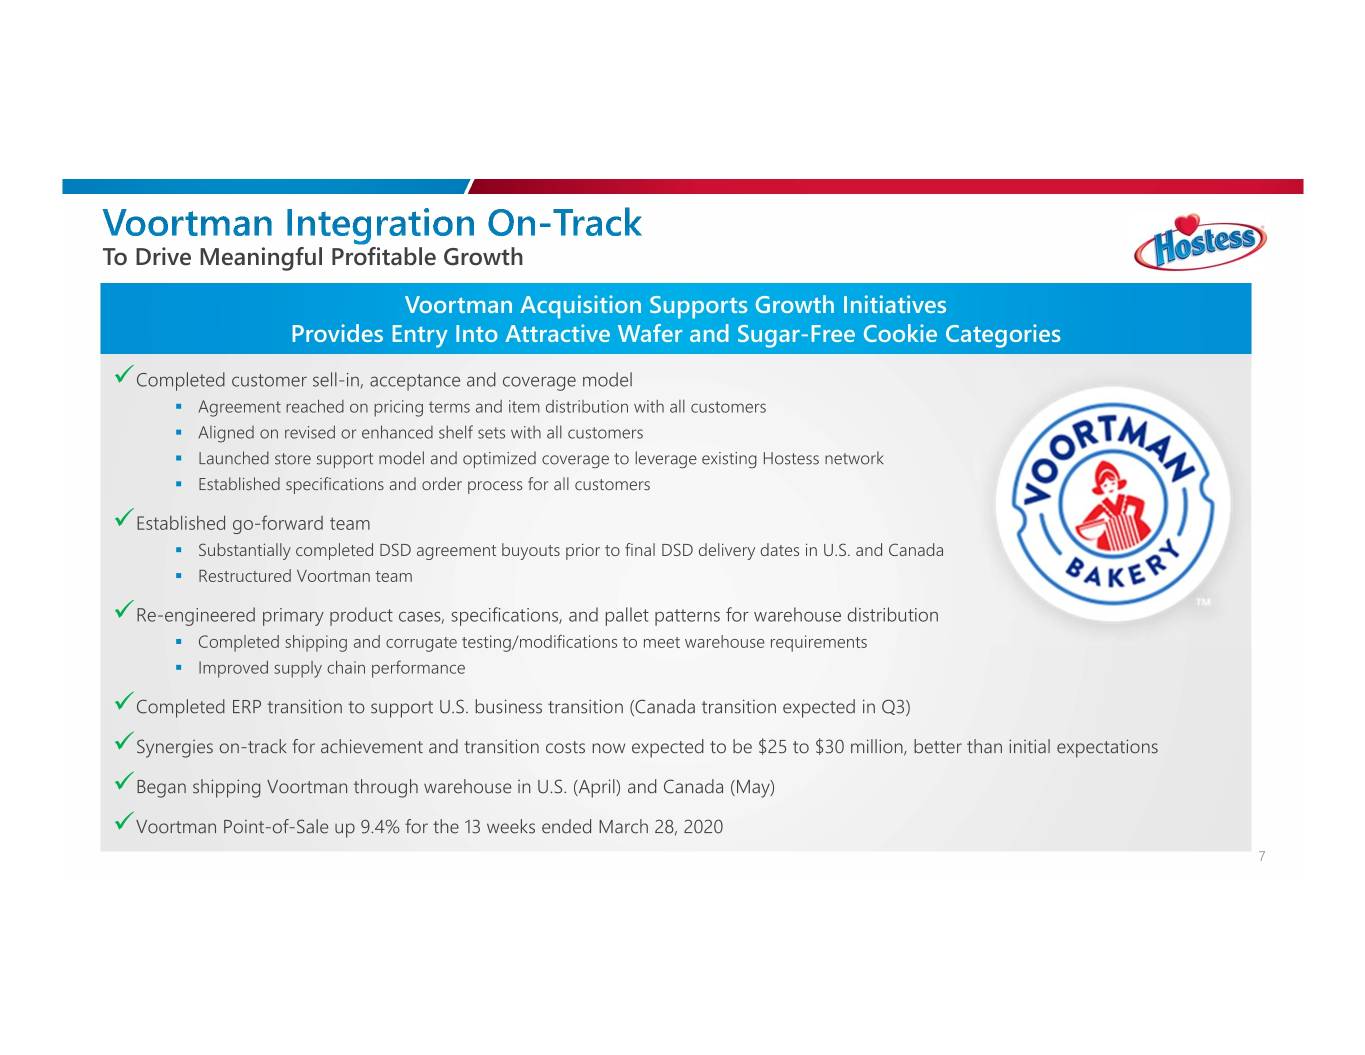
To Drive Meaningful Profitable Growth Voortman Acquisition Supports Growth Initiatives Provides Entry Into Attractive Wafer and Sugar-Free Cookie Categories Completed customer sell-in, acceptance and coverage model . Agreement reached on pricing terms and item distribution with all customers . Aligned on revised or enhanced shelf sets with all customers . Launched store support model and optimized coverage to leverage existing Hostess network . Established specifications and order process for all customers Established go-forward team . Substantially completed DSD agreement buyouts prior to final DSD delivery dates in U.S. and Canada . Restructured Voortman team Re-engineered primary product cases, specifications, and pallet patterns for warehouse distribution . Completed shipping and corrugate testing/modifications to meet warehouse requirements . Improved supply chain performance Completed ERP transition to support U.S. business transition (Canada transition expected in Q3) Synergies on-track for achievement and transition costs now expected to be $25 to $30 million, better than initial expectations Began shipping Voortman through warehouse in U.S. (April) and Canada (May) Voortman Point-of-Sale up 9.4% for the 13 weeks ended March 28, 2020 7
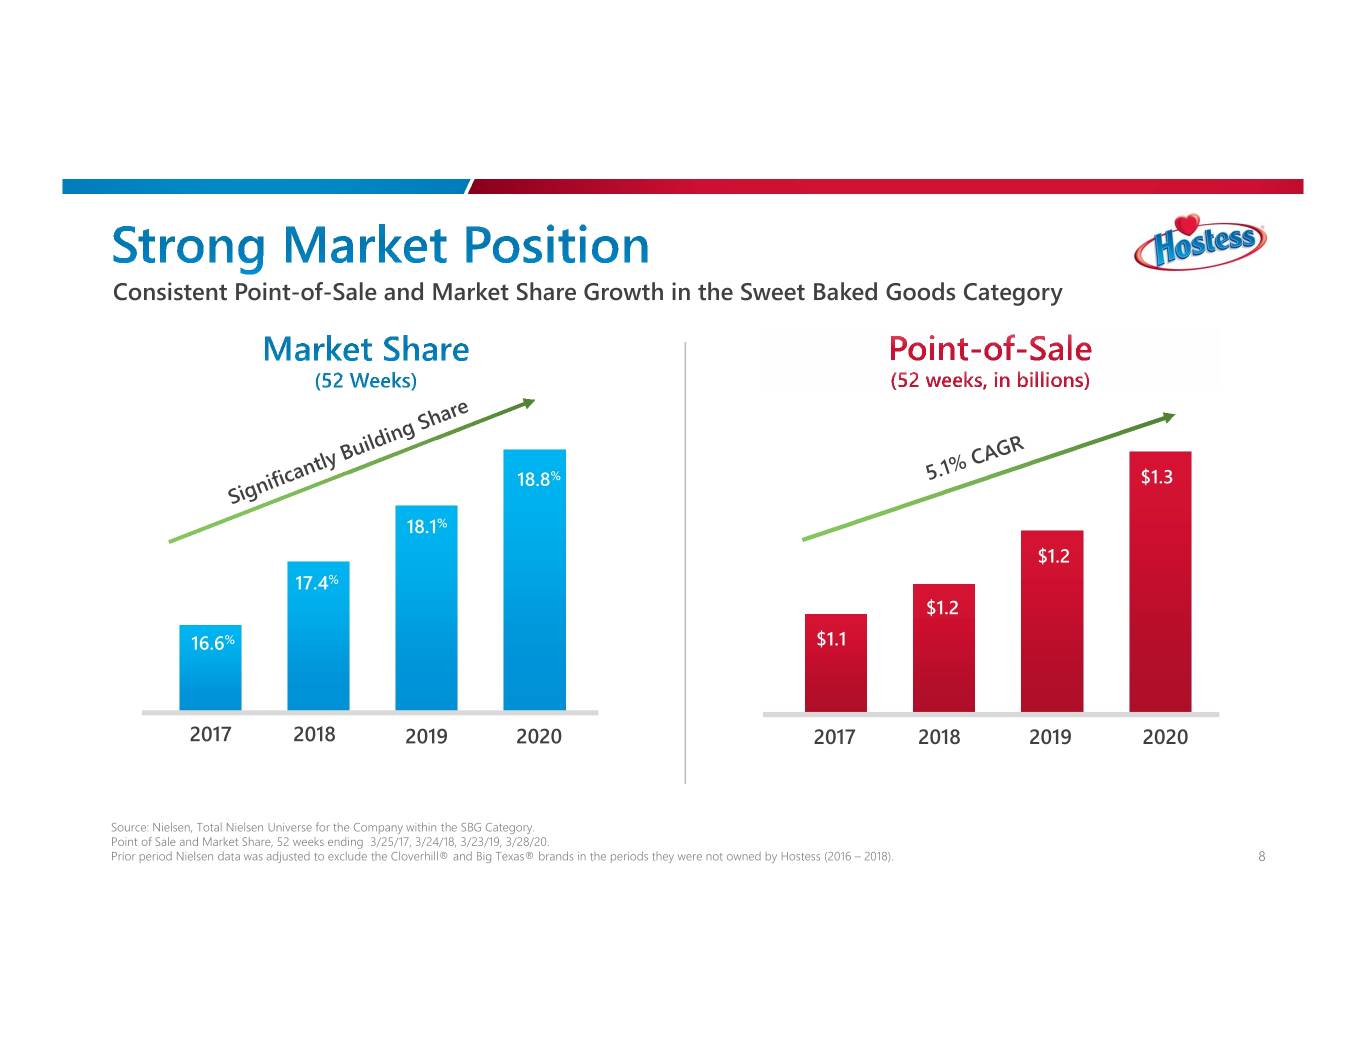
Consistent Point-of-Sale and Market Share Growth in the Sweet Baked Goods Category 18.8% $1.3 18.1% $1.0 $1.2 17.4% $1.2 16.6% $1.1 2017 2018 2019 2020 2017 2018 2019 2020 Source: Nielsen, Total Nielsen Universe for the Company within the SBG Category. Point of Sale and Market Share, 52 weeks ending 3/25/17, 3/24/18, 3/23/19, 3/28/20. Prior period Nielsen data was adjusted to exclude the Cloverhill® and Big Texas® brands in the periods they were not owned by Hostess (2016 – 2018). 8
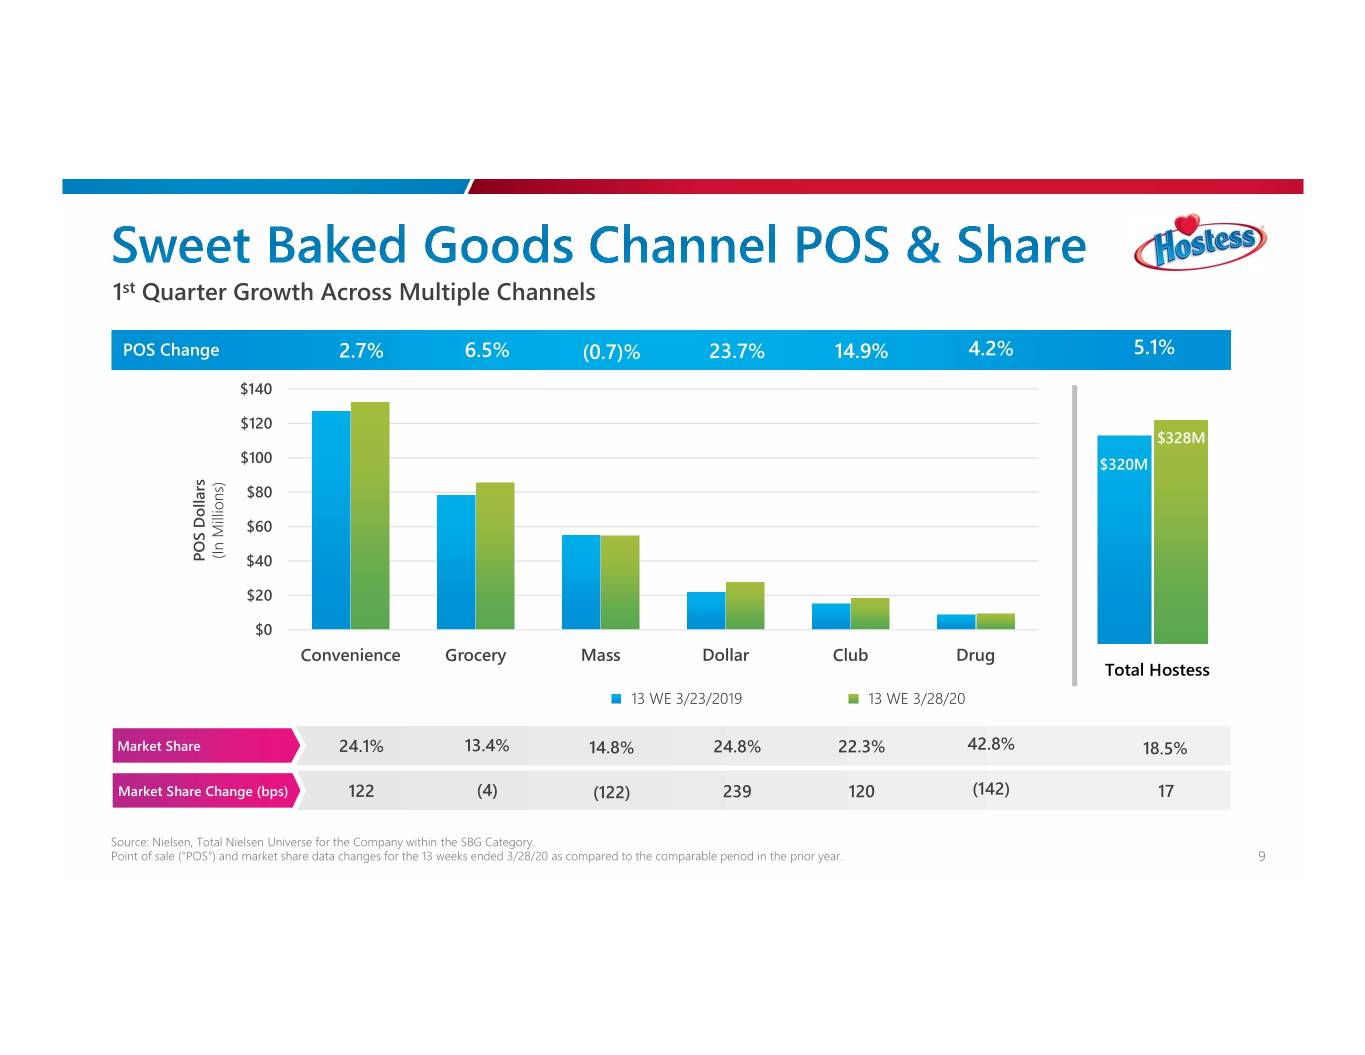
1st Quarter Growth Across Multiple Channels POS Change 2.7% 6.5% (0.7)% 23.7% 14.9% 4.2% 5.1% $140 $120 $328M $100 $320M $80 $60 (In Millions) POS Dollars $40 $20 $0 Convenience Grocery Mass Dollar Club Drug Total Hostess 13 WE 3/23/2019 13 WE 3/28/20 Market Share 24.1% 13.4% 14.8% 24.8% 22.3% 42.8% 18.5% Market Share Change (bps) 122 (4) (122) 239 120 (142) 17 Source: Nielsen, Total Nielsen Universe for the Company within the SBG Category. Point of sale (“POS”) and market share data changes for the 13 weeks ended 3/28/20 as compared to the comparable period in the prior year. 9
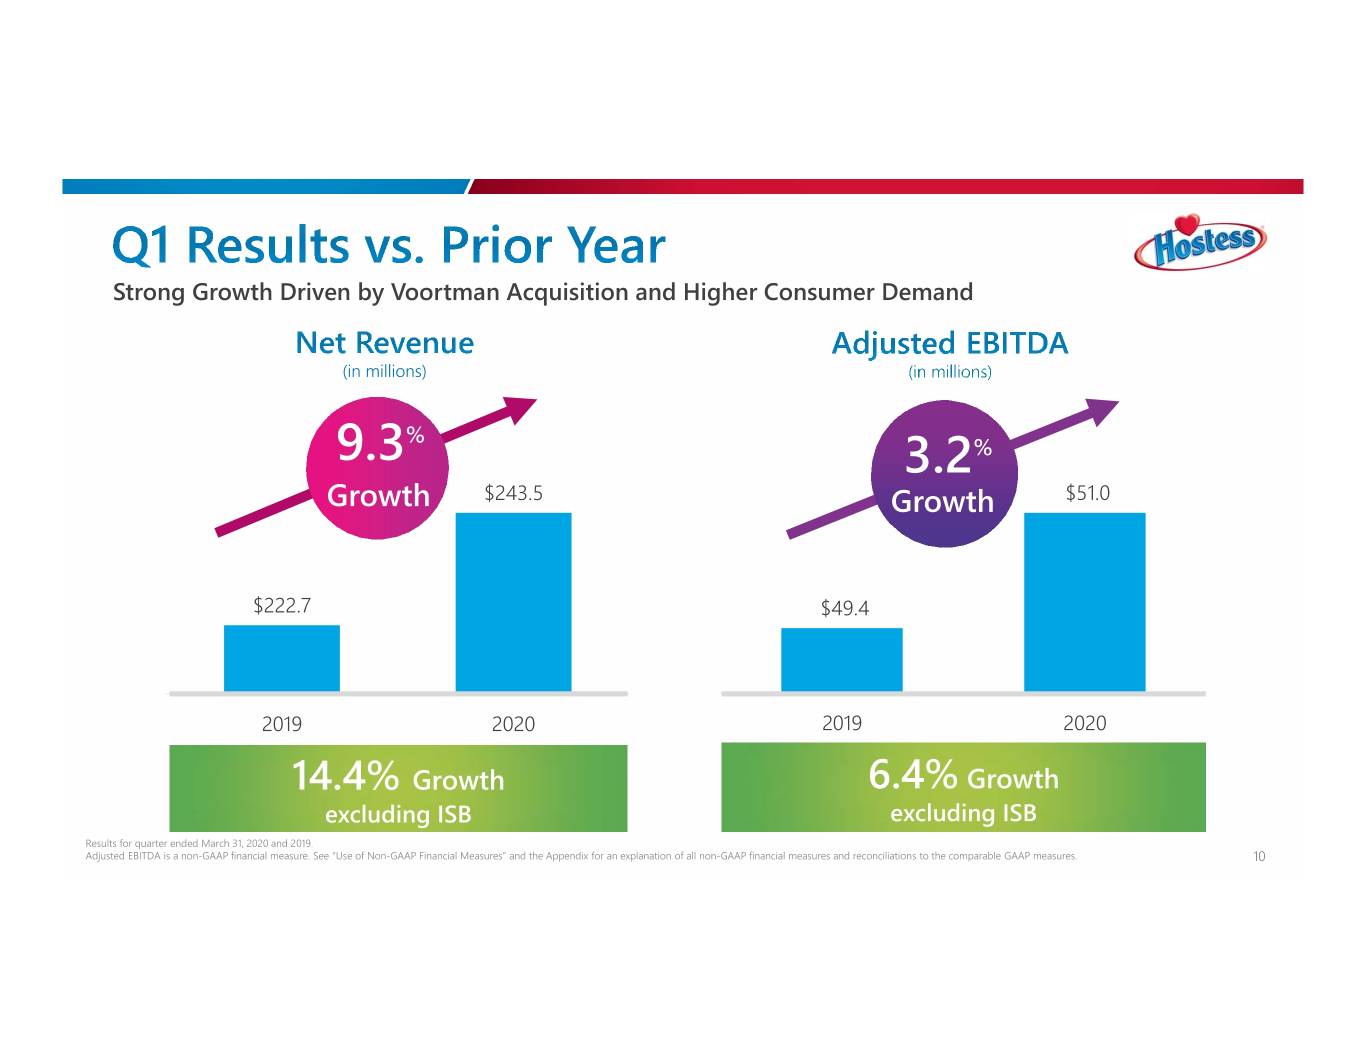
Strong Growth Driven by Voortman Acquisition and Higher Consumer Demand (in millions) % 9.3 3.2% Growth $243.5 Growth $51.0 $222.7 $49.4 2019 2020 2019 2020 14.4% Growth 6.4% Growth excluding ISB excluding ISB Results for quarter ended March 31, 2020 and 2019. Adjusted EBITDA is a non-GAAP financial measure. See “Use of Non-GAAP Financial Measures” and the Appendix for an explanation of all non-GAAP financial measures and reconciliations to the comparable GAAP measures. 10
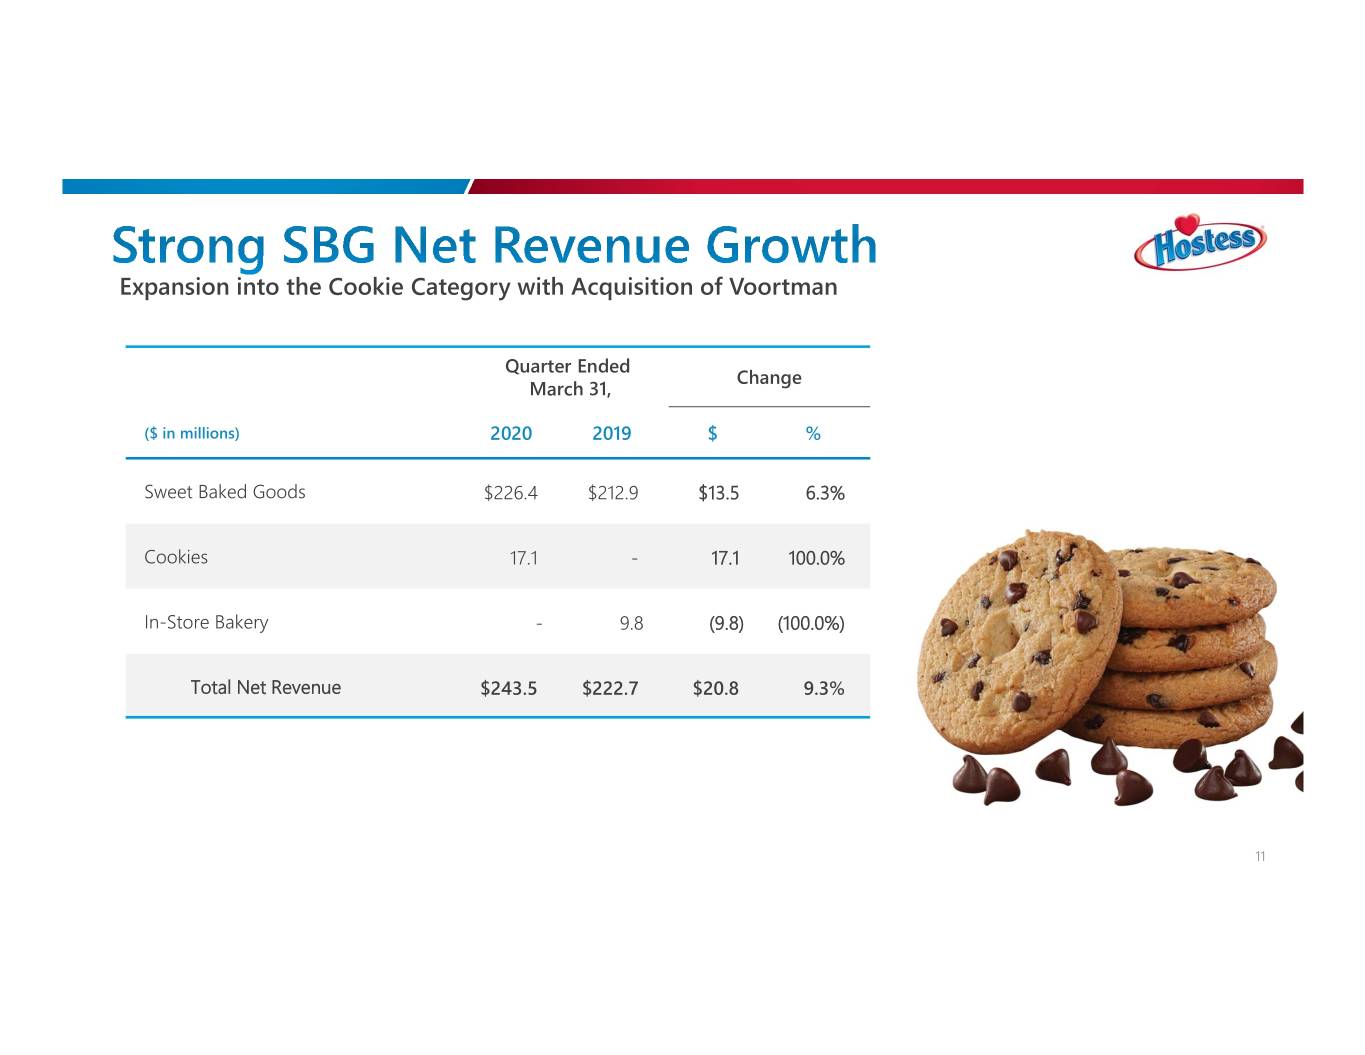
Expansion into the Cookie Category with Acquisition of Voortman Quarter Ended Change March 31, ($ in millions) 2020 2019 $ % Sweet Baked Goods $226.4 $212.9 $13.5 6.3% Cookies 17.1 - 17.1 100.0% In-Store Bakery -9.8(9.8) (100.0%) Total Net Revenue $243.5 $222.7 $20.8 9.3% 11
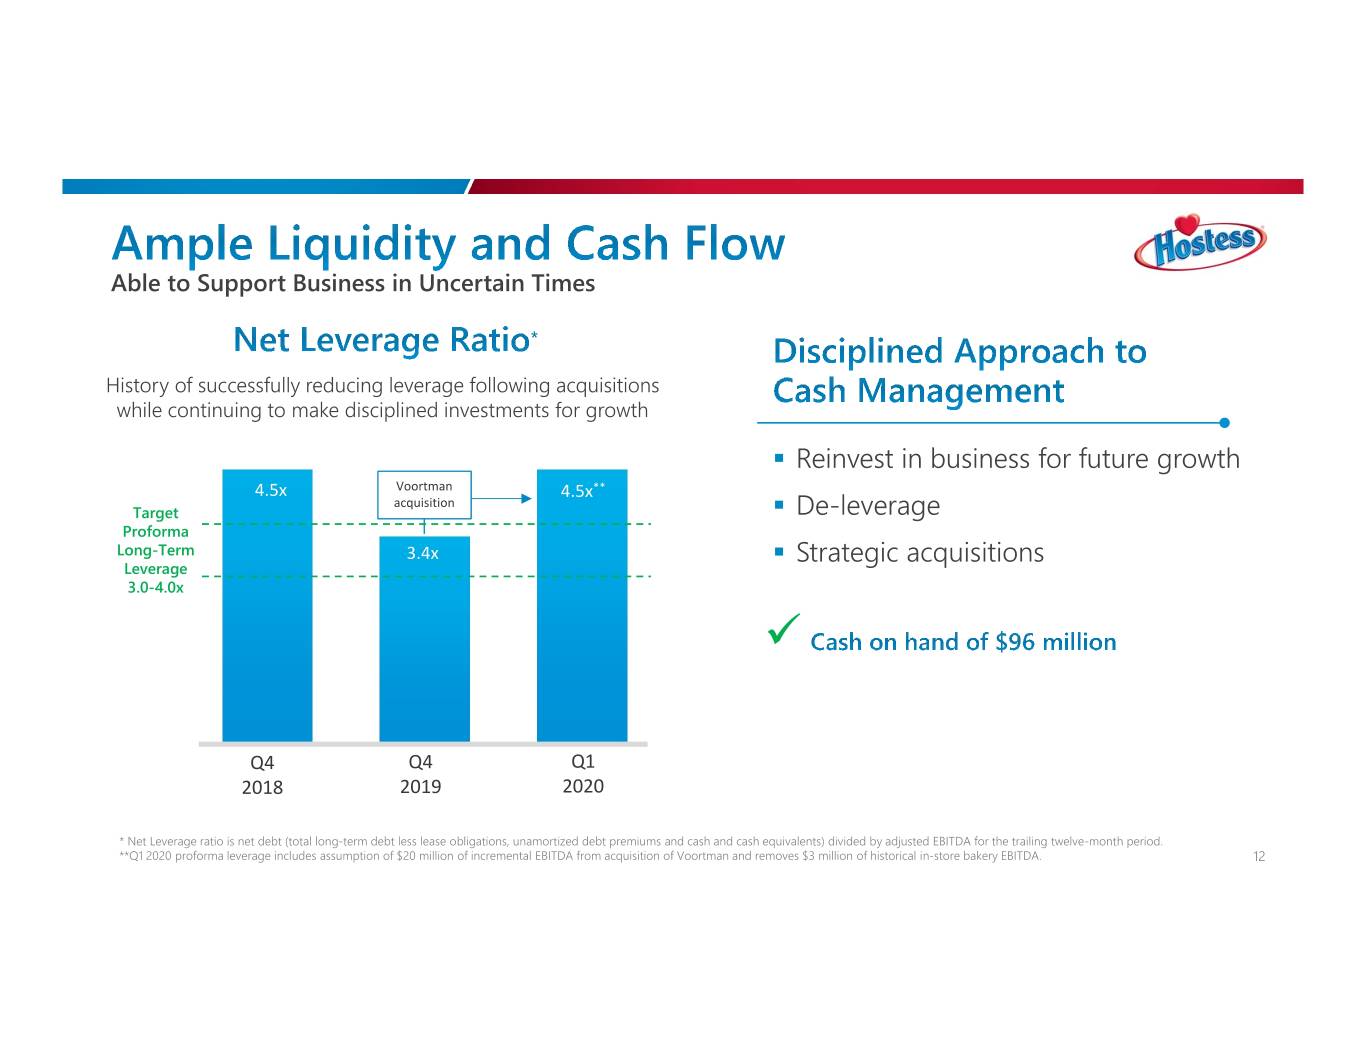
Able to Support Business in Uncertain Times History of successfully reducing leverage following acquisitions while continuing to make disciplined investments for growth . Reinvest in business for future growth 4.5x Voortman 4.5x** acquisition Target . De-leverage Proforma Long-Term 3.4x . Strategic acquisitions Leverage 3.0-4.0x Q4 Q4 Q1 2018 2019 2020 * Net Leverage ratio is net debt (total long-term debt less lease obligations, unamortized debt premiums and cash and cash equivalents) divided by adjusted EBITDA for the trailing twelve-month period. **Q1 2020 proforma leverage includes assumption of $20 million of incremental EBITDA from acquisition of Voortman and removes $3 million of historical in-store bakery EBITDA. 12
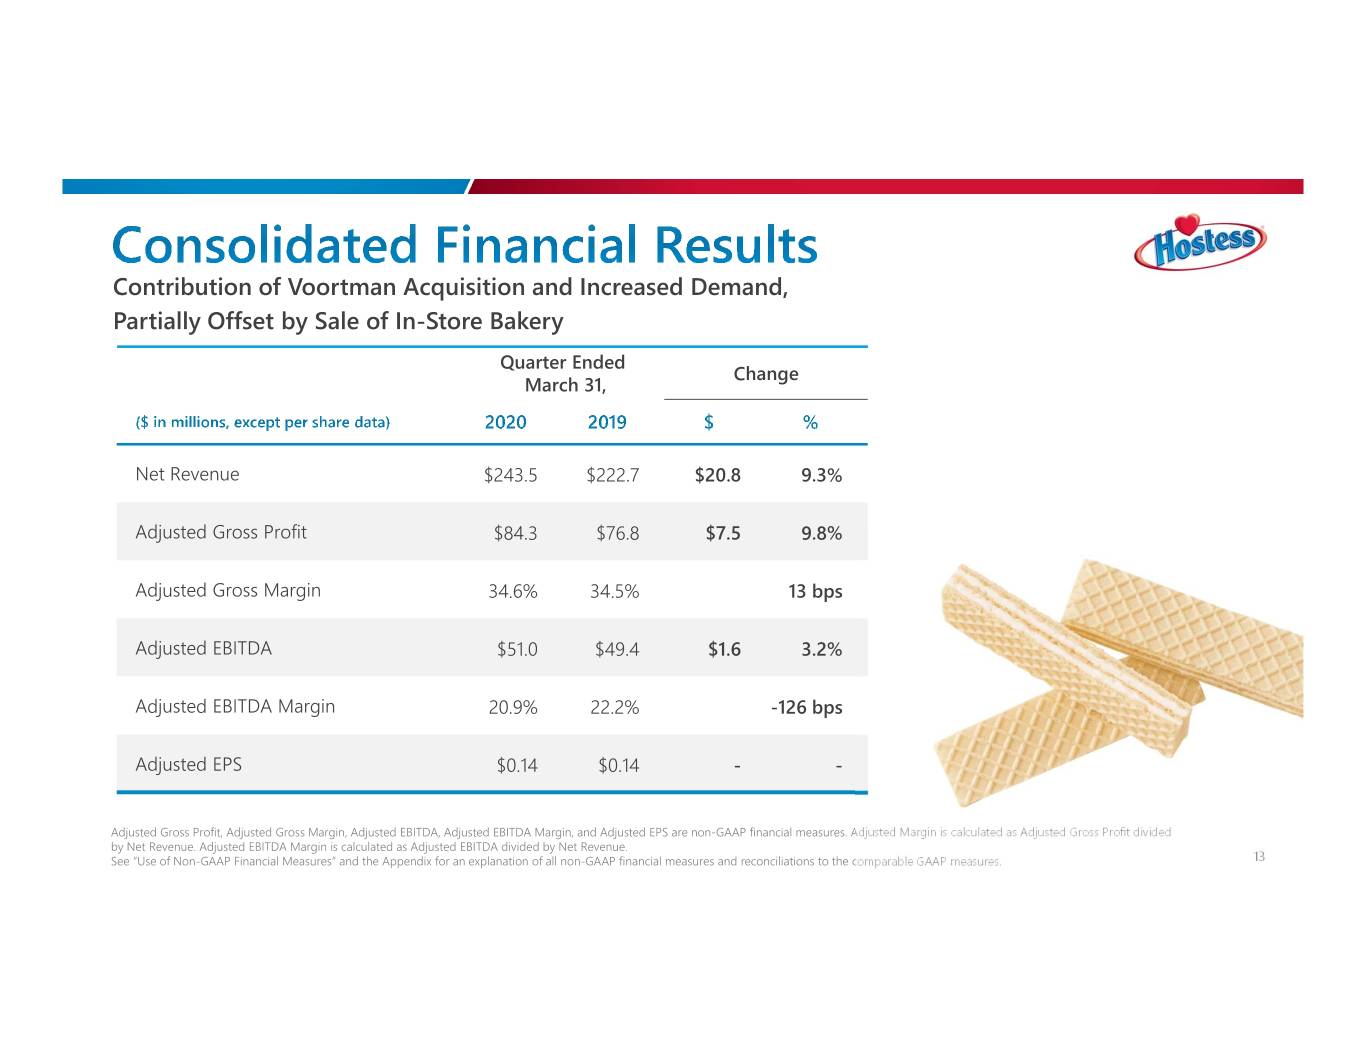
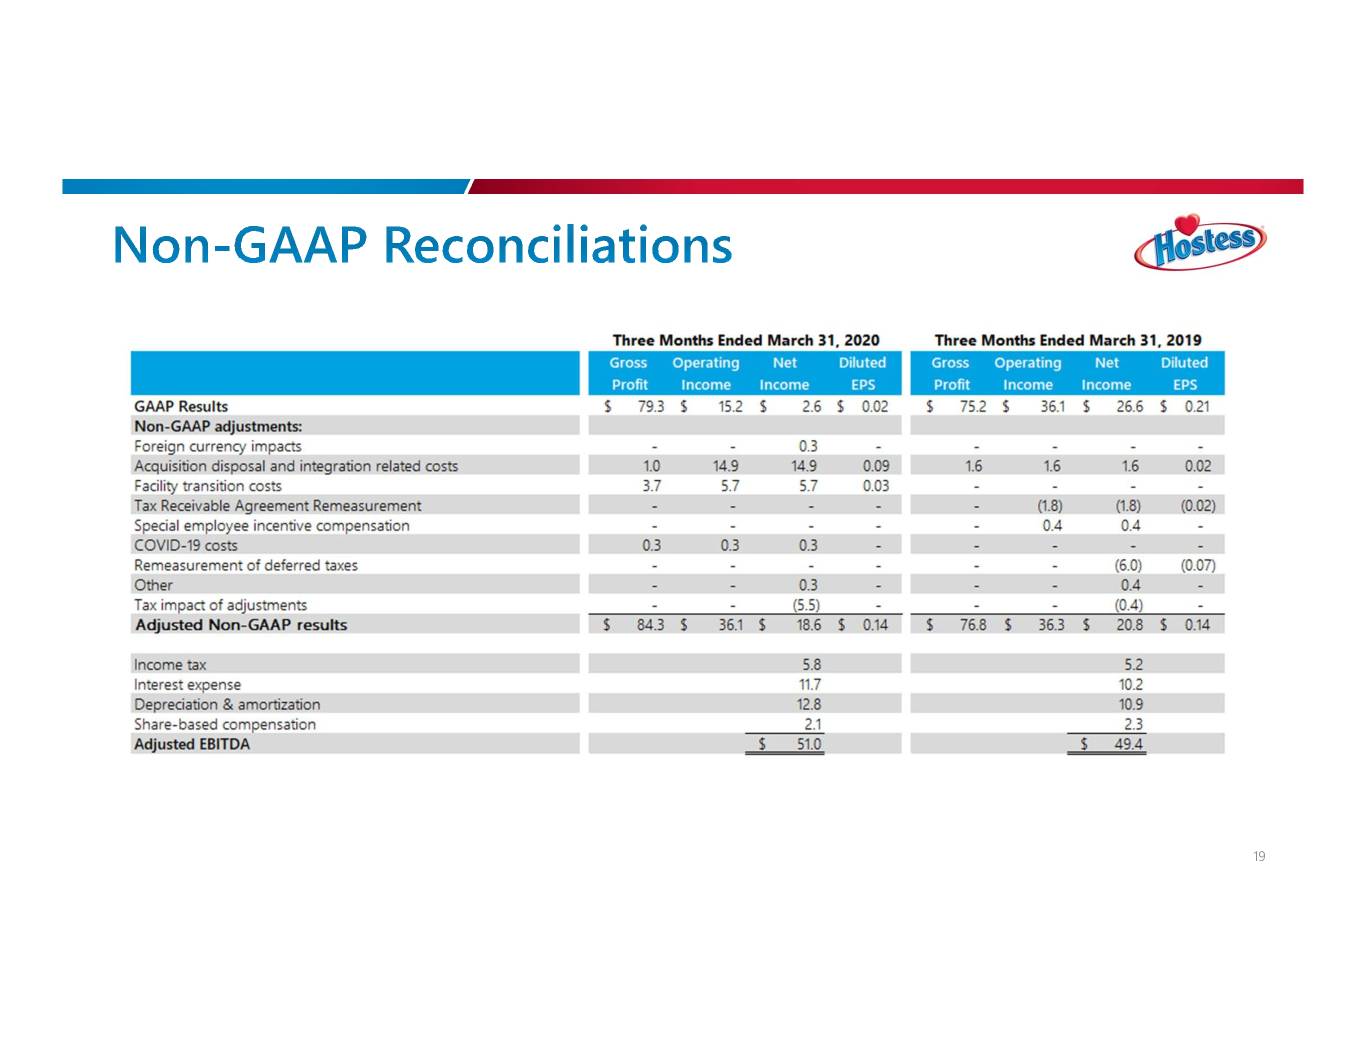
Contribution of Voortman Acquisition and Increased Demand, Partially Offset by Sale of In-Store Bakery Quarter Ended Change March 31, Net Revenue $243.5 $222.7 $20.8 9.3% Adjusted Gross Profit $84.3 $76.8 $7.5 9.8% Adjusted Gross Margin 34.6% 34.5% 13 bps Adjusted EBITDA $51.0 $49.4 $1.6 3.2% Adjusted EBITDA Margin 20.9% 22.2% -126 bps Adjusted EPS $0.14 $0.14 -- Adjusted Gross Profit, Adjusted Gross Margin, Adjusted EBITDA, Adjusted EBITDA Margin, and Adjusted EPS are non-GAAP financial measures. Adjusted Margin is calculated as Adjusted Gross Profit divided by Net Revenue. Adjusted EBITDA Margin is calculated as Adjusted EBITDA divided by Net Revenue. See “Use of Non-GAAP Financial Measures” and the Appendix for an explanation of all non-GAAP financial measures and reconciliations to the comparable GAAP measures. 13
Evolving Priorities during COVID-19 Pandemic − Due to the rapidly, evolving situation and the high degree of uncertainty, the Company is suspending fiscal 2020 full-year guidance. − The Company’s long-term strategy and algorithm remain unchanged. − Temporary but meaningful impact caused by: • A shift in mix from higher-margin single-serve products to multi-pack products • Incremental costs of supporting our employees on the front-lines at bakeries and distribution centers including incremental pay and benefits and implementation of additional safety and sanitation measures • Operational changes – modification of lines, production schedules, employee leave of absence, etc. We are proud of the dedication and resilience of our team as they react quickly and efficiently to the changing dynamics we are facing. Our capabilities and agility while continuing to drive growth and operational efficiencies give us confidence in our Company’s ability to emerge from this time stronger and better positioned for long-term sustained, profitable growth. 14
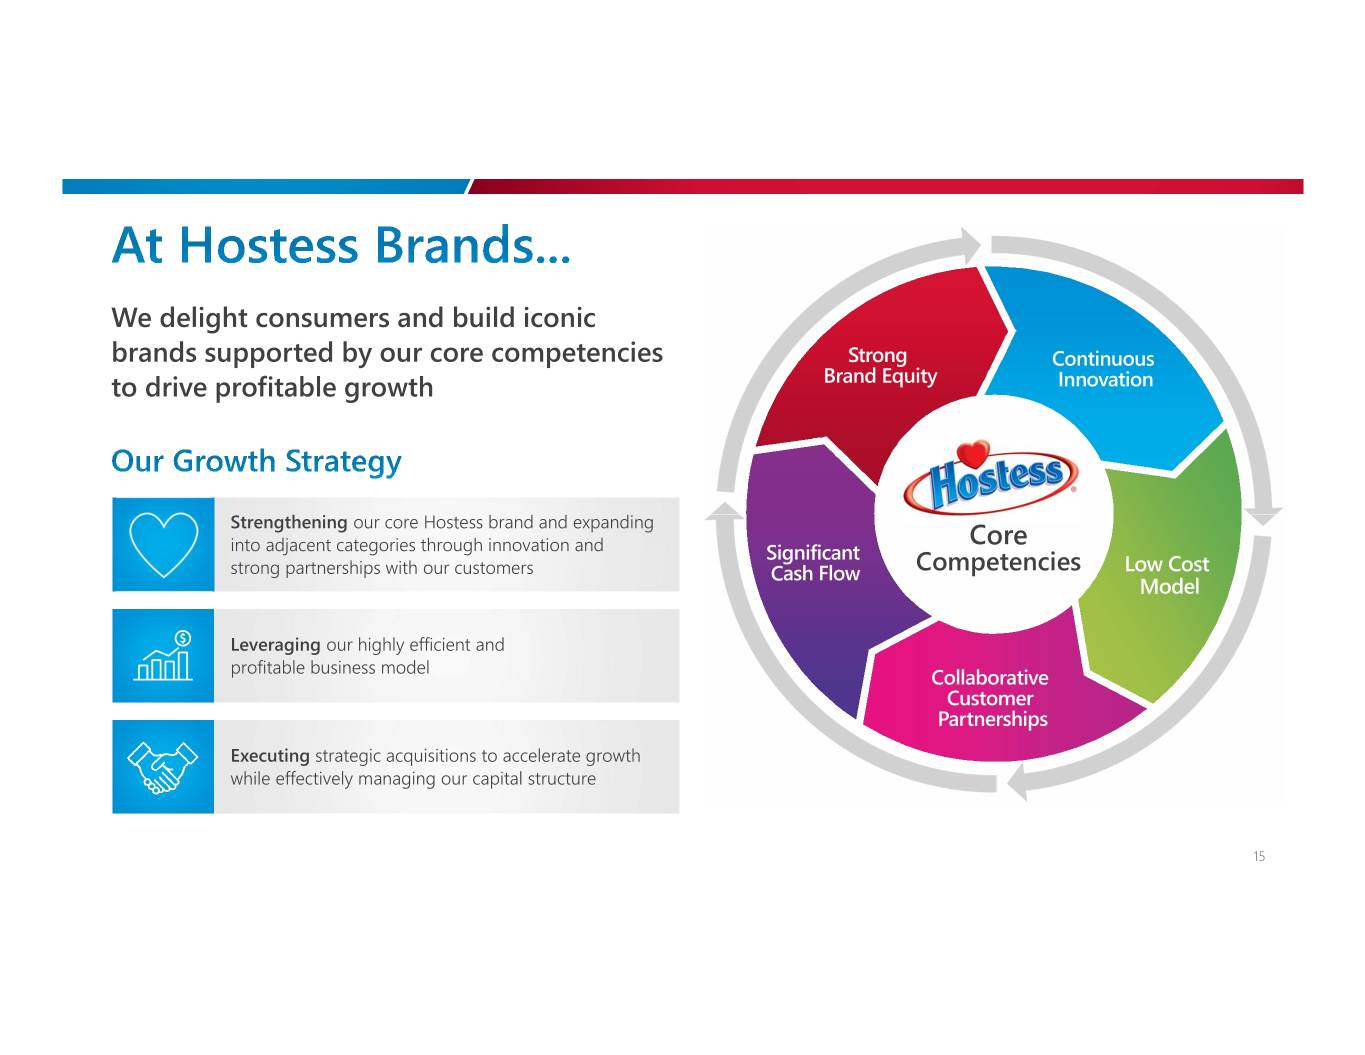
We delight consumers and build iconic brands supported by our core competencies Strong Continuous to drive profitable growth Brand Equity Innovation Strengthening our core Hostess brand and expanding Core into adjacent categories through innovation and Significant strong partnerships with our customers Cash Flow Competencies Low Cost Model Leveraging our highly efficient and profitable business model Collaborative Customer Partnerships Executing strategic acquisitions to accelerate growth while effectively managing our capital structure 15
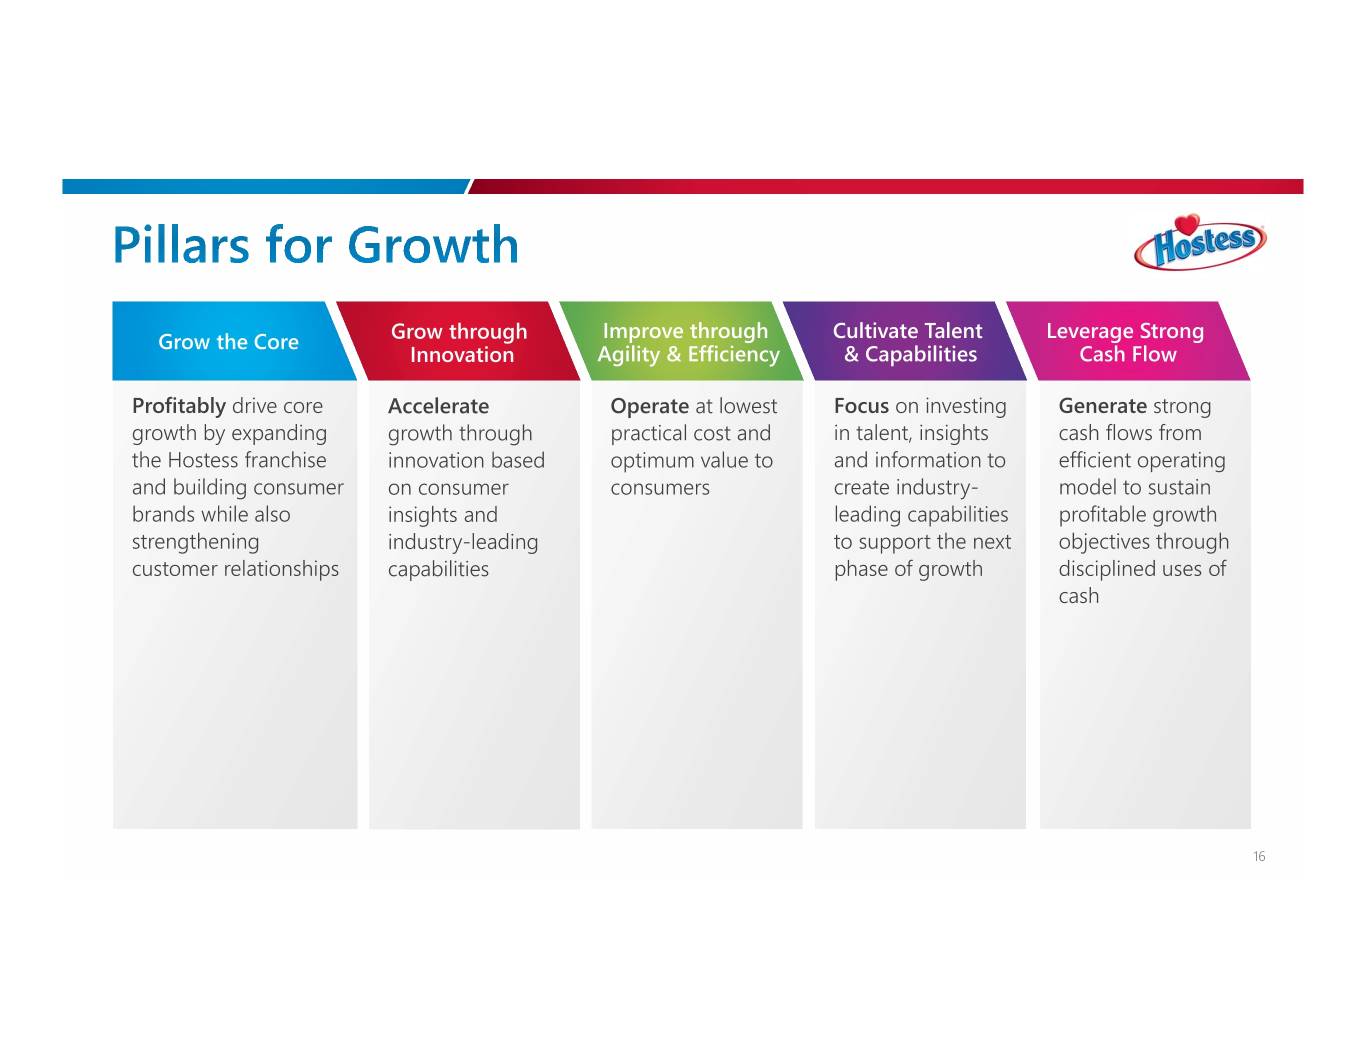
Improve through Cultivate Talent Leverage Strong Grow the Core Grow through Innovation Agility & Efficiency & Capabilities Cash Flow Profitably drive core Accelerate Operate at lowest Focus on investing Generate strong growth by expanding growth through practical cost and in talent, insights cash flows from the Hostess franchise innovation based optimum value to and information to efficient operating and building consumer on consumer consumers create industry- model to sustain brands while also insights and leading capabilities profitable growth strengthening industry-leading to support the next objectives through customer relationships capabilities phase of growth disciplined uses of cash 16
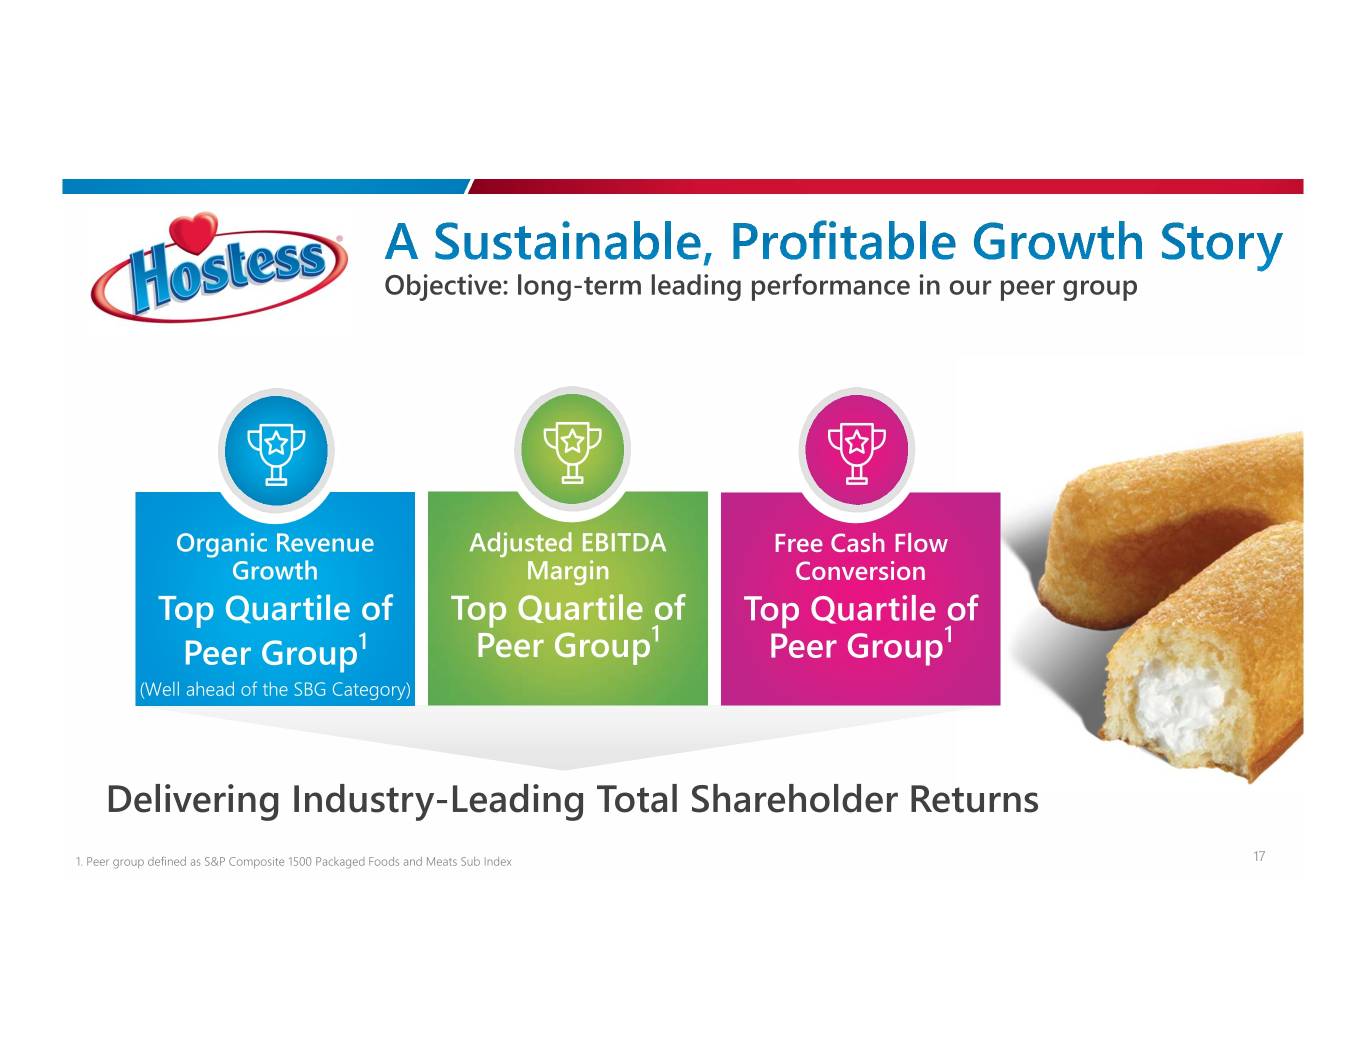
Objective: long-term leading performance in our peer group Organic Revenue Adjusted EBITDA Free Cash Flow Growth Margin Conversion Top Quartile of Top Quartile of Top Quartile of 1 1 Peer Group1 Peer Group Peer Group (Well ahead of the SBG Category) Delivering Industry-Leading Total Shareholder Returns 1. Peer group defined as S&P Composite 1500 Packaged Foods and Meats Sub Index 17
Appendix 18
19
