Attached files
| file | filename |
|---|---|
| 8-K - 8-K - CBTX, Inc. | tmb-20200430x8k.htm |
Exhibit 99.1
| CBTX, Inc. Investor Presentation First Quarter 2020 NASDAQ: CBTX |
| 2 SAFE HARBOR STATEMENT AND NON-GAAP FINANCIAL MEASURES NON-GAAP FINANCIAL MEASURES This presentation contains certain non-GAAP (generally accepted accounting principles) financial measures, including tangible equity, tangible assets, tangible book value per share, tangible equity to tangible assets, return on tangible shareholders’ equity and pre-provision net revenue. The non-GAAP financial measures that CBTX, Inc.(the “Company”) discusses in this presentation should not be considered in isolation or as a substitute for the most directly comparable or other financial measures calculated in accordance with GAAP.A reconciliation of the non-GAAP financial measures used in this presentation to the most directly comparable GAAP measures is provided at the end of this presentation. FORWARD LOOKING STATEMENTS This presentation may contain certain forward-looking statements within the meaning of the securities laws that are based on various facts and derived utilizing important assumptions, current expectations, estimates and projections about the Company and its subsidiary. Forward-looking statements include information regarding the Company’s future financial performance, business and growth strategy, projected plans and objectives, as well as projections of macroeconomic and industry trends, which are inherently unreliable due to the multiple factors that impact economic trends, and any such variations may be material. Statements preceded by, followed by or that otherwise include the words “believes,” “expects,” “anticipates,” “intends,” “projects,” “estimates,” “plans” and similar expressions or future or conditional verbs such as “will,” “should,” “would,” “may” and “could” are generally forward-looking in nature and not historical facts, although not all forward-looking statements include the foregoing. Further, certain factors that could affect our future results and cause actual results to differ materially from those expressed in the forward-looking statements include, but are not limited to: whether the Company can manage the economic risks related to the impact of COVID-19 and the recent drop in oil and gas prices (including risks related to its customers’ credit quality, the Company’s ability to borrow, and the impact of a resultant recession generally), and other hazards such as natural disasters and adverse weather, acts of war or terrorism, other pandemics, an outbreak of hostilities or other international or domestic calamities and the governmental or military response thereto, and other matters beyond the Company’s control; the geographic concentration of our markets in Beaumont and Houston, Texas; whether the Company can manage changes and the continued health or availability of management personnel; the amount of nonperforming and classified assets that the Company holds and the efforts to resolve the nonperforming assets; deterioration of its asset quality; interest rate risks associated with the Company’s business; business and economic conditions generally and in the financial services industry, nationally and within the Company’s primary markets; volatility and direction of oil prices, including risks related to the recent collapse in oil prices, and the strength of the energy industry, generally and within Texas; the composition of the Company’s loan portfolio, including the identity of its borrowers and the concentration of loans in specialized industries, especially the creditworthiness of energy company borrowers; changes in the value of collateral securing the loans; the Company’s ability to maintain important deposit customer relationships and the Company’s reputation; the Company’s ability to maintain effective internal control over financial reporting; the Company’s ability to pursue available remedies in the event of a loan default for loans under the Payment Protection Program (“PPP”) and the risk of holding the PPP loans at unfavorable interest rates as compared to the loans to customers that we would have otherwise lent to; the volatility and direction of market interest rates; liquidity risks associated with the Company’s business; systems failures, interruptions or breaches involving the Company’s information technology and telecommunications systems or third-party servicers; the failure of certain third party vendors to perform; the institution and outcome of litigation and other legal proceedings against the Company or to which it may become subject; operational risks associated with the Company’s business; the costs, effects and results of regulatory examinations, investigations, including the ongoing investigation by the Financial Crimes Enforcement Network, or FinCEN, of the U.S. Department of Treasury, or reviews or the ability to obtain the required regulatory approvals; changes in the laws, rules, regulations, interpretations or policies relating to financial institution, accounting, tax, trade, monetary and fiscal matters; governmental or regulatory responses to the COVID-19 pandemic and newly enacted fiscal stimulus that impact the Company’s loan portfolio and forbearance practice; and other governmental interventions in the U.S. financial system that may impact how the Company achieves its performance goals. Additionally, many of these risks and uncertainties are currently elevated by and may or will continue to be elevated by the COVID-19 pandemic. The foregoing factors should not be construed as exhaustive and should be read together with the other cautionary statements included in the Company’s Annual Report on Form 10-K, filed with the Securities and Exchange Commission (“SEC”) and other reports and statements that the Company has filed with the SEC. If one or more events related to these or other risks or uncertainties materialize, or if the Company’s underlying assumptions prove to be incorrect, actual results may differ materially from what it anticipates. Accordingly, you should not place undue reliance on any such forward looking statements. Any forward-looking statement speaks only as of the date on which it is made, and the Company does not undertake any obligation to publicly update or review any forward- looking statement, whether as a result of new information, future developments or otherwise. New factors emerge from time to time, and it is not possible for the Company to predict which will arise. In addition, the Company cannot assess the impact of each factor on its business or the extent to which any factor, or combination of factors, may cause actual results to differ materially from those contained in any forward-looking statements. Copies of the SEC filings for the Company are available for download free of charge from www.communitybankoftx.com under the Investor Relations tab. All forward-looking statements, expressed or implied, included in this communication are expressly qualified in their entirety by this cautionary statement. This cautionary statement should also be considered in connection with any subsequent written or oral forward-looking statements that the Company or persons acting on the Company’s behalf may issue. Annualized, pro forma, projected and estimated numbers are used for illustrative purpose only, are not forecasts and may not reflect actual results. |
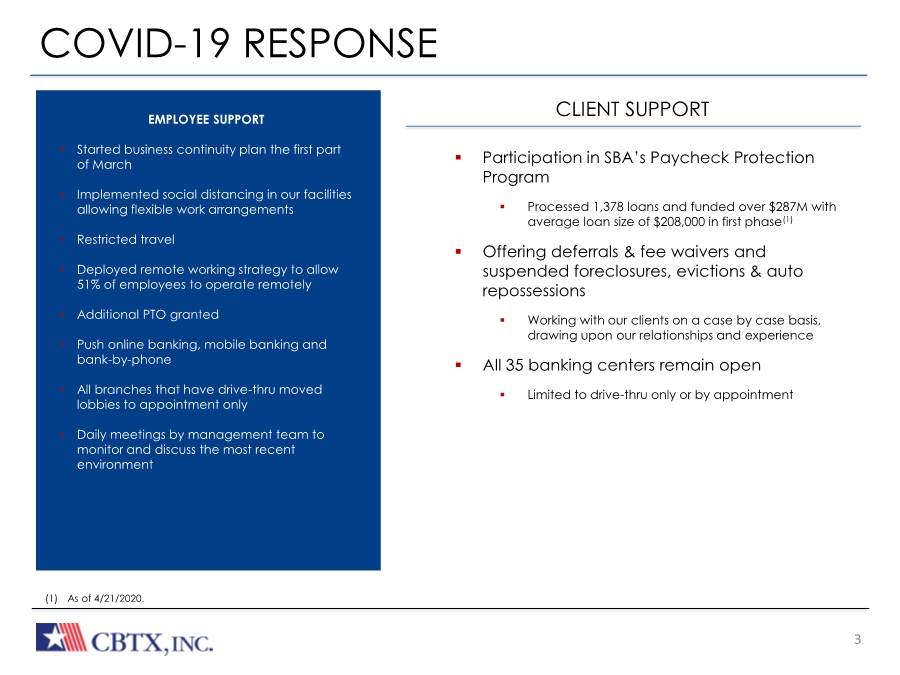
| 3 COVID-19 RESPONSE ▪ Participation in SBA’s Paycheck Protection Program ▪ Processed 1,378 loans and funded over $287M with average loan size of $208,000 in first phase(1) ▪ Offering deferrals & fee waivers and suspended foreclosures, evictions & auto repossessions ▪ Working with our clients on a case by case basis, drawing upon our relationships and experience ▪ All 35 banking centers remain open ▪ Limited to drive-thru only or by appointment EMPLOYEE SUPPORT • Started business continuity plan the first part of March • Implemented social distancing in our facilities allowing flexible work arrangements • Restricted travel • Deployed remote working strategy to allow 51% of employees to operate remotely • Additional PTO granted • Push online banking, mobile banking and bank-by-phone • All branches that have drive-thru moved lobbies to appointment only • Daily meetings by management team to monitor and discuss the most recent environment CLIENT SUPPORT (1) As of 4/21/2020. |
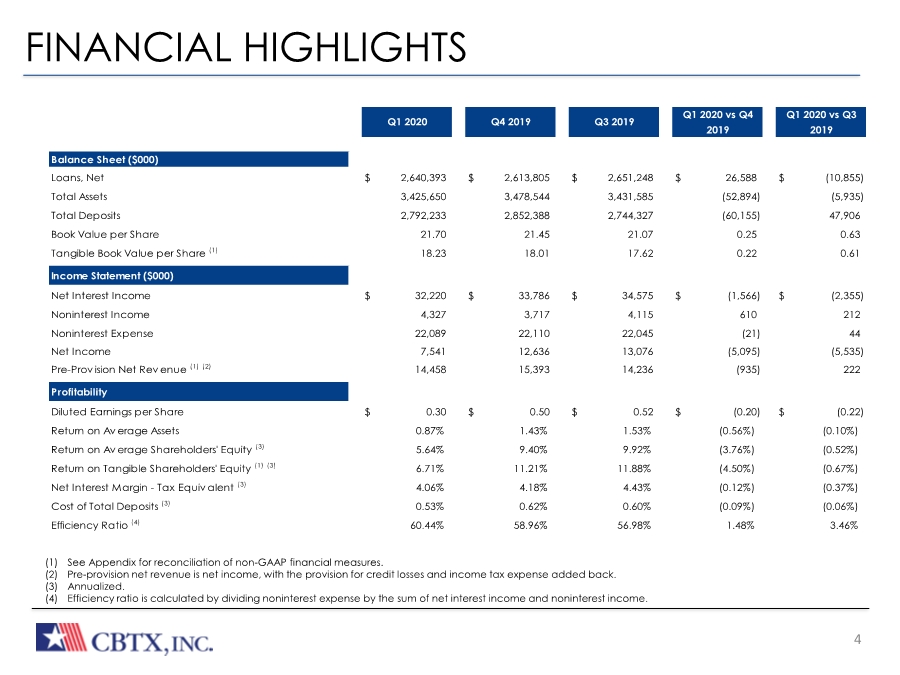
| 4 FINANCIAL HIGHLIGHTS (1) See Appendix for reconciliation of non-GAAP financial measures. (2) Pre-provision net revenue is net income, with the provision for credit losses and income tax expense added back. (3) Annualized. (4) Efficiency ratio is calculated by dividing noninterest expense by the sum of net interest income and noninterest income. Balance Sheet ($000) Loans, Net $ 2,640,393 $ 2,613,805 $ 2,651,248 $ 26,588 $ (10,855) Total Assets 3,425,650 3,478,544 3,431,585 (52,894) (5,935) Total Deposits 2,792,233 2,852,388 2,744,327 (60,155) 47,906 Book Value per Share 21.70 21.45 21.07 0.25 0.63 Tangible Book Value per Share (1) 18.23 18.01 17.62 0.22 0.61 Income Statement ($000) Net Interest Income $ 32,220 $ 33,786 $ 34,575 $ (1,566) $ (2,355) Noninterest Income 4,327 3,717 4,115 610 212 Noninterest Expense 22,089 22,110 22,045 (21) 44 Net Income 7,541 12,636 13,076 (5,095) (5,535) Pre-Prov ision Net Rev enue (1) (2) 14,458 15,393 14,236 (935) 222 Profitability Diluted Earnings per Share $ 0.30 $ 0.50 $ 0.52 $ (0.20) $ (0.22) Return on Average Assets 0.87% 1.43% 1.53% (0.56%) (0.10%) Return on Average Shareholders' Equity (3) 5.64% 9.40% 9.92% (3.76%) (0.52%) Return on Tangible Shareholders' Equity (1) (3) 6.71% 11.21% 11.88% (4.50%) (0.67%) Net Interest Margin - Tax Equiv alent (3) 4.06% 4.18% 4.43% (0.12%) (0.37%) Cost of Total Deposits (3) 0.53% 0.62% 0.60% (0.09%) (0.06%) Efficiency Ratio (4) 60.44% 58.96% 56.98% 1.48% 3.46% Q1 2020 Q4 2019 Q3 2019 Q1 2020 vs Q4 2019 Q1 2020 vs Q3 2019 |
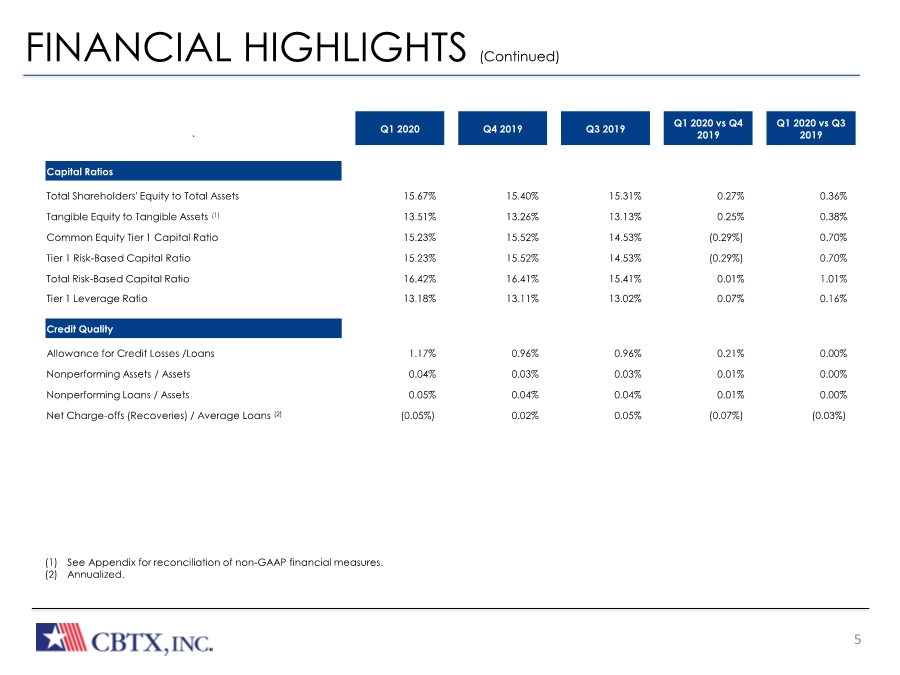
| 5 FINANCIAL HIGHLIGHTS (Continued) (1) See Appendix for reconciliation of non-GAAP financial measures. (2) Annualized. ` Q1 2020 Q4 2019 Q3 2019 Q1 2020 vs Q4 2019 Q1 2020 vs Q3 2019 Capital Ratios Total Shareholders' Equity to Total Assets 15.67% 15.40% 15.31% 0.27% 0.36% Tangible Equity to Tangible Assets (1) 13.51% 13.26% 13.13% 0.25% 0.38% Common Equity Tier 1 Capital Ratio 15.23% 15.52% 14.53% (0.29%) 0.70% Tier 1 Risk-Based Capital Ratio 15.23% 15.52% 14.53% (0.29%) 0.70% Total Risk-Based Capital Ratio 16.42% 16.41% 15.41% 0.01% 1.01% Tier 1 Leverage Ratio 13.18% 13.11% 13.02% 0.07% 0.16% Credit Quality Allowance for Credit Losses /Loans 1.17% 0.96% 0.96% 0.21% 0.00% Nonperforming Assets / Assets 0.04% 0.03% 0.03% 0.01% 0.00% Nonperforming Loans / Assets 0.05% 0.04% 0.04% 0.01% 0.00% Net Charge-offs (Recoveries) / Average Loans (2) (0.05%) 0.02% 0.05% (0.07%) (0.03%) |
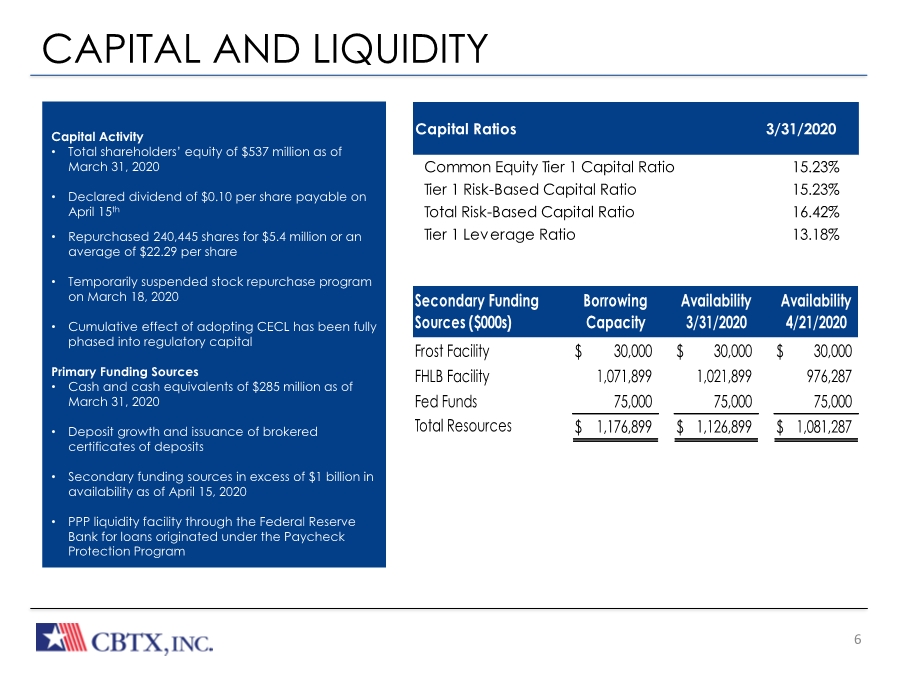
| The Bank Built or Business CAPITAL AND LIQUIDITY 6 REVENUE GROWH • Stable net interest margin (NIM) • Asset sensitive, with 54% variable rate loans as of March 31, 2020 • Increasing revenue and improving efficiency ratio (2) Capital Activity • Total shareholders’ equity of $537 million as of March 31, 2020 • Declared dividend of $0.10 per share payable on April 15th • Repurchased 240,445 shares for $5.4 million or an average of $22.29 per share • Temporarily suspended stock repurchase program on March 18, 2020 • Cumulative effect of adopting CECL has been fully phased into regulatory capital Primary Funding Sources • Cash and cash equivalents of $285 million as of March 31, 2020 • Deposit growth and issuance of brokered certificates of deposits • Secondary funding sources in excess of $1 billion in availability as of April 15, 2020 • PPP liquidity facility through the Federal Reserve Bank for loans originated under the Paycheck Protection Program Common Equity Tier 1 Capital Ratio 15.23% Tier 1 Risk-Based Capital Ratio 15.23% Total Risk-Based Capital Ratio 16.42% Tier 1 Leverage Ratio 13.18% Capital Ratios 3/31/2020 Frost Facility $ 30,000 $ 30,000 $ 30,000 FHLB Facility 1,071,899 1,021,899 976,287 Fed Funds 75,000 75,000 75,000 Total Resources $ 1,176,899 $ 1,126,899 $ 1,081,287 Secondary Funding Sources ($000s) Borrowing Capacity Availability 3/31/2020 Availability 4/21/2020 |
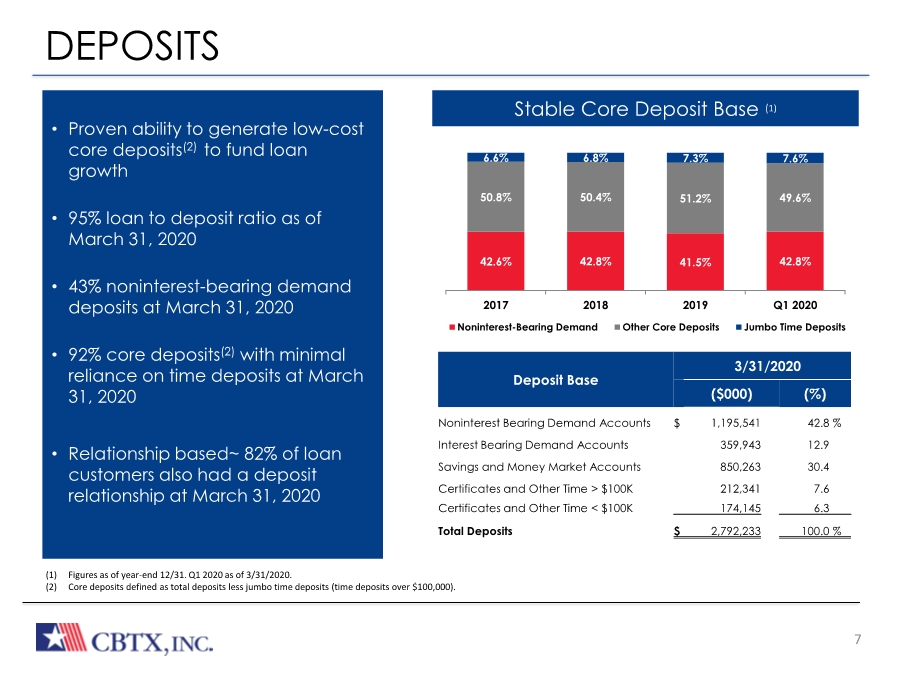
| The Bank Built or Business DEPOSITS 7 Stable Core Deposit Base (1) • Proven ability to generate low-cost core deposits(2) to fund loan growth • 95% loan to deposit ratio as of March 31, 2020 • 43% noninterest-bearing demand deposits at March 31, 2020 • 92% core deposits(2) with minimal reliance on time deposits at March 31, 2020 • Relationship based~ 82% of loan customers also had a deposit relationship at March 31, 2020 (1) Figures as of year-end 12/31. Q1 2020 as of 3/31/2020. (2) Core deposits defined as total deposits less jumbo time deposits (time deposits over $100,000). 42.6% 42.8% 41.5% 42.8% 50.8% 50.4% 51.2% 49.6% 6.6% 6.8% 7.3% 7.6% 2017 2018 2019 Q1 2020 Noninterest-Bearing Demand Other Core Deposits Jumbo Time Deposits Deposit Base 3/31/2020 ($000) (%) Noninterest Bearing Demand Accounts $ 1,195,541 42.8 % Interest Bearing Demand Accounts 359,943 12.9 Savings and Money Market Accounts 850,263 30.4 Certificates and Other Time > $100K 212,341 7.6 Certificates and Other Time < $100K 174,145 6.3 Total Deposits $ 2,792,233 100.0 % |
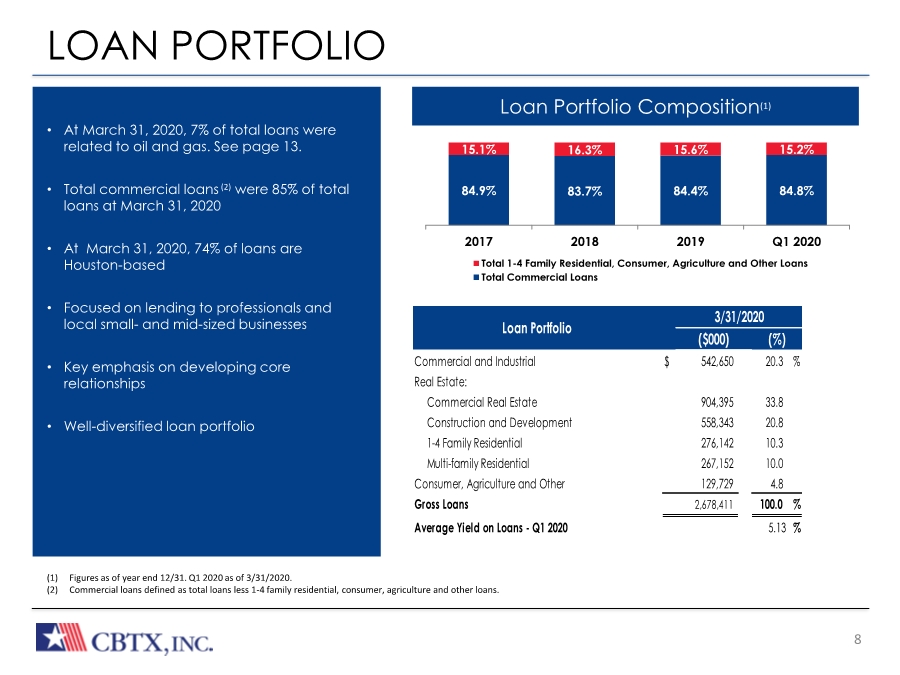
| The Bank Built or Business 8 Loan Portfolio Composition(1) (1) Figures as of year end 12/31. Q1 2020 as of 3/31/2020. (2) Commercial loans defined as total loans less 1-4 family residential, consumer, agriculture and other loans. LOAN PORTFOLIO • At March 31, 2020, 7% of total loans were related to oil and gas. See page 13. • Total commercial loans (2) were 85% of total loans at March 31, 2020 • At March 31, 2020, 74% of loans are Houston-based • Focused on lending to professionals and local small- and mid-sized businesses • Key emphasis on developing core relationships • Well-diversified loan portfolio 84.9% 83.7% 84.4% 84.8% 15.1% 16.3% 15.6% 15.2% 2017 2018 2019 Q1 2020 Total 1-4 Family Residential, Consumer, Agriculture and Other Loans Total Commercial Loans Commercial and Industrial $ 542,650 20.3 % Real Estate: Commercial Real Estate 904,395 33.8 Construction and Development 558,343 20.8 1-4 Family Residential 276,142 10.3 Multi-family Residential 267,152 10.0 Consumer, Agriculture and Other 129,729 4.8 Gross Loans 2,678,411 100.0 % Average Yield on Loans - Q1 2020 5.13 % 3/31/2020 (%) Loan Portfolio ($000) |
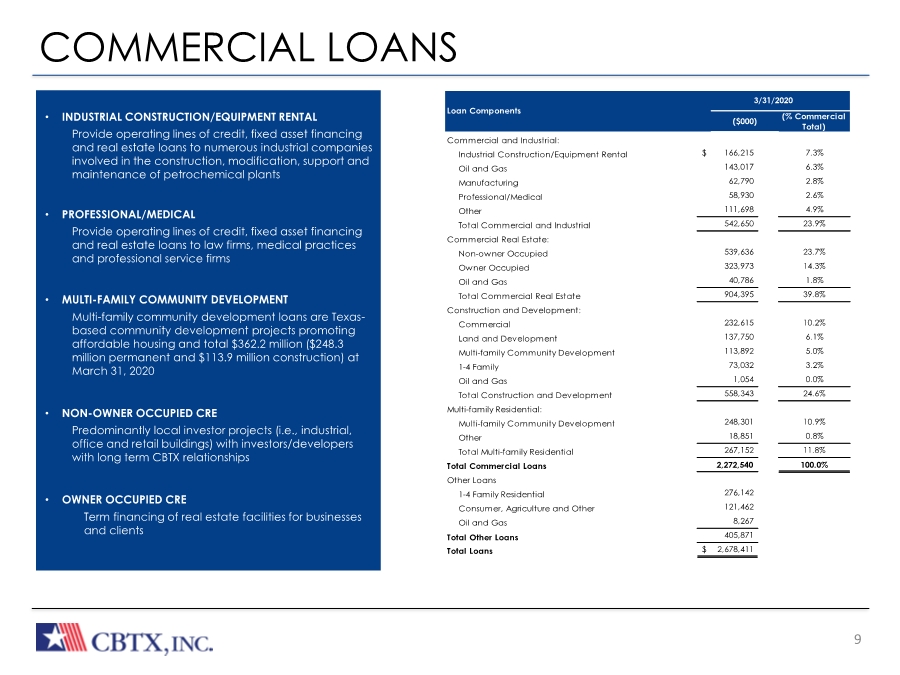
| The Bank Built or Business COMMERCIAL LOANS 9 • INDUSTRIAL CONSTRUCTION/EQUIPMENT RENTAL Provide operating lines of credit, fixed asset financing and real estate loans to numerous industrial companies involved in the construction, modification, support and maintenance of petrochemical plants • PROFESSIONAL/MEDICAL Provide operating lines of credit, fixed asset financing and real estate loans to law firms, medical practices and professional service firms • MULTI-FAMILY COMMUNITY DEVELOPMENT Multi-family community development loans are Texas- based community development projects promoting affordable housing and total $362.2 million ($248.3 million permanent and $113.9 million construction) at March 31, 2020 • NON-OWNER OCCUPIED CRE Predominantly local investor projects (i.e., industrial, office and retail buildings) with investors/developers with long term CBTX relationships • OWNER OCCUPIED CRE Term financing of real estate facilities for businesses and clients Multi-family ($418M) (% Commercial Total) Commercial and Industrial: Industrial Construction/Equipment Rental $ 166,215 7.3% Oil and Gas 143,017 6.3% Manufacturing 62,790 2.8% Professional/Medical 58,930 2.6% Other 111,698 4.9% Total Commercial and Industrial 542,650 23.9% Commercial Real Estate: Non-owner Occupied 539,636 23.7% Owner Occupied 323,973 14.3% Oil and Gas 40,786 1.8% Total Commercial Real Estate 904,395 39.8% Construction and Development: Commercial 232,615 10.2% Land and Development 137,750 6.1% Multi-family Community Development 113,892 5.0% 1-4 Family 73,032 3.2% Oil and Gas 1,054 0.0% Total Construction and Development 558,343 24.6% Multi-family Residential: Multi-family Community Development 248,301 10.9% Other 18,851 0.8% Total Multi-family Residential 267,152 11.8% Total Commercial Loans 2,272,540 100.0% Other Loans 1-4 Family Residential 276,142 Consumer, Agriculture and Other 121,462 Oil and Gas 8,267 Total Other Loans 405,871 Total Loans $ 2,678,411 Loan Components ($000) 3/31/2020 |
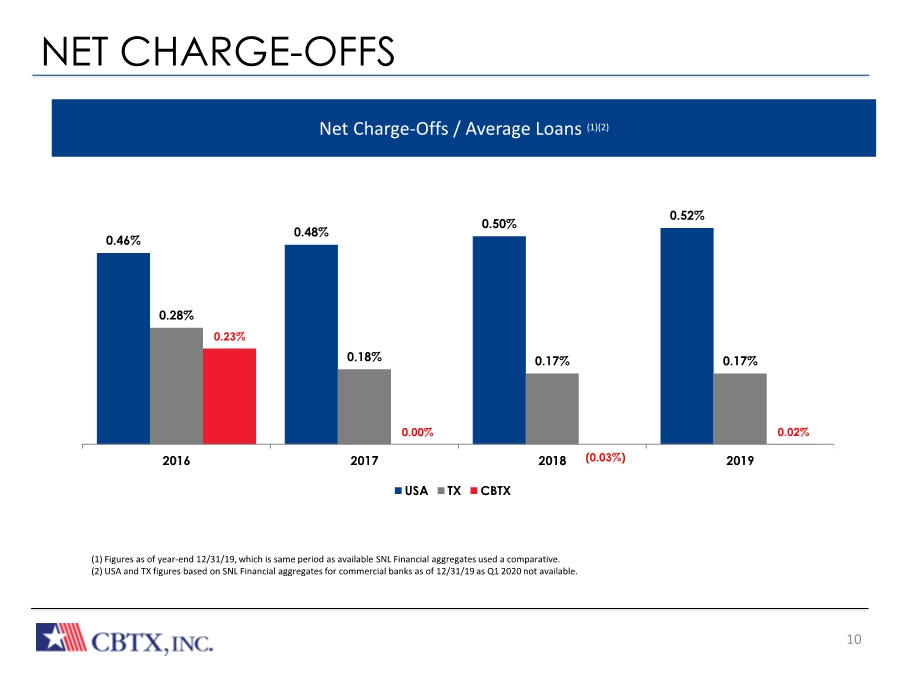
| The Bank Built or Business NET CHARGE-OFFS 10 • CHIEF CREDIT OFFICER WITH 40 YEARS OF EXPERIENCE Seasoned Regional Credit Officers located in Houston and Beaumont • CENTRALIZED UNDERWRITING, TIERED APPROVAL REUIREMENT BASED ON AGGREGATED REALTIONSHIP SIZE Officer credit authority, credit executive committee, and directors’ loan committee Directors’ loan committee meets weekly in each market • RECEIVE PERSONAL GUARANTEES FROM PRINCIPALS ON THE MAJORITY OF COMMERCIAL CREDITS Net Charge-Offs / Average Loans (1)(2) 0.46% 0.48% 0.50% 0.52% 0.28% 0.18% 0.17% 0.17% 0.23% 0.00% (0.03%) 0.02% 2016 2017 2018 2019 USA TX CBTX (1) Figures as of year-end 12/31/19, which is same period as available SNL Financial aggregates used a comparative. (2) USA and TX figures based on SNL Financial aggregates for commercial banks as of 12/31/19 as Q1 2020 not available. |
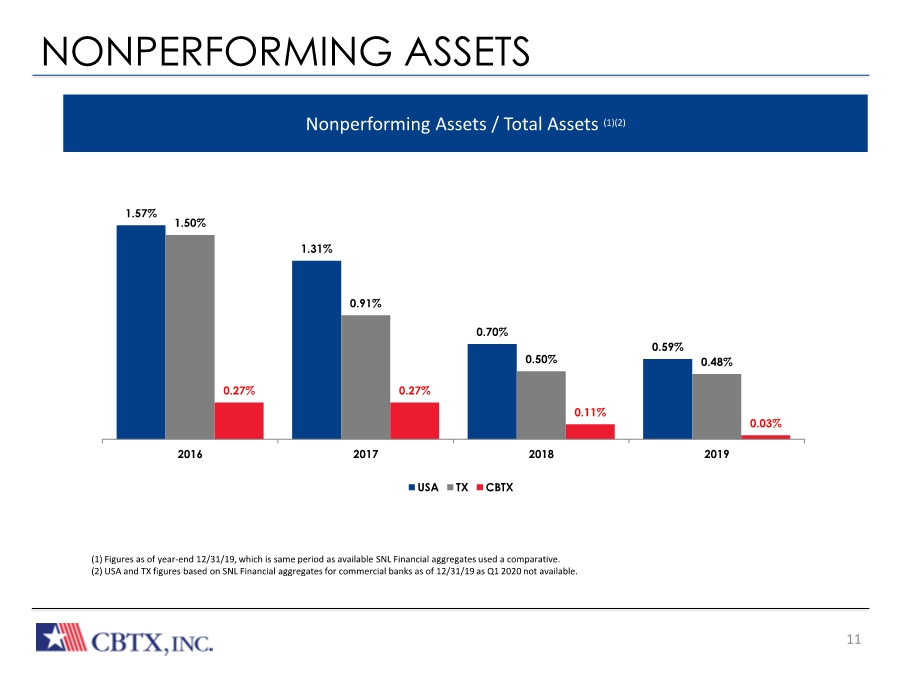
| The Bank Built or Business NONPERFORMING ASSETS 11 • CHIEF CREDIT OFFICER WITH 40 YEARS OF EXPERIENCE Seasoned Regional Credit Officers located in Houston and Beaumont • CENTRALIZED UNDERWRITING, TIERED APPROVAL REUIREMENT BASED ON AGGREGATED REALTIONSHIP SIZE Officer credit authority, credit executive committee, and directors’ loan committee Directors’ loan committee meets weekly in each market • RECEIVE PERSONAL GUARANTEES FROM PRINCIPALS ON THE MAJORITY OF COMMERCIAL CREDITS Nonperforming Assets / Total Assets (1)(2) (1) Figures as of year-end 12/31/19, which is same period as available SNL Financial aggregates used a comparative. (2) USA and TX figures based on SNL Financial aggregates for commercial banks as of 12/31/19 as Q1 2020 not available. 1.57% 1.31% 0.70% 0.59% 1.50% 0.91% 0.50% 0.48% 0.27% 0.27% 0.11% 0.03% 2016 2017 2018 2019 USA TX CBTX |
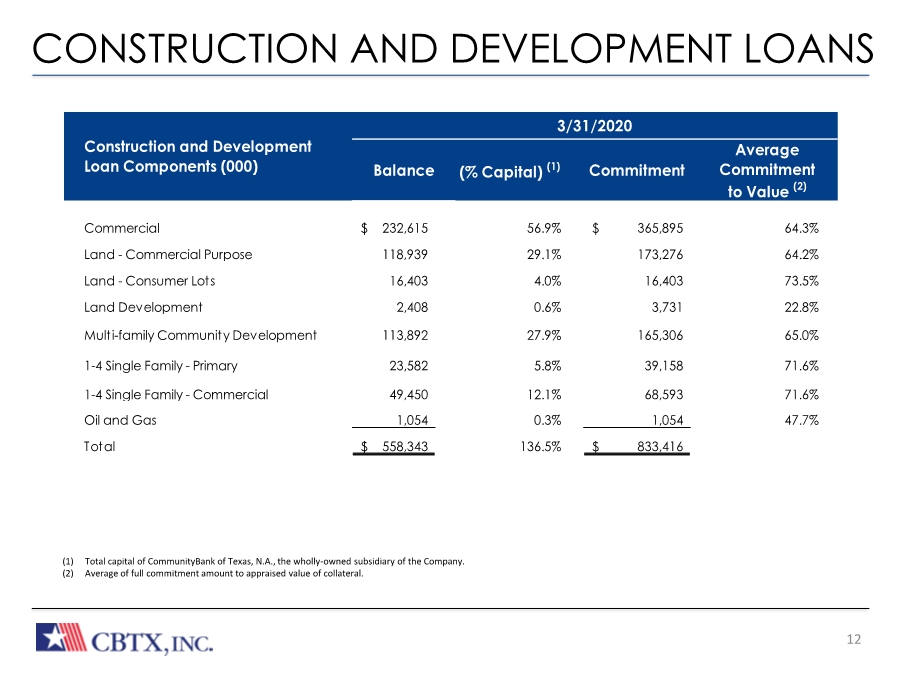
| The Bank Built or Business CONSTRUCTION AND DEVELOPMENT LOANS 12 (1) Total capital of CommunityBank of Texas, N.A., the wholly-owned subsidiary of the Company. (2) Average of full commitment amount to appraised value of collateral. (% Capital) (1) Commitment Average Commitment to Value (2) Commercial 232,615 $ 56.9% 365,895 $ 64.3% Land - Commercial Purpose 118,939 29.1% 173,276 64.2% Land - Consumer Lots 16,403 4.0% 16,403 73.5% Land Development 2,408 0.6% 3,731 22.8% Multi-family Community Development 113,892 27.9% 165,306 65.0% 1-4 Single Family - Primary 23,582 5.8% 39,158 71.6% 1-4 Single Family - Commercial 49,450 12.1% 68,593 71.6% Oil and Gas 1,054 0.3% 1,054 47.7% Total 558,343 $ 136.5% 833,416 $ 3/31/2020 Construction and Development Loan Components (000) Balance |
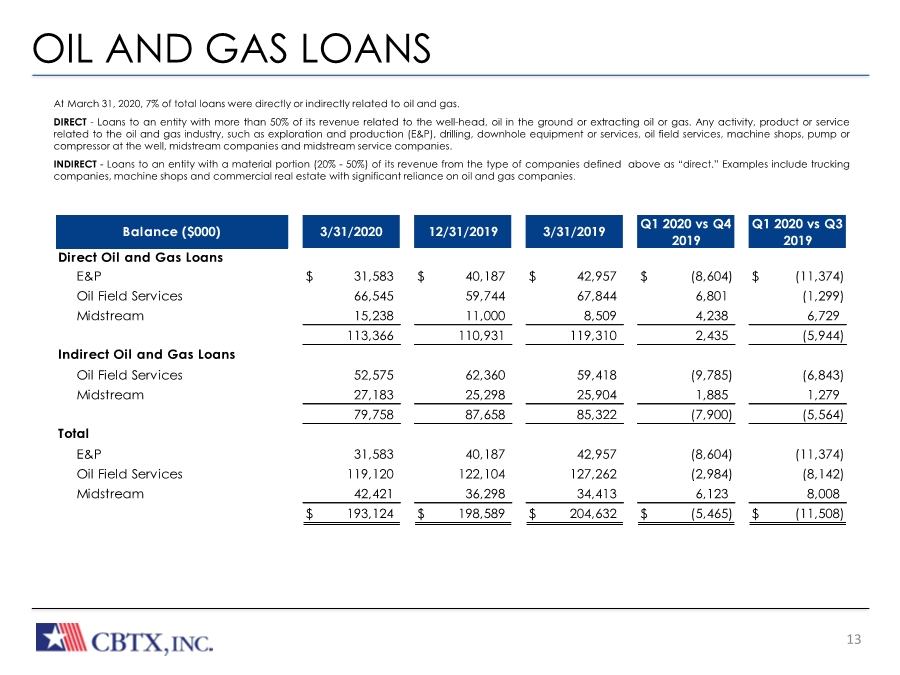
| The Bank Built or Business OIL AND GAS LOANS 13 • At March 31, 2020, 7% of total loans were directly or indirectly related to oil and gas. • DIRECT - Loans to an entity with more than 50% of its revenue related to the well-head, oil in the ground or extracting oil or gas. Any activity, product or service related to the oil and gas industry, such as exploration and production (E&P), drilling, downhole equipment or services, oil field services, machine shops, pump or compressor at the well, midstream companies and midstream service companies. • INDIRECT - Loans to an entity with a material portion (20%- 50%) of its revenue from the type of companies defined above as “direct.” Examples include trucking companies, machine shops and commercial real estate with significant reliance on oil and gas companies. Balance ($000) Direct Oil and Gas Loans E&P $ 31,583 $ 40,187 $ 42,957 $ (8,604) $ (11,374) Oil Field Services 66,545 59,744 67,844 6,801 (1,299) Midstream 15,238 11,000 8,509 4,238 6,729 113,366 110,931 119,310 2,435 (5,944) Indirect Oil and Gas Loans Oil Field Services 52,575 62,360 59,418 (9,785) (6,843) Midstream 27,183 25,298 25,904 1,885 1,279 79,758 87,658 85,322 (7,900) (5,564) Total E&P 31,583 40,187 42,957 (8,604) (11,374) Oil Field Services 119,120 122,104 127,262 (2,984) (8,142) Midstream 42,421 36,298 34,413 6,123 8,008 $ 193,124 $ 198,589 $ 204,632 $ (5,465) $ (11,508) 3/31/2020 12/31/2019 3/31/2019 Q1 2020 vs Q4 2019 Q1 2020 vs Q3 2019 |
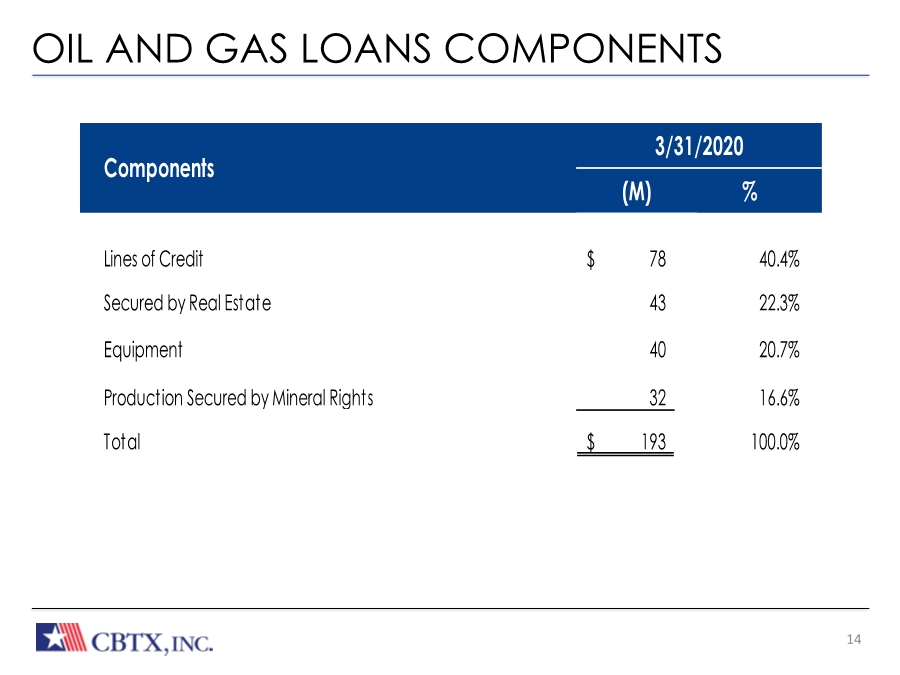
| The Bank Built or Business OIL AND GAS LOANS COMPONENTS 14 % Lines of Credit 78 $ 40.4% Secured by Real Estate 43 22.3% Equipment 40 20.7% Production Secured by Mineral Rights 32 16.6% Total 193 $ 100.0% Components 3/31/2020 (M) |
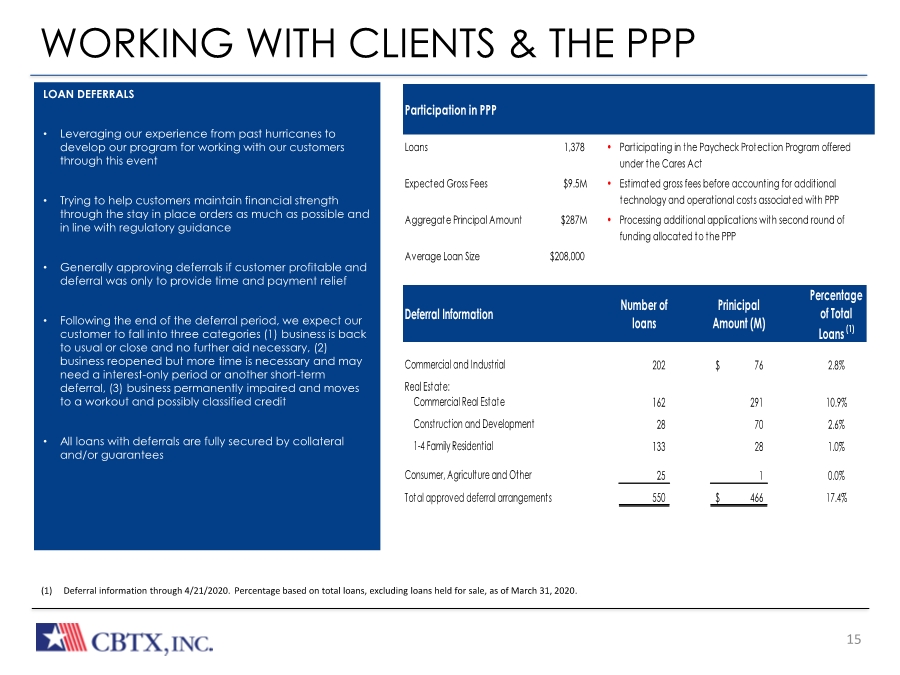
| 15 WORKING WITH CLIENTS & THE PPP (1) Deferral information through 4/21/2020. Percentage based on total loans, excluding loans held for sale, as of March 31, 2020. Deferral Information Number of loans Prinicipal Amount (M) Percentage of Total Loans (1) Commercial and Industrial 202 76 $ 2.8% Real Estate: Commercial Real Estate 162 291 10.9% Construction and Development 28 70 2.6% 1-4 Family Residential 133 28 1.0% Consumer, Agriculture and Other 25 1 0.0% Total approved deferral arrangements 550 466 $ 17.4% LOAN DEFERRALS • Leveraging our experience from past hurricanes to develop our program for working with our customers through this event • Trying to help customers maintain financial strength through the stay in place orders as much as possible and in line with regulatory guidance • Generally approving deferrals if customer profitable and deferral was only to provide time and payment relief • Following the end of the deferral period, we expect our customer to fall into three categories (1) business is back to usual or close and no further aid necessary, (2) business reopened but more time is necessary and may need a interest-only period or another short-term deferral, (3) business permanently impaired and moves to a workout and possibly classified credit • All loans with deferrals are fully secured by collateral and/or guarantees Participation in PPP Loans 1,378 • Participating in the Paycheck Protection Program offered under the Cares Act Expected Gross Fees $9.5M • Estimated gross fees before accounting for additional technology and operational costs associated with PPP Aggregate Principal Amount $287M • Processing additional applications with second round of funding allocated to the PPP Average Loan Size 208,000 $ |
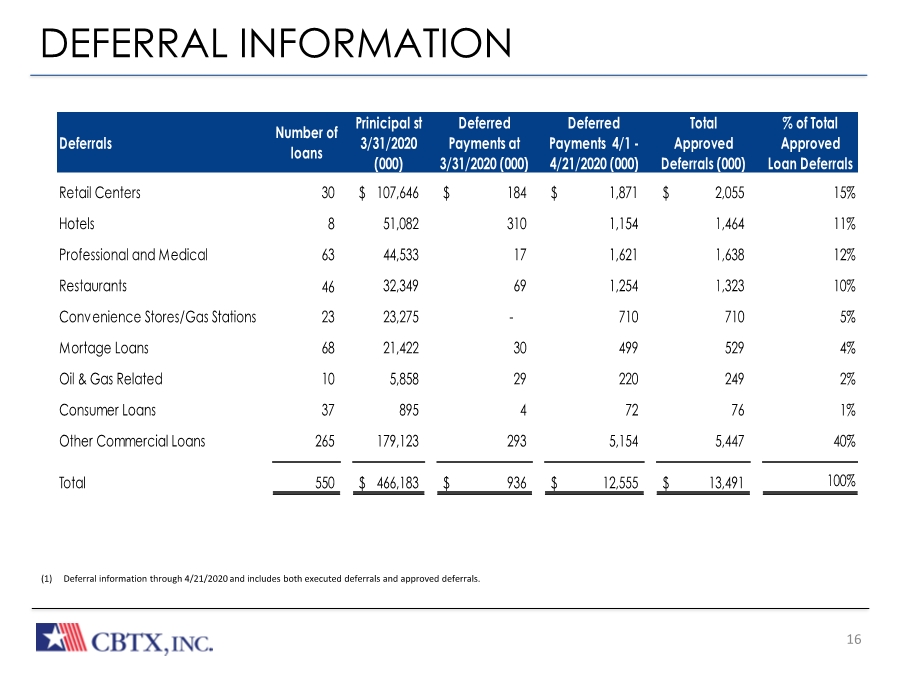
| 16 DEFERRAL INFORMATION (1) Deferral information through 4/21/2020 and includes both executed deferrals and approved deferrals. Deferrals Number of loans Prinicipal st 3/31/2020 (000) Deferred Payments at 3/31/2020 (000) Deferred Payments 4/1 - 4/21/2020 (000) Total Approved Deferrals (000) % of Total Approved Loan Deferrals Retail Centers 30 107,646 $ 184 $ 1,871 $ 2,055 $ 15% Hotels 8 51,082 310 1,154 1,464 11% Professional and Medical 63 44,533 17 1,621 1,638 12% Restaurants 46 32,349 69 1,254 1,323 10% Convenience Stores/Gas Stations 23 23,275 - 710 710 5% Mortage Loans 68 21,422 30 499 529 4% Oil & Gas Related 10 5,858 29 220 249 2% Consumer Loans 37 895 4 72 76 1% Other Commercial Loans 265 179,123 293 5,154 5,447 40% Total 550 466,183 $ 936 $ 12,555 $ 13,491 $ 100% |
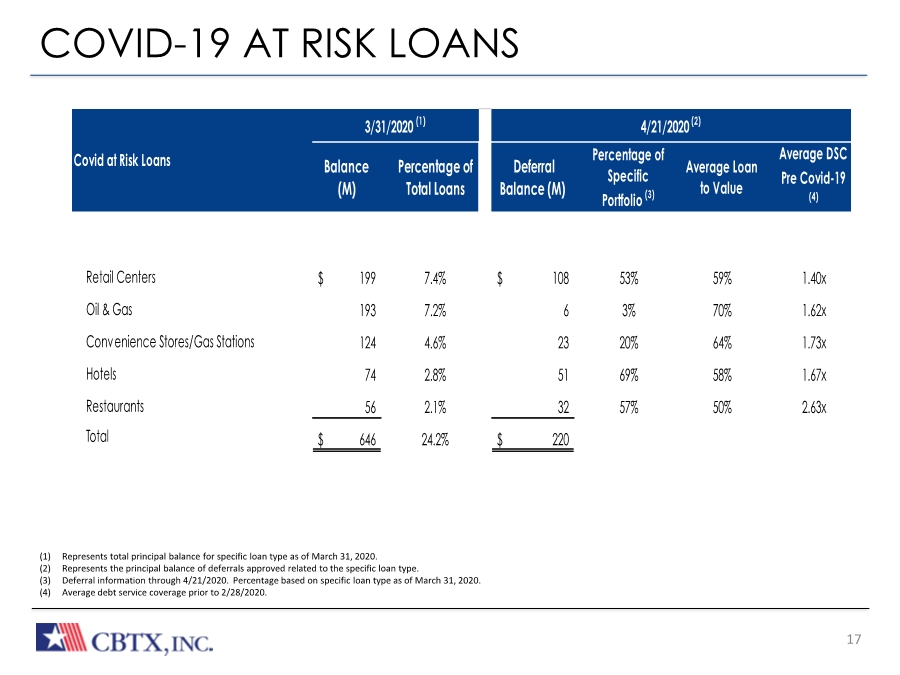
| 17 COVID-19 AT RISK LOANS (1) Represents total principal balance for specific loan type as of March 31, 2020. (2) Represents the principal balance of deferrals approved related to the specific loan type. (3) Deferral information through 4/21/2020. Percentage based on specific loan type as of March 31, 2020. (4) Average debt service coverage prior to 2/28/2020. Percentage of Total Loans Deferral Balance (M) Percentage of Specific Portfolio (3) Average Loan to Value Average DSC Pre Covid-19 (4) Retail Centers 199 $ 7.4% 108 $ 53% 59% 1.40x Oil & Gas 193 7.2% 6 3% 70% 1.62x Convenience Stores/Gas Stations 124 4.6% 23 20% 64% 1.73x Hotels 74 2.8% 51 69% 58% 1.67x Restaurants 56 2.1% 32 57% 50% 2.63x Total 646 $ 24.2% 220 $ 3/31/2020 (1) Covid at Risk Loans Balance (M) 4/21/2020 (2) |
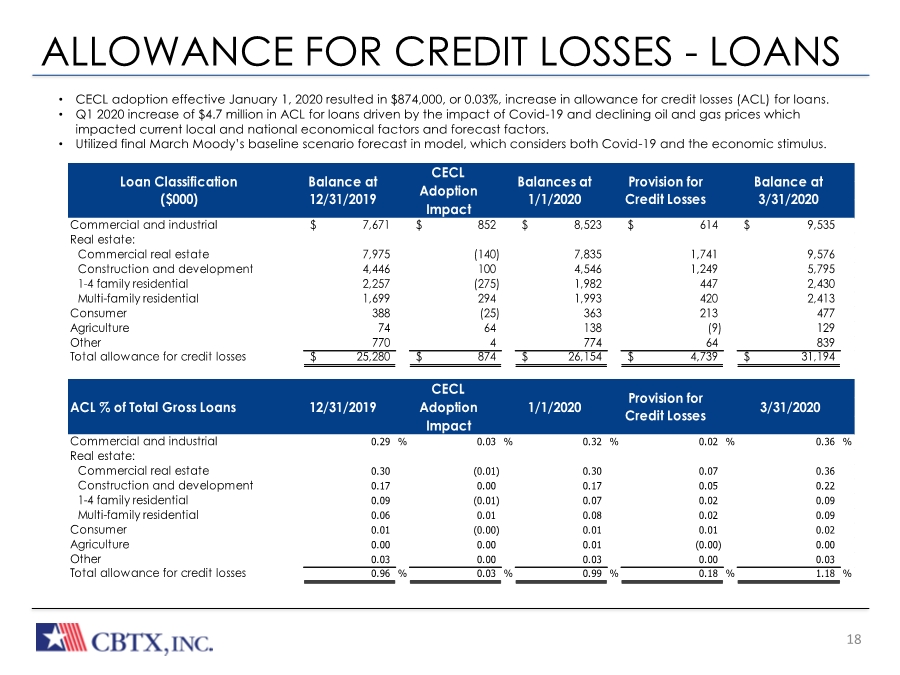
| The Bank Built or Business ALLOWANCE FOR CREDIT LOSSES - LOANS 18 • CHIEF CREDIT OFFICER WITH 40 YEARS OF EXPERIENCE Seasoned Regional Credit Officers located in Houston and Beaumont • CENTRALIZED UNDERWRITING, TIERED APPROVAL REUIREMENT BASED ON AGGREGATED REALTIONSHIP SIZE Officer credit authority, credit executive committee, and directors’ loan committee Directors’ loan committee meets weekly in each market • RECEIVE PERSONAL GUARANTEES FROM PRINCIPALS ON THE MAJORITY OF COMMERCIAL CREDITS • CECL adoption effective January 1, 2020 resulted in $874,000, or 0.03%, increase in allowance for credit losses (ACL) for loans. • Q1 2020 increase of $4.7 million in ACL for loans driven by the impact of Covid-19 and declining oil and gas prices which impacted current local and national economical factors and forecast factors. • Utilized final March Moody’s baseline scenario forecast in model, which considers both Covid-19 and the economic stimulus. Commercial and industrial 7,671 $ 852 $ 8,523 $ 614 $ 9,535 $ Real estate: Commercial real estate 7,975 (140) 7,835 1,741 9,576 Construction and development 4,446 100 4,546 1,249 5,795 1-4 family residential 2,257 (275) 1,982 447 2,430 Multi-family residential 1,699 294 1,993 420 2,413 Consumer 388 (25) 363 213 477 Agriculture 74 64 138 (9) 129 Other 770 4 774 64 839 Total allowance for credit losses 25,280 $ 874 $ 26,154 $ 4,739 $ 31,194 $ Commercial and industrial 0.29 % 0.03 % 0.32 % 0.02 % 0.36 % Real estate: Commercial real estate 0.30 (0.01) 0.30 0.07 0.36 Construction and development 0.17 0.00 0.17 0.05 0.22 1-4 family residential 0.09 (0.01) 0.07 0.02 0.09 Multi-family residential 0.06 0.01 0.08 0.02 0.09 Consumer 0.01 (0.00) 0.01 0.01 0.02 Agriculture 0.00 0.00 0.01 (0.00) 0.00 Other 0.03 0.00 0.03 0.00 0.03 Total allowance for credit losses 0.96 % 0.03 % 0.99 % 0.18 % 1.18 % Adoption Impact Balance at 3/31/2020 3/31/2020 Loan Classification ($000) Balance at 12/31/2019 Balances at 1/1/2020 Provision for Credit Losses ACL % of Total Gross Loans 12/31/2019 1/1/2020 Provision for Credit Losses CECL Adoption Impact CECL |
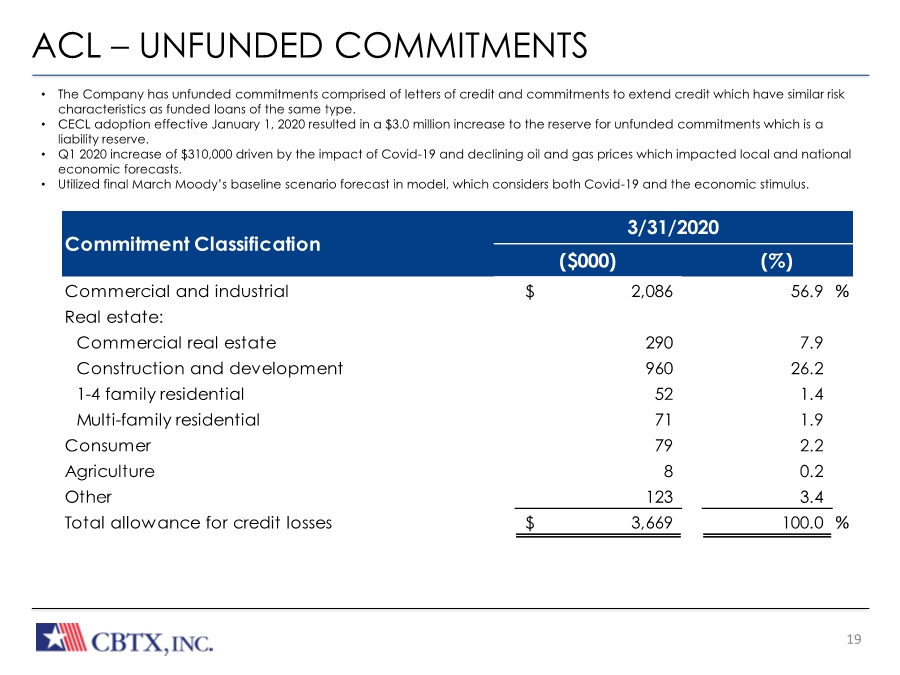
| The Bank Built or Business 19 • CHIEF CREDIT OFFICER WITH 40 YEARS OF EXPERIENCE Seasoned Regional Credit Officers located in Houston and Beaumont • CENTRALIZED UNDERWRITING, TIERED APPROVAL REUIREMENT BASED ON AGGREGATED REALTIONSHIP SIZE Officer credit authority, credit executive committee, and directors’ loan committee Directors’ loan committee meets weekly in each market • RECEIVE PERSONAL GUARANTEES FROM PRINCIPALS ON THE MAJORITY OF COMMERCIAL CREDITS ACL – UNFUNDED COMMITMENTS • The Company has unfunded commitments comprised of letters of credit and commitments to extend credit which have similar risk characteristics as funded loans of the same type. • CECL adoption effective January 1, 2020 resulted in a $3.0 million increase to the reserve for unfunded commitments which is a liability reserve. • Q1 2020 increase of $310,000 driven by the impact of Covid-19 and declining oil and gas prices which impacted local and national economic forecasts. • Utilized final March Moody’s baseline scenario forecast in model, which considers both Covid-19 and the economic stimulus. Commercial and industrial 2,086 $ 56.9 % Real estate: Commercial real estate 290 7.9 Construction and development 960 26.2 1-4 family residential 52 1.4 Multi-family residential 71 1.9 Consumer 79 2.2 Agriculture 8 0.2 Other 123 3.4 Total allowance for credit losses 3,669 $ 100.0 % Commitment Classification 3/31/2020 ($000) (%) |
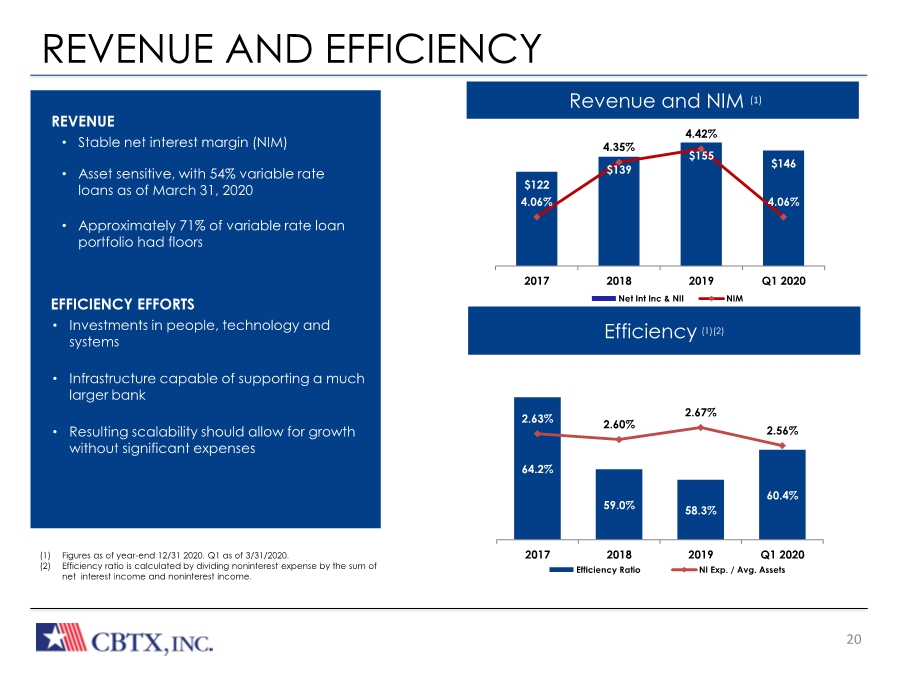
| The Bank Built or Business REVENUE AND EFFICIENCY 20 REVENUE • Stable net interest margin (NIM) • Asset sensitive, with 54% variable rate loans as of March 31, 2020 • Approximately 71% of variable rate loan portfolio had floors Revenue and NIM (1) Efficiency (1)(2) EFFICIENCY EFFORTS • Investments in people, technology and systems • Infrastructure capable of supporting a much larger bank • Resulting scalability should allow for growth without significant expenses (1) Figures as of year-end 12/31 2020. Q1 as of 3/31/2020. (2) Efficiency ratio is calculated by dividing noninterest expense by the sum of net interest income and noninterest income. $122 $139 $155 $146 4.06% 4.35% 4.42% 4.06% 3.80% 3.90% 4.00% 4.10% 4.20% 4.30% 4.40% 4.50% $15 $65 $115 $165 2017 2018 2019 Q1 2020 Net Int Inc & NII NIM 64.2% 59.0% 58.3% 60.4% 2.63% 2.60% 2.67% 2.56% 2.00% 2.20% 2.40% 2.60% 2.80% 3.00% 2017 2018 2019 Q1 2020 Efficiency Ratio NI Exp. / Avg. Assets |
| 21 At CommunityBank of Texas, we’re committed to building strong honest relationships. We strive to keep our clients’ and partners’ needs at the forefront of everything we do. And we measure our success by the success we help create for them. OUR VISION Here to Serve. OUR POSITIONING To experienced business owners, CommunityBank of Texas is the financial partner that delivers a better banking experience. OUR PERSONALITY Resourceful, Trustworthy, Friendly, Responsive, Strong At CommunityBank of Texas, we believe in a powerful and multi-faceted statement, one that drills straight to the heart of our reason for being, while clearly illuminating the mission that our many employees pursue each day: Here to serve. Here to serve is a commitment to building strong and honest relationships, a clarion call to remember that in everything we do, our highest purpose is to transform our extensive financial expertise into success for our clients. Relationships are the bedrock of our business – both internally and externally – and there is a stewardship in the word serve that promises that, in these relationships, we will be caring, humble and precise. That we will keep the needs of our clients at the forefront of our minds at all times and measure our performance by the success we create for each other. The other critical component of our brand vision is the word here, which serves several important roles. Here is a promise that we will be there for our clients and answer the call when they need us the most. We will be Dependable. Honest. Trustworthy. And we will remember that every time is the right time to put our clients’ needs first. Here is also a pledge to be visible and present in the communities we serve. It adds weight to the first and most key component of our name: Community. We are not some faceless financial institution located high above the rank and file, safely sheltered in an ivory tower. We are right here, serving the cities and communities in which we live. Day-in and day-out. We sponsor civic events, donate back to our neighbors in need, and spend the time to really get to know our clients on a personal level. In the face of an increasingly digital and impersonal world, we are proudly present in the lives of our clients and our communities. |
| APPENDIX |
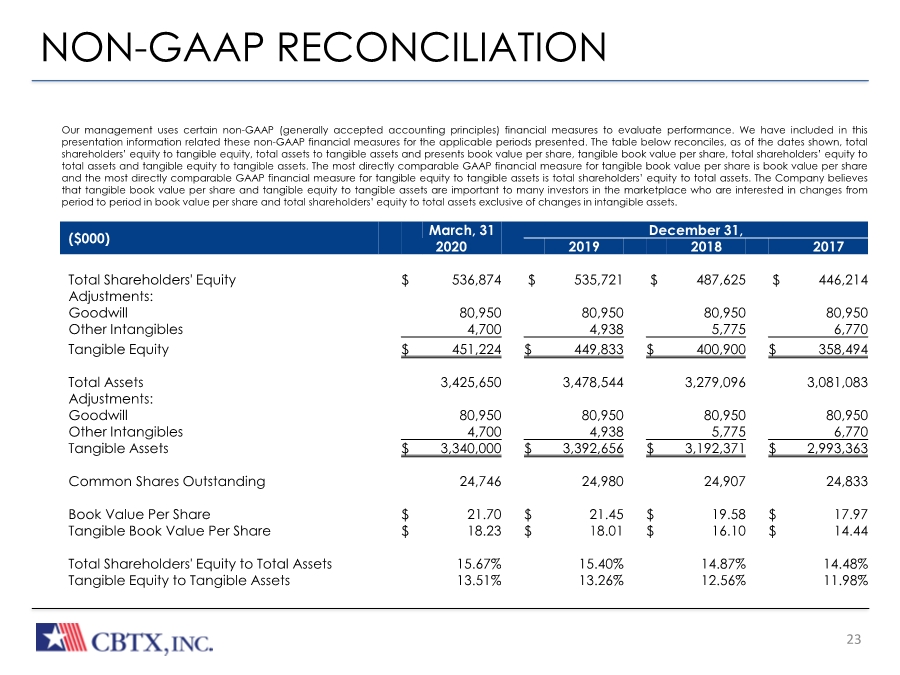
| 23 NON-GAAP RECONCILIATION Our management uses certain non-GAAP (generally accepted accounting principles) financial measures to evaluate performance. We have included in this presentation information related these non-GAAP financial measures for the applicable periods presented. The table below reconciles, as of the dates shown, total shareholders’ equity to tangible equity, total assets to tangible assets and presents book value per share, tangible book value per share, total shareholders’ equity to total assets and tangible equity to tangible assets. The most directly comparable GAAP financial measure for tangible book value per share is book value per share and the most directly comparable GAAP financial measure for tangible equity to tangible assets is total shareholders’ equity to total assets. The Company believes that tangible book value per share and tangible equity to tangible assets are important to many investors in the marketplace who are interested in changes from period to period in book value per share and total shareholders’ equity to total assets exclusive of changes in intangible assets. ($000) March, 31 December 31, 2020 2019 2018 2017 Total Shareholders' Equity $ 536,874 $ 535,721 $ 487,625 $ 446,214 Adjustments: Goodwill 80,950 80,950 80,950 80,950 Other Intangibles 4,700 4,938 5,775 6,770 Tangible Equity $ 451,224 $ 449,833 $ 400,900 $ 358,494 Total Assets 3,425,650 3,478,544 3,279,096 3,081,083 Adjustments: Goodwill 80,950 80,950 80,950 80,950 Other Intangibles 4,700 4,938 5,775 6,770 Tangible Assets $ 3,340,000 $ 3,392,656 $ 3,192,371 $ 2,993,363 Common Shares Outstanding 24,746 24,980 24,907 24,833 Book Value Per Share $ 21.70 $ 21.45 $ 19.58 $ 17.97 Tangible Book Value Per Share $ 18.23 $ 18.01 $ 16.10 $ 14.44 Total Shareholders' Equity to Total Assets 15.67% 15.40% 14.87% 14.48% Tangible Equity to Tangible Assets 13.51% 13.26% 12.56% 11.98% |
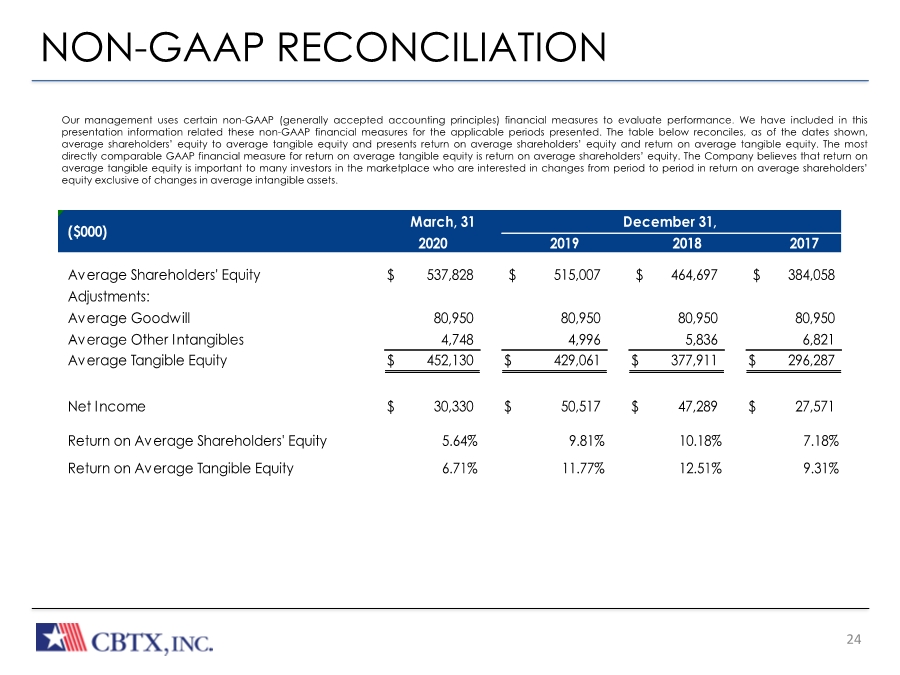
| 24 NON-GAAP RECONCILIATION Our management uses certain non-GAAP (generally accepted accounting principles) financial measures to evaluate performance. We have included in this presentation information related these non-GAAP financial measures for the applicable periods presented. The table below reconciles, as of the dates shown, average shareholders’ equity to average tangible equity and presents return on average shareholders’ equity and return on average tangible equity.The most directly comparable GAAP financial measure for return on average tangible equity is return on average shareholders’ equity. The Company believes that return on average tangible equity is important to many investors in the marketplace who are interested in changes from period to period in return on average shareholders’ equity exclusive of changes in average intangible assets. March, 31 2019 2018 2017 Average Shareholders' Equity $ 537,828 $ 515,007 $ 464,697 $ 384,058 Adjustments: Average Goodwill 80,950 80,950 80,950 80,950 Average Other Intangibles 4,748 4,996 5,836 6,821 Average Tangible Equity $ 452,130 $ 429,061 $ 377,911 $ 296,287 Net Income $ 30,330 $ 50,517 $ 47,289 $ 27,571 Return on Average Shareholders' Equity 5.64% 9.81% 10.18% 7.18% Return on Average Tangible Equity 6.71% 11.77% 12.51% 9.31% ($000) December 31, 2020 |
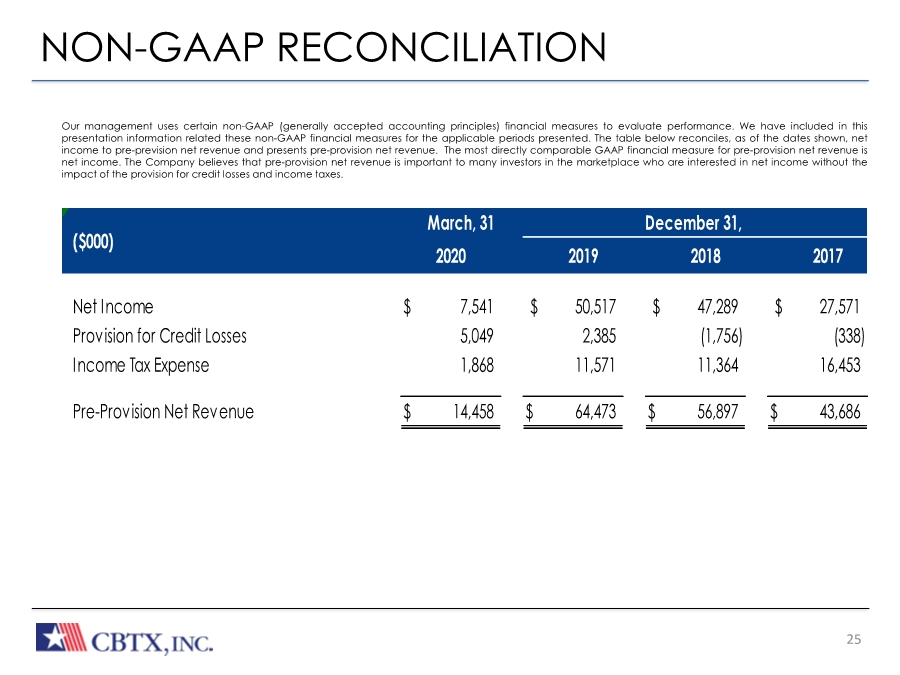
| 25 NON-GAAP RECONCILIATION Our management uses certain non-GAAP (generally accepted accounting principles) financial measures to evaluate performance. We have included in this presentation information related these non-GAAP financial measures for the applicable periods presented. The table below reconciles, as of the dates shown, net income to pre-prevision net revenue and presents pre-provision net revenue.The most directly comparable GAAP financial measure for pre-provision net revenue is net income. The Company believes that pre-provision net revenue is important to many investors in the marketplace who are interested in net income without the impact of the provision for credit losses and income taxes. March, 31 2019 2018 2017 Net Income $ 7,541 $ 50,517 $ 47,289 $ 27,571 Provision for Credit Losses 5,049 2,385 (1,756) (338) Income Tax Expense 1,868 11,571 11,364 16,453 Pre-Provision Net Revenue $ 14,458 $ 64,473 $ 56,897 $ 43,686 ($000) December 31, 2020 |