Attached files
| file | filename |
|---|---|
| 8-K - 8-K EARNINGS RELEASE APRIL 22, 2020 - SUN COMMUNITIES INC | form8-kearningsrelease.htm |
Table of Contents
Summary - Earnings Press Release | |
Investor Information | |
Portfolio Overview | |
Financial Information | |
Financial and Operating Highlights | |
Balance Sheets | |
Statements of Operations | |
Outstanding Securities and Capitalization | |
Reconciliations to Non-GAAP Financial Measures | |
Reconciliation of Net Income / (Loss) to Funds from Operations | |
Reconciliation of Net Income / (Loss) to Recurring EBITDA | |
Reconciliation of Net Income / (Loss) to Net Operating Income | |
Non-GAAP and Other Financial Measures | |
Debt Analysis | |
Selected Financial Information | |
Real Property Operations – Same Community | |
Home Sales Summary | |
Rental Program Summary | |
Acquisitions and Other Summary | |
Other Information | |
Property Summary | |
Capital Improvements, Development, and Acquisitions | |
Operating Statistics for Manufactured Homes and Annual RV’s | |
Footnotes and Definitions | |

NEWS RELEASE
April 22, 2020
Sun Communities, Inc. Reports 2020 First Quarter Results and Provides Update on COVID-19 Effects
Southfield, Michigan, April 22, 2020 – Sun Communities, Inc. (NYSE: SUI) (the “Company”), a real estate investment trust (“REIT”) that owns and operates, or has an interest in, manufactured housing (“MH”) and recreational vehicle (“RV”) communities, today reported its first quarter results for 2020 and provided an update on the effects of, and its response to, the COVID-19 pandemic.
Financial Results for the Three Months Ended March 31, 2020
For the three months ended March 31, 2020, total revenues increased $23.0 million, or 8.0 percent, to $310.3 million compared to $287.3 million for the same period in 2019. Net loss attributable to common stockholders was $16.1 million, or $0.17 per diluted common share, for the three months ended March 31, 2020, as compared to net income attributable to common stockholders of $34.3 million, or $0.40 per diluted common share, for the same period in 2019.
Non-GAAP Financial Measures and Portfolio Performance
• | Core Funds from Operations (“Core FFO”)(1) for the three months ended March 31, 2020, was $1.22 per diluted share and OP unit (“Share”) as compared to $1.18 in the prior year, an increase of 3.4 percent. |
• | Same Community(2) Net Operating Income (“NOI”)(1) increased by 6.7 percent for the three months ended March 31, 2020, as compared to the corresponding period in 2019. |
• | Revenue Producing Sites increased by 300 sites for the three months ended March 31, 2020, bringing total portfolio occupancy to 96.7 percent. |
• | MH rent collections for the month of April total approximately 98 percent as of April 21, 2020. |
Gary Shiffman, Chief Executive Officer of Sun Communities stated, “We want to convey our best wishes for the health and safety of all of our stakeholders during these unprecedented times. Sun is deeply committed to prioritizing the welfare of its residents, guests and team members every day, and in light of the widespread concern over COVID-19 across the nation, we have re-doubled our efforts. We have moved swiftly to develop a rent deferral program for residents that have been adversely impacted by the pandemic and we have taken decisive measures to reduce controllable expenses and preserve the Company’s financial flexibility.”
Mr. Shiffman continued, “The ultimate impact of disruption from the virus will be determined by the length of time that the COVID-19 pandemic remains a threat and depends on a multitude of variables over which we have no control. It is important to remember the pandemic is not a permanent condition, but a point in time that has dramatically impacted consumers, businesses and travel. We know that with time, this disruption will cease, and we firmly believe the fundamental thesis of manufactured housing communities and recreational vehicle resorts remains intact. We offer unparalleled value to our residents and guests in housing and vacationing options. We are confident Sun is prepared to withstand these challenges and navigate this evolving situation with its strong balance sheet, superior properties and dedicated team members.”
i
COVID-19 and Impact on Operations
Since the declaration of COVID-19 as a pandemic at the beginning of March, the Company has adopted recommendations and protocols from the Centers for Disease Control, the World Health Organization and federal, state and local authorities where it operates, to ensure the safety and well-being of its team members, residents and guests.
The Company is continuing to provide essential services using social distancing techniques and minimal contact. The Company’s community and resort offices are partially staffed with reduced hours and open for essential services only. To promote social distancing, the Company is encouraging its residents to use its online rent payment portals and other payment methods. Amenities have been closed at the direction of state and local municipalities and to prevent social gathering.
Certain of the Company’s RV resorts remain open, where government regulations permit, however all indoor and outdoor activities have been suspended to encourage social distancing. Forty four RV resorts in the northern United States and Canada, that normally would commence operations in early spring, have had their openings delayed and do not yet have confirmed opening dates from local municipalities.
The Company has implemented measures to mitigate the impact of COVID-19 on the business. These efforts include increasing its cash position, bolstering liquidity and eliminating, reducing or deferring non-essential expenditures. Additionally, the Board of Directors and executive officers have elected to forgo base compensation for at least the second quarter. Cost containment measures have also included the additional furlough of team members and reductions in base compensation for non-furloughed team members. The Company will provide health benefit coverage to furloughed team members, if enrolled, at no cost to the team members.
The impact of stay-at-home orders and travel restrictions is expected to have a significant impact on the Company’s transient RV financial results including a reduction of revenue earned from the rental of sites, ancillary income and fee generation. These reductions, combined with the potential impact on manufactured housing operations and home selling activities, offset by the Company’s implementation of cost saving measures, could have an estimated net reduction for the second quarter of 2020 of $15.0 - $18.0 million from the Company’s original expectations.
ii
OPERATING HIGHLIGHTS
Portfolio Occupancy
Total portfolio occupancy was 96.7 percent at March 31, 2020, compared to 96.4 percent at March 31, 2019.
During the three months ended March 31, 2020, revenue producing sites increased by 300 sites, as compared to an increase of 571 revenue producing sites during the three months ended March 31, 2019.
Same Community(2) Results
For the 367 communities owned and operated by the Company since January 1, 2019, NOI(1) for the three months ended March 31, 2020 increased 6.7 percent over the same period in 2019, as a result of a 5.2 percent increase in revenues and a 1.8 percent increase in operating expenses. Same Community occupancy(3) increased to 98.4 percent at March 31, 2020 from 96.6 percent at March 31, 2019.
Home Sales
During the three months ended March 31, 2020, the Company sold 763 homes as compared to 798 homes sold during the same period in 2019. New home sales volume was 119 and 125 for the three months ended March 31, 2020 and 2019, respectively. Rental home sales volume, which are included in total home sales, were 234 and 210 for the three months ended March 31, 2020 and 2019, respectively.
PORTFOLIO ACTIVITY
Acquisitions
During the three months ended March 31, 2020, the Company acquired the following communities:
Community Name | Type | Sites | Development sites | State | Total Purchase Price (in millions) | Month Acquired | ||||||||||
Cape Cod (1) | RV | 230 | — | MA | $ | 13.5 | January | |||||||||
Jellystone Natural Bridge | RV | 299 | — | VA | $ | 11.5 | February | |||||||||
(1) In conjunction with the acquisition, we issued Series E Preferred Operating Partnership (“OP”) Units. As of March 31, 2020, 90,000 Series E Preferred OP Units were outstanding.
iii
BALANCE SHEET AND CAPITAL MARKETS ACTIVITY
Debt Transactions
During the three months ended March 31, 2020, the Company completed a 15-year, $230.0 million term loan transaction that carries an interest rate of 3.0 percent. The Company repaid a $99.6 million term loan due to mature in 2021 with an interest rate of 5.8 percent. Also, during the quarter, the Company repaid four term loans secured by two properties with a weighted average interest rate of 5.8 percent totaling $19.9 million which were set to mature in 2020.
As of March 31, 2020, the Company had $3.9 billion of debt outstanding. The weighted average interest rate was 3.64 percent and the weighted average maturity was 10.6 years. The Company had $382.5 million of unrestricted cash on hand. At period-end the Company’s net debt to trailing twelve-month Recurring EBITDA(1) ratio was 5.6 times.
2020 Distributions
As previously announced, the Company increased its annual distribution by 5.3 percent to $3.16 per common share from $3.00 per common share. The increase began with the distribution declared in March 2020 that was paid after quarter end. While the Company has adopted the annual distribution policy, the amount of each quarterly distribution on the Company’s common stock will be subject to approval by its Board of Directors.
GUIDANCE 2020 UPDATE
The duration of the unprecedented COVID-19 crisis is unknown and its impact is continually evolving. Given the uncertainty surrounding the impact from the COVID-19 pandemic on its operations, the Company has withdrawn full year 2020 operational and financial guidance previously issued on February 19, 2020.
When the Company has more clarity on the suspension of travel restrictions and stay-at-home orders, it expects to provide updated guidance for the balance of 2020.
iv
EARNINGS CONFERENCE CALL
A conference call to discuss first quarter operating results will be held on Thursday, April 23, 2020 at 11:00 A.M. (ET). To participate, call toll-free 877-407-9039. Callers outside the U.S. or Canada can access the call at 201-689-8470. A replay will be available following the call through May 7, 2020 and can be accessed toll-free by calling 844-512-2921 or 412-317-6671. The Conference ID number for the call and the replay is 13699860. The conference call will be available live on Sun Communities’ website located at www.suncommunities.com. The replay will also be available on the website.
Sun Communities, Inc. is a REIT that, as of March 31, 2020, owned, operated, or had an interest in a portfolio of 424 communities comprising nearly 142,000 developed sites in 33 states and Ontario, Canada.
For more information about Sun Communities, Inc., please visit www.suncommunities.com.
CONTACT
Please address all inquiries to our investor relations department at our website www.suncommunities.com, by phone to (248) 208-2500, by email to investorrelations@suncommunities.com or by mail to Sun Communities, Inc. Attn: Investor Relations, 27777 Franklin Road, Ste. 200, Southfield, MI 48034.
Forward-Looking Statements
This press release contains various “forward-looking statements” within the meaning of the Securities Act of 1933, as amended, and the Securities Exchange Act of 1934, as amended, and the Company intends that such forward-looking statements will be subject to the safe harbors created thereby. Forward-looking statements can be identified by words such as “will,” “may,” “could,” “expect,” “anticipate,” “believes,” “intends,” “should,” “plans,” “estimates,” “approximate,” “guidance,” and similar expressions in this press release that predict or indicate future events and trends and that do not report historical matters.
These forward-looking statements reflect the Company’s current views with respect to future events and financial performance, but involve known and unknown risks, uncertainties, and other factors, some of which are beyond the Company’s control. These risks, uncertainties, and other factors may cause the actual results of the Company to be materially different from any future results expressed or implied by such forward-looking statements. Such risks and uncertainties include the effects of the COVID-19 pandemic and related stay-at-home orders, quarantine policies and restrictions on travel, trade and business operations; national, regional and local economic climates; the ability to maintain rental rates and occupancy levels; competitive market forces; the performance of recent acquisitions; the ability to integrate future acquisitions smoothly and efficiently; changes in market rates of interest; changes in foreign currency exchange rates; the ability of manufactured home buyers to obtain financing and the level of repossessions by manufactured home lenders. Further details of potential risks that may affect the Company are described in its periodic reports filed with the U.S. Securities and Exchange Commission, including in the “Risk Factors” section of the Company’s Annual Report on Form 10-K.
The forward-looking statements contained in this press release speak only as of the date hereof and the Company expressly disclaims any obligation to provide public updates, revisions or amendments to any forward-looking statements made herein to reflect changes in the Company’s assumptions, expectations of future events, or trends.
v
Investor Information
RESEARCH COVERAGE | ||||||
Firm | Analyst | Phone | Email | |||
Bank of America Merrill Lynch | Joshua Dennerlein | (646) 855-1681 | joshua.dennerlein@baml.com | |||
BMO Capital Markets | John Kim | (212) 885-4115 | johnp.kim@bmo.com | |||
Citi Research | Michael Bilerman | (212) 816-1383 | michael.bilerman@citi.com | |||
Nicholas Joseph | (212) 816-1909 | nicholas.joseph@citi.com | ||||
Evercore ISI | Steve Sakwa | (212) 446-9462 | steve.sakwa@evercoreisi.com | |||
Samir Khanal | (212) 888-3796 | samir.khanal@evercoreisi.com | ||||
Green Street Advisors | John Pawlowski | (949) 640-8780 | jpawlowski@greenstreetadvisors.com | |||
RBC Capital Markets | Wes Golladay | (440) 715-2650 | wes.golladay@rbccm.com | |||
Robert W. Baird & Co. | Drew Babin | (610) 238-6634 | dbabin@rwbaird.com | |||
Wells Fargo | Todd Stender | (562) 637-1371 | todd.stender@wellsfargo.com | |||
INQUIRIES | ||||||
Sun Communities welcomes questions or comments from stockholders, analysts, investment managers, media, or any prospective investor. Please address all inquiries to our Investor Relations department. | ||||||
At Our Website | www.suncommunities.com | |||||
By Email | investorrelations@suncommunities.com | |||||
By Phone | (248) 208-2500 | |||||
1st Quarter 2020 Supplemental Information 1 Sun Communities, Inc.
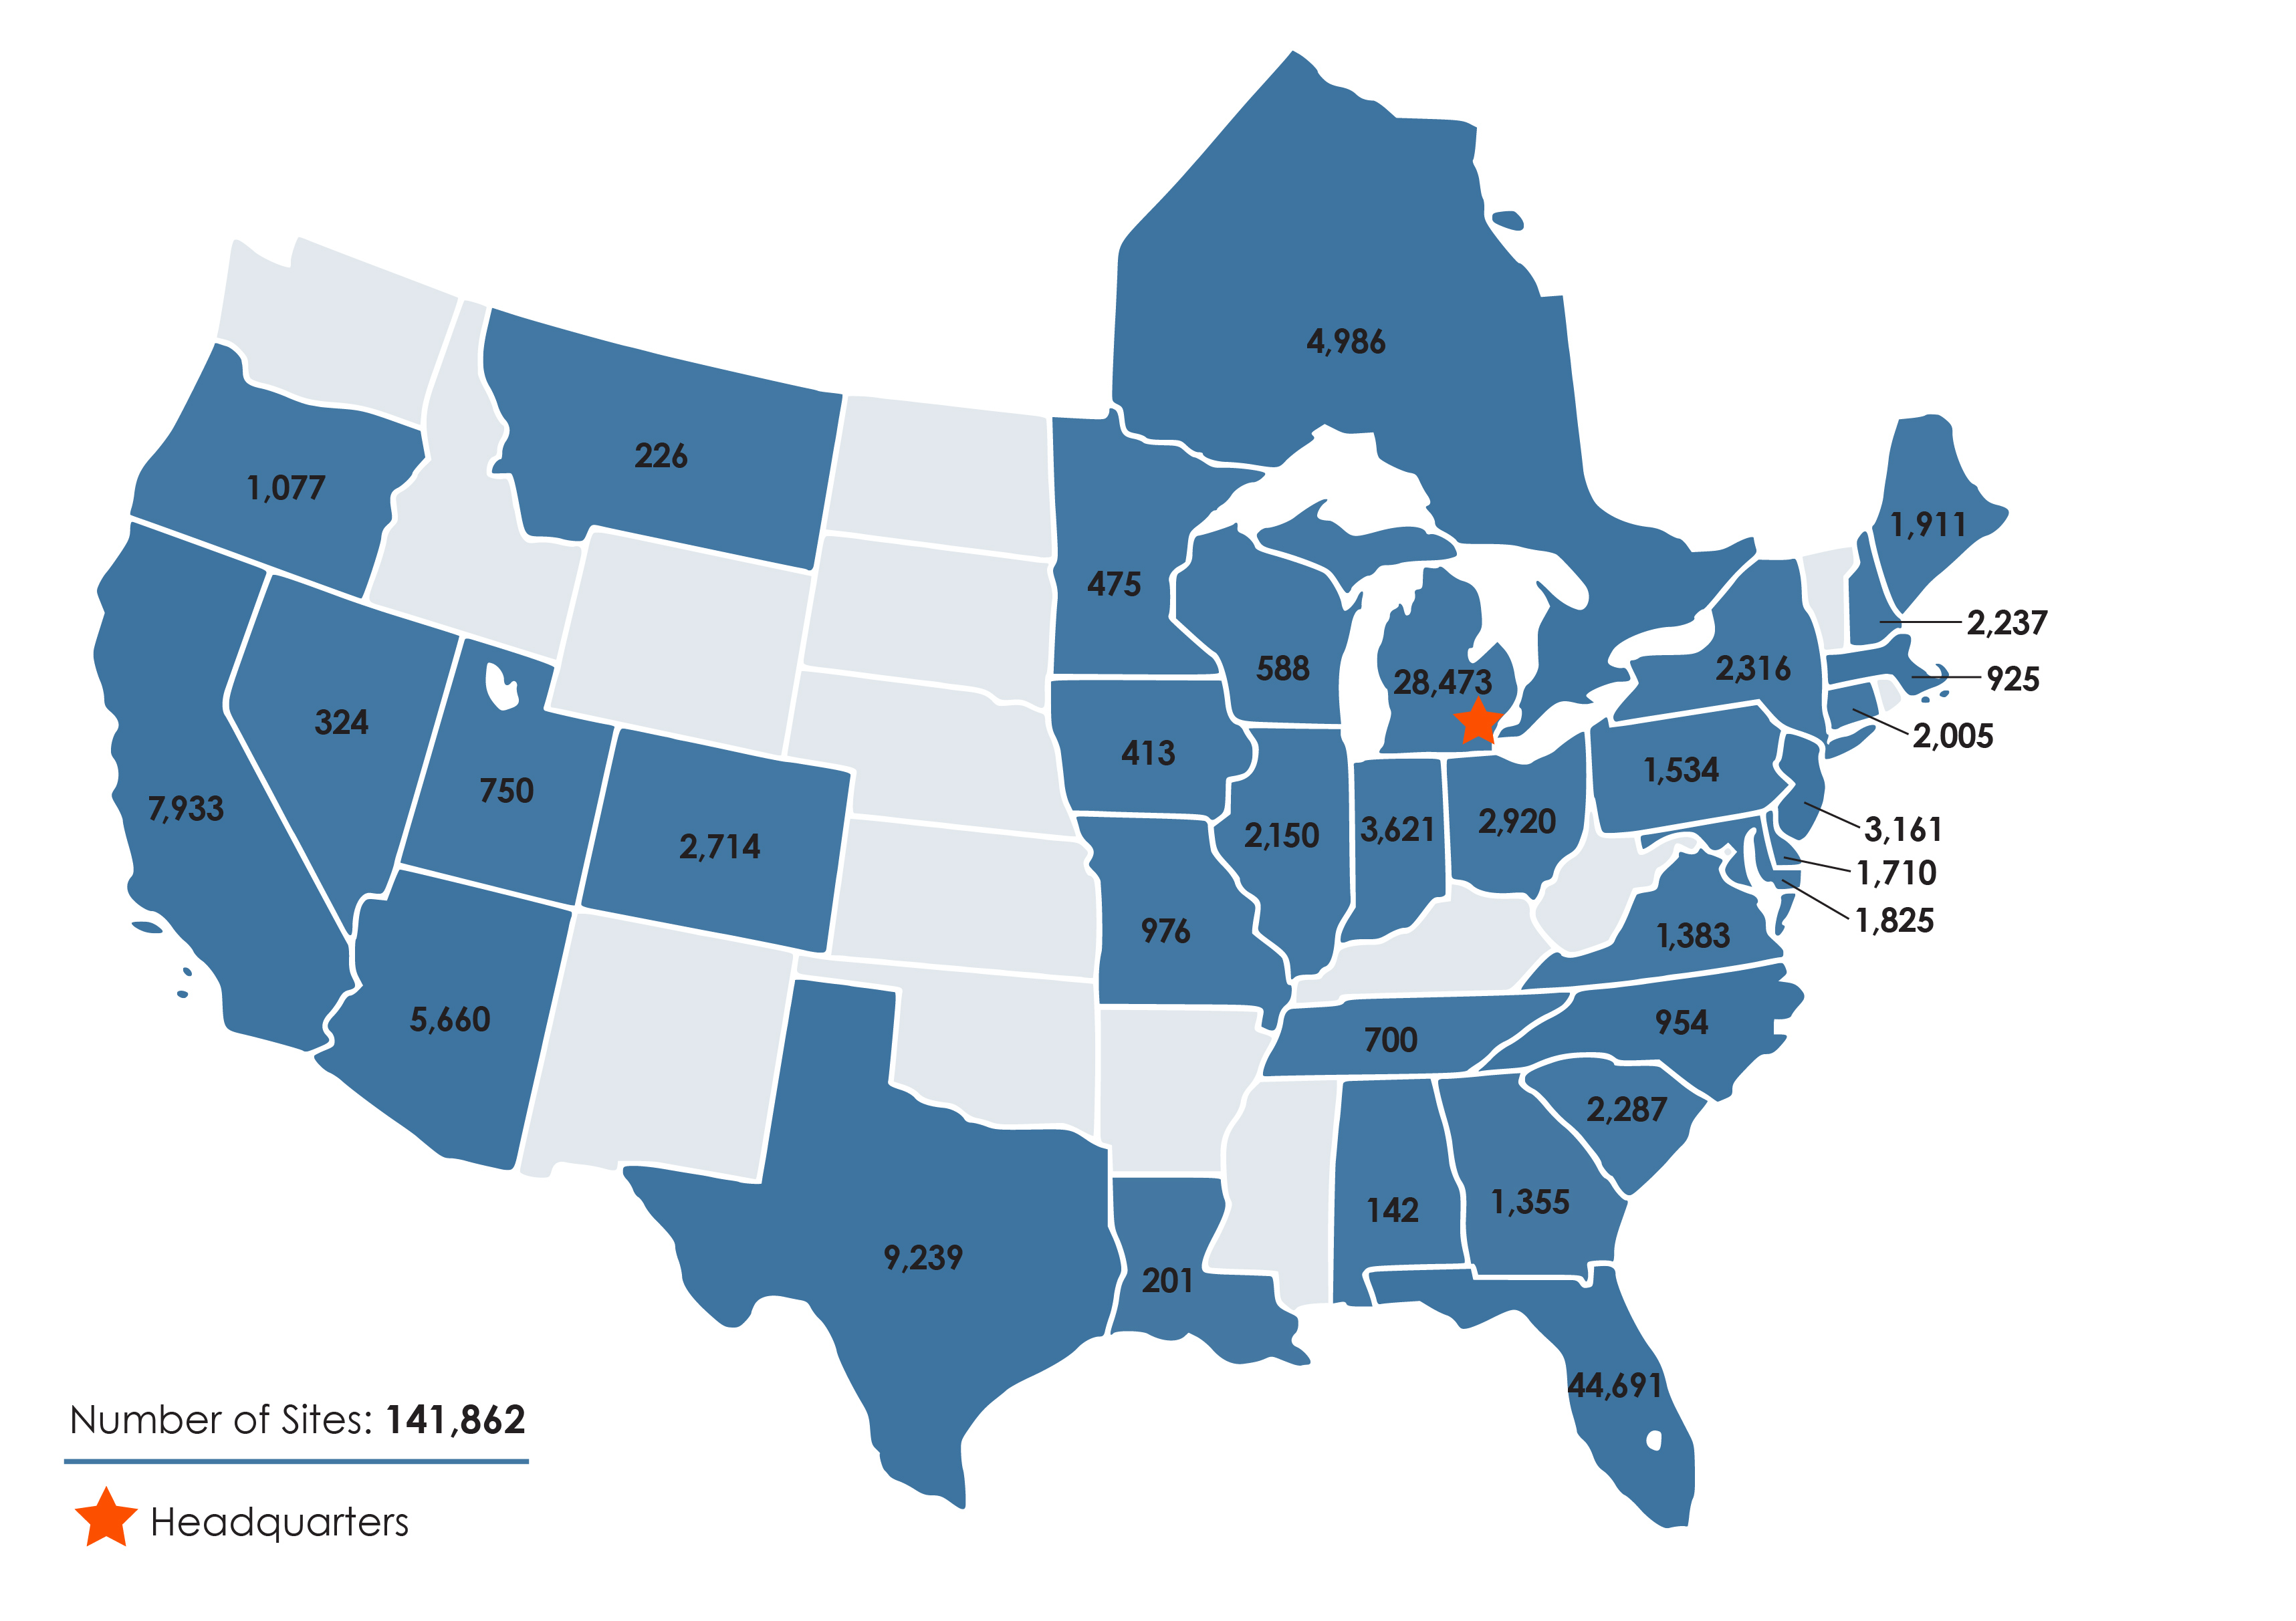
Portfolio Overview
(As of March 31, 2020)
1st Quarter 2020 Supplemental Information 2 Sun Communities, Inc.
Financial and Operating Highlights
(amounts in thousands, except for *)
Quarter Ended | |||||||||||||||||||
3/31/2020 | 12/31/2019 | 9/30/2019 | 6/30/2019 | 3/31/2019 | |||||||||||||||
Financial Information | |||||||||||||||||||
Total revenues | $ | 310,302 | $ | 301,819 | $ | 362,443 | $ | 312,445 | $ | 287,330 | |||||||||
Net income / (loss) | $ | (15,478 | ) | $ | 30,685 | $ | 64,451 | $ | 45,116 | $ | 37,127 | ||||||||
Net Income / (loss) attributable to Sun Communities Inc. common stockholders | $ | (16,086 | ) | $ | 28,547 | $ | 57,002 | $ | 40,385 | $ | 34,331 | ||||||||
Basic earnings / (loss) per share* | $ | (0.17 | ) | $ | 0.31 | $ | 0.63 | $ | 0.46 | $ | 0.40 | ||||||||
Diluted earnings / (loss) per share* | $ | (0.17 | ) | $ | 0.31 | $ | 0.63 | $ | 0.46 | $ | 0.40 | ||||||||
Cash distributions declared per common share* | $ | 0.79 | $ | 0.75 | $ | 0.75 | $ | 0.75 | $ | 0.75 | |||||||||
Recurring EBITDA (1) | $ | 156,552 | $ | 144,738 | $ | 179,953 | $ | 151,502 | $ | 147,714 | |||||||||
FFO attributable to Sun Communities, Inc. common stockholders and dilutive convertible securities (1) (7) | $ | 95,046 | $ | 105,533 | $ | 119,496 | $ | 108,112 | $ | 106,779 | |||||||||
Core FFO attributable to Sun Communities, Inc. common stockholders and dilutive convertible securities (1) (7) | $ | 117,267 | $ | 104,534 | $ | 137,369 | $ | 108,002 | $ | 106,259 | |||||||||
FFO attributable to Sun Communities, Inc. common stockholders and dilutive convertible securities (1) (7) per share - fully diluted* | $ | 0.98 | $ | 1.11 | $ | 1.27 | $ | 1.18 | $ | 1.19 | |||||||||
Core FFO attributable to Sun Communities, Inc. common stockholders and dilutive convertible securities (1) (7) per share - fully diluted* | $ | 1.22 | $ | 1.10 | $ | 1.46 | $ | 1.18 | $ | 1.18 | |||||||||
Balance Sheet | |||||||||||||||||||
Total assets | $ | 8,209,047 | $ | 7,802,060 | $ | 7,397,854 | $ | 7,222,084 | $ | 7,098,662 | |||||||||
Total debt | $ | 3,926,494 | $ | 3,434,402 | $ | 3,271,341 | $ | 3,107,775 | $ | 3,448,117 | |||||||||
Total liabilities | $ | 4,346,127 | $ | 3,848,104 | $ | 3,720,983 | $ | 3,542,188 | $ | 3,846,325 | |||||||||
Quarter Ended | ||||||||||||||
3/31/2020 | 12/31/2019 | 9/30/2019 | 6/30/2019 | 3/31/2019 | ||||||||||
Operating Information* | ||||||||||||||
Communities | 424 | 422 | 389 | 382 | 379 | |||||||||
Manufactured home sites | 93,834 | 93,821 | 88,024 | 87,555 | 87,425 | |||||||||
Annual RV sites | 26,148 | 26,056 | 25,756 | 25,009 | 24,750 | |||||||||
Transient RV sites | 21,880 | 21,416 | 20,882 | 20,585 | 20,173 | |||||||||
Total sites | 141,862 | 141,293 | 134,662 | 133,149 | 132,348 | |||||||||
MH occupancy | 95.8 | % | 95.5 | % | 95.7 | % | 95.7 | % | 95.4 | % | ||||
RV occupancy | 100.0 | % | 100.0 | % | 100.0 | % | 100.0 | % | 100.0 | % | ||||
Total blended MH and RV occupancy | 96.7 | % | 96.4 | % | 96.7 | % | 96.6 | % | 96.4 | % | ||||
New home sales | 119 | 140 | 167 | 139 | 125 | |||||||||
Pre-owned home sales | 644 | 668 | 739 | 788 | 673 | |||||||||
Total home sales | 763 | 808 | 906 | 927 | 798 | |||||||||
Quarter Ended | ||||||||||||||
3/31/2020 | 12/31/2019 | 9/30/2019 | 6/30/2019 | 3/31/2019 | ||||||||||
Net Leased Sites (24) | ||||||||||||||
MH net leased sites | 287 | 437 | 296 | 410 | 398 | |||||||||
RV net leased sites | 13 | 232 | 470 | 258 | 173 | |||||||||
Total net leased sites | 300 | 669 | 766 | 668 | 571 | |||||||||
1st Quarter 2020 Supplemental Information 3 Sun Communities, Inc.
Balance Sheets
(amounts in thousands)
(Unaudited) | ||||||||
March 31, 2020 | December 31, 2019 | |||||||
Assets | ||||||||
Land | $ | 1,418,985 | $ | 1,414,279 | ||||
Land improvements and buildings | 6,697,376 | 6,595,272 | ||||||
Rental homes and improvements | 640,709 | 627,175 | ||||||
Furniture, fixtures and equipment | 285,922 | 282,874 | ||||||
Investment property | 9,042,992 | 8,919,600 | ||||||
Accumulated depreciation | (1,754,591 | ) | (1,686,980 | ) | ||||
Investment property, net | 7,288,401 | 7,232,620 | ||||||
Cash, cash equivalents and restricted cash | 394,740 | 34,830 | ||||||
Marketable securities | 55,602 | 94,727 | ||||||
Inventory of manufactured homes | 64,436 | 62,061 | ||||||
Notes and other receivables, net | 186,692 | 157,926 | ||||||
Other assets, net | 219,176 | 219,896 | ||||||
Total Assets | $ | 8,209,047 | $ | 7,802,060 | ||||
Liabilities | ||||||||
Mortgage loans payable | $ | 3,273,808 | $ | 3,180,592 | ||||
Preferred Equity - Sun NG Resorts - mandatorily redeemable | 35,249 | 35,249 | ||||||
Preferred OP units - mandatorily redeemable | 34,663 | 34,663 | ||||||
Lines of credit (5) | 582,774 | 183,898 | ||||||
Distributions payable | 75,636 | 71,704 | ||||||
Advanced reservation deposits and rent | 151,144 | 133,420 | ||||||
Accrued expenses and accounts payable | 110,512 | 127,289 | ||||||
Other liabilities | 82,341 | 81,289 | ||||||
Total Liabilities | 4,346,127 | 3,848,104 | ||||||
Commitments and contingencies | ||||||||
Series D preferred OP units | 50,387 | 50,913 | ||||||
Equity Interests - NG Sun LLC and NG Whitewater | 26,063 | 27,091 | ||||||
Stockholders' Equity | ||||||||
Common stock | 933 | 932 | ||||||
Additional paid-in capital | 5,211,678 | 5,213,264 | ||||||
Accumulated other comprehensive loss | (8,325 | ) | (1,331 | ) | ||||
Distributions in excess of accumulated earnings | (1,479,424 | ) | (1,393,141 | ) | ||||
Total Sun Communities, Inc. stockholders' equity | 3,724,862 | 3,819,724 | ||||||
Noncontrolling interests | ||||||||
Common and preferred OP units | 52,234 | 47,686 | ||||||
Consolidated variable interest entities | 9,374 | 8,542 | ||||||
Total noncontrolling interests | 61,608 | 56,228 | ||||||
Total Stockholders' Equity | 3,786,470 | 3,875,952 | ||||||
Total Liabilities, Temporary Equity and Stockholders' Equity | $ | 8,209,047 | $ | 7,802,060 | ||||
1st Quarter 2020 Supplemental Information 4 Sun Communities, Inc.
Statements of Operations - Quarter to Date Comparison
(amounts in thousands, except per share amounts) (Unaudited)
Three Months Ended | ||||||||||||||
March 31, 2020 | March 31, 2019 | Change | % Change | |||||||||||
Revenues | ||||||||||||||
Income from real property (excluding transient revenue) | $ | 212,530 | $ | 190,565 | $ | 21,965 | 11.5 | % | ||||||
Transient revenue | 25,255 | 24,518 | 737 | 3.0 | % | |||||||||
Revenue from home sales | 40,587 | 39,618 | 969 | 2.4 | % | |||||||||
Rental home revenue | 15,472 | 13,971 | 1,501 | 10.7 | % | |||||||||
Ancillary revenue | 10,195 | 10,178 | 17 | 0.2 | % | |||||||||
Interest income | 2,350 | 4,800 | (2,450 | ) | (51.0 | )% | ||||||||
Brokerage commissions and other revenues, net | 3,913 | 3,680 | 233 | 6.3 | % | |||||||||
Total Revenues | 310,302 | 287,330 | 22,972 | 8.0 | % | |||||||||
Expenses | ||||||||||||||
Property operating and maintenance | 64,057 | 57,909 | 6,148 | 10.6 | % | |||||||||
Real estate taxes | 17,176 | 15,330 | 1,846 | 12.0 | % | |||||||||
Cost of home sales | 30,032 | 29,277 | 755 | 2.6 | % | |||||||||
Rental home operating and maintenance | 5,494 | 4,832 | 662 | 13.7 | % | |||||||||
Ancillary expenses | 7,482 | 7,101 | 381 | 5.4 | % | |||||||||
Home selling expenses | 3,992 | 3,324 | 668 | 20.1 | % | |||||||||
General and administrative expenses | 25,517 | 21,887 | 3,630 | 16.6 | % | |||||||||
Catastrophic weather-related charges, net | 606 | 782 | (176 | ) | (22.5 | )% | ||||||||
Depreciation and amortization | 83,689 | 76,556 | 7,133 | 9.3 | % | |||||||||
Loss on extinguishment of debt | 3,279 | 653 | 2,626 | 402.1 | % | |||||||||
Interest expense | 32,416 | 34,014 | (1,598 | ) | (4.7 | )% | ||||||||
Interest on mandatorily redeemable preferred OP units / equity | 1,041 | 1,094 | (53 | ) | (4.8 | )% | ||||||||
Total Expenses | 274,781 | 252,759 | 22,022 | 8.7 | % | |||||||||
Income Before Other Items | 35,521 | 34,571 | 950 | 2.7 | % | |||||||||
Gain / (loss) on remeasurement of marketable securities | (28,647 | ) | 267 | (28,914 | ) | N/M (a) | ||||||||
Gain / (loss) on foreign currency translation | (17,479 | ) | 1,965 | (19,444 | ) | N/M (a) | ||||||||
Other expense, net (6) | (302 | ) | (67 | ) | (235 | ) | 350.7 | % | ||||||
Loss on remeasurement of notes receivable | (2,112 | ) | — | (2,112 | ) | N/A | ||||||||
Income from nonconsolidated affiliates | 52 | 388 | (336 | ) | (86.6 | )% | ||||||||
Loss on remeasurement of investment in nonconsolidated affiliates | (2,191 | ) | — | (2,191 | ) | N/A | ||||||||
Current tax expense | (450 | ) | (214 | ) | (236 | ) | 110.3 | % | ||||||
Deferred tax benefit | 130 | 217 | (87 | ) | (40.1 | )% | ||||||||
Net Income / (Loss) | (15,478 | ) | 37,127 | (52,605 | ) | (141.7 | )% | |||||||
Less: Preferred return to preferred OP units / equity | 1,570 | 1,323 | 247 | 18.7 | % | |||||||||
Less: Income / (loss) attributable to noncontrolling interests | (962 | ) | 1,041 | (2,003 | ) | (192.4 | )% | |||||||
Net Income / (Loss) Attributable to Sun Communities, Inc. | (16,086 | ) | 34,763 | (50,849 | ) | (146.3 | )% | |||||||
Less: Preferred stock distribution | — | 432 | (432 | ) | (100.0 | )% | ||||||||
Net Income / (Loss) Attributable to Sun Communities, Inc. Common Stockholders | $ | (16,086 | ) | $ | 34,331 | $ | (50,417 | ) | (146.9 | )% | ||||
Weighted average common shares outstanding - basic | 92,410 | 85,520 | 6,890 | 8.1 | % | |||||||||
Weighted average common shares outstanding - diluted | 92,935 | 86,033 | 6,902 | 8.0 | % | |||||||||
Basic earnings / (loss) per share | $ | (0.17 | ) | $ | 0.40 | $ | (0.57 | ) | (142.5 | )% | ||||
Diluted earnings / (loss) per share | $ | (0.17 | ) | $ | 0.40 | $ | (0.57 | ) | (142.5 | )% | ||||
(a) Percentage change is not meaningful, (“N/M”)
1st Quarter 2020 Supplemental Information 5 Sun Communities, Inc.
Outstanding Securities and Capitalization
(amounts in thousands except for *)
Outstanding Securities - As of March 31, 2020 | |||||||||
Number of Units/Shares Outstanding | Conversion Rate* | If Converted | Issuance Price per unit* | Annual Distribution Rate* | |||||
Non-convertible Securities | |||||||||
Common shares | 93,327 | N/A | N/A | N/A | $3.16^ | ||||
Convertible Securities | |||||||||
Series A-1 preferred OP units | 303 | 2.4390 | 738 | $100 | 6.0% | ||||
Series A-3 preferred OP units | 40 | 1.8605 | 75 | $100 | 4.5% | ||||
Series C preferred OP units | 310 | 1.1100 | 345 | $100 | 4.5% | ||||
Series D preferred OP units | 489 | 0.8000 | 391 | $100 | 3.8% | ||||
Series E preferred OP units | 90 | 0.6897 | 62 | $100 | 5.25% | ||||
Common OP units | 2,408 | 1.0000 | 2,408 | N/A | Mirrors common shares distributions | ||||
^ Annual distribution is based on the last quarterly distribution annualized. | |||||||||
Capitalization - As of March 31, 2020 | |||||||||||
Equity | Shares | Share Price* | Total | ||||||||
Common shares | 93,327 | $ | 124.85 | $ | 11,651,876 | ||||||
Common OP units | 2,408 | $ | 124.85 | 300,639 | |||||||
Subtotal | 95,735 | $ | 11,952,515 | ||||||||
Series A-1 preferred OP units | 738 | $ | 124.85 | $ | 92,139 | ||||||
Series A-3 preferred OP units | 75 | $ | 124.85 | 9,364 | |||||||
Series C preferred OP units | 345 | $ | 124.85 | 43,073 | |||||||
Series D preferred OP units | 391 | $ | 124.85 | 48,816 | |||||||
Series E preferred OP units | 62 | $ | 124.85 | 7,741 | |||||||
Total diluted shares outstanding | 97,346 | $ | 12,153,648 | ||||||||
Debt | |||||||||||
Mortgage loans payable | $ | 3,273,808 | |||||||||
Preferred Equity - Sun NG Resorts - mandatorily redeemable | 35,249 | ||||||||||
Preferred OP units - mandatorily redeemable | 34,663 | ||||||||||
Lines of credit (5) | 582,774 | ||||||||||
Total debt | $ | 3,926,494 | |||||||||
Total Capitalization | $ | 16,080,142 | |||||||||
1st Quarter 2020 Supplemental Information 6 Sun Communities, Inc.
Reconciliations to Non-GAAP Financial Measures
1st Quarter 2020 Supplemental Information 7 Sun Communities, Inc.
Reconciliation of Net Income / (Loss) Attributable to Sun Communities, Inc. Common Stockholders to FFO(1)
(amounts in thousands except for per share data)
Three Months Ended | |||||||
March 31, 2020 | March 31, 2019 | ||||||
Net Income / (Loss) Attributable To Sun Communities, Inc. Common Stockholders | $ | (16,086 | ) | $ | 34,331 | ||
Adjustments | |||||||
Depreciation and amortization | 83,752 | 76,712 | |||||
(Gain) / loss on remeasurement of marketable securities | 28,647 | (267 | ) | ||||
Loss on remeasurement of investment in nonconsolidated affiliates | 2,191 | — | |||||
Loss on remeasurement of notes receivable | 2,112 | — | |||||
Income / (loss) attributable to noncontrolling interests | (882 | ) | 723 | ||||
Preferred return to preferred OP units | 874 | 527 | |||||
Preferred distribution to Series A-4 preferred stock | — | 432 | |||||
Gain on disposition of assets, net | (5,562 | ) | (5,679 | ) | |||
FFO Attributable To Sun Communities, Inc. Common Stockholders And Dilutive Convertible Securities (1) (7) | $ | 95,046 | $ | 106,779 | |||
Adjustments | |||||||
Other acquisition related costs (8) | 385 | 160 | |||||
Loss on extinguishment of debt | 3,279 | 653 | |||||
Catastrophic weather-related charges, net | 606 | 782 | |||||
Loss of earnings - catastrophic weather related (9) | 300 | — | |||||
(Gain) / loss on foreign currency translation | 17,479 | (1,965 | ) | ||||
Other expense, net (6) | 302 | 67 | |||||
Deferred tax benefits | (130 | ) | (217 | ) | |||
Core FFO Attributable To Sun Communities, Inc. Common Stockholders And Dilutive Convertible Securities (1) (7) | $ | 117,267 | $ | 106,259 | |||
Weighted average common shares outstanding - basic | 92,410 | 85,520 | |||||
Add | |||||||
Common OP units | 2,412 | 2,722 | |||||
Common stock issuable upon conversion of stock options | 1 | 1 | |||||
Restricted stock | 524 | 512 | |||||
Common stock issuable upon conversion of Series A-3 preferred OP units | 75 | 75 | |||||
Common stock issuable upon conversion of Series A-1 preferred OP units | 746 | 803 | |||||
Common stock issuable upon conversion of Series C preferred OP units | 345 | — | |||||
Common stock issuable upon conversion of Series A-4 preferred stock | — | 472 | |||||
Weighted Average Common Shares Outstanding - Fully Diluted | 96,513 | 90,105 | |||||
FFO Attributable To Sun Communities, Inc. Common Stockholders And Dilutive Convertible Securities (1) (7) Per Share - Fully Diluted | $ | 0.98 | $ | 1.19 | |||
Core FFO Attributable To Sun Communities, Inc. Common Stockholders And Dilutive Convertible Securities (1) (7) Per Share - Fully Diluted | $ | 1.22 | $ | 1.18 | |||
1st Quarter 2020 Supplemental Information 8 Sun Communities, Inc.
Reconciliation of Net Income / (Loss) Attributable to Sun Communities, Inc. Common Stockholders to Recurring EBITDA (1)
(amounts in thousands)
Three Months Ended | |||||||
March 31, 2020 | March 31, 2019 | ||||||
Net Income / (Loss) Attributable to Sun Communities, Inc. Common Stockholders | $ | (16,086 | ) | $ | 34,331 | ||
Adjustments | |||||||
Depreciation and amortization | 83,689 | 76,556 | |||||
Loss on extinguishment of debt | 3,279 | 653 | |||||
Interest expense | 32,416 | 34,014 | |||||
Interest on mandatorily redeemable preferred OP units / equity | 1,041 | 1,094 | |||||
Current tax expense | 450 | 214 | |||||
Deferred tax benefit | (130 | ) | (217 | ) | |||
Income from nonconsolidated affiliates | (52 | ) | (388 | ) | |||
Less: Gain on dispositions of assets, net | (5,562 | ) | (5,679 | ) | |||
EBITDAre (1) | $ | 99,045 | $ | 140,578 | |||
Adjustments | |||||||
Catastrophic weather related charges, net | 606 | 782 | |||||
(Gain) / loss on remeasurement of marketable securities | 28,647 | (267 | ) | ||||
(Gain) / loss on foreign currency translation | 17,479 | (1,965 | ) | ||||
Other expense, net (6) | 302 | 67 | |||||
Loss on remeasurement of notes receivable | 2,112 | — | |||||
Loss on remeasurement of investment in nonconsolidated affiliates | 2,191 | — | |||||
Preferred return to preferred OP units / equity | 1,570 | 1,323 | |||||
Income / (loss) attributable to noncontrolling interests | (962 | ) | 1,041 | ||||
Preferred stock distribution | — | 432 | |||||
Plus: Gain on dispositions of assets, net | 5,562 | 5,679 | |||||
Recurring EBITDA (1) | $ | 156,552 | $ | 147,670 | |||
1st Quarter 2020 Supplemental Information 9 Sun Communities, Inc.
Reconciliation of Net Income / (Loss) Attributable to Sun Communities, Inc. Common Stockholders to NOI (1)
(amounts in thousands)
Three Months Ended | |||||||
March 31, 2020 | March 31, 2019 | ||||||
Net Income / (Loss) Attributable to Sun Communities, Inc. Common Stockholders | $ | (16,086 | ) | $ | 34,331 | ||
Other revenues | (6,263 | ) | (8,480 | ) | |||
Home selling expenses | 3,992 | 3,324 | |||||
General and administrative expenses | 25,517 | 21,887 | |||||
Catastrophic weather-related charges, net | 606 | 782 | |||||
Depreciation and amortization | 83,689 | 76,556 | |||||
Loss on extinguishment of debt | 3,279 | 653 | |||||
Interest expense | 32,416 | 34,014 | |||||
Interest on mandatorily redeemable preferred OP units / equity | 1,041 | 1,094 | |||||
(Gain) / loss on remeasurement of marketable securities | 28,647 | (267 | ) | ||||
(Gain) / loss on foreign currency translation | 17,479 | (1,965 | ) | ||||
Other expense, net (6) | 302 | 67 | |||||
Loss on remeasurement of notes receivable | 2,112 | — | |||||
Income from nonconsolidated affiliates | (52 | ) | (388 | ) | |||
Loss on remeasurement of investment in nonconsolidated affiliates | 2,191 | — | |||||
Current tax expense | 450 | 214 | |||||
Deferred tax benefit | (130 | ) | (217 | ) | |||
Preferred return to preferred OP units / equity | 1,570 | 1,323 | |||||
Income / (loss) attributable to noncontrolling interests | (962 | ) | 1,041 | ||||
Preferred stock distribution | — | 432 | |||||
NOI (1) / Gross Profit | $ | 179,798 | $ | 164,401 | |||
Three Months Ended | |||||||
March 31, 2020 | March 31, 2019 | ||||||
Real Property NOI (1) | $ | 156,552 | $ | 141,844 | |||
Home Sales NOI (1) / Gross Profit | 10,555 | 10,341 | |||||
Rental Program NOI (1) | 27,985 | 26,017 | |||||
Ancillary NOI (1) / Gross Profit | 2,713 | 3,077 | |||||
Site rent from Rental Program (included in Real Property NOI) (1) (10) | (18,007 | ) | (16,878 | ) | |||
NOI (1) / Gross Profit | $ | 179,798 | $ | 164,401 | |||
1st Quarter 2020 Supplemental Information 10 Sun Communities, Inc.
Non-GAAP and Other Financial Measures
1st Quarter 2020 Supplemental Information 11 Sun Communities, Inc.
Debt Analysis
(amounts in thousands)
Quarter Ended | |||||||||||||||||||
3/31/2020 | 12/31/2019 | 9/30/2019 | 6/30/2019 | 3/31/2019 | |||||||||||||||
Debt Outstanding | |||||||||||||||||||
Mortgage loans payable | $ | 3,273,808 | $ | 3,180,592 | $ | 2,967,128 | $ | 2,863,485 | $ | 2,879,017 | |||||||||
Secured borrowings on collateralized receivables (4) | — | — | 93,669 | 98,299 | 102,676 | ||||||||||||||
Preferred Equity - Sun NG Resorts - mandatorily redeemable | 35,249 | 35,249 | 35,249 | 35,249 | 35,249 | ||||||||||||||
Preferred OP units - mandatorily redeemable | 34,663 | 34,663 | 34,663 | 34,663 | 34,663 | ||||||||||||||
Lines of credit (5) | 582,774 | 183,898 | 140,632 | 76,079 | 396,512 | ||||||||||||||
Total debt | $ | 3,926,494 | $ | 3,434,402 | $ | 3,271,341 | $ | 3,107,775 | $ | 3,448,117 | |||||||||
% Fixed / Floating | |||||||||||||||||||
Fixed | 85.2 | % | 94.7 | % | 95.7 | % | 97.6 | % | 88.5 | % | |||||||||
Floating | 14.8 | % | 5.3 | % | 4.3 | % | 2.4 | % | 11.5 | % | |||||||||
Total | 100.0 | % | 100.0 | % | 100.0 | % | 100.0 | % | 100.0 | % | |||||||||
Weighted Average Interest Rates | |||||||||||||||||||
Mortgage loans payable | 3.91 | % | 4.05 | % | 4.13 | % | 4.24 | % | 4.24 | % | |||||||||
Preferred Equity - Sun NG Resorts - mandatorily redeemable | 6.00 | % | 6.00 | % | 6.00 | % | 6.00 | % | 6.00 | % | |||||||||
Preferred OP units - mandatorily redeemable | 5.93 | % | 6.50 | % | 6.50 | % | 6.50 | % | 6.50 | % | |||||||||
Lines of credit (5) | 1.85 | % | 2.71 | % | 3.23 | % | 3.34 | % | 3.73 | % | |||||||||
Average before secured borrowings (4) | 3.64 | % | 4.03 | % | 4.14 | % | 4.27 | % | 4.22 | % | |||||||||
Secured borrowings on collateralized receivables (4) | — | % | — | % | 9.92 | % | 9.93 | % | 9.94 | % | |||||||||
Total average | 3.64 | % | 4.03 | % | 4.30 | % | 4.44 | % | 4.39 | % | |||||||||
Debt Ratios | |||||||||||||||||||
Net Debt / Recurring EBITDA (1) (TTM) | 5.6 | 5.5 | 5.3 | 5.2 | 6.0 | ||||||||||||||
Net Debt / Enterprise Value | 22.6 | % | 19.0 | % | 18.7 | % | 20.2 | % | 24.1 | % | |||||||||
Net Debt / Gross Assets | 35.6 | % | 36.0 | % | 36.0 | % | 35.1 | % | 39.8 | % | |||||||||
Coverage Ratios | |||||||||||||||||||
Recurring EBITDA (1) (TTM) / Interest | 4.5 | 4.4 | 4.4 | 4.2 | 4.1 | ||||||||||||||
Recurring EBITDA (1) (TTM) / Interest + Pref. Distributions + Pref. Stock Distribution | 4.3 | 4.2 | 4.2 | 4.0 | 3.9 | ||||||||||||||
Maturities / Principal Amortization Next Five Years | 2020 | 2021 | 2022 | 2023 | 2024 | ||||||||||||||
Mortgage loans payable | |||||||||||||||||||
Maturities | $ | — | $ | 51,053 | $ | 82,155 | $ | 185,618 | $ | 315,330 | |||||||||
Principal amortization | 44,024 | 60,499 | 61,326 | 60,604 | 57,082 | ||||||||||||||
Preferred Equity - Sun NG Resorts - mandatorily redeemable | — | — | 35,249 | — | — | ||||||||||||||
Preferred OP units - mandatorily redeemable | — | — | — | — | 27,373 | ||||||||||||||
Lines of credit (5) | 7,206 | 13,977 | 10,000 | 551,912 | — | ||||||||||||||
Total | $ | 51,230 | $ | 125,529 | $ | 188,730 | $ | 798,134 | $ | 399,785 | |||||||||
Weighted average rate of maturities | — | % | 5.97 | % | 4.46 | % | 4.08 | % | 4.47 | % | |||||||||
1st Quarter 2020 Supplemental Information 12 Sun Communities, Inc.
Real Property Operations – Same Community(2)
(amounts in thousands except for Other Information)
Three Months Ended | ||||||||||||||
March 31, 2020 | March 31, 2019 | Change | % Change | |||||||||||
Financial Information | ||||||||||||||
Income from real property (11) | $ | 214,672 | $ | 204,138 | $ | 10,534 | 5.2 | % | ||||||
Property operating expenses | ||||||||||||||
Payroll and benefits | 18,812 | 18,424 | 388 | 2.1 | % | |||||||||
Legal, taxes, and insurance | 2,888 | 2,339 | 549 | 23.5 | % | |||||||||
Utilities (11) | 15,110 | 15,720 | (610 | ) | (3.9 | )% | ||||||||
Supplies and repair (12) | 6,129 | 6,302 | (173 | ) | (2.7 | )% | ||||||||
Other | 5,567 | 5,405 | 162 | 3.0 | % | |||||||||
Real estate taxes | 15,964 | 15,160 | 804 | 5.3 | % | |||||||||
Property operating expenses | 64,470 | 63,350 | 1,120 | 1.8 | % | |||||||||
Real Property NOI (1) | $ | 150,202 | $ | 140,788 | $ | 9,414 | 6.7 | % | ||||||
As of | |||||||||||||||
March 31, 2020 | March 31, 2019 | Change | % Change | ||||||||||||
Other Information | |||||||||||||||
Number of properties | 367 | 367 | - | ||||||||||||
MH occupancy (3) | 96.1 | % | |||||||||||||
RV occupancy (3) | 100.0 | % | |||||||||||||
MH & RV blended occupancy (3) | 97.0 | % | |||||||||||||
Adjusted MH occupancy (3) | 97.9 | % | |||||||||||||
Adjusted RV occupancy (3) | 100.0 | % | |||||||||||||
Adjusted MH & RV blended occupancy (3) | 98.4 | % | 96.6 | % | 1.8 | % | |||||||||
Monthly base rent per site - MH | $ | 589 | $ | 567 | $ | 22 | 4.0 | % | (14) | ||||||
Monthly base rent per site - RV (13) | $ | 495 | $ | 467 | $ | 28 | 5.8 | % | (14) | ||||||
Monthly base rent per site - Total (13) | $ | 567 | $ | 544 | $ | 23 | 4.3 | % | (14) | ||||||
1st Quarter 2020 Supplemental Information 13 Sun Communities, Inc.
Home Sales Summary
(amounts in thousands except for *)
Three Months Ended | ||||||||||||||
March 31, 2020 | March 31, 2019 | Change | % Change | |||||||||||
Financial Information | ||||||||||||||
New homes | ||||||||||||||
New home sales | $ | 15,596 | $ | 15,381 | $ | 215 | 1.4 | % | ||||||
New home cost of sales | 12,610 | 13,146 | (536 | ) | (4.1 | )% | ||||||||
NOI (1) / Gross Profit – new homes | 2,986 | 2,235 | 751 | 33.6 | % | |||||||||
Gross margin % – new homes | 19.1 | % | 14.5 | % | 4.6 | % | ||||||||
Average selling price – new homes* | $ | 131,059 | $ | 123,048 | $ | 8,011 | 6.5 | % | ||||||
Pre-owned homes | ||||||||||||||
Pre-owned home sales | $ | 24,991 | $ | 24,237 | $ | 754 | 3.1 | % | ||||||
Pre-owned home cost of sales | 17,422 | 16,131 | 1,291 | 8.0 | % | |||||||||
NOI (1) / Gross Profit – pre-owned homes | 7,569 | 8,106 | (537 | ) | (6.6 | )% | ||||||||
Gross margin % – pre-owned homes | 30.3 | % | 33.4 | % | (3.1 | )% | ||||||||
Average selling price – pre-owned homes* | $ | 38,806 | $ | 36,013 | $ | 2,793 | 7.8 | % | ||||||
Total home sales | ||||||||||||||
Revenue from home sales | 40,587 | 39,618 | 969 | 2.4 | % | |||||||||
Cost of home sales | 30,032 | 29,277 | 755 | 2.6 | % | |||||||||
NOI (1) / Gross Profit – home sales | $ | 10,555 | $ | 10,341 | $ | 214 | 2.1 | % | ||||||
Statistical Information | ||||||||||||||
New home sales volume* | 119 | 125 | (6 | ) | (4.8 | )% | ||||||||
Pre-owned home sales volume* | 644 | 673 | (29 | ) | (4.3 | )% | ||||||||
Total home sales volume * | 763 | 798 | (35 | ) | (4.4 | )% | ||||||||
1st Quarter 2020 Supplemental Information 14 Sun Communities, Inc.
Rental Program Summary
(amounts in thousands except for *)
Three Months Ended | ||||||||||||||
March 31, 2020 | March 31, 2019 | Change | % Change | |||||||||||
Financial Information | ||||||||||||||
Revenues | ||||||||||||||
Rental home revenue | $ | 15,472 | $ | 13,971 | $ | 1,501 | 10.7 | % | ||||||
Site rent from Rental Program (1) (10) | 18,007 | 16,878 | 1,129 | 6.7 | % | |||||||||
Rental Program revenue | 33,479 | 30,849 | 2,630 | 8.5 | % | |||||||||
Expenses | ||||||||||||||
Repairs and refurbishment | 2,953 | 2,349 | 604 | 25.7 | % | |||||||||
Taxes and insurance | 2,013 | 1,864 | 149 | 8.0 | % | |||||||||
Other | 528 | 619 | (91 | ) | (14.7 | )% | ||||||||
Rental Program operating and maintenance | 5,494 | 4,832 | 662 | 13.7 | % | |||||||||
Rental Program NOI (1) | $ | 27,985 | $ | 26,017 | $ | 1,968 | 7.6 | % | ||||||
Other Information | ||||||||||||||
Number of sold rental homes* | 234 | 210 | 24 | 11.4 | % | |||||||||
Number of occupied rentals, end of period* | 11,431 | 11,170 | 261 | 2.3 | % | |||||||||
Investment in occupied rental homes, end of period | $ | 596,319 | $ | 547,844 | $ | 48,475 | 8.8 | % | ||||||
Weighted average monthly rental rate, end of period* | $ | 1,009 | $ | 963 | $ | 46 | 4.8 | % | ||||||
1st Quarter 2020 Supplemental Information 15 Sun Communities, Inc.
Acquisitions and Other Summary (15)
(amounts in thousands except for statistical data)
Three Months Ended | ||||
March 31, 2020 | ||||
Financial Information | ||||
Revenues | ||||
Income from real property | $ | 14,148 | ||
Property and operating expenses | ||||
Payroll and benefits | 2,518 | |||
Legal, taxes & insurance | 292 | |||
Utilities | 1,699 | |||
Supplies and repairs | 901 | |||
Other | 1,176 | |||
Real estate taxes | 1,212 | |||
Property operating expenses | 7,798 | |||
Net operating income (NOI) (1) | $ | 6,350 | ||
Other Information | March 31, 2020 | |||
Number of properties | 57 | |||
Occupied sites | 7,730 | |||
Developed sites | 8,327 | |||
Occupancy % | 92.8 | % | ||
Transient sites | 3,300 | |||
1st Quarter 2020 Supplemental Information 16 Sun Communities, Inc.
Property Summary | |||||||||||||||
(includes MH and Annual RVs) | |||||||||||||||
COMMUNITIES | 3/31/2020 | 12/31/2019 | 9/30/2019 | 6/30/2019 | 3/31/2019 | ||||||||||
FLORIDA | |||||||||||||||
Communities | 125 | 125 | 125 | 125 | 125 | ||||||||||
Developed sites (16) | 39,380 | 39,230 | 39,067 | 38,879 | 38,878 | ||||||||||
Occupied (16) | 38,526 | 38,346 | 38,155 | 37,944 | 37,932 | ||||||||||
Occupancy % (16) | 97.8 | % | 97.7 | % | 97.7 | % | 97.6 | % | 97.6 | % | |||||
Sites for development | 1,527 | 1,527 | 1,633 | 1,638 | 1,685 | ||||||||||
MICHIGAN | |||||||||||||||
Communities | 72 | 72 | 72 | 72 | 72 | ||||||||||
Developed sites (16) | 27,883 | 27,905 | 27,906 | 27,891 | 27,777 | ||||||||||
Occupied (16) | 26,863 | 26,785 | 26,677 | 26,591 | 26,430 | ||||||||||
Occupancy % (16) | 96.3 | % | 96.0 | % | 95.6 | % | 95.3 | % | 95.2 | % | |||||
Sites for development | 1,115 | 1,115 | 1,115 | 1,115 | 1,202 | ||||||||||
TEXAS | |||||||||||||||
Communities | 23 | 23 | 23 | 23 | 23 | ||||||||||
Developed sites (16) | 7,627 | 7,615 | 7,098 | 6,997 | 6,953 | ||||||||||
Occupied (16) | 7,076 | 7,006 | 6,834 | 6,683 | 6,529 | ||||||||||
Occupancy % (16) | 92.8 | % | 92.0 | % | 96.3 | % | 95.5 | % | 93.9 | % | |||||
Sites for development | 555 | 555 | 1,086 | 1,100 | 1,107 | ||||||||||
CALIFORNIA | |||||||||||||||
Communities | 31 | 31 | 31 | 31 | 31 | ||||||||||
Developed sites (16) | 5,986 | 5,981 | 5,963 | 5,946 | 5,949 | ||||||||||
Occupied (16) | 5,948 | 5,941 | 5,917 | 5,896 | 5,902 | ||||||||||
Occupancy % (16) | 99.4 | % | 99.3 | % | 99.2 | % | 99.2 | % | 99.2 | % | |||||
Sites for development | 302 | 302 | 302 | 56 | 56 | ||||||||||
ARIZONA | |||||||||||||||
Communities | 13 | 13 | 13 | 13 | 13 | ||||||||||
Developed sites (16) | 4,268 | 4,263 | 4,239 | 4,235 | 4,238 | ||||||||||
Occupied (16) | 3,923 | 3,892 | 3,852 | 3,842 | 3,830 | ||||||||||
Occupancy % (16) | 91.9 | % | 91.3 | % | 90.9 | % | 90.7 | % | 90.4 | % | |||||
Sites for development | — | — | — | — | — | ||||||||||
ONTARIO, CANADA | |||||||||||||||
Communities | 15 | 15 | 15 | 15 | 15 | ||||||||||
Developed sites (16) | 3,977 | 4,031 | 4,022 | 3,929 | 3,832 | ||||||||||
Occupied (16) | 3,977 | 4,031 | 4,022 | 3,929 | 3,832 | ||||||||||
Occupancy % (16) | 100.0 | % | 100.0 | % | 100.0 | % | 100.0 | % | 100.0 | % | |||||
Sites for development | 1,608 | 1,611 | 1,675 | 1,675 | 1,675 | ||||||||||
INDIANA | |||||||||||||||
Communities | 11 | 11 | 11 | 11 | 11 | ||||||||||
Developed sites (16) | 3,087 | 3,087 | 3,089 | 3,089 | 3,089 | ||||||||||
Occupied (16) | 2,914 | 2,900 | 2,870 | 2,849 | 2,823 | ||||||||||
Occupancy % (16) | 94.4 | % | 93.9 | % | 92.9 | % | 92.2 | % | 91.4 | % | |||||
Sites for development | 277 | 277 | 277 | 277 | 277 | ||||||||||
OHIO | |||||||||||||||
Communities | 9 | 9 | 9 | 9 | 9 | ||||||||||
Developed sites (16) | 2,768 | 2,770 | 2,770 | 2,770 | 2,770 | ||||||||||
Occupied (16) | 2,702 | 2,716 | 2,703 | 2,705 | 2,704 | ||||||||||
Occupancy % (16) | 97.6 | % | 98.1 | % | 97.6 | % | 97.7 | % | 97.6 | % | |||||
Sites for development | 59 | 59 | 59 | 59 | 59 | ||||||||||
1st Quarter 2020 Supplemental Information 17 Sun Communities, Inc.
Property Summary | |||||||||||||||
(includes MH and Annual RVs) | |||||||||||||||
COMMUNITIES | 3/31/2020 | 12/31/2019 | 9/30/2019 | 6/30/2019 | 3/31/2019 | ||||||||||
COLORADO | |||||||||||||||
Communities | 10 | 10 | 10 | 8 | 8 | ||||||||||
Developed sites (16) | 2,423 | 2,423 | 2,423 | 2,335 | 2,335 | ||||||||||
Occupied (16) | 2,318 | 2,322 | 2,325 | 2,323 | 2,323 | ||||||||||
Occupancy % (16) | 95.7 | % | 95.8 | % | 96.0 | % | 99.5 | % | 99.5 | % | |||||
Sites for development | 1,867 | 1,867 | 1,973 | 2,129 | 2,129 | ||||||||||
OTHER STATES | |||||||||||||||
Communities | 115 | 113 | 80 | 75 | 72 | ||||||||||
Developed sites (16) | 22,583 | 22,572 | 17,203 | 16,493 | 16,354 | ||||||||||
Occupied (16) | 21,749 | 21,678 | 16,657 | 16,026 | 15,826 | ||||||||||
Occupancy % (16) | 96.3 | % | 96.0 | % | 96.8 | % | 97.2 | % | 96.8 | % | |||||
Sites for development | 2,980 | 2,980 | 2,437 | 2,705 | 2,987 | ||||||||||
TOTAL - PORTFOLIO | |||||||||||||||
Communities | 424 | 422 | 389 | 382 | 379 | ||||||||||
Developed sites (16) | 119,982 | 119,877 | 113,780 | 112,564 | 112,175 | ||||||||||
Occupied (16) | 115,996 | 115,617 | 110,012 | 108,788 | 108,131 | ||||||||||
Occupancy % (16) | 96.7 | % | (17) | 96.4 | % | 96.7 | % | 96.6 | % | 96.4 | % | ||||
Sites for development (18) | 10,290 | 10,293 | 10,557 | 10,754 | 11,177 | ||||||||||
% Communities age restricted | 34.0 | % | 34.1 | % | 30.8 | % | 31.4 | % | 31.7 | % | |||||
TRANSIENT RV PORTFOLIO SUMMARY | |||||||||||||||
Location | |||||||||||||||
Florida | 5,311 | 5,465 | 5,506 | 5,693 | 5,650 | ||||||||||
California | 1,947 | 1,952 | 1,970 | 1,985 | 1,975 | ||||||||||
Texas | 1,612 | 1,623 | 1,642 | 1,693 | 1,717 | ||||||||||
Maryland | 1,488 | 1,488 | 1,426 | 1,380 | 1,375 | ||||||||||
Arizona | 1,392 | 1,397 | 1,421 | 1,424 | 1,421 | ||||||||||
Ontario, Canada | 1,009 | 939 | 937 | 1,043 | 1,131 | ||||||||||
New York | 916 | 923 | 924 | 935 | 929 | ||||||||||
New Jersey | 875 | 864 | 868 | 875 | 906 | ||||||||||
Maine | 828 | 811 | 821 | 848 | 857 | ||||||||||
Utah | 750 | 753 | 560 | 562 | 562 | ||||||||||
Virginia | 630 | 324 | 329 | 358 | 369 | ||||||||||
Michigan | 590 | 570 | 569 | 584 | 611 | ||||||||||
Other states | 4,532 | 4,307 | 3,909 | 3,205 | 2,670 | ||||||||||
Total transient RV sites | 21,880 | 21,416 | 20,882 | 20,585 | 20,173 | ||||||||||
1st Quarter 2020 Supplemental Information 18 Sun Communities, Inc.
Capital Improvements, Development, and Acquisitions
(amounts in thousands except for *)
Recurring Capital Expenditures Average/Site* | Recurring Capital Expenditures (19) | Lot Modifications (20) | Acquisitions (21) | Expansion & Development (22) | Revenue Producing/Expense Reduction projects (23) | |||||||||||||
YTD 2020 | $ | 50 | $ | 5,889 | $ | 7,923 | $ | 37,076 | $ | 60,218 | $ | 4,351 | ||||||
2019 | $ | 345 | $ | 30,382 | $ | 31,135 | $ | 930,668 | $ | 281,808 | $ | 9,638 | ||||||
2018 | $ | 263 | $ | 24,265 | $ | 22,867 | $ | 414,840 | $ | 152,672 | $ | 3,864 | ||||||
1st Quarter 2020 Supplemental Information 19 Sun Communities, Inc.
Operating Statistics for MH and Annual RVs
LOCATIONS | Resident Move-outs | Net Leased Sites (24) | New Home Sales | Pre-owned Home Sales | Brokered Re-sales | ||||||||||
Florida | 376 | 180 | 40 | 63 | 358 | ||||||||||
Michigan | 215 | 78 | 8 | 298 | 31 | ||||||||||
Ontario, Canada | 375 | (54 | ) | 6 | 6 | 21 | |||||||||
Texas | 79 | 70 | 11 | 77 | 11 | ||||||||||
Arizona | 20 | 31 | 14 | 6 | 42 | ||||||||||
Indiana | 25 | 14 | 1 | 63 | 3 | ||||||||||
Ohio | 47 | (14 | ) | — | 30 | 2 | |||||||||
California | 25 | 7 | 7 | 3 | 22 | ||||||||||
Colorado | 4 | (4 | ) | — | 7 | 8 | |||||||||
Other states | 580 | (8 | ) | 32 | 91 | 61 | |||||||||
Three Months Ended March 31, 2020 | 1,746 | 300 | 119 | 644 | 559 | ||||||||||
TOTAL FOR YEAR ENDED | Resident Move-outs | Net Leased Sites (24) | New Home Sales | Pre-owned Home Sales | Brokered Re-sales | ||||||||||
2019 | 4,139 | 2,674 | 571 | 2,868 | 2,231 | ||||||||||
2018 | 3,435 | 2,600 | 526 | 3,103 | 2,147 | ||||||||||
PERCENTAGE TRENDS | Resident Move-outs | Resident Re-sales | ||||
2020 (TTM) | 2.8 | % | 6.8 | % | ||
2019 | 2.6 | % | 6.6 | % | ||
2018 | 2.4 | % | 7.2 | % | ||
1st Quarter 2020 Supplemental Information 20 Sun Communities, Inc.
Footnotes and Definitions
(1) | Investors in and analysts following the real estate industry utilize funds from operations (“FFO”), net operating income (“NOI”), and earnings before interest, tax, depreciation and amortization (“EBITDA”) as supplemental performance measures. The Company believes that FFO, NOI, and EBITDA are appropriate measures given their wide use by and relevance to investors and analysts. Additionally, FFO, NOI, and EBITDA are commonly used in various ratios, pricing multiples, yields and returns and valuation calculations used to measure financial position, performance and value. |
• | FFO, reflecting the assumption that real estate values rise or fall with market conditions, principally adjusts for the effects of generally accepted accounting principles (“GAAP”) depreciation and amortization of real estate assets. |
• | NOI provides a measure of rental operations that does not factor in depreciation, amortization and non-property specific expenses such as general and administrative expenses. |
• | EBITDA provides a further measure to evaluate ability to incur and service debt and to fund dividends and other cash needs. |
FFO is defined by the National Association of Real Estate Investment Trusts (“NAREIT”) as GAAP net income (loss), excluding gains (or losses) from sales of depreciable operating property, plus real estate-related depreciation and amortization, and after adjustments for unconsolidated partnerships and joint ventures. FFO is a non-GAAP financial measure that management believes is a useful supplemental measure of the Company’s operating performance. By excluding gains and losses related to sales of previously depreciated operating real estate assets, impairment and excluding real estate asset depreciation and amortization (which can vary among owners of identical assets in similar condition based on historical cost accounting and useful life estimates), FFO provides a performance measure that, when compared period-over-period, reflects the impact to operations from trends in occupancy rates, rental rates, and operating costs, providing perspective not readily apparent from GAAP net income (loss). Management believes the use of FFO has been beneficial in improving the understanding of operating results of REITs among the investing public and making comparisons of REIT operating results more meaningful. The Company also uses FFO excluding certain gain and loss items that management considers unrelated to the operational and financial performance of our core business (“Core FFO”). The Company believes that Core FFO provides enhanced comparability for investor evaluations of period-over-period results.
The Company believes that GAAP net income (loss) is the most directly comparable measure to FFO. The principal limitation of FFO is that it does not replace GAAP net income (loss) as a performance measure or GAAP cash flow from operations as a liquidity measure. Because FFO excludes significant economic components of GAAP net income (loss) including depreciation and amortization, FFO should be used as a supplement to GAAP net income (loss) and not as an alternative to it. Further, FFO is not intended as a measure of a REIT’s ability to meet debt principal repayments and other cash requirements, nor as a measure of working capital. FFO is calculated in accordance with the Company’s interpretation of standards established by NAREIT, which may not be comparable to FFO reported by other REITs that interpret the NAREIT definition differently.
NOI is derived from revenues minus property operating expenses and real estate taxes. NOI is a non-GAAP financial measure that the Company believes is helpful to investors as a supplemental measure of operating performance because it is an indicator of the return on property investment and provides a method of comparing property performance over time. The Company uses NOI as a key measure when evaluating performance and growth of particular properties and/or groups of properties. The principal limitation of NOI is that it excludes depreciation, amortization, interest expense and non-property specific expenses such as general and administrative expenses, all of which are significant costs. Therefore, NOI is a measure of the operating performance of the properties of the Company rather than of the Company overall.
The Company believes that GAAP net income (loss) is the most directly comparable measure to NOI. NOI should not be considered to be an alternative to GAAP net income (loss) as an indication of the Company’s financial performance or GAAP cash flow from operating activities as a measure of the Company’s liquidity; nor is it indicative of funds available for the Company’s cash needs, including its ability to make cash distributions. Because of the inclusion of items such as interest, depreciation, and amortization, the use of GAAP net income (loss) as a performance measure is limited as these items may not accurately reflect the actual change in market value of a property, in the case of depreciation and in the case of interest, may not necessarily be linked to the operating performance of a real estate asset, as it is often incurred at a parent company level and not at a property level.
EBITDA as defined by NAREIT (referred to as “EBITDAre”) is calculated as GAAP net income (loss), plus interest expense, plus income tax expense, plus depreciation and amortization, plus or minus losses or gains on the disposition of depreciated property (including losses or gains on change of control), plus impairment write-downs of depreciated property and of investments in unconsolidated affiliates caused by a decrease in value of depreciated property in the affiliate, and adjustments to reflect the entity’s share of EBITDAre of unconsolidated affiliates. EBITDAre is a non-GAAP financial measure that the Company uses to evaluate its ability to incur and service debt, fund dividends and other cash needs and cover fixed costs. Investors utilize EBITDAre as a supplemental measure to evaluate and compare investment quality and enterprise value of REITs. The Company also uses EBITDAre excluding certain gain and loss items that management considers unrelated to measurement of the Company’s performance on a basis that is independent of capital structure (“Recurring EBITDA”).
1st Quarter 2020 Supplemental Information 21 Sun Communities, Inc.
The Company believes that GAAP net income (loss) is the most directly comparable measure to EBITDAre. EBITDAre is not intended to be used as a measure of the Company’s cash generated by operations or its dividend-paying capacity, and should therefore not replace GAAP net income (loss) as an indication of the Company’s financial performance or GAAP cash flow from operating, investing and financing activities as measures of liquidity.
(2) Same Community results reflect constant currency for comparative purposes. Canadian currency figures in the prior comparative period have been translated at 2020 actual exchange rates.
(3) The Same Community occupancy percentage is 96.1 percent for MH, 100.0 percent for RV, and 97.0 percent for the blended MH and RV. The MH and RV blended occupancy is derived from 111,655 developed sites, of which 108,266 were occupied. The Same Community occupancy percentage for 2019 has been adjusted to reflect incremental period-over-period growth from filled expansion sites and the conversion of transient RV sites to annual RV sites. The adjusted Same Community occupancy percentage for 2020 is derived from 110,001 developed sites, of which 108,266 were occupied. The number of developed sites excludes RV transient sites and approximately 1,700 recently completed but vacant MH expansion sites.
(4) This is a transferred asset transaction which has been classified as collateralized receivables and the cash received from this transaction has been classified as a secured borrowing. The interest income and interest expense accrue at the same rate and amount. In November 2019, the Company derecognized the transferred financial assets and secured borrowing as legal isolation criteria to be accounted for as a true sale were satisfied pursuant to the terms of the purchase agreement.
(5) Lines of credit includes the Company’s MH floor plan facility. The effective interest rate on the MH floor plan facility was 7.0 percent for all periods presented. However, the Company pays no interest if the floor plan balance is repaid within 60 days.
(6) Other expense, net was as follows (in thousands)
Three Months Ended | |||||||
March 31, 2020 | March 31, 2019 | ||||||
Foreign currency remeasurement loss | $ | (220 | ) | $ | 4 | ||
Contingent liability remeasurement loss | (82 | ) | (71 | ) | |||
Other expense, net | $ | (302 | ) | $ | (67 | ) | |
(7) The effect of certain anti-dilutive convertible securities is excluded from these items.
(8) These costs represent the expenses incurred to bring recently acquired properties up to the Company’s operating standards, including items such as tree trimming and painting costs that do not meet the Company’s capitalization policy.
(9) | Core FFO(1) includes an adjustment of $0.3 million for the three months ended March 31, 2020, for estimated loss of earnings in excess of the applicable business interruption deductible in relation to the Company’s Florida Keys communities that required redevelopment due to damages sustained from Hurricane Irma in September 2017. |
(10) The renter’s monthly payment includes the site rent and an amount attributable to the home lease. The site rent is reflected in Real Property Operations’ segment revenue. For purposes of management analysis, site rent is included in Rental Program revenue to evaluate the incremental revenue gains associated with the Rental Program, and to assess the overall growth and performance of the Rental Program and financial impact on the Company’s operations.
(11) Same Community results net $9.0 million and $8.5 million of certain utility revenue against the related utility expense in property operating expense for the three months ended March 31, 2020 and 2019, respectively.
(12) Same Community supplies and repair expense excludes $0.1 million for the three months ended March 31, 2019, of expenses incurred for recently acquired properties to bring the properties up to the Company’s operating standards, including items such as tree trimming and painting costs that do not meet the Company’s capitalization policy.
(13) Monthly base rent per site pertains to annual RV sites and excludes transient RV sites.
(14) Calculated using actual results without rounding.
(15) Acquisitions and other is comprised of 2 properties acquired and 3 properties that we have an interest in, but do not operate in 2020, forty-two properties acquired in 2019, one property being operated under a temporary use permit, three Florida Keys properties that require redevelopment as a result of damage sustained from Hurricane Irma in 2017, five recently opened ground-up developments, one property undergoing redevelopment, and other miscellaneous transactions and activity.
(16) Includes MH and annual RV sites, and excludes transient RV sites, as applicable.
1st Quarter 2020 Supplemental Information 22 Sun Communities, Inc.
(17) As of March 31, 2020, total portfolio MH occupancy was 95.8 percent inclusive of the impact of approximately 1,900 recently constructed but vacant MH expansion sites, and annual RV occupancy was 100.0 percent.
(18) Total sites for development were comprised of approximately 76.3 percent for expansion, 17.6 percent for greenfield development and 6.1 percent for redevelopment.
(19) Recurring capital expenditures are necessary to maintain asset quality, including purchasing and replacing assets used to operate the community. These capital expenditures include items such as: major road, driveway, pool improvements; clubhouse renovations; adding or replacing street lights; playground equipment; signage; maintenance facilities; manager housing and property vehicles. The minimum capitalized amount is five hundred dollars.
(20) Lot modification capital expenditures improve the asset quality of the community. These costs are incurred when an existing older home moves out, and the site is prepared for a new home, more often than not, a multi-sectional home. These activities, which are mandated by strict manufacturer’s installation requirements and state building code, include items such as new foundations, driveways, and utility upgrades.
(21) Capital expenditures related to acquisitions represent the purchase price of existing operating communities and land parcels to develop expansions or new communities. These costs for the three months ended March 31, 2020 include $10.9 million of capital improvements identified during due diligence that are necessary to bring the communities to the Company’s operating standards. For the years ended December 31, 2019 and 2018, these costs were $50.7 million and $94.6 million, respectively. These include items such as: upgrading clubhouses; landscaping; new street light systems; new mail delivery systems; pool renovation including larger decks, heaters, and furniture; new maintenance facilities; and new signage including main signs and internal road signs. These are considered acquisition costs and although identified during due diligence, often require 24 to 36 months after closing to complete.
(22) Expansion and development expenditures consist primarily of construction costs and costs necessary to complete home site improvements, such as driveways, sidewalks and landscaping.
(23) Capital costs related to revenue generating activities consist primarily of garages, sheds, sub-metering of water, sewer and electricity. Revenue generating attractions at our RV resorts are also included here and, occasionally, a special capital project requested by residents and accompanied by an extra rental increase will be classified as revenue producing.
(24) Net leased sites do not include occupied sites acquired during that year.
Certain financial information has been revised to reflect reclassifications in prior periods to conform to current period presentation.
1st Quarter 2020 Supplemental Information 23 Sun Communities, Inc.