Attached files
| file | filename |
|---|---|
| 8-K - 8-K - CAMBRIDGE BANCORP | catc-8k_20200331.htm |

FOR IMMEDIATE RELEASE
Cambridge Bancorp Announces First Quarter 2020 Earnings and Declares Dividend
CAMBRIDGE, MA. (April 22, 2020) - Cambridge Bancorp (NASDAQ: CATC) (the “Company”), the parent company of Cambridge Trust Company (the “Bank”), today announced unaudited net income of $7,232,000 for the quarter ended March 31, 2020, an increase of $1,034,000, or 16.7%, compared to net income of $6,198,000 for the quarter ended March 31, 2019. Diluted earnings per share were $1.33 for the first quarter of 2020, representing a 10.7% decrease over diluted earnings per share of $1.49 for the same quarter last year.
Excluding non-operating expenses, operating net income was $7,434,000 for the quarter ended March 31, 2020, an increase of $1,108,000, or 17.5%, compared to operating net income of $6,326,000 for the quarter ended March 31, 2019. Operating diluted earnings per share were $1.37 for the first quarter of 2020, representing a 10.5% decrease over operating diluted earnings per share of $1.53 for the same quarter last year.
First quarter 2020 highlights as compared to the fourth quarter of 2019:
|
• |
Loan growth of $29.1 million, or 1.3% |
|
• |
Deposit growth of $31.5 million, or 1.3% |
|
• |
Tangible common equity of 9.34%, growth of 4.6% |
|
• |
Tangible book value per share of $48.60, growth of 4.2% |
|
• |
Prudently increased the allowance for credit losses by $2.0 million primarily as a result of the COVID-19 pandemic |
|
• |
Asset quality remains strong with ratio of non-performing loans to total loans of 0.15% and non-performing assets to total assets of 0.20% |
COVID-19 response and actions:
During the first quarter of 2020, the Company announced a range of initiatives to help clients, communities, and employees navigate the many financial challenges caused by the novel corona virus (“COVID-19”) pandemic. As a result of the COVID-19 crisis, the Company has taken the following steps to provide support to any client experiencing a hardship during this uncertain time.
For Banking Clients:
|
|
• |
Access to banking offices by appointment |
|
|
• |
Increased telephone banking support through the Client Resource Center |
|
|
• |
Waived penalties for early certificate of deposit withdrawals |
|
|
• |
Increased ATM withdrawal limits and debit card spending |
|
|
• |
Convenient and secure digital platforms for remote banking |
For Consumer Loan Clients:
|
|
• |
90-day postponement of residential loan foreclosures |
|
|
• |
Payment deferrals on mortgages and home equity loans, based on need |
|
|
• |
Forgiving late charges for consumer loan payments |
1
For Business and Commercial Banking Clients:
|
|
• |
Participating in the Small Business Administration (“SBA”) Paycheck Protection Program (“PPP”) lending program, the Company has processed and obtained SBA approval for 372 loan applications totaling $115.0 million as of April 17, 2020. |
|
|
• |
Increased remote deposit limits |
|
|
• |
Implemented payment relief options for commercial loans, based on need |
|
|
• |
Providing assistance with access to government support and lending programs |
|
|
• |
Treasury management services to support business continuity |
|
|
• |
Secure online and mobile banking platforms |
For Wealth Management Clients:
The Company’s wealth management team is closely monitoring the economy and financial markets and continues to actively manage clients’ portfolios through the current volatility. We have urged clients to reach out to their Relationship Manager directly with any questions or concerns.
For Communities:
In addition to the 250 plus organizations the Company supports through its annual charitable giving, the Company is donating an additional $250,000 to organizations supporting those most impacted by COVID-19.
For Employees:
The Company is taking precautions to protect the health and safety of its staff, while continuing to provide uninterrupted service to clients. Efforts include:
|
|
• |
Temporary closure of all banking office lobbies, with services remaining available by appointment |
|
|
• |
Increased cleaning of all office locations |
|
|
• |
95% of staff working remotely with the exception of essential banking office employees |
|
|
• |
Teleconferencing for meetings |
“We are focused on employee safety and in assisting our clients and communities. During the first quarter, our team worked tirelessly to execute remote operation while continuing to meet the need of clients, whether basic banking needs, loan modification requests or the implementation of the Small Business Administration PPP lending program. I thank my colleagues for their incredible innovation, determination, and effort. I thank clients for their patience and heartfelt messages of concern and appreciation,” noted Denis K. Sheahan, Chairman and CEO.
Balance Sheet
Total assets remained stable from December 31, 2019 and were $2.9 billion as of March 31, 2020.
Cash and cash equivalents decreased by $18.3 million from December 31, 2019 and were $43.0 million as of March 31, 2020.
Total loans increased by $29.1 million, or 1.3%, from December 31, 2019 and stood at $2.3 billion as of March 31, 2020. Loan originations remained strong in the first quarter of 2020; however, expectations for growth moving forward is unpredictable in the current environment.
|
|
• |
Residential real estate loans decreased by $463,000 from $917.6 million at December 31, 2019 to $917.1 million at March 31, 2020. |
|
|
• |
Commercial real estate loans increased by $29.2 million, from $1.06 billion at December 31, 2019 to $1.09 billion at March 31, 2020. |
|
|
• |
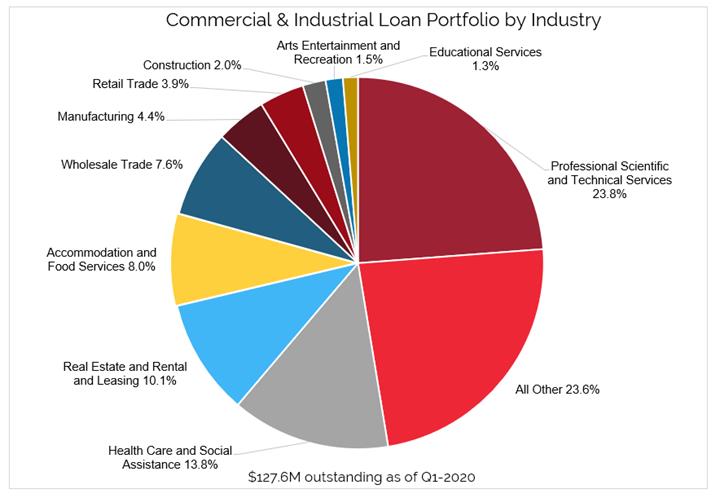
Commercial & industrial loans decreased by $5.6 million from $133.2 million at December 31, 2019 to $127.6 million at March 31, 2020. |
2
The Company’s total investment securities portfolio decreased by $33.6 million, or 8.4%, from $398.5 million at December 31, 2019 to $364.9 million at March 31, 2020 as the Company used investment cash flow to pay down wholesale funding.
Total deposits grew by $31.5 million, or 1.3%, to $2.4 billion at March 31, 2020.
|
|
• |
Core deposits, which the Company defines as all deposits other than certificates of deposit, decreased by $5.6 million, or 0.3%, to $2.2 billion at March 31, 2020. |
|
|
• |
The cost of total deposits for the quarter ended March 31, 2020 was 0.54%, as compared to 0.68% for the quarter ended December 31, 2019, a reduction of 14 basis points driven by reduced interest rates during 2020. At March 31, 2020, the spot cost of deposits was 0.27%. |
Certificates of deposit totaled $219.4 million at March 31, 2020, an increase of $37.1 million from $182.3 million at December 31, 2019, primarily due to an increase in short-term brokered certificates of deposit. Total brokered certificates of deposit, which are included within certificates of deposit, were $58.8 million and $7.1 million at March 31, 2020 and December 31, 2019, respectively.
Short-term borrowings were $75.1 million as of March 31, 2020, representing a $60.5 million, or 44.6%, decrease from $135.7 million at December 31, 2019. During the first quarter, the Company utilized cash flow and maturities from the investment portfolio to reduce wholesale funding.
Net Interest and Dividend Income
For the quarter ended March 31, 2020, net interest and dividend income before the provision for loan losses increased by $6.1 million, or 37.8%, to $22.4 million, as compared to $16.3 million for the quarter ended March 31, 2019, primarily due to loan growth.
|
|
• |
Interest on loans increased by $7.2 million, or 43.7%, which was primarily a result of net loan growth, both organic and due to the merger with Optima in 2019. |
|
|
• |
Interest on deposits increased by $628,000, or 25.1%, as a result of the merger with Optima and due to strong core deposit growth during 2019. |
The Company’s net interest margin, on a fully taxable equivalent basis, increased 20 basis points to 3.39% for the quarter ended March 31, 2020, as compared to 3.19% for the quarter ended December 31, 2019. During the quarter, the Company took steps to reduce the cost of deposits to mitigate the impact of falling interest rates on the net interest margin.
Provision for Credit Losses
During the three months ended March 31, 2020, the Company recorded provision for credit losses of $2.0 million, primarily as a result of the expected impact of COVID-19 virus within the current expected credit losses (“CECL”) methodology which is described in more detail below. During the first quarter of 2020, the Company recorded $265,000 in net loan charge-offs.
Noninterest Income
Total noninterest income increased by $861,000, or 10.8%, to $8.8 million for the quarter ended March 31, 2020, as compared to $8.0 million for the quarter ended March 31, 2019, primarily as a result of increases in Wealth Management revenue, loan related derivative income and higher gains on loans sold. Noninterest income was 28.2% of total revenue for the quarter ended March 31, 2020.
|
|
• |
Wealth Management revenue increased by $503,000, or 8.2% to $6.6 million for the first quarter of 2020, as compared to $6.1 million for the first quarter of 2019. Wealth Management Assets under Management and Administration were $3.1 billion as of March 31, 2020, a decrease of $381.6 million, or 11.1%, from |
3
|
|
December 31, 2019, primarily as a result of reductions within the equity markets during the first quarter of 2020. |
|
|
• |
Loan related derivative income increased by $74,000, or 17.0%, to $510,000 for the first quarter of 2020, as compared to $436,000 for the first quarter of 2019, due to increased loan volume and the associated derivative transactions executed throughout the quarter. |
|
|
• |
Gain on loans sold increased by $103,000, as compared to the first quarter of 2019, due to increased sales of residential mortgages. |
Noninterest Expense
Total noninterest expense increased by $3.6 million, or 21.7%, to $19.9 million for the quarter ended March 31, 2020, as compared to $16.4 million for the quarter ended March 31, 2019, primarily driven by increases in salaries and benefits expense, occupancy and equipment expense, and data processing expense.
|
|
• |
Salaries and employee benefits expense increased $2.2 million driven by merit increases, increased staffing related to the Optima merger, additions to support business initiatives, and higher employee benefit costs. |
|
|
• |
Occupancy and equipment expense increased $477,000 due to the operation of additional branches and office space as a result of the Optima merger that was not reflected within the first quarter of 2019. |
|
|
• |
Data processing expense increased $339,000 due to the merger with Optima and investments made in technology. |
Asset Quality
Non-performing loans totaled $3.4 million, or 0.15% of total loans outstanding as of March 31, 2020. The allowance for loan losses was $20.2 million, or 0.89% of total loans outstanding at March 31, 2020, as compared to $18.2 million, or 0.82% of total loans outstanding at year end 2019. The increase in the allowance to total loans ratio during 2020 was primarily due to the expected impact of the COVID-19 pandemic on loan losses going forward. The Company currently holds $2.5 million in real estate owned property, comprised of two properties, one of which was a previously disclosed acquired commercial real estate loan in New Hampshire.
CECL
The Company adopted ASU 2016-13 - Measurement of Credit Losses on Financial Instruments, in the first quarter of 2020 and recorded a one-time transition amount of $347,000, net of taxes, as a decrease to retained earnings. This amount represents additional reserves for loans and unfunded commitments that existed upon adopting the new guidance. The adoption of ASU 2016-13 did not have a material impact on the Company’s regulatory capital ratios. The CECL methodology requires earlier recognition of credit losses using a lifetime credit loss measurement approach for financial assets carried at amortized cost. The CECL methodology also requires consideration of a broader range of reasonable and supportable information to determine credit loss estimates including economic factors. During the first quarter 2020, the Company increased the allowance for credit losses by approximately $2.0 million primarily due to the forecasted impact of the COVID-19 pandemic on the economic factors utilized within the CECL methodology. This increase was based on the information available to the Company at quarter end and will be updated as greater clarity around the impact of the COVID-19 virus becomes available.
COVID-19
In an effort to better inform shareholders of the potential exposures to the COVID-19 pandemic, we have provided additional detail in the financial section of this document regarding the Bank’s loan portfolio that may be of use to investors.
Forbearance/Modifications. The Company has instituted payment deferral programs to aid existing borrowers with payment forbearance. For commercial and consumer borrowers, we have endeavored to provide payment
4
relief for 90 days for borrowers who have been impacted by the COVID-19 virus and have requested payment assistance. We expect to continue to accrue interest on these loans during the payment deferral period. As of April 17, 2020, the Company has approved 83 commercial loan payment relief requests totaling $31.5 million, or 2.6% of the total commercial loan portfolio and 62 consumer loan payment relief requests totaling $21.0 million, or 2.0% of the total consumer loan portfolio.
Income Taxes
The Company’s effective tax rate was 22.2% for the quarter ended March 31, 2020, as compared to 21.9% for the quarter ended March 31, 2019. The Coronavirus Aid, Relief, and Economic Security (the “CARES Act”) was signed into law on March 27, 2020, to help stimulate the United States economy. One of the business tax provisions of the CARES Act included allowing net operating losses (“NOL”) generated by the Company in tax years 2018 and 2019 to be carried back up to five years at the tax rates in effect during those periods, rather than carried forward at current federal tax rates of 21%. The effect of the Act allowed the Company to recognize lower tax expense associated with NOL carryforwards from 2018 and 2019 (as a result of the Optima merger) and combined with adjustments to state NOL rates, resulted in a benefit of $372,000 in the first quarter of 2020. Additionally, the Company recognized $21,000 of tax benefit resulting from the accounting for share-based payments during the first quarter of 2020.
Dividend & Capital
On April 21, 2020, the Company’s Board of Directors declared a quarterly cash dividend of $0.53 per share, which is payable on May 21, 2020, to shareholders of record as of the close of business on May 7, 2020. This represents an increase of $0.02 per share, as compared to the $0.51 per share dividend paid in same quarter of 2019.
The Company’s total shareholders’ equity to total assets ratio increased by 40 basis points to 10.44% as of March 31, 2020, as compared to 10.04% as of December 31, 2019. Book value per share grew by $1.90, or 3.58%, to $54.96 as of March 31, 2020, as compared to $53.06 as of December 31, 2019.
The Company’s ratio of tangible common equity to tangible assets increased 4.5%, to 9.34%, at March 31, 2020, from 8.93% at December 31, 2019, primarily due to the Company’s earnings combined with increased valuations of interest rate derivative positions and available for sale investment securities. Tangible book value per share grew by $1.94, or 4.2%, to $48.60 as of March 31, 2020, as compared to $46.66 as of December 31, 2019.
Merger Update
The Company is awaiting regulatory approvals for the proposed merger between the Company and Wellesley Bancorp, Inc. (“Wellesley”). The shareholders of Wellesley and the Company both approved the merger at a special meeting held on March 12, 2020, and March 16, 2020, respectively. The closing of the merger is expected to occur in the second quarter of 2020, subject to customary closing conditions. The addition of Wellesley’s six banking offices will bring the Company’s total full-service banking office count to 22 and allow the Company to enhance and expand the Company’s Greater Boston presence with the addition of Wellesley’s full-service banking offices in Norfolk, Middlesex, and Suffolk Counties.
About Cambridge Bancorp
Cambridge Bancorp, the parent company of Cambridge Trust Company, is based in Cambridge, Massachusetts. Cambridge Trust Company is a 130-year-old Massachusetts chartered commercial bank with approximately $2.9 billion in assets as of March 31, 2020, and a total of 16 Massachusetts and New Hampshire locations. Cambridge Trust Company is one of New England’s leaders in private banking and wealth management with $3.1 billion in client assets under management and administration as of March 31, 2020. The Wealth Management group maintains offices in Boston, Massachusetts and Concord, Manchester, and Portsmouth, New Hampshire.
5
The accompanying unaudited condensed interim and annual consolidated financial information should be read in conjunction with the audited consolidated financial statements and notes thereto included in the Company’s Annual Report on Form 10-K, which is posted in the investor relations section of the Company’s website at www.cambridgetrust.com.
Forward-looking Statements
Certain statements herein may constitute “forward-looking statements” as defined in the Private Securities Litigation Reform Act of 1995. Such forward-looking statements about the Company and its industry involve substantial risks and uncertainties. Statements other than statements of current or historical fact, including statements regarding the Company’s future financial condition, results of operations, business plans, liquidity, cash flows, projected costs, the impact of any laws or regulations applicable to the Company, and measures being taken in response to the COVID-19 pandemic and the impact of the COVID-19 pandemic on the Company’s business are forward-looking statements. Words such as “anticipates,” “believes,” “estimates,” “expects,” “forecasts,” “intends,” “plans,” “projects,” “may,” “will,” “should,” and other similar expressions are intended to identify these forward-looking statements. Such statements are subject to factors that could cause actual results to differ materially from anticipated results. Such factors include, but are not limited to, the following: the current global economic uncertainty and economic conditions being less favorable than expected, disruptions to the credit and financial markets, changes in the Company’s accounting policies or in accounting standards, weakness in the real estate market, legislative, regulatory or accounting changes that adversely affect the Company’s business and/or competitive position, the Dodd-Frank Act’s consumer protection regulations, the duration and scope of the COVID-19 pandemic and its impact on levels of consumer confidence, actions governments, businesses and individuals take in response to the COVID-19 pandemic, the impact of the COVID-19 pandemic and actions taken in response to the pandemic on global and regional economies and economic activity, the pace of recovery when the COVID-19 pandemic subsides, challenges from the integration of the Company and Optima resulting in the combined business not operating as effectively as expected, disruptions in the Company’s ability to access the capital markets, the businesses of the Company and Wellesley may not be combined successfully, or such combination may take longer than expected, the cost savings of the merger with Wellesley may not be fully realized or may take longer to realize than expected, operating costs, customer loss and business disruption following the Wellesley merger, including adverse effects on relationships with employees, may be greater than expected, governmental approvals of the merger with Wellesley may not be obtained, or adverse regulatory conditions may be imposed in connection with governmental approvals of the merger, , and other factors that are described in the Company’s filings with the Securities and Exchange Commission, including the Annual Report on Form 10-K for the year end December 31, 2019, which the Company filed on March 16, 2020. The Company does not undertake, and specifically disclaims any obligation, to publicly release the result of any revisions which may be made to any forward-looking statements to reflect the occurrence of anticipated or unanticipated events or circumstances after the date of such statements. You are cautioned not to place undue reliance on these forward-looking statements.
Non-GAAP Measures
This press release contains financial information determined by methods other than in accordance with accounting principles generally accepted in the United States of America (“GAAP”). This information includes operating net income and operating diluted earnings per share, tangible book value per share and the tangible common equity ratio, and return on average assets, return on tangible common equity, and efficiency ratio on an operating basis.
Operating net income and operating diluted earnings per share exclude items that management believes are unrelated to its core banking business such as merger, acquisition, and capital raise expenses, gain (loss) on sale of investment securities, and other items. The Company’s management uses operating net income and operating diluted earnings per share to measure the strength of the Company’s core banking business and to identify trends that may to some extent be obscured by such excluded gains or losses.
Management also supplements its evaluation of financial performance with analysis of tangible book value per share (which is computed by dividing stockholders’ equity less goodwill and acquisition related intangible assets,
6
or “tangible common equity,” by common shares outstanding), the tangible common equity ratio (which is computed by dividing tangible common equity by tangible assets, defined as total assets less goodwill and acquisition related intangibles),analysis of return on average assets and return on tangible common equity on an operating basis and with operating efficiency ratio (which is computed by dividing noninterest expense adjusted for nonoperating expenses and total revenue adjusted for gain/loss on investment securities). The Company has included information on tangible book value per share, the tangible common equity ratio, and return on average assets and return on tangible common equity on an operating basis because management believes that investors may find it useful to have access to the same analytical tool used by management. As a result of merger and acquisition activity, the Company has recognized goodwill and other intangible assets in conjunction with business combination accounting principles. Excluding the impact of goodwill and other intangibles in measuring asset and capital values for the ratios provided, along with other bank standard capital ratios, provides a framework to compare the capital adequacy of the Company to other companies in the financial services industry.
These non-GAAP measures should not be viewed as a substitute for operating results and other financial measures determined in accordance with GAAP. An item which management deems to be non-core and excludes when computing these non-GAAP measures can be of substantial importance to the Company’s results for any particular quarter or year. The Company’s non-GAAP performance measures, including operating net income, operating diluted earnings per share, tangible book value per share, the tangible common equity ratio, and return on average assets, return on average equity, and efficiency ratio on an operating basis are not necessarily comparable to non-GAAP performance measures which may be presented by other companies.
Reconciliations of these non-GAAP financial measures to the most directly comparable GAAP financial measures are presented under “GAAP to Non-GAAP Reconciliations.”
CONTACT:
Cambridge Bancorp
Michael F. Carotenuto
Chief Financial Officer
617-520-5520
7
CAMBRIDGE BANCORP AND SUBSIDIARIES
UNAUDITED QUARTERLY RESULTS
|
|
|
Three Months Ended |
|
|||||||||
|
|
|
March 31, |
|
|
December 31, |
|
|
March 31, |
|
|||
|
|
|
2020 |
|
|
2019 |
|
|
2019 |
|
|||
|
|
|
(dollars in thousands, except per share data) |
|
|||||||||
|
|
|
|
|
|
|
|
|
|
|
|
|
|
|
Interest and Dividend Income |
|
$ |
26,095 |
|
|
$ |
26,415 |
|
|
$ |
19,118 |
|
|
Interest Expense |
|
|
3,695 |
|
|
|
4,807 |
|
|
|
2,857 |
|
|
Net Interest and Dividend Income |
|
|
22,400 |
|
|
|
21,608 |
|
|
|
16,261 |
|
|
Provision (Credit) for Credit Losses |
|
|
2,000 |
|
|
|
331 |
|
|
|
(93 |
) |
|
Noninterest Income |
|
|
8,818 |
|
|
|
9,933 |
|
|
|
7,957 |
|
|
Noninterest Expense |
|
|
19,925 |
|
|
|
21,428 |
|
|
|
16,373 |
|
|
Income Before Income Taxes |
|
|
9,293 |
|
|
|
9,782 |
|
|
|
7,938 |
|
|
Income Tax Expense |
|
|
2,061 |
|
|
|
2,673 |
|
|
|
1,740 |
|
|
Net Income |
|
$ |
7,232 |
|
|
$ |
7,109 |
|
|
$ |
6,198 |
|
|
|
|
|
|
|
|
|
|
|
|
|
|
|
|
Operating Net Income* |
|
$ |
7,434 |
|
|
$ |
7,922 |
|
|
$ |
6,326 |
|
|
|
|
|
|
|
|
|
|
|
|
|
|
|
|
Data Per Common Share: |
|
|
|
|
|
|
|
|
|
|
|
|
|
Basic Earnings Per Share |
|
$ |
1.34 |
|
|
$ |
1.43 |
|
|
$ |
1.51 |
|
|
Diluted Earnings Per Share |
|
|
1.33 |
|
|
|
1.42 |
|
|
|
1.49 |
|
|
Operating Diluted Earnings Per Share* |
|
|
1.37 |
|
|
|
1.58 |
|
|
|
1.53 |
|
|
Dividends Declared Per Share |
|
|
0.53 |
|
|
|
0.51 |
|
|
|
0.51 |
|
|
|
|
|
|
|
|
|
|
|
|
|
|
|
|
Avg. Common Shares Outstanding: |
|
|
|
|
|
|
|
|
|
|
|
|
|
Basic |
|
|
5,397,040 |
|
|
|
4,939,973 |
|
|
|
4,072,805 |
|
|
Diluted |
|
|
5,432,099 |
|
|
|
4,980,439 |
|
|
|
4,106,658 |
|
|
|
|
|
|
|
|
|
|
|
|
|
|
|
|
Selected Performance Ratios: |
|
|
|
|
|
|
|
|
|
|
|
|
|
Net Interest Margin, FTE |
|
|
3.39 |
% |
|
|
3.19 |
% |
|
|
3.26 |
% |
|
Cost of Funds |
|
|
0.56 |
% |
|
|
0.71 |
% |
|
|
0.57 |
% |
|
Cost of Interest Bearing Liabilities |
|
|
0.80 |
% |
|
|
1.01 |
% |
|
|
0.82 |
% |
|
Cost of Deposits |
|
|
0.54 |
% |
|
|
0.68 |
% |
|
|
0.55 |
% |
|
Cost of Deposits excluding Wholesale Deposits |
|
|
0.53 |
% |
|
|
0.68 |
% |
|
|
0.50 |
% |
|
Return on Average Assets |
|
|
1.02 |
% |
|
|
0.98 |
% |
|
|
1.18 |
% |
|
Return on Average Earning Assets |
|
|
1.09 |
% |
|
|
1.05 |
% |
|
|
1.24 |
% |
|
Return on Average Equity |
|
|
9.99 |
% |
|
|
11.08 |
% |
|
|
14.90 |
% |
|
Efficiency Ratio* |
|
|
63.83 |
% |
|
|
67.94 |
% |
|
|
67.61 |
% |
|
Operating Efficiency Ratio* |
|
|
63.01 |
% |
|
|
65.27 |
% |
|
|
66.99 |
% |
|
Operating Return on Tang Common Equity* |
|
|
11.65 |
% |
|
|
14.29 |
% |
|
|
15.25 |
% |
|
Operating Return on Average Assets* |
|
|
1.05 |
% |
|
|
1.10 |
% |
|
|
1.20 |
% |
|
|
|
|
|
|
|
|
|
|
|
|
|
|
|
|
|
March 31, |
|
|
December 31, |
|
|
March 31, |
|
|||
|
|
|
2020 |
|
|
2019 |
|
|
2019 |
|
|||
|
|
|
|
|
|
|
|
|
|
|
|
|
|
|
Total Assets |
|
$ |
2,852,629 |
|
|
$ |
2,855,563 |
|
|
$ |
2,138,548 |
|
|
Total Loans |
|
|
2,255,802 |
|
|
|
2,226,728 |
|
|
|
1,555,154 |
|
|
Non-Performing Loans |
|
|
3,379 |
|
|
|
5,651 |
|
|
|
626 |
|
|
Allowance for Credit Losses |
|
|
20,163 |
|
|
|
18,180 |
|
|
|
16,652 |
|
|
Allowance to Total Loans |
|
|
0.89 |
% |
|
|
0.82 |
% |
|
|
1.07 |
% |
|
Net charge-offs to Total Loans (annualized) |
|
|
0.05 |
% |
|
|
0.07 |
% |
|
|
0.01 |
% |
|
Total Deposits |
|
|
2,390,359 |
|
|
|
2,358,878 |
|
|
|
1,902,383 |
|
|
Total Shareholders’ Equity |
|
|
297,759 |
|
|
|
286,561 |
|
|
|
172,268 |
|
|
Total Shareholders’ Equity to Total Assets |
|
|
10.44 |
% |
|
|
10.04 |
% |
|
|
8.06 |
% |
|
Wealth Management AUM |
|
|
2,932,393 |
|
|
|
3,287,371 |
|
|
|
2,990,375 |
|
|
Wealth Management AUM & AUA |
|
|
3,071,266 |
|
|
|
3,452,852 |
|
|
|
3,099,478 |
|
|
Book Value Per Share |
|
$ |
54.96 |
|
|
$ |
53.06 |
|
|
$ |
41.78 |
|
|
Tangible Common Equity Ratio* |
|
|
9.34 |
% |
|
|
8.93 |
% |
|
|
8.04 |
% |
|
Tangible Book Value Per Share* |
|
$ |
48.60 |
|
|
$ |
46.66 |
|
|
$ |
41.68 |
|
|
* See GAAP to Non-GAAP Reconciliations |
|
|
|
|
|
|
|
|
|
|
|
|
8
CAMBRIDGE BANCORP AND SUBSIDIARIES
UNAUDITED CONSOLIDATED BALANCE SHEETS
|
|
|
March 31, 2020 |
|
|
December 31, 2019 |
|
||
|
|
|
(dollars in thousands, except par value) |
|
|||||
|
Assets |
|
|
|
|
|
|
|
|
|
Cash and cash equivalents |
|
$ |
42,989 |
|
|
$ |
61,335 |
|
|
Investment securities |
|
|
|
|
|
|
|
|
|
Available for sale, at fair value (amortized cost $115,550 and $141,109, respectively) |
|
|
117,947 |
|
|
|
140,330 |
|
|
Held to maturity, at amortized cost (fair value $256,975 and $264,114, respectively) |
|
|
246,906 |
|
|
|
258,172 |
|
|
Total investment securities |
|
|
364,853 |
|
|
|
398,502 |
|
|
Loans held for sale, at lower of cost or fair value |
|
|
2,875 |
|
|
|
1,546 |
|
|
Loans |
|
|
|
|
|
|
|
|
|
Residential mortgage |
|
|
917,103 |
|
|
|
917,566 |
|
|
Commercial mortgage |
|
|
1,089,796 |
|
|
|
1,060,574 |
|
|
Home equity |
|
|
83,066 |
|
|
|
80,675 |
|
|
Commercial & Industrial |
|
|
127,648 |
|
|
|
133,236 |
|
|
Consumer |
|
|
38,189 |
|
|
|
34,677 |
|
|
Total loans |
|
|
2,255,802 |
|
|
|
2,226,728 |
|
|
Less: allowance for credit losses |
|
|
(20,163 |
) |
|
|
(18,180 |
) |
|
Net loans |
|
|
2,235,639 |
|
|
|
2,208,548 |
|
|
Federal Home Loan Bank of Boston Stock, at cost |
|
|
6,268 |
|
|
|
7,854 |
|
|
Bank owned life insurance |
|
|
37,479 |
|
|
|
37,319 |
|
|
Banking premises and equipment, net |
|
|
14,593 |
|
|
|
14,756 |
|
|
Right-of-use asset operating leases |
|
|
32,312 |
|
|
|
33,587 |
|
|
Deferred income taxes, net |
|
|
3,721 |
|
|
|
8,229 |
|
|
Accrued interest receivable |
|
|
6,872 |
|
|
|
7,052 |
|
|
Goodwill |
|
|
31,206 |
|
|
|
31,206 |
|
|
Merger related intangibles, net |
|
|
3,248 |
|
|
|
3,338 |
|
|
Other assets |
|
|
70,574 |
|
|
|
42,291 |
|
|
Total assets |
|
$ |
2,852,629 |
|
|
$ |
2,855,563 |
|
|
Liabilities |
|
|
|
|
|
|
|
|
|
Deposits |
|
|
|
|
|
|
|
|
|
Demand |
|
$ |
608,240 |
|
|
$ |
630,593 |
|
|
Interest bearing checking |
|
|
506,654 |
|
|
|
450,098 |
|
|
Money market |
|
|
175,158 |
|
|
|
181,406 |
|
|
Savings |
|
|
880,944 |
|
|
|
914,499 |
|
|
Certificates of deposit |
|
|
219,363 |
|
|
|
182,282 |
|
|
Total deposits |
|
|
2,390,359 |
|
|
|
2,358,878 |
|
|
Short-term borrowings |
|
|
75,147 |
|
|
|
135,691 |
|
|
Long-term borrowings |
|
|
— |
|
|
|
— |
|
|
Operating lease liabilities |
|
|
33,813 |
|
|
|
35,054 |
|
|
Other liabilities |
|
|
55,551 |
|
|
|
39,379 |
|
|
Total liabilities |
|
|
2,554,870 |
|
|
|
2,569,002 |
|
|
Shareholders’ Equity |
|
|
|
|
|
|
|
|
|
Common stock, par value $1.00; Authorized: 10,000,000 shares; Outstanding: 5,417,983 shares and 5,400,868 shares, respectively |
|
|
5,418 |
|
|
|
5,401 |
|
|
Additional paid-in capital |
|
|
137,186 |
|
|
|
136,766 |
|
|
Retained earnings |
|
|
150,891 |
|
|
|
146,875 |
|
|
Accumulated other comprehensive income (loss) |
|
|
4,264 |
|
|
|
(2,481 |
) |
|
Total shareholders’ equity |
|
|
297,759 |
|
|
|
286,561 |
|
|
Total liabilities and shareholders’ equity |
|
$ |
2,852,629 |
|
|
$ |
2,855,563 |
|
9
CAMBRIDGE BANCORP AND SUBSIDIARIES
UNAUDITED CONSOLIDATED STATEMENTS OF INCOME
|
|
|
Three Months Ended |
|
|
|||||||||
|
|
|
March 31, |
|
|
December 31, |
|
|
March 31, |
|
|
|||
|
|
|
2020 |
|
|
2019 |
|
|
2019 |
|
|
|||
|
|
|
(dollars in thousands, except share data) |
|
|
|||||||||
|
Interest and dividend income |
|
|
|
|
|
|
|
|
|
|
|
|
|
|
Interest on taxable loans |
|
$ |
23,338 |
|
|
$ |
23,463 |
|
|
$ |
16,284 |
|
|
|
Interest on tax-exempt loans |
|
|
198 |
|
|
|
199 |
|
|
|
89 |
|
|
|
Interest on taxable investment securities |
|
|
1,723 |
|
|
|
1,889 |
|
|
|
1,980 |
|
|
|
Interest on tax-exempt investment securities |
|
|
595 |
|
|
|
580 |
|
|
|
571 |
|
|
|
Dividends on FHLB of Boston stock |
|
|
101 |
|
|
|
109 |
|
|
|
76 |
|
|
|
Interest on overnight investments |
|
|
140 |
|
|
|
175 |
|
|
|
118 |
|
|
|
Total interest and dividend income |
|
|
26,095 |
|
|
|
26,415 |
|
|
|
19,118 |
|
|
|
Interest expense |
|
|
|
|
|
|
|
|
|
|
|
|
|
|
Interest on deposits |
|
|
3,129 |
|
|
|
4,152 |
|
|
|
2,501 |
|
|
|
Interest on borrowed funds |
|
|
566 |
|
|
|
655 |
|
|
|
356 |
|
|
|
Total interest expense |
|
|
3,695 |
|
|
|
4,807 |
|
|
|
2,857 |
|
|
|
Net interest and dividend income |
|
|
22,400 |
|
|
|
21,608 |
|
|
|
16,261 |
|
|
|
Provision (Credit) for Credit Losses |
|
|
2,000 |
|
|
|
331 |
|
|
|
(93 |
) |
|
|
Net interest and dividend income after provision for credit losses |
|
|
20,400 |
|
|
|
21,277 |
|
|
|
16,354 |
|
|
|
Noninterest income |
|
|
|
|
|
|
|
|
|
|
|
|
|
|
Wealth management revenue |
|
|
6,627 |
|
|
|
6,923 |
|
|
|
6,124 |
|
|
|
Deposit account fees |
|
|
791 |
|
|
|
790 |
|
|
|
738 |
|
|
|
ATM/Debit card income |
|
|
307 |
|
|
|
367 |
|
|
|
276 |
|
|
|
Bank owned life insurance income |
|
|
160 |
|
|
|
158 |
|
|
|
127 |
|
|
|
Gain (loss) on disposition of investment securities |
|
|
— |
|
|
|
— |
|
|
|
(87 |
) |
|
|
Gain on loans sold |
|
|
119 |
|
|
|
679 |
|
|
|
16 |
|
|
|
Loan related derivative income |
|
|
510 |
|
|
|
103 |
|
|
|
436 |
|
|
|
Other income |
|
|
304 |
|
|
|
913 |
|
|
|
327 |
|
|
|
Total noninterest income |
|
|
8,818 |
|
|
|
9,933 |
|
|
|
7,957 |
|
|
|
Noninterest expense |
|
|
|
|
|
|
|
|
|
|
|
|
|
|
Salaries and employee benefits |
|
|
13,016 |
|
|
|
13,141 |
|
|
|
10,827 |
|
|
|
Occupancy and equipment |
|
|
2,807 |
|
|
|
3,042 |
|
|
|
2,330 |
|
|
|
Data processing |
|
|
1,685 |
|
|
|
1,700 |
|
|
|
1,346 |
|
|
|
Professional services |
|
|
859 |
|
|
|
1,212 |
|
|
|
807 |
|
|
|
Marketing |
|
|
256 |
|
|
|
585 |
|
|
|
404 |
|
|
|
FDIC insurance |
|
|
179 |
|
|
|
(78 |
) |
|
|
— |
|
|
|
Nonoperating expenses |
|
|
253 |
|
|
|
841 |
|
|
|
91 |
|
|
|
Other expenses |
|
|
870 |
|
|
|
985 |
|
|
|
568 |
|
|
|
Total noninterest expense |
|
|
19,925 |
|
|
|
21,428 |
|
|
|
16,373 |
|
|
|
Income before income taxes |
|
|
9,293 |
|
|
|
9,782 |
|
|
|
7,938 |
|
|
|
Income tax expense |
|
|
2,061 |
|
|
|
2,673 |
|
|
|
1,740 |
|
|
|
Net income |
|
$ |
7,232 |
|
|
|
7,109 |
|
|
|
6,198 |
|
|
|
Share data: |
|
|
|
|
|
|
|
|
|
|
|
|
|
|
Weighted average number of shares outstanding, basic |
|
|
5,397,040 |
|
|
|
4,939,973 |
|
|
|
4,072,805 |
|
|
|
Weighted average number of shares outstanding, diluted |
|
|
5,432,099 |
|
|
|
4,980,439 |
|
|
|
4,106,658 |
|
|
|
Basic earnings per share |
|
$ |
1.34 |
|
|
$ |
1.43 |
|
|
$ |
1.51 |
|
|
|
Diluted earnings per share |
|
$ |
1.33 |
|
|
$ |
1.42 |
|
|
$ |
1.49 |
|
|
10
CAMBRIDGE BANCORP AND SUBSIDIARIES
MARGIN & YIELD ANALYSIS
|
|
|
Three Months Ended |
|
|||||||||||||||||||||||||||||||||
|
|
|
March 31, 2020 |
|
|
December 31, 2019 |
|
|
March 31, 2019 |
|
|||||||||||||||||||||||||||
|
|
|
Average Balance |
|
|
Interest Income/ Expenses (1) |
|
|
Rate Earned/ Paid (1) |
|
|
Average Balance |
|
|
Interest Income/ Expenses (1) |
|
|
Rate Earned/ Paid (1) |
|
|
Average Balance |
|
|
Interest Income/ Expenses (1) |
|
|
Rate Earned/ Paid (1) |
|
|||||||||
|
|
|
(dollars in thousands) |
|
|||||||||||||||||||||||||||||||||
|
ASSETS |
|
|
|
|
|
|
|
|
|
|
|
|
|
|
|
|
|
|
|
|
|
|
|
|
|
|
|
|
|
|
|
|
|
|
|
|
|
Interest-earning assets |
|
|
|
|
|
|
|
|
|
|
|
|
|
|
|
|
|
|
|
|
|
|
|
|
|
|
|
|
|
|
|
|
|
|
|
|
|
Loans (2) |
|
|
|
|
|
|
|
|
|
|
|
|
|
|
|
|
|
|
|
|
|
|
|
|
|
|
|
|
|
|
|
|
|
|
|
|
|
Taxable |
|
$ |
2,204,862 |
|
|
$ |
23,338 |
|
|
|
4.26 |
% |
|
$ |
2,201,984 |
|
|
$ |
23,463 |
|
|
|
4.23 |
% |
|
$ |
1,543,585 |
|
|
$ |
16,284 |
|
|
|
4.28 |
% |
|
Tax-exempt |
|
|
23,605 |
|
|
|
250 |
|
|
|
4.26 |
|
|
|
25,344 |
|
|
|
253 |
|
|
|
3.96 |
|
|
|
9,743 |
|
|
|
112 |
|
|
|
4.66 |
|
|
Securities available for sale (3) |
|
|
|
|
|
|
|
|
|
|
|
|
|
|
|
|
|
|
|
|
|
|
|
|
|
|
|
|
|
|
|
|
|
|
|
|
|
Taxable |
|
|
133,402 |
|
|
|
660 |
|
|
|
1.99 |
|
|
|
147,852 |
|
|
|
722 |
|
|
|
1.94 |
|
|
|
164,607 |
|
|
|
712 |
|
|
|
1.75 |
|
|
Securities held to maturity |
|
|
|
|
|
|
|
|
|
|
|
|
|
|
|
|
|
|
|
|
|
|
|
|
|
|
|
|
|
|
|
|
|
|
|
|
|
Taxable |
|
|
169,433 |
|
|
|
1,063 |
|
|
|
2.52 |
|
|
|
187,584 |
|
|
|
1,167 |
|
|
|
2.47 |
|
|
|
209,347 |
|
|
|
1,268 |
|
|
|
2.46 |
|
|
Tax-exempt |
|
|
83,193 |
|
|
|
754 |
|
|
|
3.65 |
|
|
|
78,172 |
|
|
|
734 |
|
|
|
3.73 |
|
|
|
73,851 |
|
|
|
723 |
|
|
|
3.97 |
|
|
Cash and cash equivalents |
|
|
59,845 |
|
|
|
140 |
|
|
|
0.94 |
|
|
|
57,036 |
|
|
|
175 |
|
|
|
1.22 |
|
|
|
33,025 |
|
|
|
118 |
|
|
|
1.45 |
|
|
Total interest-earning assets (4) |
|
|
2,674,340 |
|
|
|
26,205 |
|
|
|
3.94 |
% |
|
|
2,697,972 |
|
|
|
26,514 |
|
|
|
3.90 |
% |
|
|
2,034,158 |
|
|
|
19,217 |
|
|
|
3.83 |
% |
|
Non interest-earning assets |
|
|
192,184 |
|
|
|
|
|
|
|
|
|
|
|
188,557 |
|
|
|
|
|
|
|
|
|
|
|
114,505 |
|
|
|
|
|
|
|
|
|
|
Allowance for credit losses |
|
|
(18,423 |
) |
|
|
|
|
|
|
|
|
|
|
(18,373 |
) |
|
|
|
|
|
|
|
|
|
|
(16,688 |
) |
|
|
|
|
|
|
|
|
|
Total assets |
|
$ |
2,848,101 |
|
|
|
|
|
|
|
|
|
|
$ |
2,868,156 |
|
|
|
|
|
|
|
|
|
|
$ |
2,131,975 |
|
|
|
|
|
|
|
|
|
|
LIABILITIES AND SHAREHOLDERS’ EQUITY |
|
|
|
|
|
|
|
|
|
|
|
|
|
|
|
|
|
|
|
|
|
|
|
|
|
|
|
|
|
|
|
|
|
|
|
|
|
Interest-bearing deposits |
|
|
|
|
|
|
|
|
|
|
|
|
|
|
|
|
|
|
|
|
|
|
|
|
|
|
|
|
|
|
|
|
|
|
|
|
|
Checking accounts |
|
$ |
457,189 |
|
|
$ |
159 |
|
|
|
0.14 |
% |
|
$ |
427,475 |
|
|
$ |
121 |
|
|
|
0.11 |
% |
|
$ |
391,863 |
|
|
$ |
82 |
|
|
|
0.08 |
% |
|
Savings accounts |
|
|
888,973 |
|
|
|
1,772 |
|
|
|
0.80 |
|
|
|
916,575 |
|
|
|
2,420 |
|
|
|
1.05 |
|
|
|
688,951 |
|
|
|
1,486 |
|
|
|
0.87 |
|
|
Money market accounts |
|
|
193,048 |
|
|
|
449 |
|
|
|
0.94 |
|
|
|
216,858 |
|
|
|
678 |
|
|
|
1.24 |
|
|
|
130,226 |
|
|
|
380 |
|
|
|
1.18 |
|
|
Certificates of deposit |
|
|
187,318 |
|
|
|
749 |
|
|
|
1.61 |
|
|
|
204,654 |
|
|
|
933 |
|
|
|
1.81 |
|
|
|
153,257 |
|
|
|
553 |
|
|
|
1.46 |
|
|
Total interest-bearing deposits |
|
|
1,726,528 |
|
|
|
3,129 |
|
|
|
0.73 |
|
|
|
1,765,562 |
|
|
|
4,152 |
|
|
|
0.93 |
|
|
|
1,364,297 |
|
|
|
2,501 |
|
|
|
0.74 |
|
|
Other borrowed funds |
|
|
127,389 |
|
|
|
566 |
|
|
|
1.79 |
|
|
|
125,368 |
|
|
|
655 |
|
|
|
2.07 |
|
|
|
54,124 |
|
|
|
356 |
|
|
|
2.67 |
|
|
Total interest-bearing liabilities |
|
|
1,853,917 |
|
|
|
3,695 |
|
|
|
0.80 |
% |
|
|
1,890,930 |
|
|
|
4,807 |
|
|
|
1.01 |
% |
|
|
1,418,421 |
|
|
|
2,857 |
|
|
|
0.82 |
% |
|
Non-interest-bearing liabilities |
|
|
|
|
|
|
|
|
|
|
|
|
|
|
|
|
|
|
|
|
|
|
|
|
|
|
|
|
|
|
|
|
|
|
|
|
|
Demand deposits |
|
|
622,892 |
|
|
|
|
|
|
|
|
|
|
|
645,807 |
|
|
|
|
|
|
|
|
|
|
|
484,068 |
|
|
|
|
|
|
|
|
|
|
Other liabilities |
|
|
80,089 |
|
|
|
|
|
|
|
|
|
|
|
76,876 |
|
|
|
|
|
|
|
|
|
|
|
60,810 |
|
|
|
|
|
|
|
|
|
|
Total liabilities |
|
|
2,556,898 |
|
|
|
|
|
|
|
|
|
|
|
2,613,613 |
|
|
|
|
|
|
|
|
|
|
|
1,963,299 |
|
|
|
|
|
|
|
|
|
|
Shareholders’ equity |
|
|
291,203 |
|
|
|
|
|
|
|
|
|
|
|
254,543 |
|
|
|
|
|
|
|
|
|
|
|
168,676 |
|
|
|
|
|
|
|
|
|
|
Total liabilities & shareholders’ equity |
|
$ |
2,848,101 |
|
|
|
|
|
|
|
|
|
|
$ |
2,868,156 |
|
|
|
|
|
|
|
|
|
|
$ |
2,131,975 |
|
|
|
|
|
|
|
|
|
|
Net interest income on a fully taxable equivalent basis |
|
|
|
|
|
|
22,510 |
|
|
|
|
|
|
|
|
|
|
|
21,707 |
|
|
|
|
|
|
|
|
|
|
|
16,360 |
|
|
|
|
|
|
Less taxable equivalent adjustment |
|
|
|
|
|
|
(211 |
) |
|
|
|
|
|
|
|
|
|
|
(208 |
) |
|
|
|
|
|
|
|
|
|
|
(175 |
) |
|
|
|
|
|
Net interest income |
|
|
|
|
|
$ |
22,299 |
|
|
|
|
|
|
|
|
|
|
$ |
21,499 |
|
|
|
|
|
|
|
|
|
|
$ |
16,185 |
|
|
|
|
|
|
Net interest spread (5) |
|
|
|
|
|
|
|
|
|
|
3.14 |
% |
|
|
|
|
|
|
|
|
|
|
2.89 |
% |
|
|
|
|
|
|
|
|
|
|
3.01 |
% |
|
Net interest margin (6) |
|
|
|
|
|
|
|
|
|
|
3.39 |
% |
|
|
|
|
|
|
|
|
|
|
3.19 |
% |
|
|
|
|
|
|
|
|
|
|
3.26 |
% |
|
(1) |
Annualized on a fully taxable equivalent basis calculated using a federal tax rate of 21%. |
|
(2) |
Nonaccrual loans are included in average amounts outstanding. |
|
(3) |
Average balances of securities available for sale calculated utilizing amortized cost. |
|
(4) |
Federal Home Loan Bank stock balance and dividend income is excluded from interest-earning assets. |
|
(5) |
Net interest spread represents the difference between the weighted average yield on interest-earning assets and the weighted average cost of interest-bearing liabilities. |
|
(6) |
Net interest margin represents net interest income on a fully tax equivalent basis as a percentage of average interest-earning assets. |
11
GAAP to Non-GAAP Reconciliations (dollars in thousands except per share data)
Statement on Non-GAAP Measures: The Company believes the presentation of the following non-GAAP financial measures provides useful supplemental information that is essential to an investor’s proper understanding of the results of operations and financial condition of the Company. Management uses non-GAAP financial measures in its analysis of the Company’s performance. These non-GAAP measures should not be viewed as substitutes for the financial measures determined in accordance with GAAP, nor are they necessarily comparable to non-GAAP performance measures that may be presented by other companies.
|
|
|
Three Months Ended |
|
|
|||||||||
|
|
|
March 31, |
|
|
December 31, |
|
|
March 31, |
|
|
|||
|
Operating Net Income / Operating Diluted Earnings Per Share |
|
2020 |
|
|
2019 |
|
|
2019 |
|
|
|||
|
|
|
(in thousands, except share data) |
|
|
|||||||||
|
|
|
|
|
|
|
|
|
|
|
|
|
|
|
|
Net Income (a GAAP measure) |
|
$ |
7,232 |
|
|
$ |
7,109 |
|
|
$ |
6,198 |
|
|
|
Add: Merger and Capital Raise Expenses (Pretax) |
|
|
253 |
|
|
|
841 |
|
|
|
91 |
|
|
|
Add: (Gain)/loss on disposition of investment securities |
|
|
— |
|
|
|
— |
|
|
|
87 |
|
|
|
Tax effect of Merger and Capital Raise Expenses, and Gain (loss) on disposition of investment securities(1) |
|
|
(51 |
) |
|
|
(28 |
) |
|
|
(50 |
) |
|
|
Operating Net Income (a non-GAAP measure) |
|
$ |
7,434 |
|
|
$ |
7,922 |
|
|
$ |
6,326 |
|
|
|
Less: Dividends and Undistributed Earnings Allocated to Participating Securities (GAAP) |
|
|
(16 |
) |
|
|
(57 |
) |
|
|
(61 |
) |
|
|
Operating Income Applicable to Common Shareholders (a non-GAAP measure) |
|
$ |
7,418 |
|
|
$ |
7,865 |
|
|
$ |
6,265 |
|
|
|
Weighted Average Diluted Shares |
|
|
5,432,099 |
|
|
4,980,439 |
|
|
|
4,106,658 |
|
|
|
|
Operating Diluted Earnings Per Share (a non-GAAP measure) |
|
$ |
1.37 |
|
|
$ |
1.58 |
|
|
$ |
1.53 |
|
|
|
|
|
|
|
|
|
|
|
|
|
|
|
|
|
|
(1) |
The net tax benefit associated with noncore items is determined by assessing whether each noncore item is included or excluded from net taxable income and applying the Company’s combined marginal tax rate to only those items included in net taxable income. |
|
|
|
March 31, 2020 |
|
|
December 31, 2019 |
|
|
March 31, 2019 |
|
|||
|
|
|
(in thousands, except share data) |
|
|||||||||
|
Tangible Common Equity: |
|
|
|
|
|
|
|
|
|
|
|
|
|
Shareholders' equity (GAAP) |
|
$ |
297,759 |
|
|
$ |
286,561 |
|
|
$ |
172,268 |
|
|
Less: Goodwill and acquisition related intangibles (GAAP) |
|
|
(34,454 |
) |
|
|
(34,544 |
) |
|
|
(412 |
) |
|
Tangible Common Equity (a non-GAAP measure) |
|
|
263,305 |
|
|
|
252,017 |
|
|
|
171,856 |
|
|
Total assets (GAAP) |
|
|
2,852,629 |
|
|
|
2,855,563 |
|
|
|
2,138,548 |
|
|
Less: Goodwill and acquisition related intangibles (GAAP) |
|
|
(34,454 |
) |
|
|
(34,544 |
) |
|
|
(412 |
) |
|
Tangible assets (a non-GAAP measure) |
|
$ |
2,818,175 |
|
|
$ |
2,821,019 |
|
|
$ |
2,138,136 |
|
|
Tangible Common Equity Ratio (a non-GAAP measure) |
|
|
9.34 |
% |
|
|
8.93 |
% |
|
|
8.04 |
% |
|
|
|
|
|
|
|
|
|
|
|
|
|
|
|
Tangible Book Value Per Share: |
|
|
|
|
|
|
|
|
|
|
|
|
|
Tangible Common Equity (a non-GAAP measure) |
|
$ |
263,305 |
|
|
$ |
252,017 |
|
|
$ |
171,856 |
|
|
Common shares outstanding |
|
|
5,417,983 |
|
|
|
5,400,868 |
|
|
|
4,123,618 |
|
|
Tangible Book Value Per Share (a non-GAAP measure) |
|
$ |
48.60 |
|
|
$ |
46.66 |
|
|
$ |
41.68 |
|
12
|
|
|
March 31, 2020 |
|
|
December 31, 2019 |
|
|
March 31, 2019 |
|
|||
|
|
|
(in thousands, except share data) |
|
|||||||||
|
Efficiency Ratio: |
|
|
|
|
|
|
|
|
|
|
|
|
|
Noninterest expense |
|
$ |
19,925 |
|
|
$ |
21,428 |
|
|
$ |
16,373 |
|
|
Net interest and dividend income |
|
|
22,400 |
|
|
|
21,608 |
|
|
|
16,261 |
|
|
Total noninterest income |
|
|
8,818 |
|
|
|
9,933 |
|
|
|
7,957 |
|
|
Total revenue |
|
$ |
31,218 |
|
|
$ |
31,541 |
|
|
$ |
24,218 |
|
|
Efficiency Ratio |
|
|
63.83 |
% |
|
|
67.94 |
% |
|
|
67.61 |
% |
|
|
|
|
|
|
|
|
|
|
|
|
|
|
|
Operating Efficiency Ratio: |
|
|
|
|
|
|
|
|
|
|
|
|
|
Noninterest expense |
|
$ |
19,925 |
|
|
$ |
21,428 |
|
|
$ |
16,373 |
|
|
Nonoperating expenses |
|
|
(253 |
) |
|
|
(841 |
) |
|
|
(91 |
) |
|
Operating expense |
|
|
19,672 |
|
|
|
20,587 |
|
|
|
16,282 |
|
|
Total revenue |
|
$ |
31,218 |
|
|
$ |
31,541 |
|
|
$ |
24,218 |
|
|
Add: (Gain)/loss on disposition of investment securities |
|
|
— |
|
|
|
— |
|
|
|
87 |
|
|
Operating revenue |
|
$ |
31,218 |
|
|
$ |
31,541 |
|
|
$ |
24,305 |
|
|
Operating Efficiency Ratio (a non-GAAP measure) |
|
|
63.01 |
% |
|
|
65.27 |
% |
|
|
66.99 |
% |
|
|
|
|
|
|
|
|
|
|
|
|
|
|
|
Operating Return on Tangible Common Equity: |
|
|
|
|
|
|
|
|
|
|
|
|
|
Operating net income |
|
$ |
7,434 |
|
|
$ |
7,922 |
|
|
$ |
6,326 |
|
|
Average tangible common equity: |
|
|
|
|
|
|
|
|
|
|
|
|
|
Average common equity |
|
$ |
291,203 |
|
|
$ |
254,543 |
|
|
$ |
168,676 |
|
|
Average Goodwill and merger related intangibles |
|
|
(34,508 |
) |
|
|
(34,597 |
) |
|
|
(413 |
) |
|
Average tangible common equity |
|
$ |
256,695 |
|
|
$ |
219,946 |
|
|
$ |
168,263 |
|
|
Operating Return on Tangible Common Equity (a non-GAAP measure) |
|
|
11.65 |
% |
|
|
14.29 |
% |
|
|
15.25 |
% |
|
|
|
|
|
|
|
|
|
|
|
|
|
|
|
Operating Return on Average Assets: |
|
|
|
|
|
|
|
|
|
|
|
|
|
Operating net income |
|
$ |
7,434 |
|
|
$ |
7,922 |
|
|
$ |
6,326 |
|
|
Average assets |
|
$ |
2,848,101 |
|
|
$ |
2,868,156 |
|
|
$ |
2,131,975 |
|
|
Operating Return on Average Assets (a non-GAAP measure) |
|
|
1.05 |
% |
|
|
1.10 |
% |
|
|
1.20 |
% |
13
COVID-19 Additional Disclosures
14
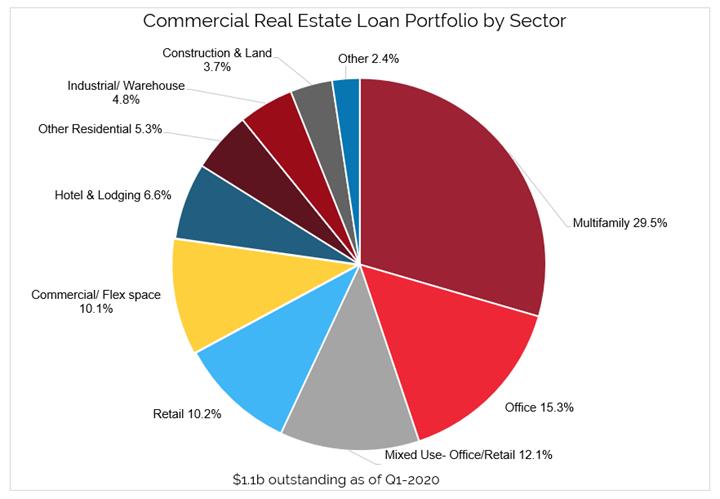
The objective of these additional disclosures is to provide shareholders with greater detail on the Company’s potential exposure as a result of the COVID-19 pandemic however this is not meant to be an all-encompassing review of exposures either direct or indirect.
15