Attached files
| file | filename |
|---|---|
| EX-99.4 - EXHIBIT 99.4 - Synchrony Financial | non-gaapmeasures1q20.htm |
| EX-99.2 - EXHIBIT 99.2 - Synchrony Financial | financialtables1q20.htm |
| EX-99.1 - EXHIBIT 99.1 - Synchrony Financial | earningsrelease1q20.htm |
| 8-K - 8-K - Synchrony Financial | a8-k1q20earnings.htm |
Exhibit 99.3 1Q’20 Financial Results April 21, 2020
Disclaimers Cautionary Statement Regarding Forward-Looking Statements The following slides are part of a presentation by Synchrony Financial in connection with reporting quarterly financial results. No representation is made that the information in these slides is complete. For additional information, see the earnings release and financial supplement included as exhibits to our Current Report on Form 8-K filed today and available on our website (www.synchronyfinancial.com) and the SEC's website (www.sec.gov). All references to net earnings and net income are intended to have the same meaning. This presentation contains certain forward-looking statements as defined in Section 27A of the Securities Act of 1933, as amended, and Section 21E of the Securities Exchange Act of 1934, as amended, which are subject to the "safe harbor" created by those sections. Forward-looking statements may be identified by words such as "expects," "intends," "anticipates," "plans," "believes," "seeks," "targets," "outlook," "estimates," "will," "should," "may" or words of similar meaning, but these words are not the exclusive means of identifying forward-looking statements. Forward-looking statements are based on management's current expectations and assumptions, and are subject to inherent uncertainties, risks and changes in circumstances that are difficult to predict. As a result, actual results could differ materially from those indicated in these forward-looking statements. Factors that could cause actual results to differ materially include global political, economic, business, competitive, market, regulatory and other factors and risks, such as: the impact of macroeconomic conditions and whether industry trends we have identified develop as anticipated, including the future impacts of the novel coronavirus disease (“COVID-19”) outbreak and measures taken in response thereto for which future developments are highly uncertain and difficult to predict; retaining existing partners and attracting new partners, concentration of our revenue in a small number of Retail Card partners, and promotion and support of our products by our partners; cyber-attacks or other security breaches; disruptions in the operations of our computer systems and data centers; the financial performance of our partners; the sufficiency of our allowance for credit losses and the accuracy of the assumptions or estimates used in preparing our financial statements, including those related to the new CECL accounting guidance; higher borrowing costs and adverse financial market conditions impacting our funding and liquidity, and any reduction in our credit ratings; our ability to grow our deposits in the future; damage to our reputation; our ability to securitize our loan receivables, occurrence of an early amortization of our securitization facilities, loss of the right to service or subservice our securitized loan receivables, and lower payment rates on our securitized loan receivables; changes in market interest rates and the impact of any margin compression; effectiveness of our risk management processes and procedures, reliance on models which may be inaccurate or misinterpreted, our ability to manage our credit risk; our ability to offset increases in our costs in retailer share arrangements; competition in the consumer finance industry; our concentration in the U.S. consumer credit market; our ability to successfully develop and commercialize new or enhanced products and services; our ability to realize the value of acquisitions and strategic investments; reductions in interchange fees; fraudulent activity; failure of third parties to provide various services that are important to our operations; international risks and compliance and regulatory risks and costs associated with international operations; alleged infringement of intellectual property rights of others and our ability to protect our intellectual property; litigation and regulatory actions; our ability to attract, retain and motivate key officers and employees; tax legislation initiatives or challenges to our tax positions and/or interpretations, and state sales tax rules and regulations; a material indemnification obligation to GE under the Tax Sharing and Separation Agreement with GE if we cause the split-off from GE or certain preliminary transactions to fail to qualify for tax-free treatment or in the case of certain significant transfers of our stock following the split-off; regulation, supervision, examination and enforcement of our business by governmental authorities, the impact of the Dodd-Frank Wall Street Reform and Consumer Protection Act and other legislative and regulatory developments and the impact of the Consumer Financial Protection Bureau’s regulation of our business; impact of capital adequacy rules and liquidity requirements; restrictions that limit our ability to pay dividends and repurchase our common stock, and restrictions that limit the Synchrony Bank’s ability to pay dividends to us; regulations relating to privacy, information security and data protection; use of third-party vendors and ongoing third-party business relationships; and failure to comply with anti-money laundering and anti-terrorism financing laws. For the reasons described above, we caution you against relying on any forward-looking statements, which should also be read in conjunction with the other cautionary statements that are included elsewhere in this presentation and in our public filings, including under the heading "Risk Factors" in the Company's Annual Report on Form 10-K for the fiscal year ended December 31, 2019, as filed on February 13, 2020, and the Company’s Quarterly Report on Form 10-Q for the quarter ended March 31, 2020, as filed on April 21, 2020. You should not consider any list of such factors to be an exhaustive statement of all the risks, uncertainties, or potentially inaccurate assumptions that could cause our current expectations or beliefs to change. Further, any forward-looking statement speaks only as of the date on which it is made, and we undertake no obligation to update or revise any forward-looking statement to reflect events or circumstances after the date on which the statement is made or to reflect the occurrence of unanticipated events, except as otherwise may be required by law. 2
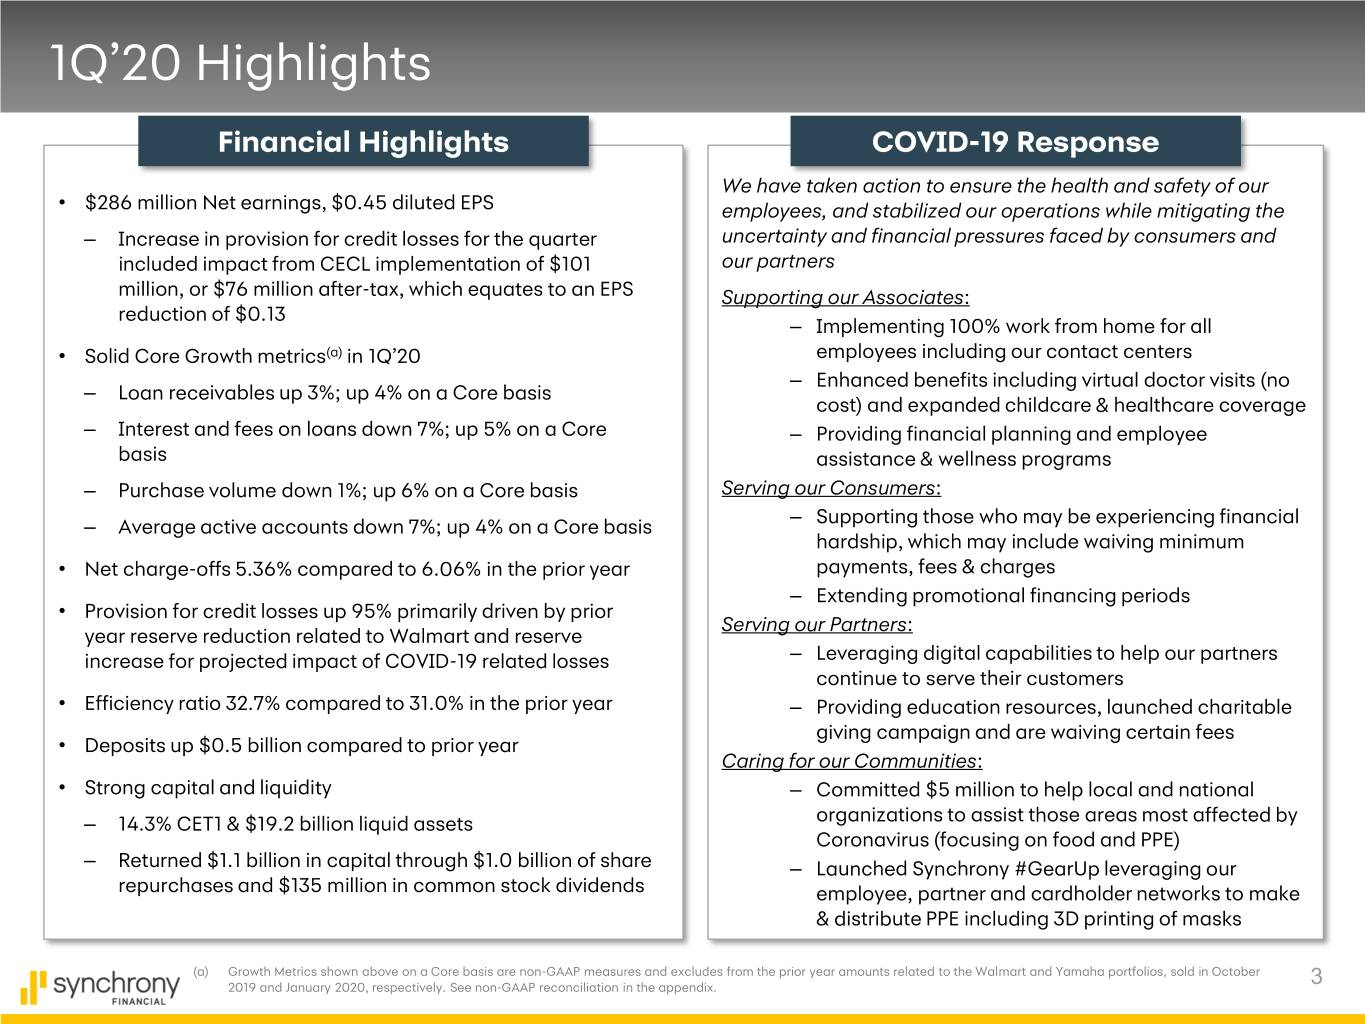
1Q’20 Highlights Financial Highlights COVID-19 Response We have taken action to ensure the health and safety of our • $286 million Net earnings, $0.45 diluted EPS employees, and stabilized our operations while mitigating the ‒ Increase in provision for credit losses for the quarter uncertainty and financial pressures faced by consumers and included impact from CECL implementation of $101 our partners million, or $76 million after-tax, which equates to an EPS Supporting our Associates: reduction of $0.13 – Implementing 100% work from home for all • Solid Core Growth metrics(a) in 1Q’20 employees including our contact centers – Enhanced benefits including virtual doctor visits (no ‒ Loan receivables up 3%; up 4% on a Core basis cost) and expanded childcare & healthcare coverage ‒ Interest and fees on loans down 7%; up 5% on a Core – Providing financial planning and employee basis assistance & wellness programs ‒ Purchase volume down 1%; up 6% on a Core basis Serving our Consumers: – ‒ Average active accounts down 7%; up 4% on a Core basis Supporting those who may be experiencing financial hardship, which may include waiving minimum • Net charge-offs 5.36% compared to 6.06% in the prior year payments, fees & charges – Extending promotional financing periods • Provision for credit losses up 95% primarily driven by prior Serving our Partners: year reserve reduction related to Walmart and reserve increase for projected impact of COVID-19 related losses – Leveraging digital capabilities to help our partners continue to serve their customers • Efficiency ratio 32.7% compared to 31.0% in the prior year – Providing education resources, launched charitable giving campaign and are waiving certain fees • Deposits up $0.5 billion compared to prior year Caring for our Communities: • Strong capital and liquidity – Committed $5 million to help local and national ‒ 14.3% CET1 & $19.2 billion liquid assets organizations to assist those areas most affected by Coronavirus (focusing on food and PPE) ‒ Returned $1.1 billion in capital through $1.0 billion of share – Launched Synchrony #GearUp leveraging our repurchases and $135 million in common stock dividends employee, partner and cardholder networks to make & distribute PPE including 3D printing of masks (a) Growth Metrics shown above on a Core basis are non-GAAP measures and excludes from the prior year amounts related to the Walmart and Yamaha portfolios, sold in October 2019 and January 2020, respectively. See non-GAAP reconciliation in the appendix. 3
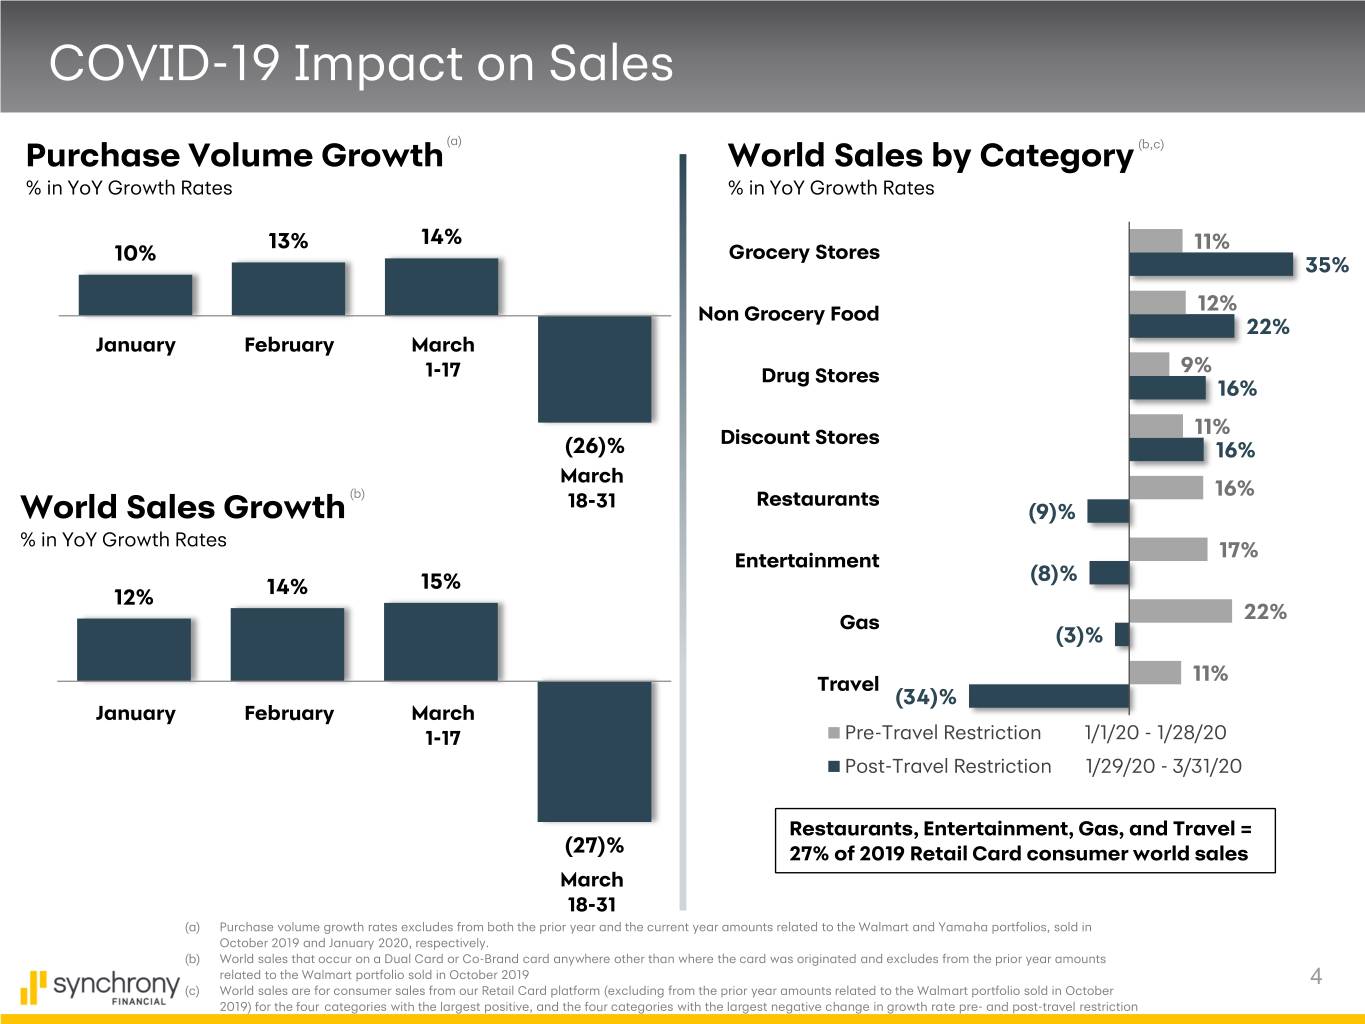
COVID-19 Impact on Sales Purchase Volume Growth (a) World Sales by Category (b,c) % in YoY Growth Rates % in YoY Growth Rates 13% 14% 11% 10% Grocery Stores 35% Non Grocery Food 12% 22% January February March 1-17 Drug Stores 9% 16% Discount Stores 11% (26)% 16% March (b) Restaurants 16% World Sales Growth 18-31 (9)% % in YoY Growth Rates Entertainment 17% 15% (8)% 12% 14% Gas 22% (3)% Travel 11% (34)% January February March 1-17 Pre-Travel Restriction 1/1/20 - 1/28/20 Post-Travel Restriction 1/29/20 - 3/31/20 Restaurants, Entertainment, Gas, and Travel = (27)% 27% of 2019 Retail Card consumer world sales March 18-31 (a) Purchase volume growth rates excludes from both the prior year and the current year amounts related to the Walmart and Yamaha portfolios, sold in October 2019 and January 2020, respectively. (b) World sales that occur on a Dual Card or Co-Brand card anywhere other than where the card was originated and excludes from the prior year amounts related to the Walmart portfolio sold in October 2019 4 (c) World sales are for consumer sales from our Retail Card platform (excluding from the prior year amounts related to the Walmart portfolio sold in October 2019) for the four categories with the largest positive, and the four categories with the largest negative change in growth rate pre- and post-travel restriction
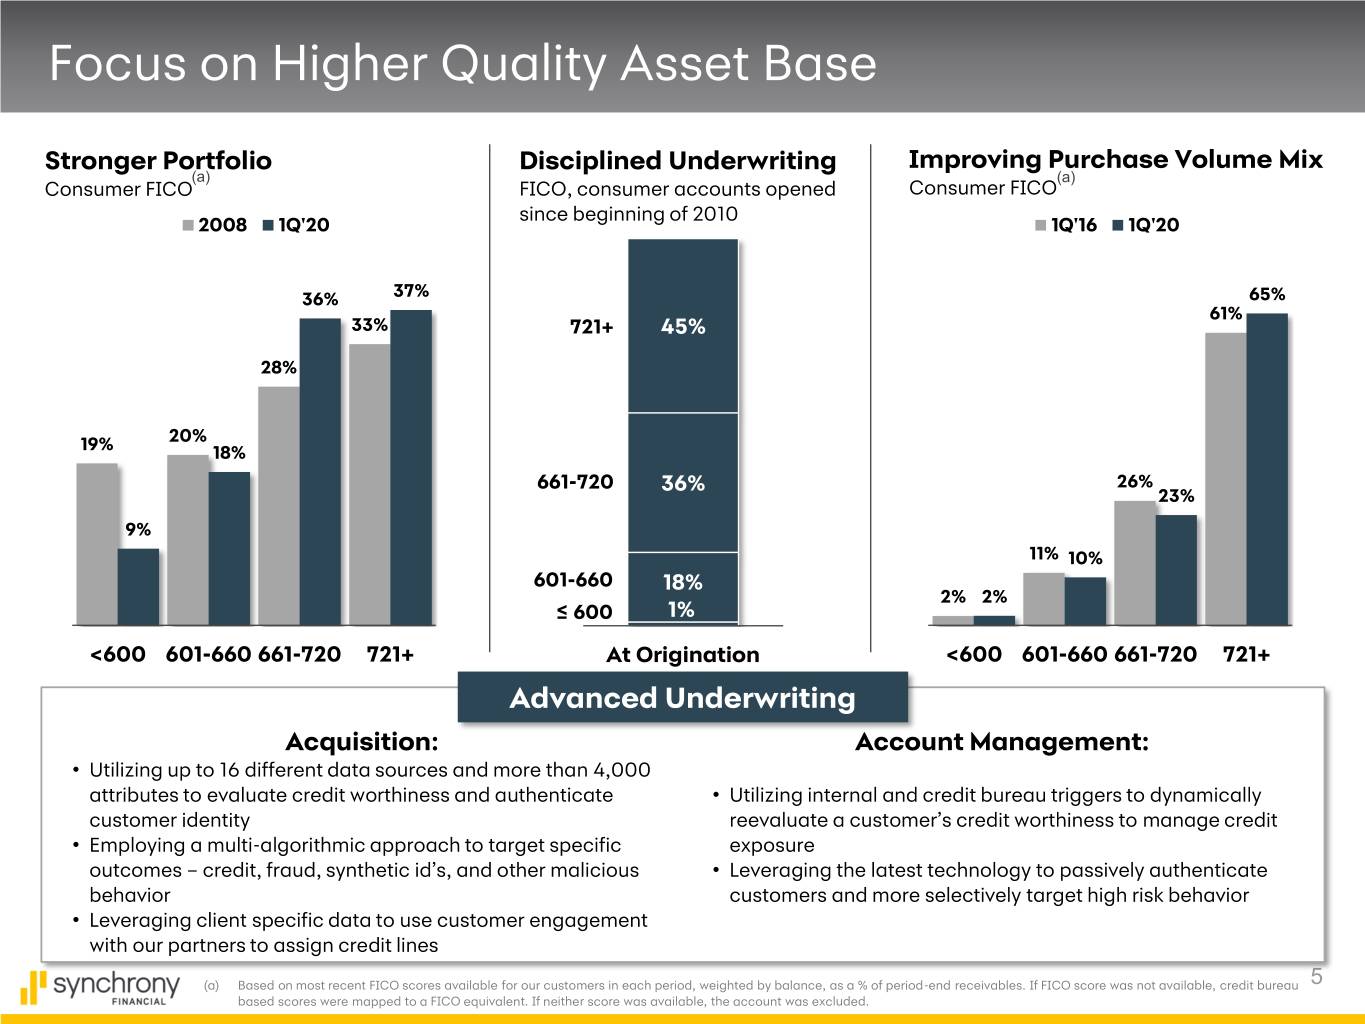
Focus on Higher Quality Asset Base Stronger Portfolio Disciplined Underwriting Improving Purchase Volume Mix (a) (a) Consumer FICO FICO, consumer accounts opened Consumer FICO since beginning of 2010 2008 1Q'20 1Q'16 1Q'20 36% 37% 65% 61% 33% 721+ 45% 28% 20% 19% 18% 661-720 36% 26% 23% 9% 11% 10% 601-660 18% 2% 2% ≤ 600 1% <600 601-660 661-720 721+ At Origination <600 601-660 661-720 721+ Advanced Underwriting Acquisition: Account Management: • Utilizing up to 16 different data sources and more than 4,000 attributes to evaluate credit worthiness and authenticate • Utilizing internal and credit bureau triggers to dynamically customer identity reevaluate a customer’s credit worthiness to manage credit • Employing a multi-algorithmic approach to target specific exposure outcomes – credit, fraud, synthetic id’s, and other malicious • Leveraging the latest technology to passively authenticate behavior customers and more selectively target high risk behavior • Leveraging client specific data to use customer engagement with our partners to assign credit lines (a) Based on most recent FICO scores available for our customers in each period, weighted by balance, as a % of period-end receivables. If FICO score was not available, credit bureau 5 based scores were mapped to a FICO equivalent. If neither score was available, the account was excluded.
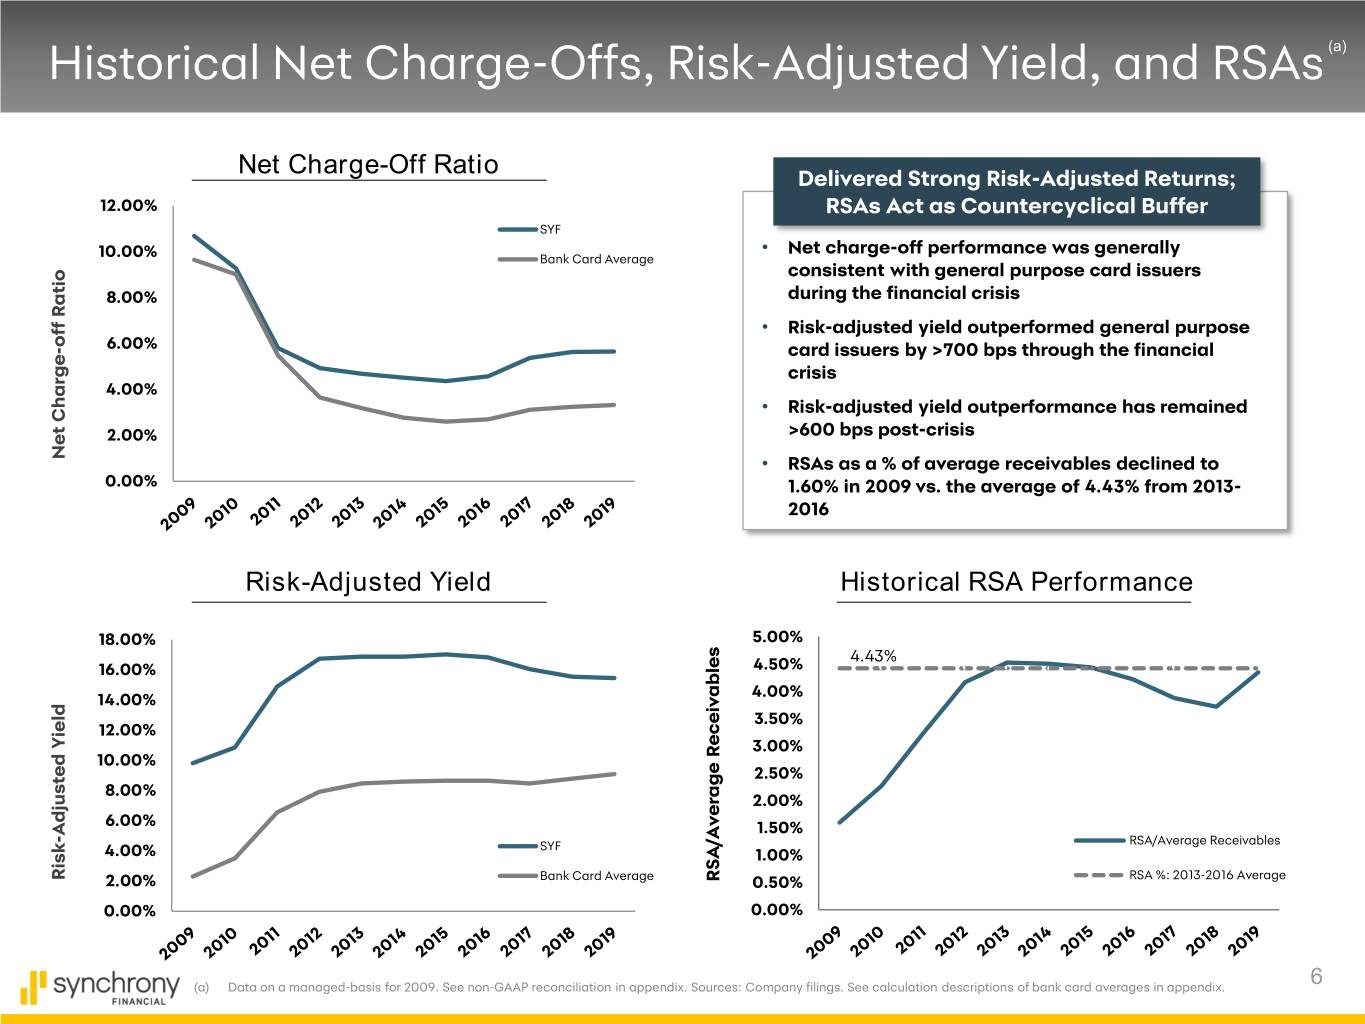
Historical Net Charge-Offs, Risk-Adjusted Yield, and RSAs (a) Net Charge-Off Ratio Delivered Strong Risk-Adjusted Returns; 12.00% RSAs Act as Countercyclical Buffer SYF • Net charge-off performance was generally 10.00% Bank Card Average consistent with general purpose card issuers 8.00% during the financial crisis • Risk-adjusted yield outperformed general purpose off Ratio 6.00% - card issuers by >700 bps through the financial crisis 4.00% • Risk-adjusted yield outperformance has remained 2.00% >600 bps post-crisis Net Net Charge • RSAs as a % of average receivables declined to 0.00% 1.60% in 2009 vs. the average of 4.43% from 2013- 2016 Risk-Adjusted Yield Historical RSA Performance 18.00% 5.00% 4.43% 16.00% 4.50% 14.00% 4.00% 3.50% 12.00% 3.00% 10.00% 2.50% 8.00% 2.00% 6.00% Adjusted Adjusted Yield 1.50% - SYF RSA/Average Receivables 4.00% 1.00% Risk 2.00% Bank Card Average RSA/Average Receivables 0.50% RSA %: 2013-2016 Average 0.00% 0.00% (a) Data on a managed-basis for 2009. See non-GAAP reconciliation in appendix. Sources: Company filings. See calculation descriptions of bank card averages in appendix. 6
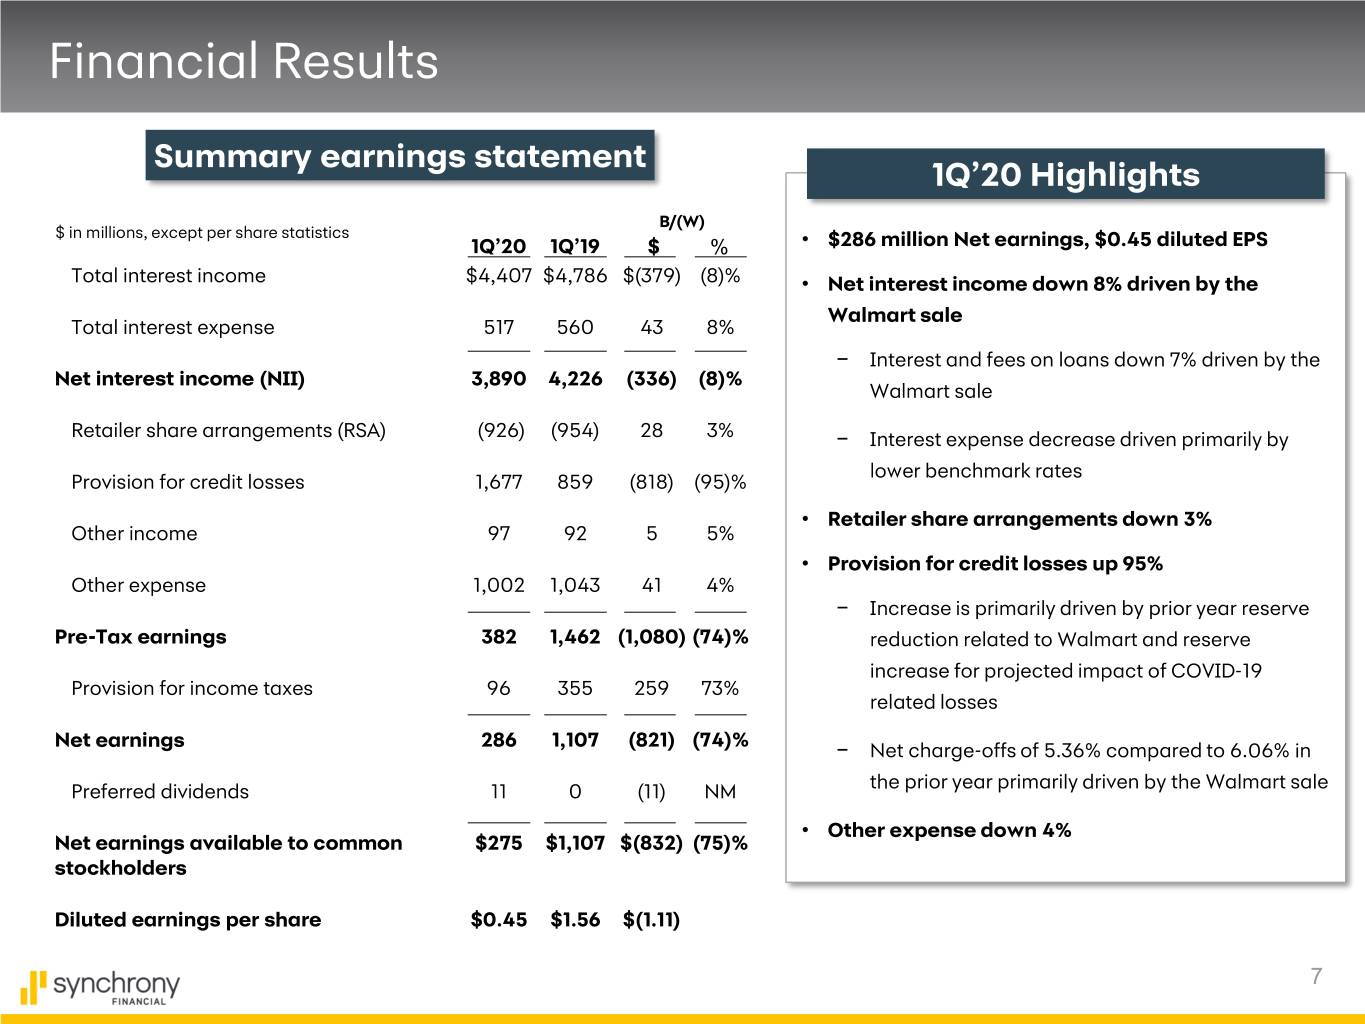
Financial Results Summary earnings statement 1Q’20 Highlights B/(W) $ in millions, except per share statistics 1Q’20 1Q’19 $ % • $286 million Net earnings, $0.45 diluted EPS Total interest income $4,407 $4,786 $(379) (8)% • Net interest income down 8% driven by the Walmart sale Total interest expense 517 560 43 8% − Interest and fees on loans down 7% driven by the Net interest income (NII) 3,890 4,226 (336) (8)% Walmart sale Retailer share arrangements (RSA) (926) (954) 28 3% − Interest expense decrease driven primarily by lower benchmark rates Provision for credit losses 1,677 859 (818) (95)% • Retailer share arrangements down 3% Other income 97 92 5 5% • Provision for credit losses up 95% Other expense 1,002 1,043 41 4% − Increase is primarily driven by prior year reserve Pre-Tax earnings 382 1,462 (1,080) (74)% reduction related to Walmart and reserve increase for projected impact of COVID-19 Provision for income taxes 96 355 259 73% related losses Net earnings 286 1,107 (821) (74)% − Net charge-offs of 5.36% compared to 6.06% in Preferred dividends 11 0 (11) NM the prior year primarily driven by the Walmart sale • Other expense down 4% Net earnings available to common $275 $1,107 $(832) (75)% stockholders Diluted earnings per share $0.45 $1.56 $(1.11) 7
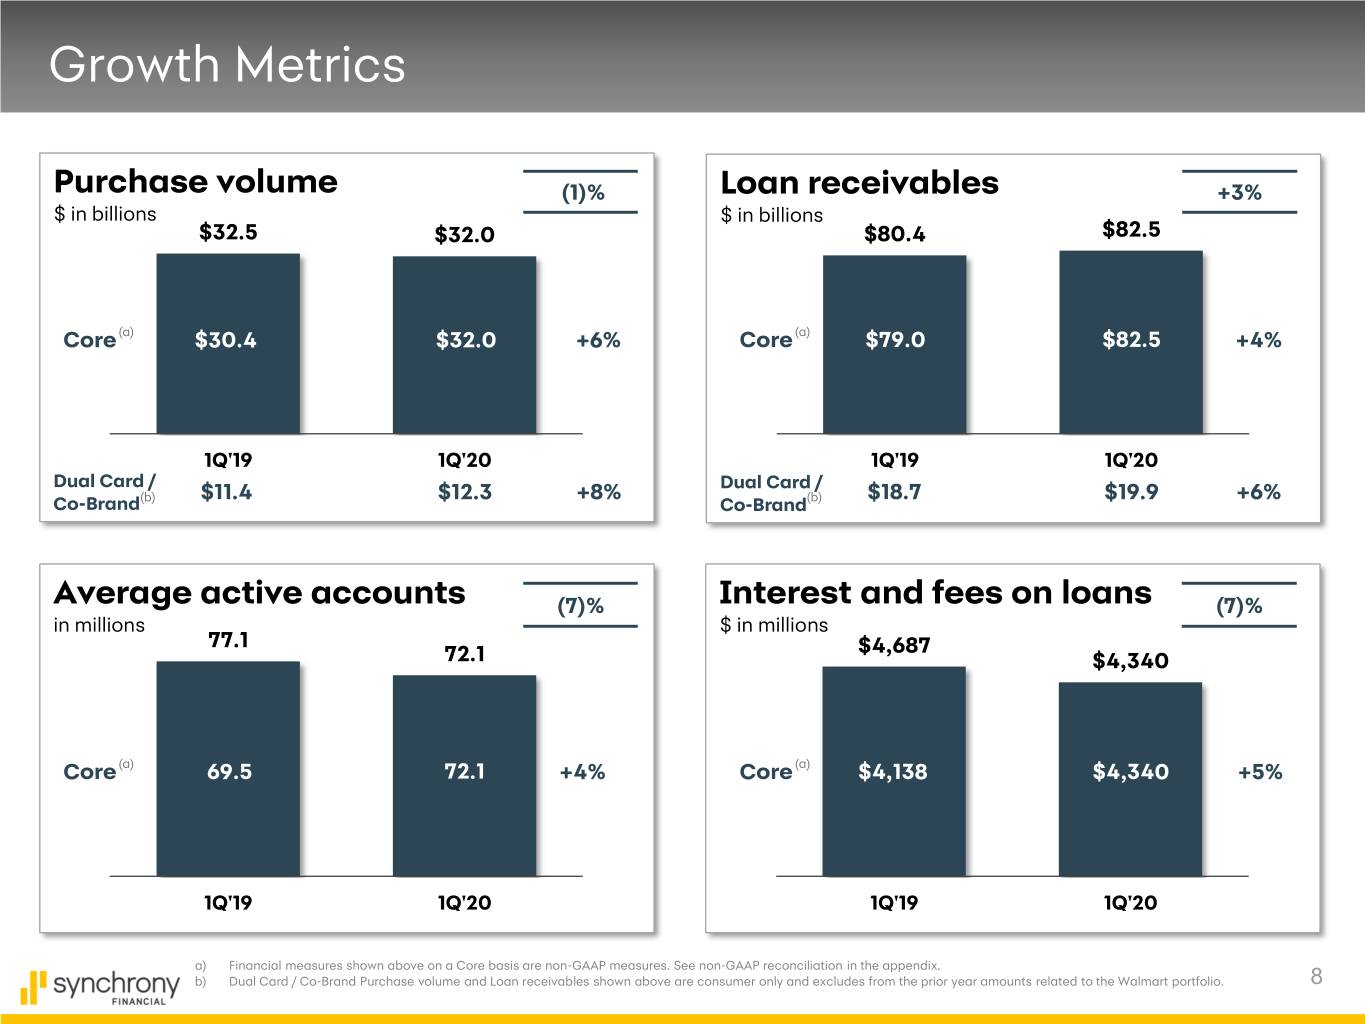
Growth Metrics Purchase volume (1)% Loan receivables +3% $ in billions $ in billions $32.5 $32.0 $80.4 $82.5 Core (a) $30.4 $32.0 +6% Core (a) $79.0 $82.5 +4% 1Q'19 1Q'20 1Q'19 1Q'20 Dual Card / Dual Card / (b) $11.4 $12.3 +8% (b) $18.7 $19.9 +6% Co-Brand Co-Brand Average active accounts (7)% Interest and fees on loans (7)% in millions $ in millions 77.1 $4,687 72.1 $4,340 Core (a) 69.5 72.1 +4% Core (a) $4,138 $4,340 +5% 1Q'19 1Q'20 1Q'19 1Q'20 a) Financial measures shown above on a Core basis are non-GAAP measures. See non-GAAP reconciliation in the appendix. b) Dual Card / Co-Brand Purchase volume and Loan receivables shown above are consumer only and excludes from the prior year amounts related to the Walmart portfolio. 8
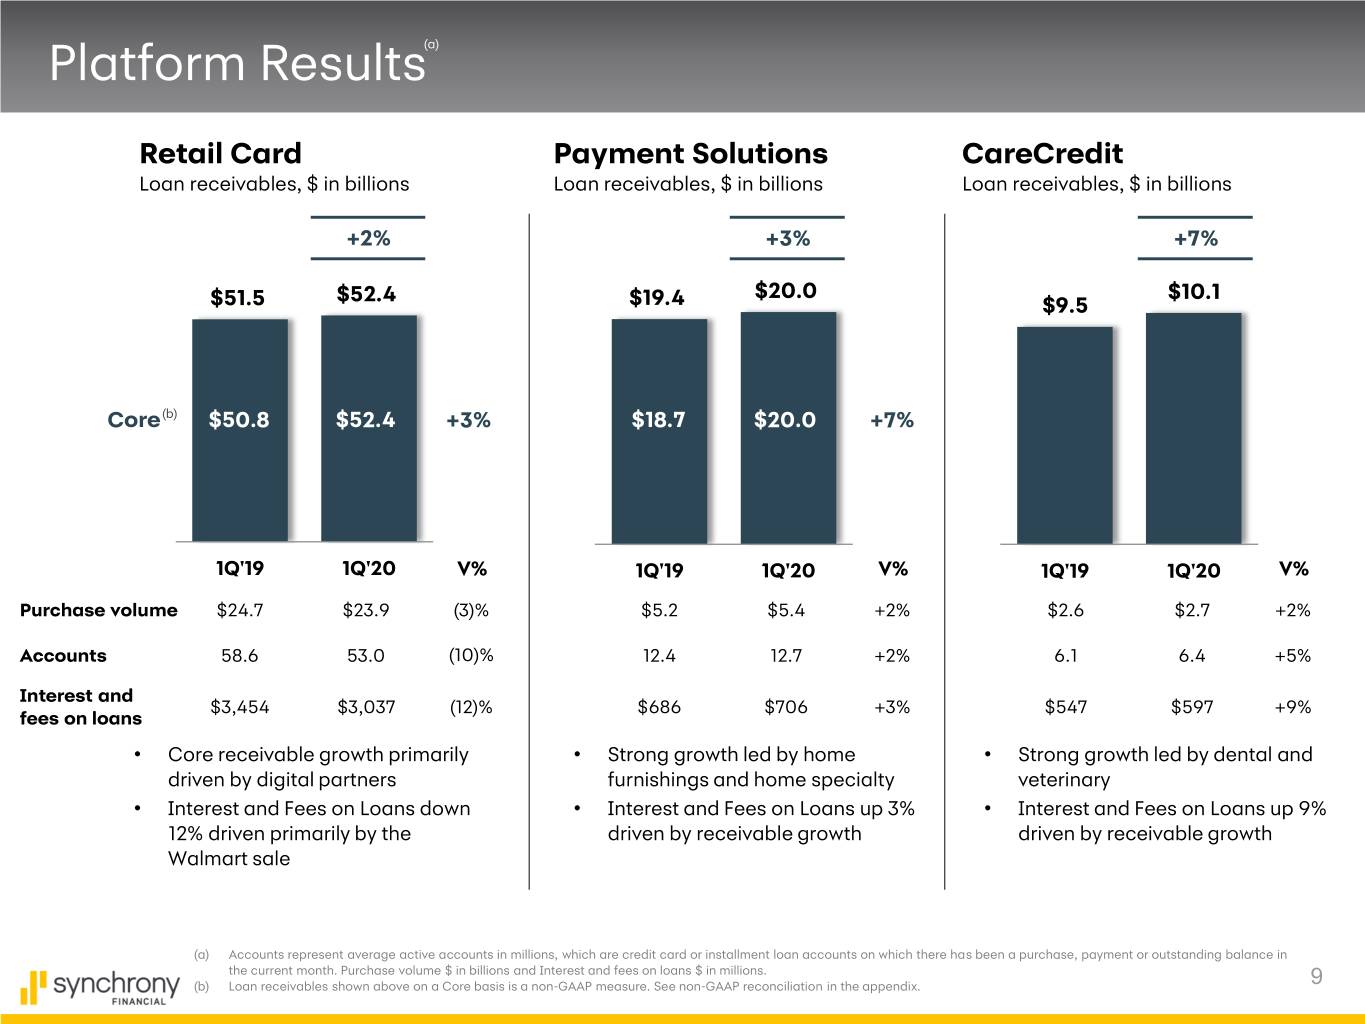
Platform Results(a) Retail Card Payment Solutions CareCredit Loan receivables, $ in billions Loan receivables, $ in billions Loan receivables, $ in billions +2% +3% +7% $20.0 $10.1 $51.5 $52.4 $19.4 $9.5 Core(b) $50.8 $52.4 +3% $18.7 $20.0 +7% 1Q'19 1Q'20 V% 1Q'19 1Q'20 V% 1Q'19 1Q'20 V% Purchase volume $24.7 $23.9 (3)% $5.2 $5.4 +2% $2.6 $2.7 +2% Accounts 58.6 53.0 (10)% 12.4 12.7 +2% 6.1 6.4 +5% Interest and $3,454 $3,037 (12)% $686 $706 +3% $547 $597 +9% fees on loans • Core receivable growth primarily • Strong growth led by home • Strong growth led by dental and driven by digital partners furnishings and home specialty veterinary • Interest and Fees on Loans down • Interest and Fees on Loans up 3% • Interest and Fees on Loans up 9% 12% driven primarily by the driven by receivable growth driven by receivable growth Walmart sale (a) Accounts represent average active accounts in millions, which are credit card or installment loan accounts on which there has been a purchase, payment or outstanding balance in the current month. Purchase volume $ in billions and Interest and fees on loans $ in millions. (b) Loan receivables shown above on a Core basis is a non-GAAP measure. See non-GAAP reconciliation in the appendix. 9
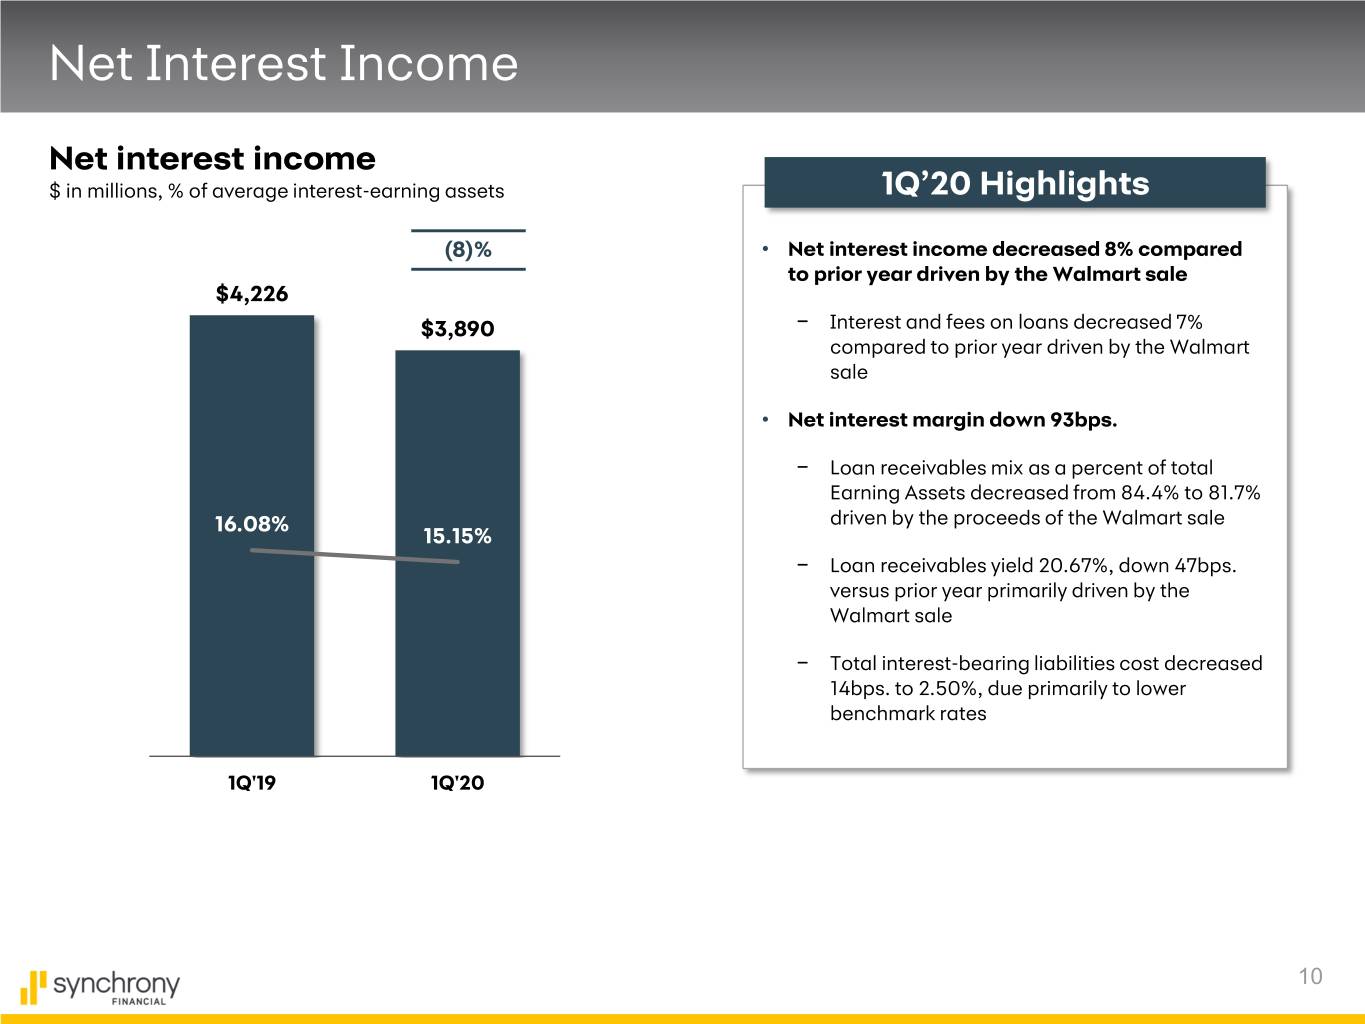
Net Interest Income Net interest income $ in millions, % of average interest-earning assets 1Q’20 Highlights (8)% • Net interest income decreased 8% compared to prior year driven by the Walmart sale $4,226 $3,890 − Interest and fees on loans decreased 7% compared to prior year driven by the Walmart sale • Net interest margin down 93bps. − Loan receivables mix as a percent of total Earning Assets decreased from 84.4% to 81.7% 16.08% driven by the proceeds of the Walmart sale 15.15% − Loan receivables yield 20.67%, down 47bps. versus prior year primarily driven by the Walmart sale − Total interest-bearing liabilities cost decreased 14bps. to 2.50%, due primarily to lower benchmark rates 1Q'19 1Q'20 10
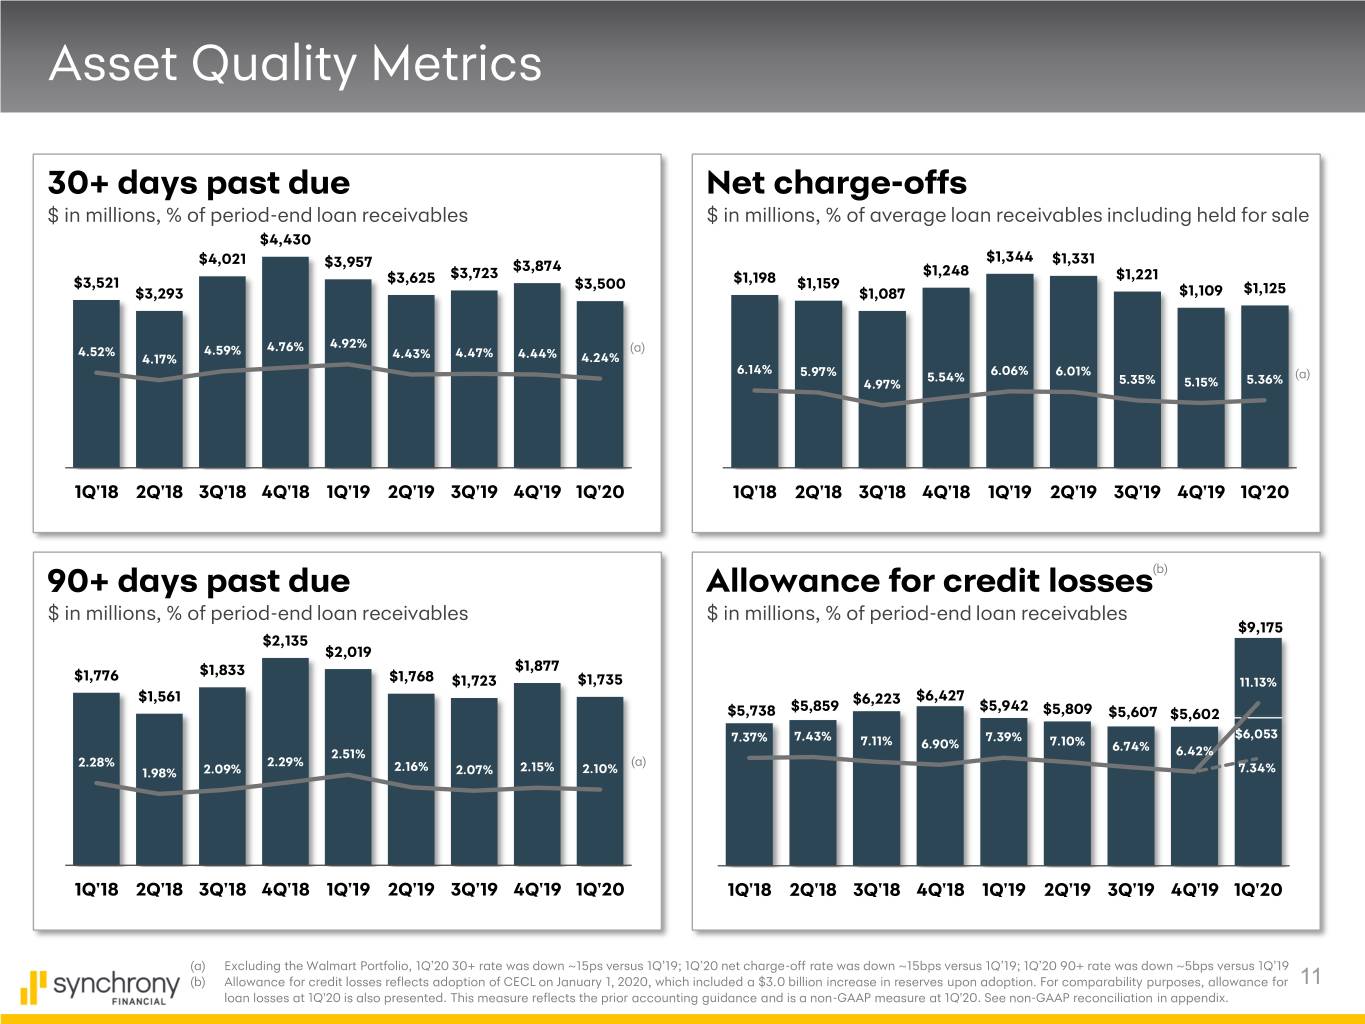
Asset Quality Metrics 30+ days past due Net charge-offs $ in millions, % of period-end loan receivables $ in millions, % of average loan receivables including held for sale $4,430 $1,344 $4,021 $3,957 $3,874 $1,331 $3,723 $1,248 $1,221 $3,521 $3,625 $3,500 $1,198 $1,159 $3,293 $1,087 $1,109 $1,125 4.92% 4.52% 4.59% 4.76% (a) 4.17% 4.43% 4.47% 4.44% 4.24% 6.14% 5.97% 5.54% 6.06% 6.01% (a) 4.97% 5.35% 5.15% 5.36% 1Q'18 2Q'18 3Q'18 4Q'18 1Q'19 2Q'19 3Q'19 4Q'19 1Q'20 1Q'18 2Q'18 3Q'18 4Q'18 1Q'19 2Q'19 3Q'19 4Q'19 1Q'20 90+ days past due Allowance for credit losses(b) $ in millions, % of period-end loan receivables $ in millions, % of period-end loan receivables $9,175 $2,135 $2,019 $1,833 $1,877 $1,776 $1,768 $1,723 $1,735 11.13% $1,561 $6,427 $5,859 $6,223 $5,942 $5,738 $5,809 $5,607 $5,602 7.37% 7.43% 7.39% $6,053 7.11% 6.90% 7.10% 6.74% 2.51% 6.42% 2.28% 2.29% (a) 1.98% 2.09% 2.16% 2.07% 2.15% 2.10% 7.34% 1Q'18 2Q'18 3Q'18 4Q'18 1Q'19 2Q'19 3Q'19 4Q'19 1Q'20 1Q'18 2Q'18 3Q'18 4Q'18 1Q'19 2Q'19 3Q'19 4Q'19 1Q'20 (a) Excluding the Walmart Portfolio, 1Q’20 30+ rate was down ~15ps versus 1Q’19; 1Q’20 net charge-off rate was down ~15bps versus 1Q’19; 1Q’20 90+ rate was down ~5bps versus 1Q’19 (b) Allowance for credit losses reflects adoption of CECL on January 1, 2020, which included a $3.0 billion increase in reserves upon adoption. For comparability purposes, allowance for 11 loan losses at 1Q'20 is also presented. This measure reflects the prior accounting guidance and is a non-GAAP measure at 1Q'20. See non-GAAP reconciliation in appendix.
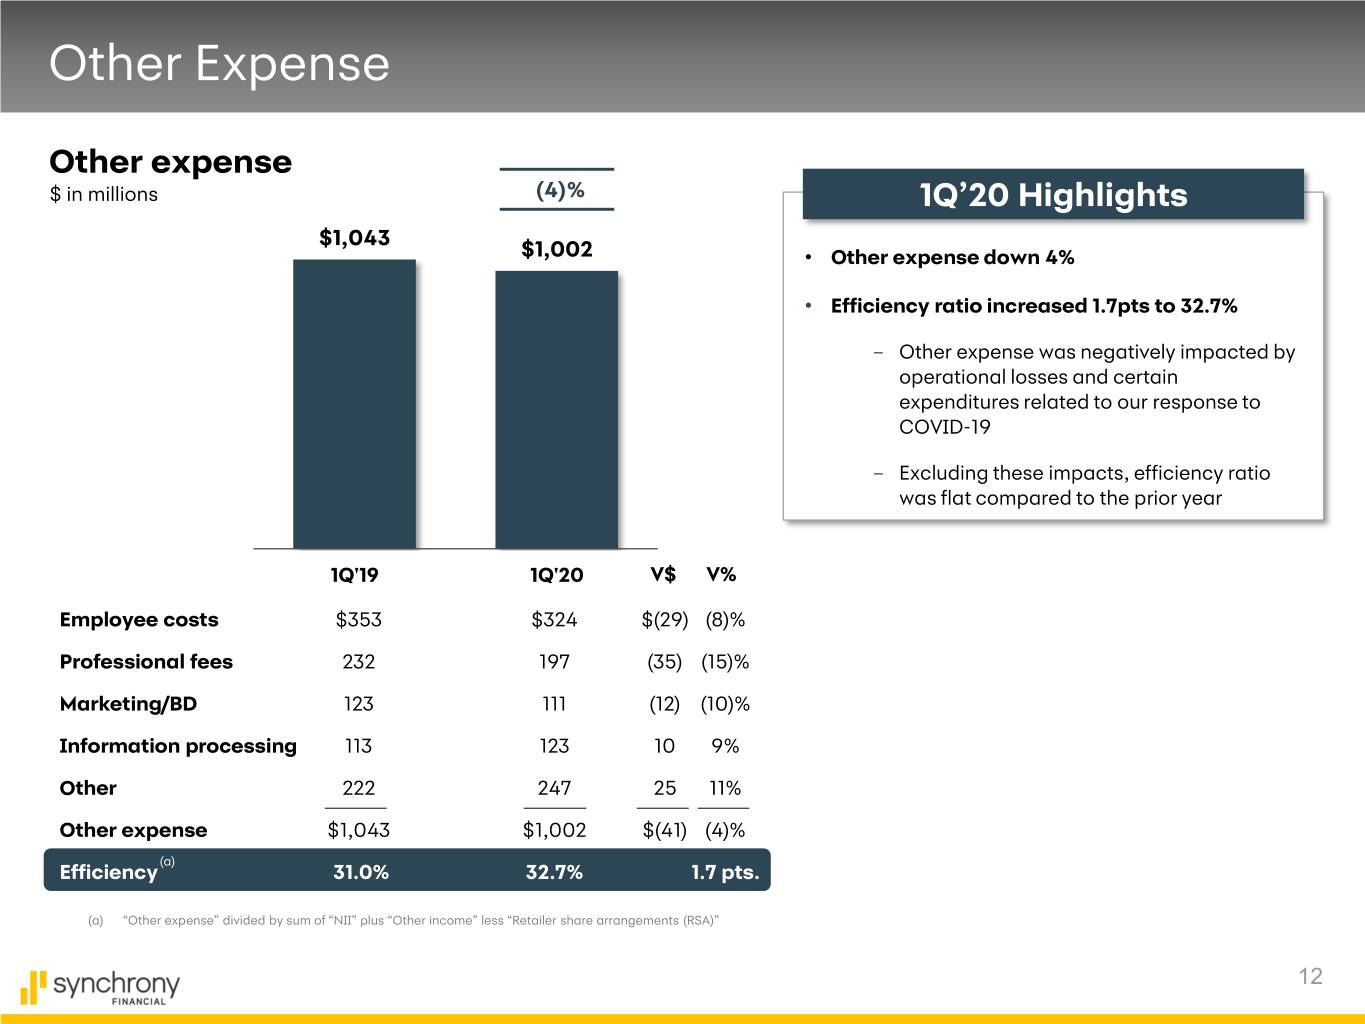
Other Expense Other expense $ in millions (4)% 1Q’20 Highlights $1,043 $1,002 • Other expense down 4% • Efficiency ratio increased 1.7pts to 32.7% – Other expense was negatively impacted by operational losses and certain expenditures related to our response to COVID-19 – Excluding these impacts, efficiency ratio was flat compared to the prior year 1Q'19 1Q'20 V$ V% Employee costs $353 $324 $(29) (8)% Professional fees 232 197 (35) (15)% Marketing/BD 123 111 (12) (10)% Information processing 113 123 10 9% Other 222 247 25 11% Other expense $1,043 $1,002 $(41) (4)% (a) Efficiency 31.0% 32.7% 1.7 pts. (a) “Other expense” divided by sum of “NII” plus “Other income” less “Retailer share arrangements (RSA)” 12
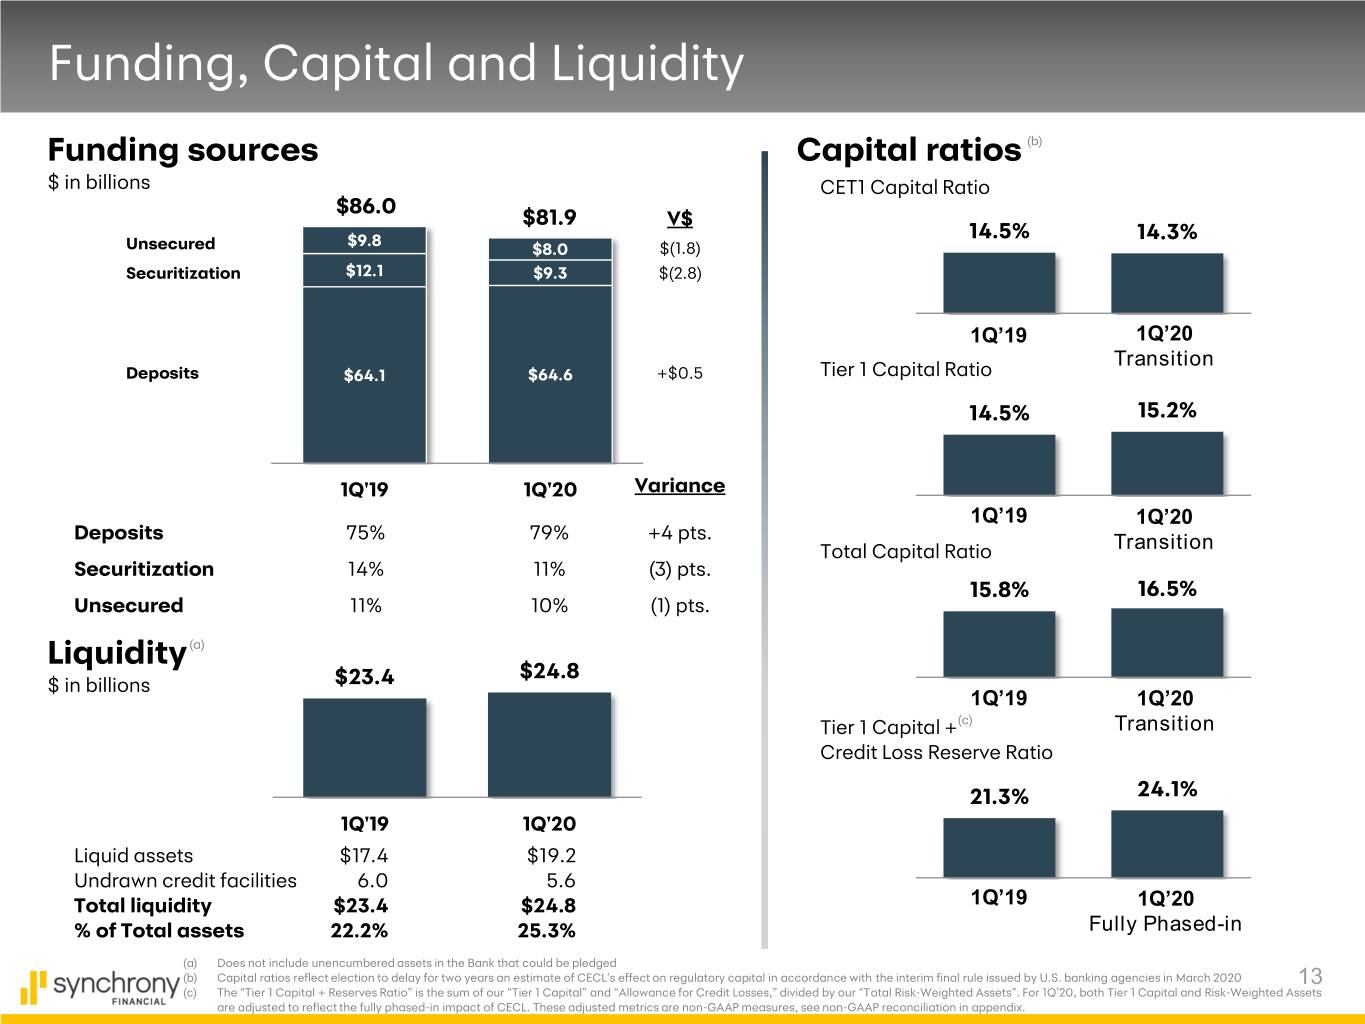
Funding, Capital and Liquidity Funding sources Capital ratios (b) $ in billions CET1 Capital Ratio $86.0 $81.9 V$ $9.8 14.5% 14.3% Unsecured $8.0 $(1.8) Securitization $12.1 $9.3 $(2.8) 1Q’19 1Q’20 Transition Deposits $64.1 $64.6 +$0.5 Tier 1 Capital Ratio 14.5% 15.2% 1Q'19 1Q'20 Variance 1Q’19 1Q’20 Deposits 75% 79% +4 pts. Total Capital Ratio Transition Securitization 14% 11% (3) pts. 15.8% 16.5% Unsecured 11% 10% (1) pts. Liquidity (a) $24.8 $ in billions $23.4 1Q’19 1Q’20 Tier 1 Capital + (c) Transition Credit Loss Reserve Ratio 21.3% 24.1% 1Q'19 1Q'20 Liquid assets $17.4 $19.2 Undrawn credit facilities 6.0 5.6 Total liquidity $23.4 $24.8 1Q’19 1Q’20 % of Total assets 22.2% 25.3% Fully Phased-in (a) Does not include unencumbered assets in the Bank that could be pledged (b) Capital ratios reflect election to delay for two years an estimate of CECL’s effect on regulatory capital in accordance with the interim final rule issued by U.S. banking agencies in March 2020 13 (c) The “Tier 1 Capital + Reserves Ratio” is the sum of our “Tier 1 Capital” and “Allowance for Credit Losses,” divided by our “Total Risk-Weighted Assets”. For 1Q’20, both Tier 1 Capital and Risk-Weighted Assets are adjusted to reflect the fully phased-in impact of CECL. These adjusted metrics are non-GAAP measures, see non-GAAP reconciliation in appendix.
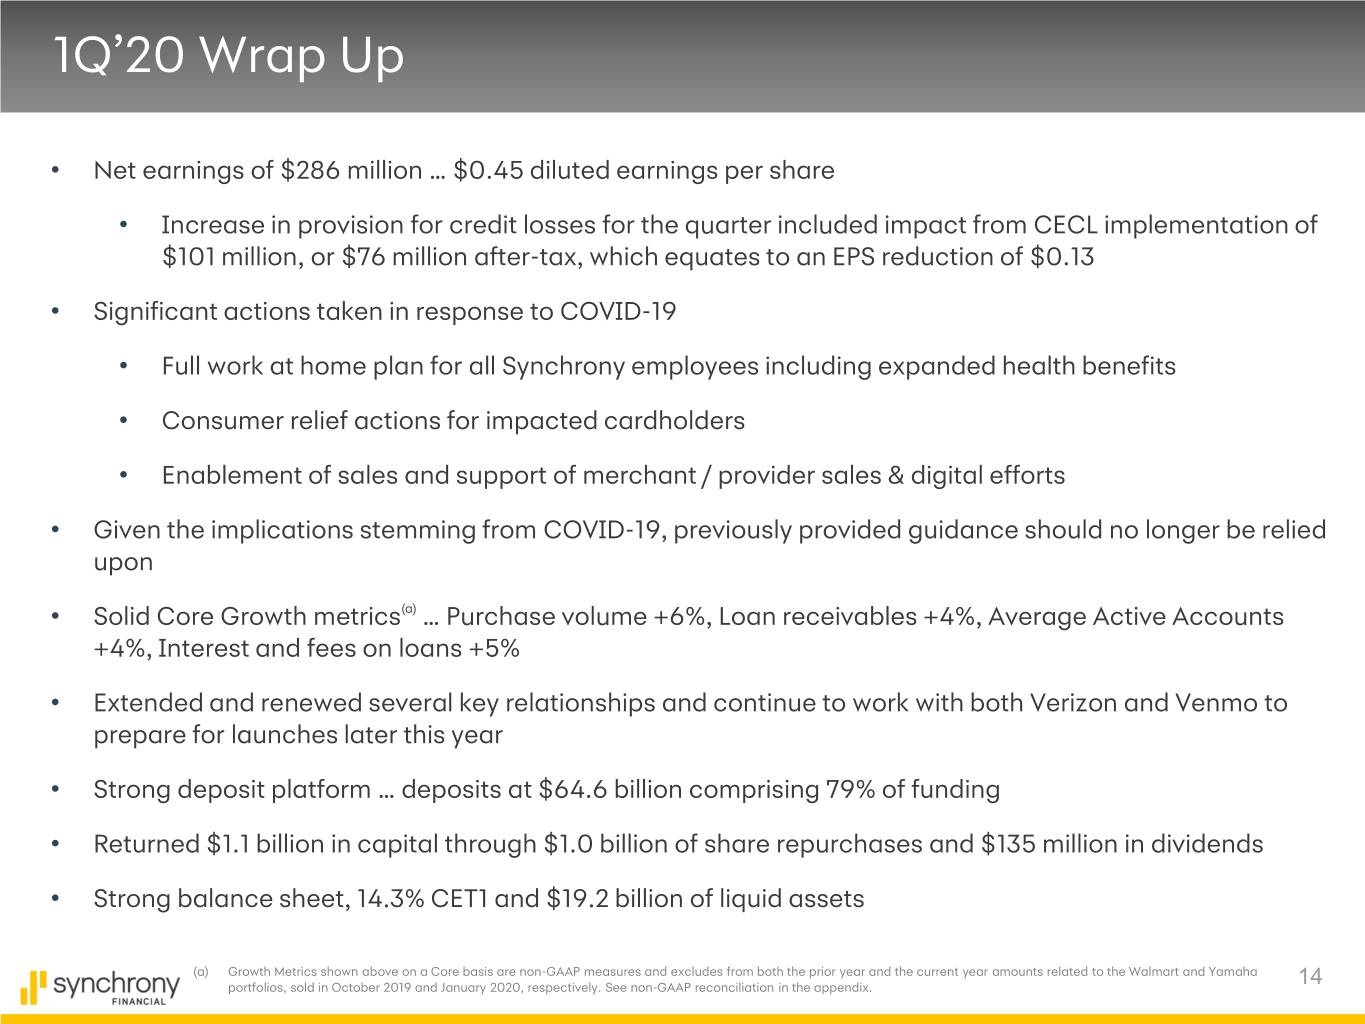
1Q’20 Wrap Up • Net earnings of $286 million … $0.45 diluted earnings per share • Increase in provision for credit losses for the quarter included impact from CECL implementation of $101 million, or $76 million after-tax, which equates to an EPS reduction of $0.13 • Significant actions taken in response to COVID-19 • Full work at home plan for all Synchrony employees including expanded health benefits • Consumer relief actions for impacted cardholders • Enablement of sales and support of merchant / provider sales & digital efforts • Given the implications stemming from COVID-19, previously provided guidance should no longer be relied upon • Solid Core Growth metrics(a) … Purchase volume +6%, Loan receivables +4%, Average Active Accounts +4%, Interest and fees on loans +5% • Extended and renewed several key relationships and continue to work with both Verizon and Venmo to prepare for launches later this year • Strong deposit platform … deposits at $64.6 billion comprising 79% of funding • Returned $1.1 billion in capital through $1.0 billion of share repurchases and $135 million in dividends • Strong balance sheet, 14.3% CET1 and $19.2 billion of liquid assets (a) Growth Metrics shown above on a Core basis are non-GAAP measures and excludes from both the prior year and the current year amounts related to the Walmart and Yamaha portfolios, sold in October 2019 and January 2020, respectively. See non-GAAP reconciliation in the appendix. 14

Engage with us.
Appendix a) Net Charge-Off Ratio bank card average peers include: AXP U.S. Card Services prior to 2014 and AXP U.S. Consumer Services starting in 2014, BAC U.S. Credit Card, C Citi-Branded Cards North America, COF Domestic Card, DFS Credit Card, JPM Credit Card, and WFC Consumer Credit Card. SYF – total company level. Risk Adjusted Yield bank card average peers include: BAC U.S. Credit Card, C Citi-Branded Cards North America, COF Domestic Card, DFS Credit Card, and WFC Consumer Credit Card. SYF – total company level. SYF yield calculated as loan receivable yield less net charge- off rate. Peer information calculated as credit card yield less net charge-off rate on credit cards. Citi-Branded Card yield calculated as average quarterly yield less net charge-off rate on credit cards (average quarterly net charge-off rate). 16
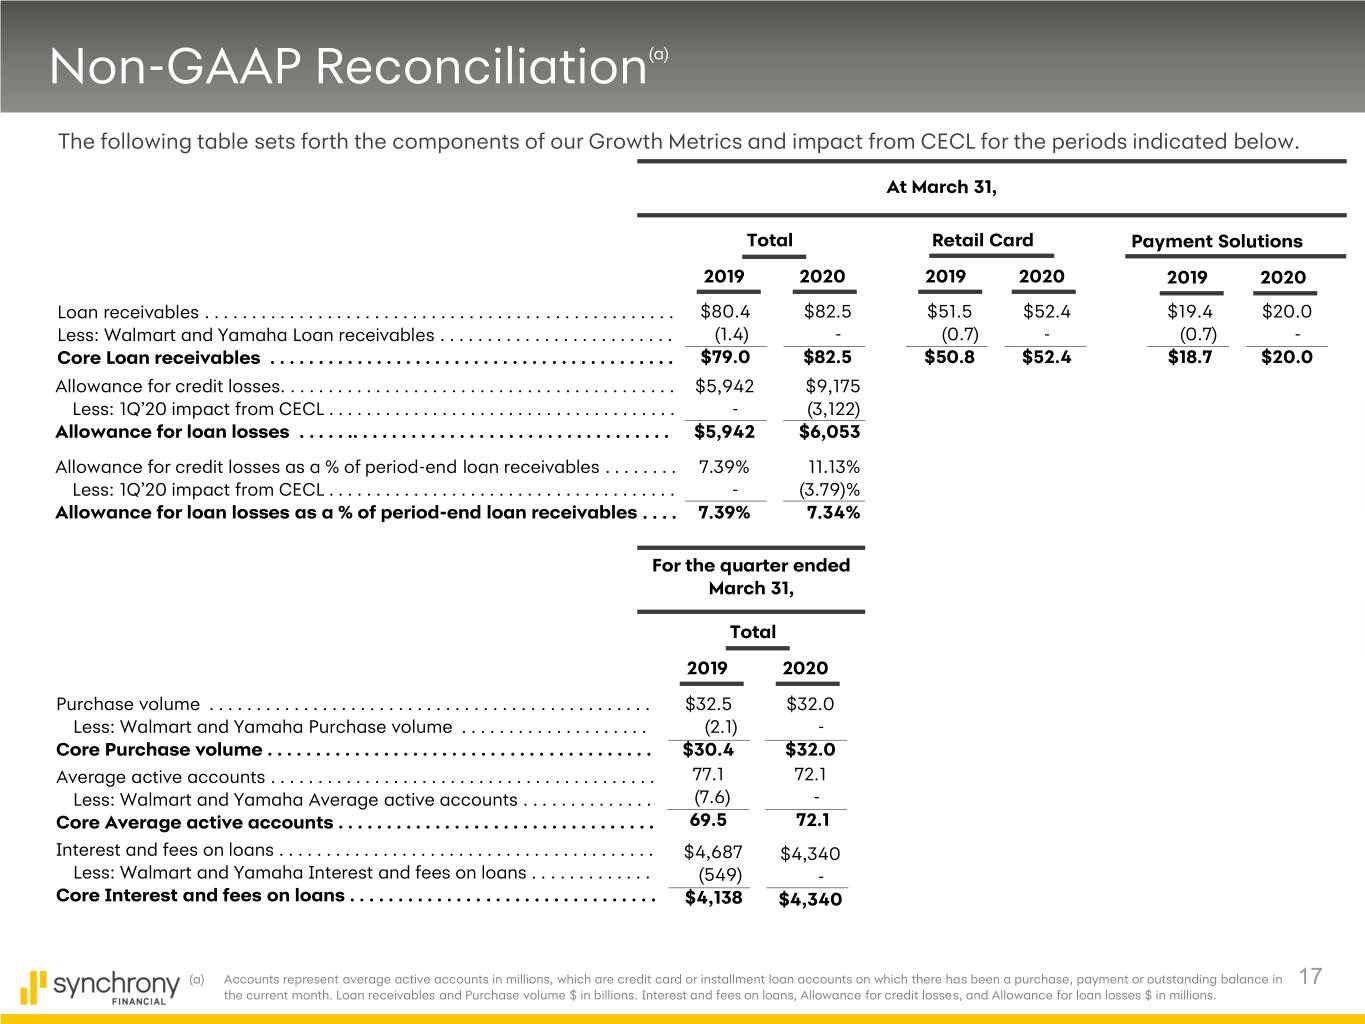
Non-GAAP Reconciliation(a) The following table sets forth the components of our Growth Metrics and impact from CECL for the periods indicated below. At March 31, Total Retail Card Payment Solutions 2019 2020 2019 2020 2019 2020 Loan receivables . . . . . . . . . . . . . . . . . . . . . . . . . . . . . . . . . . . . . . . . . . . . . . . . . . $80.4 $82.5 $51.5 $52.4 $19.4 $20.0 Less: Walmart and Yamaha Loan receivables . . . . . . . . . . . . . . . . . . . . . . . . . (1.4) - (0.7) - (0.7) - Core Loan receivables . . . . . . . . . . . . . . . . . . . . . . . . . . . . . . . . . . . . . . . . . . $79.0 $82.5 $50.8 $52.4 $18.7 $20.0 Allowance for credit losses. . . . . . . . . . . . . . . . . . . . . . . . . . . . . . . . . . . . . . . . . . $5,942 $9,175 Less: 1Q’20 impact from CECL . . . . . . . . . . . . . . . . . . . . . . . . . . . . . . . . . . . . . - (3,122) Allowance for loan losses . . . . . .. . . . . . . . . . . . . . . . . . . . . . . . . . . . . . . . . $5,942 $6,053 Allowance for credit losses as a % of period-end loan receivables . . . . . . . . 7.39% 11.13% Less: 1Q’20 impact from CECL . . . . . . . . . . . . . . . . . . . . . . . . . . . . . . . . . . . . . - (3.79)% Allowance for loan losses as a % of period-end loan receivables . . . . 7.39% 7.34% For the quarter ended March 31, Total 2019 2020 Purchase volume . . . . . . . . . . . . . . . . . . . . . . . . . . . . . . . . . . . . . . . . . . . . . . . $32.5 $32.0 Less: Walmart and Yamaha Purchase volume . . . . . . . . . . . . . . . . . . . . (2.1) - Core Purchase volume . . . . . . . . . . . . . . . . . . . . . . . . . . . . . . . . . . . . . . . . $30.4 $32.0 Average active accounts . . . . . . . . . . . . . . . . . . . . . . . . . . . . . . . . . . . . . . . . . 77.1 72.1 Less: Walmart and Yamaha Average active accounts . . . . . . . . . . . . . . (7.6) - Core Average active accounts . . . . . . . . . . . . . . . . . . . . . . . . . . . . . . . . . 69.5 72.1 Interest and fees on loans . . . . . . . . . . . . . . . . . . . . . . . . . . . . . . . . . . . . . . . . $4,687 $4,340 Less: Walmart and Yamaha Interest and fees on loans . . . . . . . . . . . . . (549) - Core Interest and fees on loans . . . . . . . . . . . . . . . . . . . . . . . . . . . . . . . . $4,138 $4,340 (a) Accounts represent average active accounts in millions, which are credit card or installment loan accounts on which there has been a purchase, payment or outstanding balance in 17 the current month. Loan receivables and Purchase volume $ in billions. Interest and fees on loans, Allowance for credit losses, and Allowance for loan losses $ in millions.
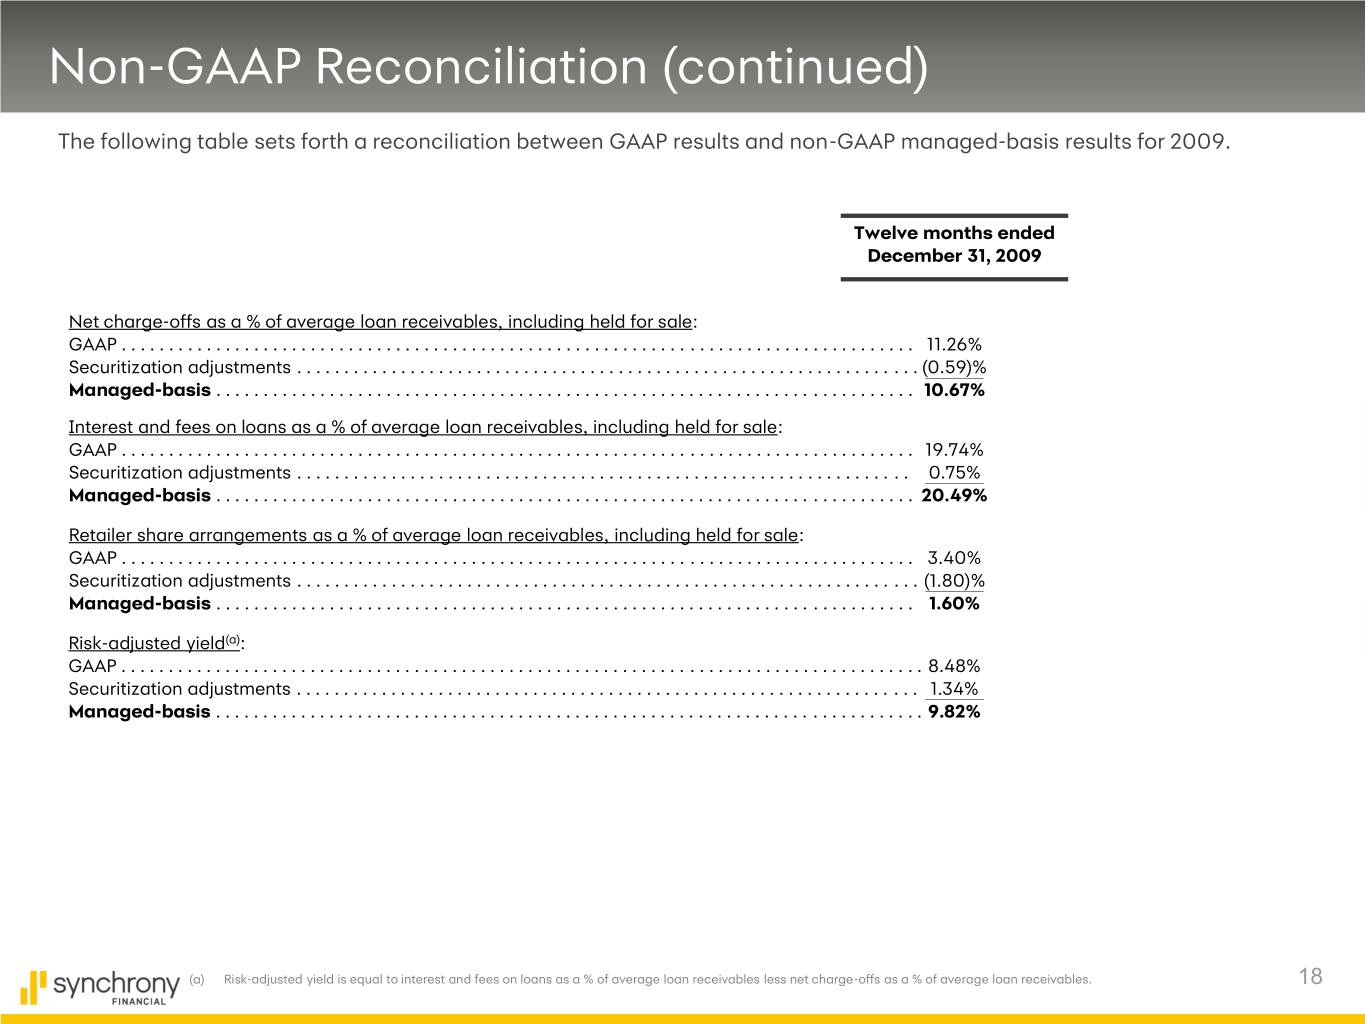
Non-GAAP Reconciliation (continued) The following table sets forth a reconciliation between GAAP results and non-GAAP managed-basis results for 2009. Twelve months ended December 31, 2009 Net charge-offs as a % of average loan receivables, including held for sale: GAAP . . . . . . . . . . . . . . . . . . . . . . . . . . . . . . . . . . . . . . . . . . . . . . . . . . . . . . . . . . . . . . . . . . . . . . . . . . . . . . . . . . . . 11.26% Securitization adjustments . . . . . . . . . . . . . . . . . . . . . . . . . . . . . . . . . . . . . . . . . . . . . . . . . . . . . . . . . . . . . . . . . . (0.59)% Managed-basis . . . . . . . . . . . . . . . . . . . . . . . . . . . . . . . . . . . . . . . . . . . . . . . . . . . . . . . . . . . . . . . . . . . . . . . . . . 10.67% Interest and fees on loans as a % of average loan receivables, including held for sale: GAAP . . . . . . . . . . . . . . . . . . . . . . . . . . . . . . . . . . . . . . . . . . . . . . . . . . . . . . . . . . . . . . . . . . . . . . . . . . . . . . . . . . . . 19.74% Securitization adjustments . . . . . . . . . . . . . . . . . . . . . . . . . . . . . . . . . . . . . . . . . . . . . . . . . . . . . . . . . . . . . . . . . 0.75% Managed-basis . . . . . . . . . . . . . . . . . . . . . . . . . . . . . . . . . . . . . . . . . . . . . . . . . . . . . . . . . . . . . . . . . . . . . . . . . . 20.49% Retailer share arrangements as a % of average loan receivables, including held for sale: GAAP . . . . . . . . . . . . . . . . . . . . . . . . . . . . . . . . . . . . . . . . . . . . . . . . . . . . . . . . . . . . . . . . . . . . . . . . . . . . . . . . . . . . 3.40% Securitization adjustments . . . . . . . . . . . . . . . . . . . . . . . . . . . . . . . . . . . . . . . . . . . . . . . . . . . . . . . . . . . . . . . . . . (1.80)% Managed-basis . . . . . . . . . . . . . . . . . . . . . . . . . . . . . . . . . . . . . . . . . . . . . . . . . . . . . . . . . . . . . . . . . . . . . . . . . . 1.60% Risk-adjusted yield(a): GAAP . . . . . . . . . . . . . . . . . . . . . . . . . . . . . . . . . . . . . . . . . . . . . . . . . . . . . . . . . . . . . . . . . . . . . . . . . . . . . . . . . . . . . 8.48% Securitization adjustments . . . . . . . . . . . . . . . . . . . . . . . . . . . . . . . . . . . . . . . . . . . . . . . . . . . . . . . . . . . . . . . . . . 1.34% Managed-basis . . . . . . . . . . . . . . . . . . . . . . . . . . . . . . . . . . . . . . . . . . . . . . . . . . . . . . . . . . . . . . . . . . . . . . . . . . . 9.82% (a) Risk-adjusted yield is equal to interest and fees on loans as a % of average loan receivables less net charge-offs as a % of average loan receivables. 18
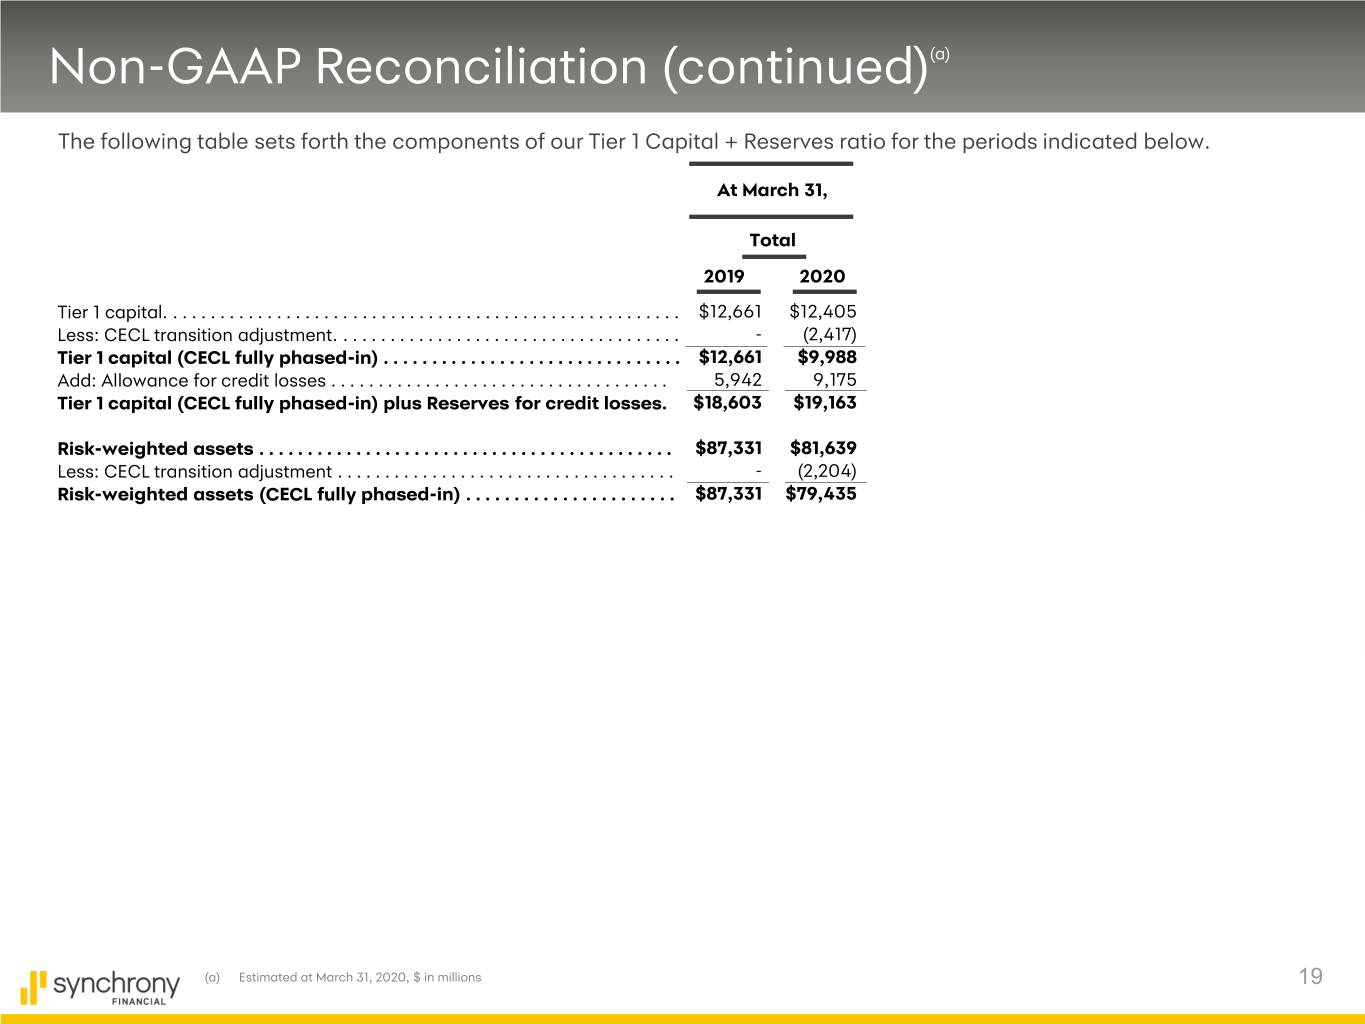
Non-GAAP Reconciliation (continued)(a) The following table sets forth the components of our Tier 1 Capital + Reserves ratio for the periods indicated below. At March 31, Total 2019 2020 Tier 1 capital. . . . . . . . . . . . . . . . . . . . . . . . . . . . . . . . . . . . . . . . . . . . . . . . . . . . . . . $12,661 $12,405 Less: CECL transition adjustment. . . . . . . . . . . . . . . . . . . . . . . . . . . . . . . . . . . . . - (2,417) Tier 1 capital (CECL fully phased-in) . . . . . . . . . . . . . . . . . . . . . . . . . . . . . . . $12,661 $9,988 Add: Allowance for credit losses . . . . . . . . . . . . . . . . . . . . . . . . . . . . . . . . . . . . 5,942 9,175 Tier 1 capital (CECL fully phased-in) plus Reserves for credit losses. $18,603 $19,163 Risk-weighted assets . . . . . . . . . . . . . . . . . . . . . . . . . . . . . . . . . . . . . . . . . . . $87,331 $81,639 Less: CECL transition adjustment . . . . . . . . . . . . . . . . . . . . . . . . . . . . . . . . . . . . - (2,204) Risk-weighted assets (CECL fully phased-in) . . . . . . . . . . . . . . . . . . . . . . $87,331 $79,435 (a) Estimated at March 31, 2020, $ in millions 19
