Attached files
| file | filename |
|---|---|
| EX-99.3 - EX-99.3 - INTERNATIONAL BUSINESS MACHINES CORP | ibm-20200420xex99d3.htm |
| EX-99.1 - EX-99.1 - INTERNATIONAL BUSINESS MACHINES CORP | ibm-20200420xex99d1.htm |
| 8-K - 8-K - INTERNATIONAL BUSINESS MACHINES CORP | ibm-20200421x8k.htm |
Exhibit 99.2
| IBM 1Q 2020 Earnings Non-GAAP Supplemental Material April 20, 2020 ibm.com/investor |
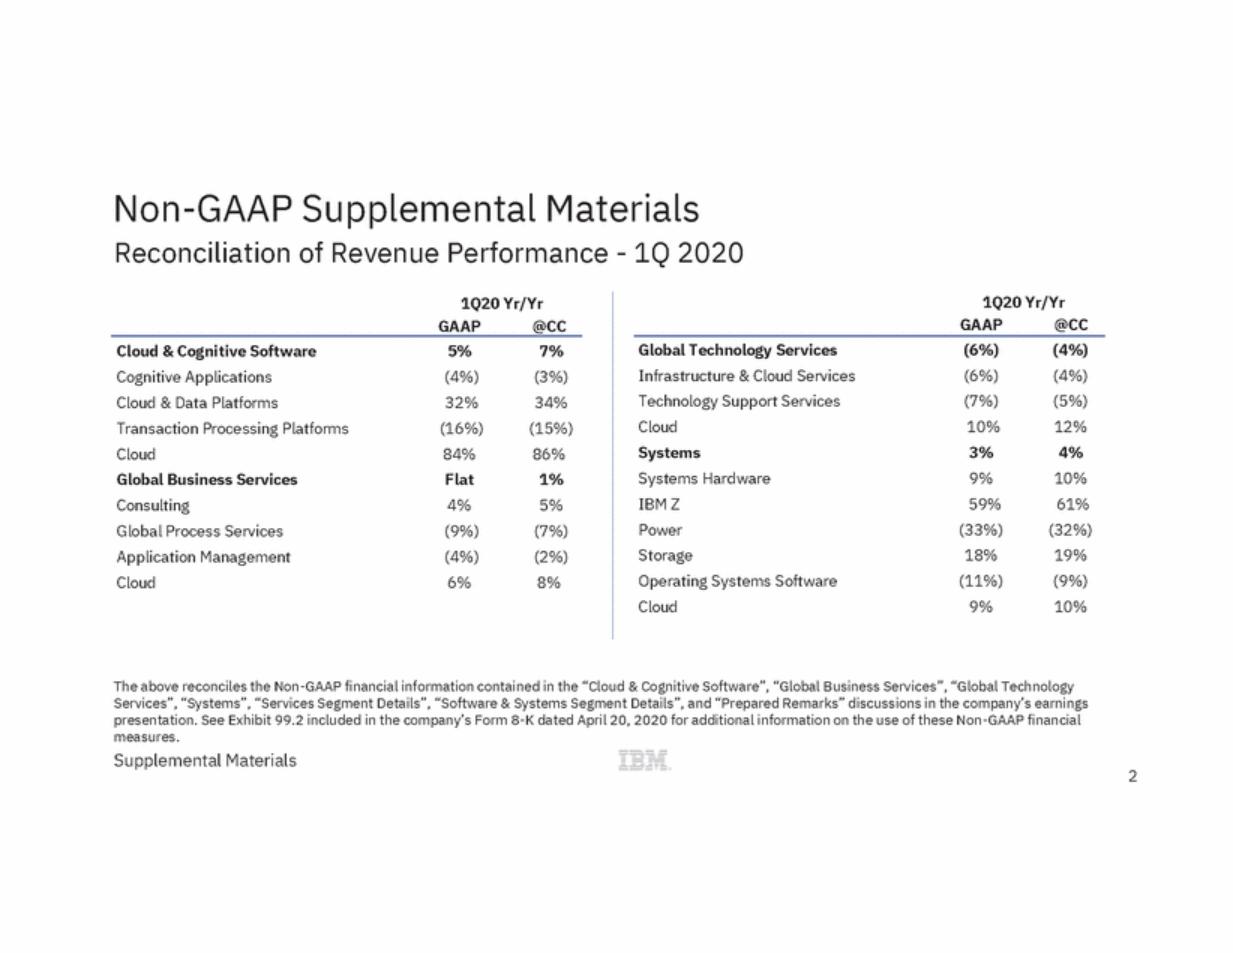
| Non-GAAP Supplemental Materials Reconciliation of Revenue Performance - 1Q 2020 1Q20 Yr/Yr 1Q20 Yr/Yr GAAP @CC GAAP @CC Global Technology Services Infrastructure & Cloud Services Technology Support Services Cloud Systems Systems Hardware IBM Z Power Storage Operating Systems Software Cloud (6%) (6%) (7%) 10% 3% 9% 59% (33%) 18% (11%) 9% (4%) (4%) (5%) 12% 4% 10% 61% (32%) 19% (9%) 10% Cloud & Cognitive Software Cognitive Applications Cloud & Data Platforms Transaction Processing Platforms Cloud Global Business Services Consulting Global Process Services Application Management Cloud 5% (4%) 32% (16%) 84% Flat 4% (9%) (4%) 6% 7% (3%) 34% (15%) 86% 1% 5% (7%) (2%) 8% The above reconciles the Non-GAAP financial information contained in the “Cloud & Cognitive Software”, “Global Business Services”, “Global Technology Services”, “Systems”, “Services Segment Details”, “Software & Systems Segment Details”, and “Prepared Remarks” discussions in the company’s earnings presentation. See Exhibit 99.2 included in the company’s Form 8-K dated April 20, 2020 for additional information on the use of these Non-GAAP financial measures. Supplemental Materials 2 |
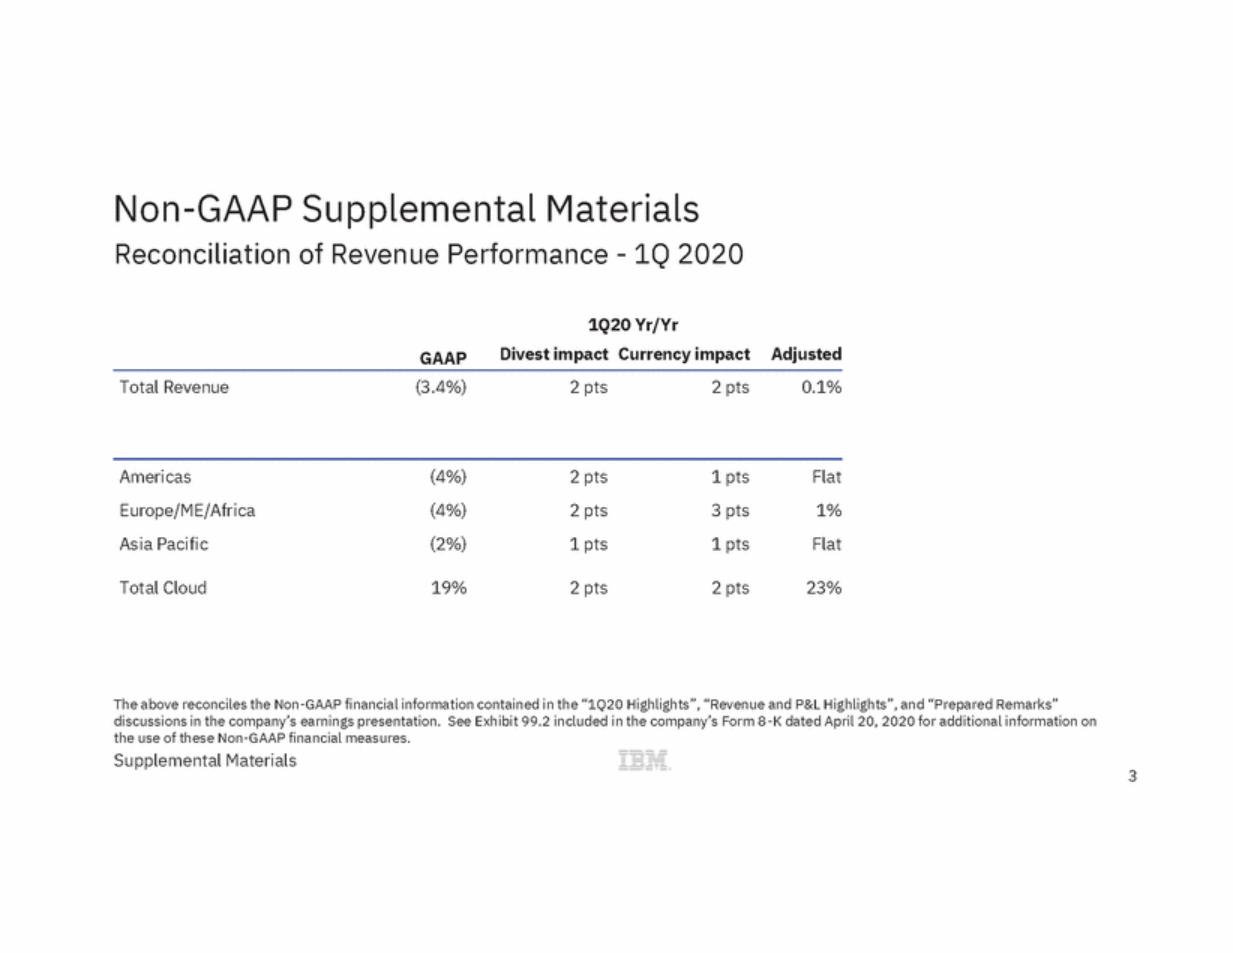
| Non-GAAP Supplemental Materials Reconciliation of Revenue Performance - 1Q 2020 1Q20 Yr/Yr Divest impact Currency impact Adjusted GAAP Total Revenue (3.4%) 2 pts 2 pts 0.1% Americas Europe/ME/Africa Asia Pacific (4%) (4%) (2%) 2 pts 2 pts 1 pts 1 pts 3 pts 1 pts Flat 1% Flat Total Cloud 19% 2 pts 2 pts 23% The above reconciles the Non-GAAP financial information contained in the “1Q20 Highlights”, “Revenue and P&L Highlights”, and “Prepared Remarks” discussions in the company’s earnings presentation. See Exhibit 99.2 included in the company’s Form 8-K dated April 20, 2020 for additional information on the use of these Non-GAAP financial measures. Supplemental Materials 3 |
| Non-GAAP Supplemental Materials Reconciliation of Revenue for Red Hat, Normalized - 1Q 2020 Three Months Ended Red Hat Revenue, Normalized for Historical Comparability Mar 31 2020 Mar 31 2019 Yr/Yr Yr/Yr@CC Red Hat revenue as reported in IBM consolidated results (1) $719 $ - Add: Red Hat revenue prior to acquisition (2) Add: Purchase accounting deferred revenue and intercompany adjustments (3) Red Hat revenue normalized for historical comparability (non-GAAP) - 347 900 - $1,066 $900 18% 20% (1) (2) Represents GAAP Revenue as reported by IBM, which is included in the Cloud & Cognitive Software segment. Red Hat revenue for the three months ended March 31, 2019 represents pre-acquisition Red Hat standalone revenue and is included for comparative purposes. Represents the first-quarter 2020 impact of the deferred revenue purchase accounting adjustment and adjustments to add back revenue which was eliminated for sales between Red Hat and IBM. This line represents revenue that would have been recognized by Red Hat under GAAP if the acquisition had not occurred, but was not recognized by IBM due to purchase accounting and intercompany adjustments. (3) The above reconciles the Non-GAAP financial information contained in the “1Q20 Highlights” and “Prepared Remarks” discussions in the company’s earnings presentation. See Exhibit 99.2 included in the company’s Form 8-K dated April 20, 2020 for additional information on the use of these Non-GAAP financial measures. Supplemental Materials 4 |

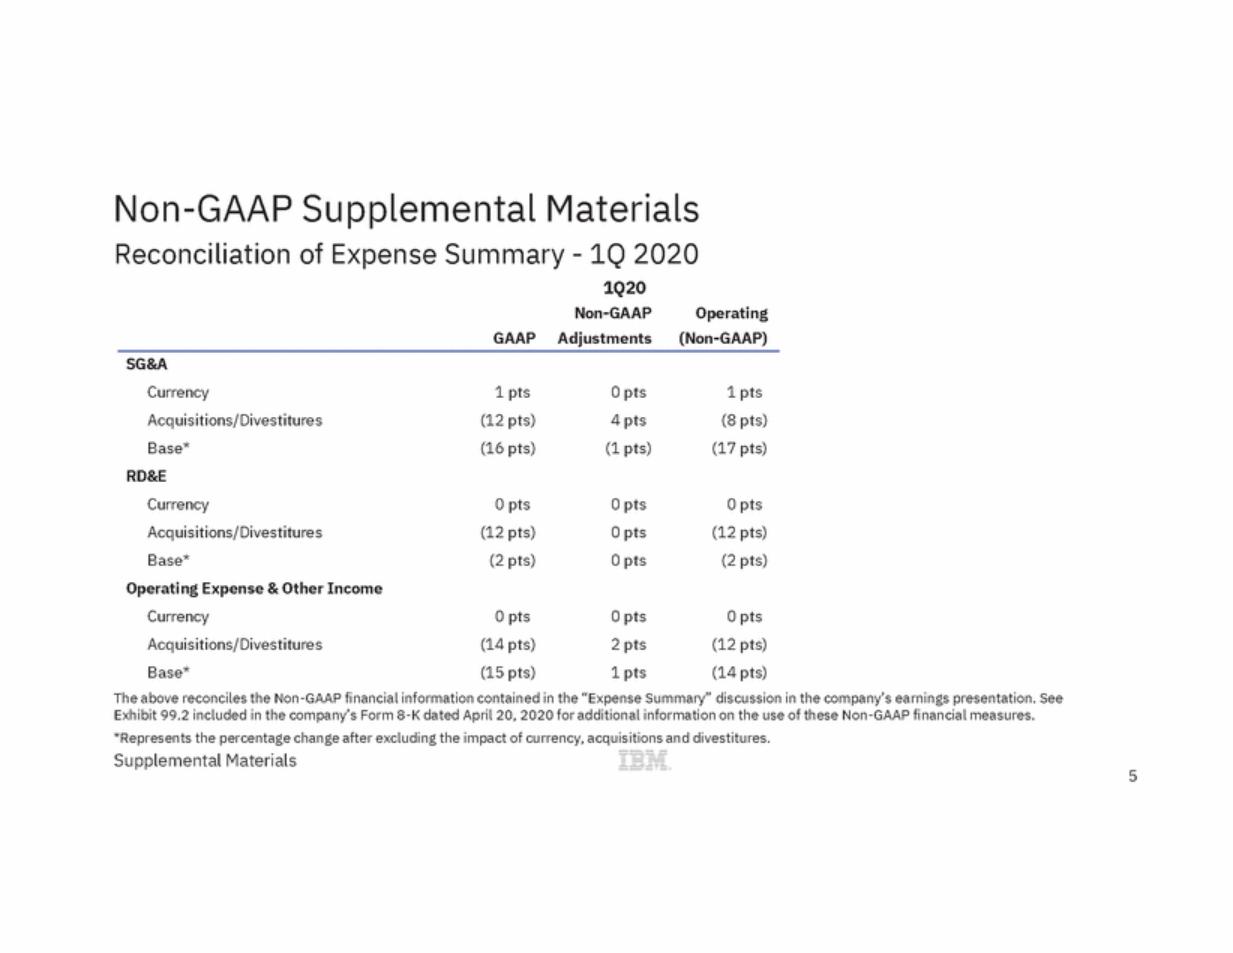
| Non-GAAP Supplemental Materials Reconciliation of Expense Summary - 1Q 2020 1Q20 Non-GAAP Adjustments Operating (Non-GAAP) GAAP SG&A Currency Acquisitions/Divestitures Base* RD&E Currency Acquisitions/Divestitures Base* Operating Expense & Other Income Currency Acquisitions/Divestitures Base* 1 pts (12 pts) (16 pts) 0 pts 4 pts (1 pts) 1 pts (8 pts) (17 pts) 0 pts (12 pts) (2 pts) 0 pts 0 pts 0 pts 0 pts (12 pts) (2 pts) 0 pts (14 pts) (15 pts) 0 pts 2 pts 1 pts 0 pts (12 pts) (14 pts) The above reconciles the Non-GAAP financial information contained in the “Expense Summary” discussion in the company’s earnings presentation. See Exhibit 99.2 included in the company’s Form 8-K dated April 20, 2020 for additional information on the use of these Non-GAAP financial measures. *Represents the percentage change after excluding the impact of currency, acquisitions and divestitures. Supplemental Materials 5 |
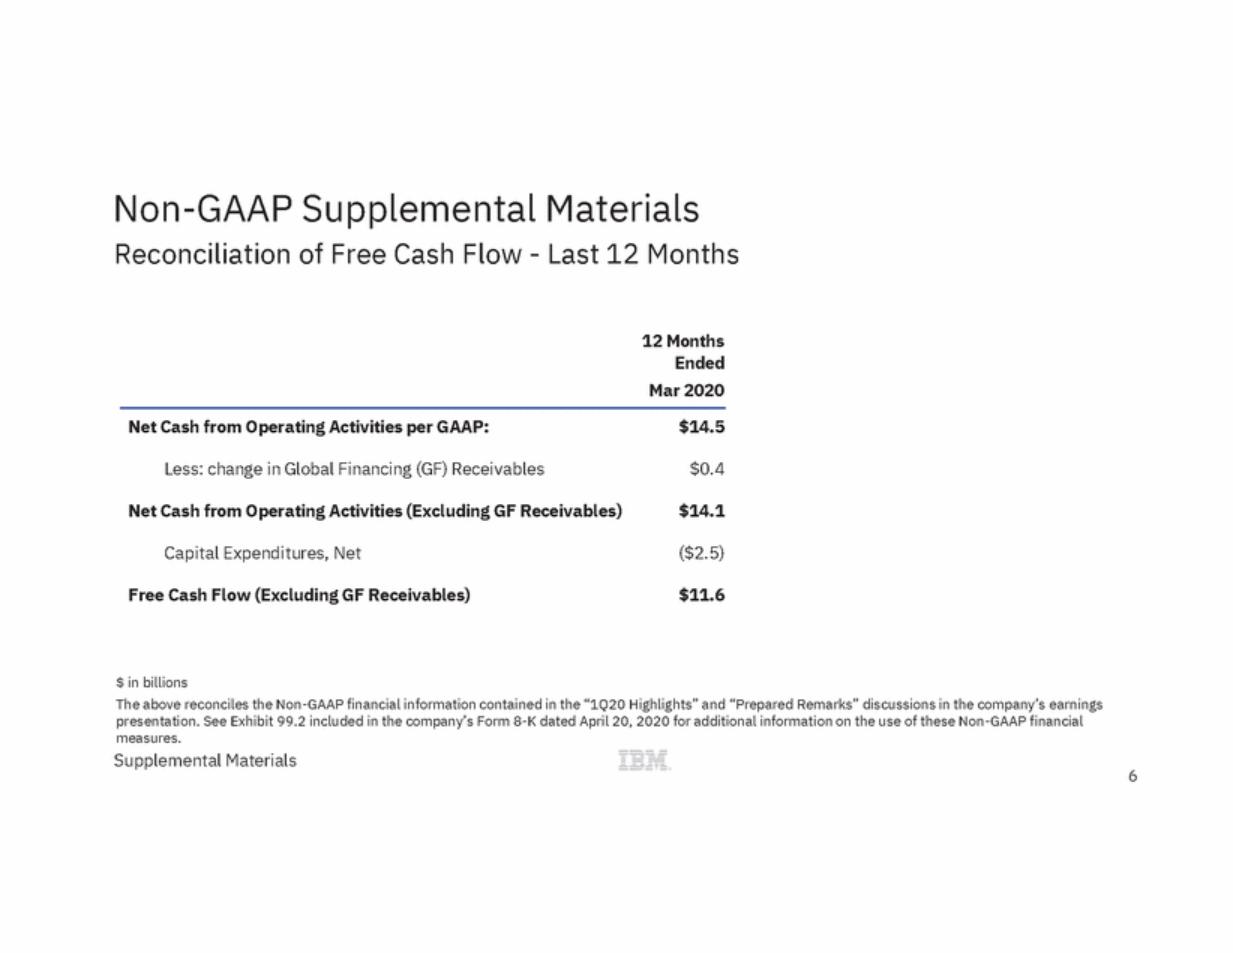
| Non-GAAP Supplemental Materials Reconciliation of Free Cash Flow - Last 12 Months 12 Months Ended Mar 2020 Net Cash from Operating Activities per GAAP: $14.5 Less: change in Global Financing (GF) Receivables $0.4 Net Cash from Operating Activities (Excluding GF Receivables) $14.1 Capital Expenditures, Net ($2.5) Free Cash Flow (Excluding GF Receivables) $11.6 $ in billions The above reconciles the Non-GAAP financial information contained in the “1Q20 Highlights” and “Prepared Remarks” discussions in the company’s earnings presentation. See Exhibit 99.2 included in the company’s Form 8-K dated April 20, 2020 for additional information on the use of these Non-GAAP financial measures. Supplemental Materials 6 |
| ibm.com/investor |