Attached files
| file | filename |
|---|---|
| EX-10.1 - EX-10.1 - Velocity Financial, Inc. | vel-ex101_436.htm |
| EX-32.2 - EX-32.2 - Velocity Financial, Inc. | vel-ex322_11.htm |
| EX-32.1 - EX-32.1 - Velocity Financial, Inc. | vel-ex321_10.htm |
| EX-31.2 - EX-31.2 - Velocity Financial, Inc. | vel-ex312_9.htm |
| EX-31.1 - EX-31.1 - Velocity Financial, Inc. | vel-ex311_8.htm |
| EX-23.1 - EX-23.1 - Velocity Financial, Inc. | vel-ex231_344.htm |
| EX-10.39(B) - EX-10.39(B) - Velocity Financial, Inc. | vel-ex1039b_373.htm |
| EX-10.2 - EX-10.2 - Velocity Financial, Inc. | vel-ex102_435.htm |
| EX-4.3 - EX-4.3 - Velocity Financial, Inc. | vel-ex43_374.htm |
UNITED STATES
SECURITIES AND EXCHANGE COMMISSION
Washington, D.C. 20549
FORM 10-K
(Mark One)
|
☒ |
ANNUAL REPORT PURSUANT TO SECTION 13 OR 15(d) OF THE SECURITIES EXCHANGE ACT OF 1934 |
For the fiscal year ended December 31, 2019
OR
|
☐ |
TRANSITION REPORT PURSUANT TO SECTION 13 OR 15(d) OF THE SECURITIES EXCHANGE ACT OF 1934 |
For the transition period from _____to _____
Commission File Number: 001-39183
Velocity Financial, Inc.
(Exact Name of Registrant as Specified in Its Charter)
|
Delaware |
|
|
|
45-0659719 |
|
(State or other jurisdiction of incorporation or organization) |
|
|
|
(I.R.S. Employer Identification No.) |
|
|
|
|
|
|
|
30699 Russell Ranch Road, Suite 295 Westlake Village, California |
|
|
|
91362 |
|
(Address of principal executive offices) |
|
|
|
(Zip Code) |
Registrant’s telephone number, including area code: (818) 532-3700
Securities registered pursuant to Section 12(b) of the Act:
|
Title of each class |
|
Trading Symbol |
|
Name of each exchange on which registered |
|
Common stock, par value $0.01 per share |
|
VEL |
|
The New York Stock Exchange |
Securities registered pursuant to Section 12(g) of the Act: None
Indicate by check mark if the registrant is a well-known seasoned issuer, as defined in Rule 405 of the Securities Act. Yes ☐ No ☒
Indicate by check mark if the registrant is not required to file reports pursuant to Section 13 or Section 15(d) of the Act. Yes ☐ No ☒
Indicate by check mark whether the registrant (1) has filed all reports required to be filed by Section 13 or 15(d) of the Securities Exchange Act of 1934 during the preceding 12 months (or for such shorter period that the registrant was required to file such reports), and (2) has been subject to such filing requirements for the past 90 days. Yes ☒ No ☐
Indicate by check mark whether the registrant has submitted electronically every Interactive Data File required to be submitted pursuant to Rule 405 of Regulation S-T (§ 232.405 of this chapter) during the preceding 12 months (or for such shorter period that the registrant was required to submit such files). Yes ☒ No ☐
Indicate by check mark whether the registrant is a large accelerated filer, an accelerated filer, a non-accelerated filer, a smaller reporting company, or an emerging growth company. See the definitions of “large accelerated filer,” “accelerated filer,” “smaller reporting company,” and "emerging growth company" in Rule 12b-2 of the Exchange Act.
|
Large accelerated filer |
|
☐ |
|
Accelerated filer |
|
☐ |
|
|
|
|
|
|
|
|
|
Non-accelerated filer |
|
☒ |
|
Smaller reporting company |
|
☐ |
|
|
|
|
|
|
|
|
|
|
|
|
|
Emerging growth company |
|
☐ |
If an emerging growth company, indicate by check mark if the registrant has elected not to use the extended transition period for complying with any new or revised financial accounting standards provided pursuant to Section 13(a) of the Exchange Act. ☐
Indicate by check mark whether the registrant is a shell company (as defined in Rule 12b-2 of the Exchange Act). Yes ☐ No ☒
The registrant was not a public company as of June 30, 2019, the last business day of its most recently completed second fiscal quarter, and therefore, cannot calculate the aggregate market value of its voting and non-voting common equity held by non-affiliates as of such date. The registrant’s common stock began trading on The New York Stock Exchange on January 17, 2020.
As of February 29, 2020, the registrant had 20,087,494 shares of common stock, par value $0.01 per share, outstanding.
|
|
|
Page |
|
|
1 |
|
|
Item 1. |
1 |
|
|
Item 1A. |
9 |
|
|
Item 1B. |
35 |
|
|
Item 2. |
35 |
|
|
Item 3. |
35 |
|
|
Item 4. |
35 |
|
|
|
36 |
|
|
Item 5. |
36 |
|
|
Item 6. |
38 |
|
|
Item 7. |
Management’s Discussion and Analysis of Financial Condition and Results of Operations |
40 |
|
Item 7A. |
67 |
|
|
Item 8. |
68 |
|
|
Item 9. |
Changes in and Disagreements With Accountants on Accounting and Financial Disclosure |
69 |
|
Item 9A. |
69 |
|
|
Item 9B. |
69 |
|
|
|
70 |
|
|
Item 10. |
70 |
|
|
Item 11. |
74 |
|
|
Item 12. |
Security Ownership of Certain Beneficial Owners and Management and Related Stockholder Matters |
88 |
|
Item 13. |
Certain Relationships and Related Transactions, and Director Independence |
90 |
|
Item 14. |
93 |
|
|
|
94 |
|
|
Item 15. |
94 |
|
|
Item 16. |
94 |
|
|
|
98 |
Unless otherwise stated or the context otherwise indicates, references to “we,” “us,” “our,” “the Company,” “Velocity” and similar references refer to Velocity Financial, Inc. and its consolidated subsidiaries.
SPECIAL NOTE REGARDING FORWARD-LOOKING STATEMENTS
This Annual Report on Form 10-K (this “Annual Report”) contains “forward-looking statements” within the meaning of Section 27A of the Securities Act of 1933, as amended (the “Securities Act”), and Section 21E of the Securities Exchange Act of 1934, as amended (the “Exchange Act”), which are subject to the “safe harbor” created by those sections. All statements (other than statements of historical facts) in this Annual Report regarding the prospects of the industry and our prospects, plans, financial position and business strategy may constitute forward-looking statements. In addition, forward-looking statements generally can be identified by the use of forward-looking terminology such as “may,” “should,” “expect,” “intend,” “will,” “estimate,” “anticipate,” “plan,” “believe,” “predict,” “potential” or “continue” or the negatives of these terms or variations of them or similar terminology. Although we believe that the expectations reflected in these forward-looking statements are reasonable, we cannot provide any assurance that these expectations will prove to be correct. Such statements reflect the current views of our management with respect to our operations, results of operations and future financial performance. The following factors are among those that may cause actual results to differ materially from the forward-looking statements:
|
|
• |
the outbreak of the recent coronavirus, COVID-19, or an outbreak of another highly infectious or contagious disease; |
|
|
• |
conditions in the real estate markets, the financial markets and the economy generally; |
|
|
• |
failure of a third-party servicer or the failure of our own internal servicing system to effectively service our portfolio of mortgage loans; |
|
|
• |
the high degree of risk involved in loans to small businesses, self-employed borrowers, properties in transition, certain portions of our investment real estate portfolio; |
|
|
• |
possibility of receiving inaccurate and/or incomplete information from potential borrowers, guarantors and loan sellers; |
|
|
• |
deficiencies in appraisal quality in the mortgage loan origination process; |
|
|
• |
competition in the market for loan origination and acquisition opportunities; |
|
|
• |
risks associated with our underwriting guidelines and our ability to change our underwriting guidelines; |
|
|
• |
loss of our key personnel or our inability to hire and retain qualified account executives; |
|
|
• |
any inability to manage future growth effectively or failure to develop, enhance and implement strategies to adapt to changing conditions in the real estate and capital markets; |
|
|
• |
operational risks, including the risk of cyberattacks, or disruption in the availability and/or functionality of our technology infrastructure and systems; |
|
|
• |
any inability of our borrowers to generate net income from operating the property that secures our loans; |
|
|
• |
costs or delays involved in the completion of a foreclosure or liquidation of the underlying property; |
|
|
• |
lender liability claims, requirements that we repurchase mortgage loans or indemnify investors, or allegations of violations of predatory lending laws; |
|
|
• |
economic downturns or natural disasters in geographies where our assets are concentrated; |
|
|
• |
environmental liabilities with respect to properties to which we take title; |
|
|
• |
inadequate insurance on collateral underlying mortgage loans and real estate securities; |
|
|
• |
use of incorrect, misleading or incomplete information in our analytical models and data; |
i
|
|
• |
any inability to successfully complete additional securitization transactions on attractive terms or at all; |
|
|
• |
the termination of one or more of our warehouse repurchase facilities; |
|
|
• |
interest rate fluctuations or mismatches between our loans and our borrowings; |
|
|
• |
legal or regulatory developments related to mortgage-related assets, securitizations or state licensing and operational requirements; |
|
|
• |
our ability to maintain our exclusion under the Investment Company Act of 1940, as amended; |
|
|
• |
fiscal policies or inaction at the U.S. federal government level, which may lead to federal government shutdowns or negative impacts on the U.S. economy; |
|
|
• |
cyber-attacks and our ability to comply with laws, regulations and market standards regarding the privacy, use, and security of customer information; |
|
|
• |
our ability to remediate the material weakness in our internal controls over financial reporting and to comply with requirements to maintain effective internal controls over financial reporting; |
|
|
• |
the influence of certain of our large stockholders over us; |
|
|
• |
adverse legislative or regulatory changes; and |
|
|
• |
the other factors discussed in “Risk Factors.” |
You should not rely upon forward-looking statements as predictions of future events. The forward-looking statements in this Annual Report are based on our beliefs, assumptions and expectations of future performance, taking into account the information currently available to us. These statements are only predictions based upon our current expectations and projections about future events. There are important factors, including those described in the section titled “Risk Factors” and elsewhere in this Annual Report, that could cause our actual results, level of activity, performance or achievements to differ materially from the results, level of activity, performance or achievements expressed or implied by the forward-looking statements. Other sections of this Annual Report may include additional factors that could adversely impact our business and financial performance. Moreover, we operate in a very competitive and rapidly changing environment. New risks emerge from time to time and it is not possible for our management to predict all risks, nor can we assess the impact of all factors on our business or the extent to which any factor, or combination of factors, may cause actual results to differ materially from those contained in any forward-looking statements we may make in this Annual Report. Before investing in our common stock, investors should be aware that the occurrence of the events described under the caption “Risk Factors” and elsewhere in this Annual Report could have a material adverse effect on our business, results of operations and financial condition.
Although we believe that the expectations reflected in the forward-looking statements are reasonable, we cannot guarantee that the future results, levels of activity, performance and events and circumstances reflected in the forward-looking statements will be achieved or occur. For a more detailed discussion of the risks, uncertainties and other factors that could cause actual results to differ, please refer to the “Risk Factors” in this Annual Report, as such risk factors may be updated from time to time in our periodic filings with the SEC. Our periodic filings are accessible on the SEC’s website at www.sec.gov.
The forward-looking statements made in this Annual Report relate only to events as of the date on which the statements are made. Except as required by law, we undertake no obligation to update publicly any forward-looking statements for any reason after the date of this Annual Report to conform these statements to actual results or to changes in our expectations.
In addition, statements that “we believe” and similar statements reflect our beliefs and opinions on the relevant subject. These statements are based upon information available to us as of the date of this Annual Report, and while we believe such information forms a reasonable basis for such statements, such information may be limited or incomplete, and our statements should not be read to indicate that we have conducted an exhaustive inquiry into, or
ii
review of, all potentially available relevant information. These statements are inherently uncertain and investors are cautioned not to unduly rely upon these statements.
Channels for Disclosure of Information
Investors and others should note that we may announce material information to the public through filings with the SEC, our website (www.velfinance.com), press releases, public conference calls and public webcasts. We use these channels to communicate with the public about the Company, our products, our services and other matters. We encourage our investors, the media and others to review the information disclosed through such channels as such information could be deemed to be material information. The information on such channels, including on our website, is not incorporated by reference in this Annual Report and shall not be deemed to be incorporated by reference into any other filing under the Securities Act or the Exchange Act, except as expressly set forth by specific reference in such a filing. Please note that this list of disclosure channels may be updated from time to time.
The following filings are available through our investor relations website (www.velfinance.com) as soon as reasonably practicable after we file them with, or furnish them to, the Securities and Exchange Commission (“SEC”): Annual Report on Form 10-K, Quarterly Reports on Form 10-Q, current reports on Form 8-K, and our Proxy Statement for our annual meeting of stockholders, as applicable. These filings are also available for download free of charge through a link on our investor relations website. The SEC also maintains an Internet website at www.sec.gov that contains reports, proxy statements and other information about issuers, like us, that file electronically with the SEC. Our internet website and the information contained therein or connected to or linked from our internet web site are not incorporated information and do not constitute a part of this Annual Report thereto.
iii
Our Company
We are a vertically integrated real estate finance company founded in 2004. We primarily originate and manage investor loans secured by 1-4 unit residential rental and small commercial properties, which we refer to collectively as investor real estate loans. We originate loans nationwide across our extensive network of independent mortgage brokers which we have built and refined over the 15 years since our inception. Our objective is to be the preferred and one of the most recognized brands in our core market, particularly within our network of mortgage brokers.
We operate in a large and highly fragmented market with substantial demand for financing and limited supply of institutional financing alternatives. We have developed the highly-specialized skill set required to effectively compete in this market, which we believe has afforded us a durable business model capable of generating attractive risk-adjusted returns for our stockholders throughout various business cycles. We offer competitive pricing to our borrowers by pursuing low-cost financing strategies and by driving front-end process efficiencies through customized technology designed to control the cost of originating a loan. Furthermore, by originating loans through our efficient and scalable network of approved mortgage brokers, we are able to maintain a wide geographical presence and nimble operating infrastructure capable of reacting quickly to changing market environments.
Our growth strategy is predicated on continuing to serve and build loyalty within our network of mortgage brokers, while also expanding our network with new mortgage brokers through targeted marketing and improved brand awareness. We believe our reputation and 15-year history within our core market position us well to capture future growth opportunities.
We make loans for business purposes only, which we believe limits our exposure to the regulatory constraints of consumer lending. We do not make consumer loans or lend on raw land and we generally avoid special-purpose properties such as churches, assisted-living facilities and gas stations.
On January 16, 2020, we converted from a limited liability company to a corporation incorporated under the law of the State of Delaware by filing a certificate of conversion with the Secretary of State of the State of Delaware and changed our name from Velocity Financial, LLC to Velocity Financial, Inc.
Update related to COVID-19: The outbreak of the COVID-19 coronavirus has caused significant disruption in business activity and the financial markets both globally and in the United States. During the year ended December 31, 2019, our core business consisted of loan origination, supplemented by opportunistic acquisitions of portfolios of loans that met our investment criteria. During this economic crisis, we will consider the benefits of originating commercial mortgage loans along with opportunistically acquiring commercial mortgage loans that comply with our credit guidelines. If we are able to prudently originate or acquire mortgage loans, they will be added to our held for investment loan portfolio and supplement our current earnings profile generated by our $1.9 billion of portfolio loans, which are primarily fixed rate loans financed with fixed rate securitizations. We will continue to evaluate our business strategy in light of rapidly changing market conditions.
Our Competitive Advantages
We believe that the following competitive advantages enhance our ability to execute our business strategy and position us well for continued growth:
Established Franchise with Strong Brand Recognition
We believe our reputation and deep history within the real estate lending community position us as a preferred lender for mortgage brokers. We have been originating and acquiring loans in our core market since our inception in 2004, making us a recognizable brand with a proven ability to execute. Additionally, we have successfully executed twelve securitizations of our investor real estate loans, raising over $2.5 billion in gross debt proceeds between 2011
1
and the year ended December 31,2019. In February 2020, we executed our thirteenth securitization for $248.7 million in gross proceeds. We have a keen understanding of this securitization market, including complicated structural issues, investor expectations and rating agency requirements. We believe we have a strong reputation with investors in the securitization market, which enables us to maintain efficient access to debt capital that ultimately improves our ability to offer competitive pricing to our borrowers.
Customized Technology and Proprietary Data Analytics
We have invested in and customized automated systems to support our use of data analytics which drives our lending process. We believe the investor real estate lending market requires a highly-specialized skill set and infrastructure. To effectively compete and execute on a sustainable long-term business strategy, lenders must control the cost to originate and manage loans without sacrificing credit quality. We believe our investment in technology and use of data analytics helps us achieve these critical objectives and positions our business for sustainable, long-term growth.
We apply the same asset-driven underwriting process to all of the loans in our portfolio, regardless of whether we originate or acquire these loans. Our credit and underwriting philosophy encompasses individual borrower and property due diligence, taking into consideration several factors. Our access to 15 years of proprietary data allows us to perform analytics that inform our lending decisions efficiently and effectively, which we believe is a strong competitive advantage.
Large In-Place Portfolio with Attractive, Long-Term Financing
We believe our in-place portfolio provides a significant and stable income stream for us to invest in future earnings growth. The majority of our loans are structured to provide for interest rate protection, by floating after an initial fixed-rate period, subject to a floor equal to the starting fixed rate. The loans are mainly financed with long-term fixed-rate debt, resulting in a spread that could increase over time, but not decrease. As a result, our in-place portfolio generally benefits from rising interest rates. Excluding the interest expense paid on our corporate debt, which we partially repaid with a portion of the net proceeds from our January 2020 initial public offering (our “IPO”), we generated $73.6 million in portfolio related net interest income, representing a 4.13% portfolio related net interest margin, during the year ended December 31, 2019. Including the interest expense paid on our corporate debt, we generated $59.0 million in total net interest income, representing a 3.31% net interest margin, during the year ended December 31, 2019.
Our In-House Asset Management Results in Successful Loss Mitigation
Direct management of individual loans is critical to avoiding or minimizing credit losses and we work with our third-party primary servicers with whom we have developed strong relationships to emphasize disciplined loan monitoring and early contact with delinquent borrowers to resolve delinquencies. We have a dedicated asset management team that, augmented with primary servicing from our loan servicers, focuses exclusively on resolving delinquent loans. Our hands-on approach enables us to generally preserve the value of our assets and helps us to minimize losses. We believe this expertise, combined with our outsourced servicing relationships, gives us a distinct competitive advantage.
Our Experienced Management Team
Led by co-founder and Chief Executive Officer Christopher Farrar, our management team averages more than 25 years of experience in the financial services and real estate lending industries, including extensive experience in commercial and residential lending, structured finance and capital markets. We have successfully navigated both positive and negative economic cycles and retained our core team of experienced professionals in appraisal, underwriting, processing and production, while bolstering our finance and asset management team with professionals possessing extensive experience in financial reporting and real estate management. We believe our in-depth knowledge of our core market provides a distinct competitive advantage.
2
The market for investor real estate loans is large and highly fragmented. We have built a dedicated and scalable national lending platform focused specifically on serving this market and believe our capabilities position us well to maintain our reputation as a preferred lender in this market. Our growth strategy is predicated on further penetrating our existing network of mortgage brokers and expanding our network with new mortgage brokers. A key element of our implementation of this strategy is the growth and development of our team of account executives, as well as targeted marketing initiatives. We will continue to supplement the extension of our broker network with the development of new products to support the evolving needs of borrowers in our core market.
Further Penetrate Our Existing Mortgage Broker Network
We strive to be the preferred lender within our network of approved mortgage brokers. We have developed a strong reputation in the market for high quality execution and timely closing, which we believe are the most important qualities our mortgage brokers value in selecting a lender. There is significant opportunity for us to further penetrate the more than 3,100 mortgage brokers with whom we have done business over the last five years. Approximately 72% of loan originators originated five or fewer loans with us during the year ended December 31, 2019. We believe this presents a compelling opportunity for us to capture incremental volume from our existing broker network.
Expand Our Network with New Mortgage Brokers
We believe that our targeted sales effort, combined with consistent high-quality execution, positions us well to continue adding to the network of mortgage brokers that rely on us to serve their borrower clients.
During the year ended December 31, 2019, we funded 3,031 loans sourced by approximately 1200 different mortgage brokers. We believe represents a small portion of the mortgage originators in the United States, which consisted of over 590,000 state-licensed mortgage originators as of December 31, 2018, according to the Nationwide Multistate Licensing System. The size of the mortgage broker market presents an attractive opportunity for us to capture significant growth with very small increases in the share of mortgage brokers that recognize our platform capabilities and utilize us as a preferred lender in our core market.
Develop New Products
Our primary product is a 30-year amortizing term loan with a three-year fixed-rate period which floats at a spread to the prime rate thereafter subject to a floor equal to the starting fixed rate. These loans comprised 33.2% of our loan originations during the year ended December 31, 2019. This product is used by borrowers to finance stabilized long-term real estate investments. We believe this product has strong receptivity in our market, as evidenced by our success in growing loan originations over time. Since our inception, we have continued to expand our product offering in response to developing market opportunities and the evolving financing needs of our broker network. For example, in 2013, in response to the increased demand for rental properties, we moved aggressively into the market for 1-4 unit residential rental loans, which comprised 46.6% of our held for investment loan portfolio as of December 31, 2019.
In March 2017, we began originating short-term, interest-only loans to be used for acquiring, repositioning or improving the quality of 1-4 unit residential investment properties. This product typically serves as an interim solution for borrowers and/or properties that do not meet the investment criteria of our primary 30-year product. The short-term, interest-only loan allows borrowers to address any qualifying issues with their credit and/or the underlying property before bridging into a longer-term loan. In June 2018, we added a second short-term, interest-only loan product which allows borrower draws for rehabbing residential rental property. Historically, we have aggregated and sold these short-term, interest-only loans at a premium to par to institutional investors, which has generated attractive income for us with limited capital while also allowing us to establish an underwriting track record and monitor the performance of these loans. Given our increased experience providing these loans, we are currently evaluating long-term financing alternatives for these loans and may elect to retain them in the future to be more consistent with our broader investment strategy of holding loans in our portfolio and earning a spread.
3
In June 2019, we began originating a 30-year fixed-rate amortizing term loan to complement our primary product as we believe there is meaningful demand for fixed-rate loans within our core market. More importantly, these loans provide our brokers with an alternative to the primary product enabling them to meet the specific needs of their customers. As of December 31, 2019, these loans represented 17.4% of our loans held for investment, as measured by unpaid principal balance, or UPB.
Opportunistically Acquire Portfolios
We continually assess opportunities to acquire portfolios of loans that meet our investment criteria. Over the past 15 years, our management team has developed relationships with many financial institutions and intermediaries that have been active investor real estate loan originators or investors. We believe that our experience, reputation, and ability to effectively manage these loans makes us an attractive buyer for this asset class, and we are regularly asked to review pools of loans available for purchase. In our experience, portfolio acquisition opportunities have generally been more attractive and plentiful during market conditions when origination opportunities are less favorable. Accordingly, we believe our acquisition strategy not only augments our origination business, but also provides a counter-cyclical benefit to our overall business. In light of recent market disruptions caused by COVID-19, we have begun to increase our focus on this growth strategy.
Since 2008, we have reviewed over $10.3 billion of investor real estate loans, bid on approximately $523.8 million of loans that fell within our underwriting guidelines, and, through this process, selectively acquired 295 loans with total UPB of $181.0 million.
Our Portfolio
Loans Held for Investment
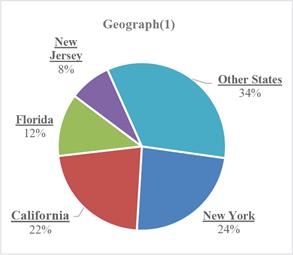
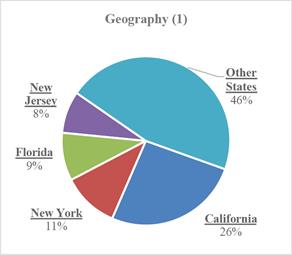
Our typical investor real estate loan is secured by a first lien on the underlying property with the added protection of a personal guarantee and, based on the loans in our portfolio as of December 31, 2019, has an average balance of approximately $327,000. As of December 31, 2019, our portfolio of loans held for investment totaled $1.8 billion of UPB on properties in 45 states and the District of Columbia. Of the 5,640 loans held for investment as of December 31, 2019, 97.8% of the portfolio, as measured by UPB, was attributable to our loan origination business, while the remaining 2.2% of the portfolio, or 88 loans, totaling $40.3 million in UPB, were related to acquisitions. During the years ended December 31, 2019 and 2018, we originated 1,881 and 1,708 loans to be held for investment totaling $673.9 million and $587.2 million, respectively.
Our investor real estate loans held for investment have longer-term maturities compared to other commercial real estate loans. As of December 31, 2019, 99.9% of our loans held for investment, as measured by UPB, were fully-amortizing. The principal amount of a fully-amortizing loan is repaid ratably over the term of the loan, as compared to a balloon loan where all, or a substantial portion of, the original loan amount is due in a single payment at the maturity date. We believe that fully-amortizing loans face a lower risk of default than balloon loans, as the final payment due under the balloon loan may require the borrower to refinance or sell the property.
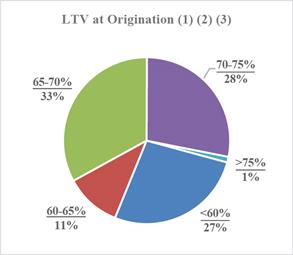
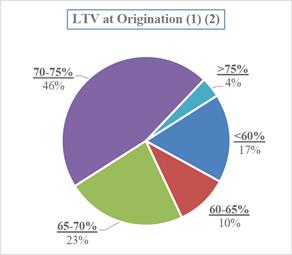
We target investor real estate loans with loan-to-value ratios, or LTVs, between 60% and 75% at origination as we believe that borrower equity of 25% to 40% provides significant protection against credit losses. As of December 31, 2019, our loans held for investment had a weighted average LTV at origination of 65.4%. Additionally, as of December 31, 2019, borrowers personally guaranteed 99.9% of the loans in our held for investment portfolio and had a weighted average credit score at origination of 706, excluding the 1.0% of loans for which a credit score is not available.
4
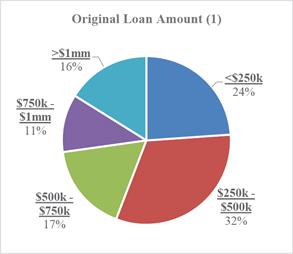
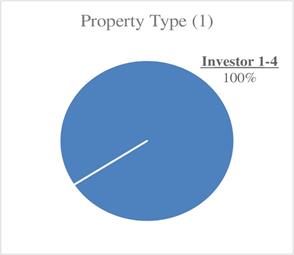
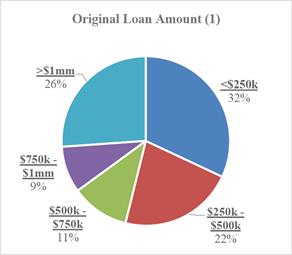
The following charts illustrate the composition of our loans held for investment as of December 31, 2019:
|
|
|

|
|
|
|
(*) |
Percentages may not sum to 100% due to rounding. |
|
|
(1) |
Portfolio stratifications based on unpaid principal balance for loans held for investment as of December 31, 2019. |
|
|
(2) |
Represents LTV at origination for population of loans held for investment as of December 31, 2019. In instances where LTV at origination is not available for an acquired loan, the LTV reflects our best estimate of value at time of acquisition. |
|
|
(3) |
The approximately 1% portion of our loans held for investment with an LTV greater than 75% consists primarily of acquired loans. |
We typically do not lend on any property located in a city with a population less than 25,000 and outside a 25-mile radius of a city with a population in excess of 100,000. We generally prefer to lend in larger metropolitan statistical areas.
5
Although our primary focus is long-term maturity real estate loans, we are continually assessing market developments for attractive opportunities in which we can leverage our experience, network and personnel. In March 2017, we began originating short-term, interest-only loans to be used for acquiring, repositioning or improving the quality of 1-4 unit residential investment properties. This product typically serves as an interim solution for borrowers and/or properties that do not meet the investment criteria of our primary 30-year product. The short-term, interest-only loan allows borrowers to address any qualifying issues with their credit and/or the underlying property before bridging into a longer-term loan. In June 2018, we added a second short-term, interest-only loan product which allows borrower draws for rehabbing residential rental property. Historically, we have aggregated and sold these short-term, interest-only loans at a premium to par to institutional investors, which has generated attractive income for us with limited capital while also allowing us to establish an underwriting track record and monitor the performance of these loans. Given our increased experience providing these loans, we are currently evaluating long-term financing alternatives for these loans and may elect to retain them in the future to be more consistent with our broader investment strategy of holding loans in our portfolio and earning a spread.
As of December 31, 2019, our portfolio of loans held for sale consisted of 733 loans with an aggregate UPB of $216.1 million and carried a weighted average original loan term of 17.7 months and a weighted average coupon of 10.0%. As of December 31, 2019, 100% of our held for sale portfolio, as measured by UPB, was attributable to our loan origination business.
In line with our overall investment strategy, we target loans held for sale with LTVs between 60% and 75% at origination as we believe that borrower equity of 25% to 40% provides significant protection against credit losses. As of December 31, 2019, our loans held for sale had a weighted average LTV at origination of 68.0%. Additionally, as of December 31, 2019, borrowers personally guaranteed 100% of the loans in our held for sale portfolio and had a weighted average credit score at origination of 651.
6
The following charts illustrate the composition of our loans held for sale as of December 31, 2019:
|
|
|
|
|
|
|
(*) |
Percentages may not sum to 100% due to rounding. |
|
|
(1) |
Portfolio stratifications based on unpaid principal balance for loans held for sale as of December 31, 2019. |
|
|
(2) |
Represents LTV at origination for population of loans held for sale as of December 31, 2019. |
Our Financing Strategy
We typically finance our new loan originations using warehouse repurchase facilities. Once we have originated between approximately $175 million and $400 million in new loans, we securitize the loans through a real estate mortgage investment conduit, or REMIC, structure and issue the bonds to third parties through individual trust vehicles. All of our securitizations are issued as private placements pursuant to Rule 144A under the Securities Act and utilize a REMIC structure except for the 2011 transaction which was not a REMIC and issued one class of bonds treated as debt for tax purposes. These REMIC transactions create significant U.S. GAAP versus tax differences as the U.S. GAAP treatment is a debt financing, however the IRS requires sale treatment and requires us to recognize taxable income to the extent the fair market value exceeds our cost basis, the payment of which creates a deferred tax asset. We are the sole beneficial interest holder of each of the trusts, through our wholly-owned subsidiaries. Proceeds from the issuance of the securities are then used to pay down the balances on our warehouse repurchase facilities. As of December 31, 2019, we had successfully executed twelve securitizations of our investor
7
real estate loans, raising over $2.5 billion in gross debt proceeds. In February 2020, we executed our thirteenth securitization for $248.7 million in gross proceeds. See “Item 7. Management’s Discussion and Analysis of Financial Condition and Results of Operations — Liquidity and Capital Resources” for additional information about our warehouse repurchase facilities and securitizations.
Depending on market conditions, we may increase leverage on our investments with an amount of debt we deem prudent, subject to applicable risk retention rules. Our decision to use leverage to finance our assets will be based on our assessment of a variety of factors, including, among others, the anticipated liquidity and price volatility of the assets in our investment portfolio, the potential for losses and extension risk in our portfolio, the availability of credit at favorable prices, the credit quality of our assets and the outlook for our borrowing costs relative to the interest income earned on our assets and, where applicable, regulatory requirements with respect to securitizations.
Going forward, our financing sources may include borrowings in the form of additional bank credit facilities (including term loans and revolving facilities), additional warehouse repurchase facilities, structured financing arrangements, future securitizations and public and private equity and debt issuances, in addition to transaction or asset-specific funding arrangements. We intend to use leverage primarily to finance our portfolio and not for speculating on changes in the level of interest rates. We are not required to employ specific debt levels, and we believe the appropriate leverage for the particular assets we may finance depends on the factors discussed above.
We expect to continue financing our loan portfolio with equity and our financing arrangements, including warehouse lines for short-term financing and securitizations for long-term financing. We believe using securitizations to finance our investor real estate loans fits well with our strategy of holding interest-earning assets over the long-term to earn a spread. This type of financing structure more closely matches the asset duration with the duration of the financing.
Competition
The business of financing investor real estate loans is competitive. We compete with specialty finance companies, regional and community banks and thrifts, public and private entities, institutional investors, mortgage bankers, insurance companies, investment banking firms, and other financial institutions, and we expect that additional competitors may be organized or otherwise enter our core market in the future. We believe we compete favorably through diversified borrower access driven by our extensive network of mortgage brokers and by emphasizing a high level of real estate and financial expertise, customer service, and flexibility in structuring transactions, as well as by attracting and retaining experienced managerial and marketing personnel. However, we may not be able to achieve our business goals or expectations due to the competitive risks that we face. Some of our competitors may be better positioned to market their services and financing programs because of their ability to offer more favorable rates and terms and other services. Such rates may be impacted by the competitor’s size, cost of funds, and access to funding sources that are not available to us, such as GSE financing programs for 1-4 unit residential rental loans and certain multifamily loans. For additional information concerning these competitive risks, see “Item 1A. Risk Factors—We operate in a competitive market for loan origination and acquisition opportunities and competition may limit our ability to originate and acquire loans, which could adversely affect our ability to execute our business strategy.”
Government Regulation
Certain states in which we conduct business require approval, registration or licensing. We hold the following licenses in order to originate and acquire investor real estate loans: a Finance Lenders License issued by the California Department of Business Oversight in California, a Mortgage Lender Servicer License in Florida issued by the Florida Office of Financial Regulation, and a Mortgage Broker License in Nevada issued by the Nevada Department of Business and Industry Division of Mortgage Lending. In the other states where we conduct business, licensing is either not required or we operate under state-specific exemptions. Typically, the mortgage broker that originates the loan that we make, fund or acquire is licensed or exempt from licensing in the state where the loan is made. We also hold a federal Housing Administration, or FHA, Title II approval from the Department of Housing and Urban Development, which permits us to make certain government-insured loans.
8
We may be required to obtain licenses to originate investor real estate loans in the various additional jurisdictions in which we conduct our business or to acquire investor real estate loans. If we are required to obtain additional licenses to originate or acquire investor real estate loans, the process may be costly and could take several months. There is no assurance that we will obtain the licenses required or that we will not experience significant delays in seeking these licenses. Furthermore, we may be subject to various reporting and other requirements to maintain these licenses, and there is no assurance that we may satisfy those requirements. Our failure to maintain or obtain licenses may restrict our investment options and could harm our business. We intend to be licensed in those states where licenses are required for us to acquire investor real estate loans as soon as reasonably practicable.
Employees
As of December 31, 2019, we had 262 employees. None of our employees are represented by a labor union.
Our Corporate Information and History
Velocity Commercial Capital, LLC, a California limited liability company (“VCC”), was formed in 2004. In 2012, we were formed as a limited liability company, organized under the law of the State of Delaware and named Velocity Financial, LLC for the purpose of acquiring all membership units in VCC. On January 16, 2020, we converted from a limited liability company to a corporation incorporated under the law of the State of Delaware by filing a certificate of conversion with the Secretary of State of the State of Delaware and changed our name to Velocity Financial, Inc.
On January 22, 2020, we completed the initial public offering (“IPO”) of our common stock, par value $0.01 per share (our “common stock”). The net proceeds received from the sale of our common stock in the IPO was $100.7 million. Shares of our common stock trade on the New York Stock Exchange under the symbol “VEL.”
Our offices are located at 30699 Russell Ranch Road, Suite 295, Westlake Village, California 91362, and the telephone number of our offices is (818) 532-3700. Our internet address is www.velfinance.com. Our internet website and the information contained therein or connected to or linked from our internet web site are not incorporated information and do not constitute a part of this Annual Report or any amendment thereto.
An investment in shares of our common stock involves a number of risks. Before making an investment decision, you should carefully consider the following risk factors, together with the other information contained in this prospectus. If any of the risks discussed in this prospectus occurs, our business, financial condition, liquidity and results of operations could be materially and adversely affected, the market price of our common stock could decline significantly, and you could lose all or a part of your investment.
Risks Related to Our Business
The outbreak of the recent coronavirus, COVID-19, or an outbreak of another highly infectious or contagious disease, could adversely affect our business, financial condition, results of operations and cash flow, and limit our ability to obtain additional financing.
The spread of a highly infectious or contagious disease, such as COVID-19, could cause severe disruptions in the U.S. economy, which could in turn disrupt the business, activities, and operations of our customers, as well as our business and operations. The coronavirus outbreak has caused significant disruption in business activity and the financial markets both globally and in the United States. In March 2020, the Federal Reserve lowered the target range for the federal funds rate to a range from 0 to 0.25 percent, citing concerns about the impact of COVID-19 on markets and stress in the energy sector. Many states and localities have imposed limitations on commercial activity and public gatherings and events, as well as moratoria on evictions. Concern about the spread of COVID-19 has caused and is likely to continue to cause quarantines, business shutdowns, reduction in business activity and financial transactions, labor shortages, supply chain interruptions, increased unemployment and commercial property vacancy rates, reduced ability and incentives for some property owners to make mortgage payments, and overall economic and financial market instability, all of which may result a decrease in our business and cause our
9
customers to be unable to make scheduled loan payments. Therefore, to the extent that economic activity, business conditions and conditions in the financial markets in which we operate remain poor or deteriorate further, our delinquencies, foreclosures and credit losses may materially increase. Such conditions are likely to exacerbate many of the risks described elsewhere in this “—Risks Related to Our Business” section. Unfavorable economic conditions may also make it more difficult for us to maintain loan origination volume and to obtain additional financing. Furthermore, such conditions have and may continue to cause the collateral values associated with our existing loans to decline. In addition, a prolonged period of very low interest rates could reduce our net interest income and have a material adverse impact on our cash flows and the market value of our investments. See “—Interest rate fluctuations could negatively impact our net interest income, cash flows and the market value of our investments” for more information.
Although we maintain contingency plans for pandemic outbreaks, and have taken certain steps described under “Item 7. Management’s Discussion and Analysis of Financial Condition—Recent Developments—Strategies to Address Uncertainties Caused by COVID-19” to respond to the outbreak of COVID-19, the continued spread of this disease, or a significant outbreak of another contagious disease, could negatively impact the availability of key personnel necessary to conduct our business, and the business and operations of our third-party service providers who perform critical services for our business. If COVID-19, or another highly infectious or contagious disease is not successfully contained, we could experience a material adverse effect on our business, financial condition, results of operations and cash flow. Among the factors outside our control that are likely to affect the impact the COVID-19 pandemic will ultimately have on our business are:
|
|
• |
the pandemic’s course and severity; |
|
|
• |
the direct and indirect results of the pandemic, such as recessionary economic trends, including with respect to employment, wages and benefits and commercial activity; |
|
|
• |
political, legal and regulatory actions and policies in response to the pandemic, including the effects of restrictions on commerce or other public activities, moratoria and other suspensions of evictions or rent and related obligations; |
|
|
• |
the timing, magnitude and effect of public spending, directly or through subsidies, its direct and indirect effects on commercial activity and incentives of employers and individuals to resume or increase employment, wages and benefits and commercial activity; |
|
|
• |
the timing and availability of direct and indirect governmental support for various financial assets, including mortgage loans, and possible related distortions in market values and liquidity for such assets whose markets have or are assumed to have government support versus possibly similar assets that do not; |
|
|
• |
potential longer-term effects of increased government spending on the interest rate environment and borrowing costs for non-governmental parties; |
|
|
• |
the ability of our employees and our third-party vendors to work effectively during the course of the pandemic; |
|
|
• |
potential longer-term shifts toward telecommuting and telecommerce; |
|
|
• |
geographic variation in the severity and duration of the COVID-19 pandemic, including in states such as New York, California, New Jersey and Florida where high percentages of the properties underlying the Company’s mortgage loans are located; and |
|
|
• |
volatility in supply and demand in the market for mortgage loans, which recently have been and could continue to be subject to sharp and sudden variations. |
10
We are continuing to monitor the spread of COVID-19 and related risks, although the rapid development and fluidity of situation precludes any prediction as to its ultimate impact on us. However, if the spread continues, such impact could grow and our business, financial condition, results of operations and cash flows could be materially adversely affected.
We are dependent upon the success of the investor real estate market and conditions that negatively impact this market may reduce demand for our loans and adversely impact our business, results of operations and financial condition.
Our borrowers are primarily owners of residential rental and small commercial properties. Accordingly, the success of our business is closely tied to the overall success of the investors and small business owners in that market. Various changes in real estate conditions may impact this market. Any negative trends in such real estate conditions may reduce demand for our products and services and, as a result, adversely affect our results of operations. These conditions include:
|
|
• |
oversupply of, or a reduction in demand for, residential rental and small commercial properties; |
|
|
• |
a change in policy or circumstances that may result in a significant number of potential residents of multifamily properties deciding to purchase homes instead of renting; |
|
|
• |
zoning, rent control or stabilization laws, or other laws regulating multifamily housing, which could affect the profitability of residential rental developments; |
|
|
• |
the inability of residents and tenants to pay rent; |
|
|
• |
changes in the tax code related to investment real estate; |
|
|
• |
increased operating costs, including increased real property taxes, maintenance, insurance, and utilities costs; and |
|
|
• |
potential liability under environmental and other laws. |
Any or all of these factors could negatively impact the investor real estate market and, as a result, reduce the demand for our loans or the terms on which we are able to make our loans and, as a result materially and adversely affect us.
Difficult conditions in the real estate markets, the financial markets and the economy generally may adversely impact our business, results of operations and financial condition.
Our results of operations may be materially affected by conditions in the real estate markets, the financial markets and the economy generally. These conditions include changes in short-term and long- term interest rates, inflation and deflation, fluctuations in the real estate and debt capital markets and developments in national and local economies, unemployment rates, commercial property vacancy rates, and rental rates. Any deterioration of real estate fundamentals generally, and in the United States in particular, and changes in general economic conditions could decrease the demand for our loans, negatively impact the value of the real estate collateral securing our loans, increase the default risk applicable to borrowers, and make it relatively more difficult for us to generate attractive risk-adjusted returns.
We also are significantly affected by the fiscal, monetary, and budgetary policies of the U.S. government and its agencies. We are particularly affected by the policies of the Board of Governors of the Federal Reserve System, which we refer to as the Federal Reserve, which regulates the supply of money and credit in the United States. The Federal Reserve’s policies affect interest rates, which can have a significant impact on the demand for investor real estate loans. Significant fluctuations in interest rates as well as protracted periods of increases or decreases in interest rates could adversely affect the operation and income of the investment properties securing our loans, as well as the demand from investors for investor real estate loans in the secondary market. In particular, higher interest rates often decrease the number of loans originated. An increase in interest rates could cause refinancing of existing loans to become less attractive and qualifying for a loan to become more difficult.
11
We cannot predict the degree to which economic conditions generally, and the conditions for real estate debt investing in particular, will improve or decline. Any stagnation in or deterioration of the real estate markets may limit our ability to originate or acquire loans on attractive terms or cause us to experience losses related to our assets. Declines in the market values of our investments may adversely affect our results of operations and credit availability.
We operate in a competitive market for loan origination and acquisition opportunities and competition may limit our ability to originate and acquire loans, which could adversely affect our ability to execute our business strategy.
We operate in a competitive market for investment and loan origination and acquisition opportunities. Our profitability depends, in large part, on our ability to acquire our target assets at attractive prices and originate loans that allow us to generate compelling net interest margins. In acquiring our target assets or originating loans, we will compete with a variety of institutional investors, including REITs, specialty finance companies, public and private funds, commercial and investment banks, commercial finance and insurance companies and other financial institutions. Many of these competitors may enjoy competitive advantages over us, including:
|
|
• |
greater name recognition; |
|
|
• |
a larger, more established network of correspondents and loan originators; |
|
|
• |
established relationships with mortgage brokers or institutional investors; |
|
|
• |
access to lower cost and more stable funding sources; |
|
|
• |
an established market presence in markets where we do not yet have a presence or where we have a smaller presence; |
|
|
• |
ability to diversify and grow by providing a greater variety of commercial real estate loan products on more attractive terms, some of which require greater access to capital and the ability to retain loans on the balance sheet; and |
|
|
• |
greater financial resources and access to capital to develop branch offices and compensate key employees. |
Some competitors may have a lower cost of funds and access to funding sources that may not be available to us. Commercial banks may have an advantage over us in originating loans if borrowers already have a line of credit or construction financing with the bank. Commercial real estate service providers may have an advantage over us to the extent they also offer a larger or more comprehensive investment sales platform. In addition, some of our competitors may have higher risk tolerances or different risk assessments, which could allow them to consider a wider variety of originations or loan acquisitions, and establish more relationships than us. Furthermore, competition for loans on our target assets may lead to the price of such assets increasing, which may further limit our ability to generate desired returns, and competition in investor real estate loan origination may increase the availability of investor real estate loans which may result in a reduction of interest rates on investor real estate loans. We cannot assure you that the competitive pressures we face will not have a material and adverse effect on our business, results of operations and financial condition. In addition, future changes in laws, regulations, and consolidation in the commercial real estate finance market could lead to the entry of more competitors. We cannot guarantee that we will be able to compete effectively in the future, and our failure to do so would materially and adversely affect us.
Loans to small businesses involve a high degree of business and financial risk, which can result in substantial losses that would adversely affect our business, results of operation and financial condition.
Our operations and activities include, without limitation, loans to small, privately owned businesses. Often, there is little or no publicly available information about these businesses. Accordingly, we must rely on our own due diligence to obtain information in connection with our investment decisions. Our borrowers may not meet net income, cash flow and other coverage tests typically imposed by banks. A borrower’s ability to repay its loan may be adversely impacted by numerous factors, including a downturn in its industry or other negative local or more general economic conditions. Deterioration in a borrower’s financial condition and prospects may be accompanied by deterioration in the collateral for the loan. In addition, small businesses typically depend on the management talents and efforts of one person or a small group of people for their success. The loss of services of one or more of
12
these persons could have a material and adverse impact on the operations of the small business. Small companies are typically more vulnerable to customer preferences, market conditions and economic downturns and often need additional capital to expand or compete. These factors may have an impact on loans involving such businesses. Loans to small businesses, therefore, involve a high degree of business and financial risk, which can result in substantial losses, and in turn could have a material and adverse effect on our business, results of operations and financial condition.
We have a short operating history as a publicly traded company, and our inexperience could materially and adversely affect us.
We completed our initial public offering in January 2020 and have a short operating history as a publicly traded company. Our board of directors and management team have overall responsibility for our management. As a publicly traded company, we are required to develop and implement substantial control systems, policies and procedures in order to satisfy our periodic Securities and Exchange Commission, or SEC, reporting and NYSE listing requirements. We cannot assure you that management’s past experience will be sufficient to successfully develop and implement these systems, policies and procedures and to operate our company. Failure to do so could jeopardize our status as a public company, and the loss of such status or the perception or anticipation by investors of a possible loss of such status could materially and adversely affect us.
The failure of a third-party servicer or the failure of our own internal servicing system to effectively service our portfolio of mortgage loans may adversely impact our business, results of operations and financial condition.
Most mortgage loans and securitizations of mortgage loans require a servicer to manage collections for each of the underlying loans. Nationstar Mortgage Holdings Inc. currently provides loan servicing on most of our loan portfolio, and we work with several other servicers for a small portion of our portfolio. We refer to these providers as our third-party loan servicers. A third-party loan servicer’s responsibilities include providing loan administration, issuing monthly statements, managing borrower insurance and tax impounds, sending delinquency notices, collection activity, all cash management and reporting on the performance of the loans. A third-party loan servicer may retain sub-servicers in any jurisdictions where licensing is required and the third-party loan servicer has not obtained the necessary license or where it otherwise deems it advisable. Both default frequency and default severity of loans may depend upon the quality of the servicer. If a third-party loan servicer or any sub-servicers are not vigilant in encouraging borrowers to make their monthly payments, the borrowers may be far less likely to make these payments, which could result in a higher frequency of default. If a third-party loan servicer or any sub-servicers takes longer to liquidate non-performing assets, loss severities may be higher than originally anticipated. Higher loss severity may also be caused by less competent dispositions of real estate owned, or REO.
We have implemented our own internal special servicing and asset management capabilities and, as of December 31, 2019, we special service 577 distinct assets. The ability to internally service and manage loans in our portfolio, rather than rely on third-party loan servicers, has its own set of risks, including more direct exposure to lawsuits by borrowers and maintaining the necessary infrastructure to provide such special servicing capabilities.
Servicer quality, whether performed by third-party loan servicers or internally by us, is of prime importance in the default performance of investor real estate loans and securitizations. If we are unable to maintain our relationships with our third-party loan servicers, or they become unwilling or unable to continue to perform servicing activities, we could incur additional costs to obtain replacement loan servicers and there can be no assurance that a replacement servicer could be retained in a timely manner or at similar rates. Should we have to transfer loan servicing to another servicer for any reason, the transfer of our loans to a new servicer could result in more loans becoming delinquent because of confusion or lack of attention. Servicing transfers involve notifying borrowers to remit payments to the new servicer, and these transfers could result in misdirected notices, misapplied payments, data input errors and other problems. Industry experience indicates that mortgage loan delinquencies and defaults are likely to temporarily increase during the transition to a new servicer and immediately following the servicing transfer. Further, when loan servicing is transferred, loan servicing fees may increase, which may have an adverse effect on the credit support of assets held by us.
Effectively servicing our portfolio of mortgage loans is critical to our success, particularly given our strategy of maximizing the value of our portfolio with our proprietary loan modification programs and special servicing techniques, and therefore, if one of our third-party loan servicers or our internal special servicing fails to effectively
13
service our portfolio of mortgage loans, it could have a material and adverse effect on our business, results of operations and financial condition.
We are dependent on certain of our key personnel for our future success, and their continued service to us is not guaranteed.
Our future success depends on the continued service of key personnel, including Christopher D. Farrar, our Chief Executive Officer, Mark R. Szczepaniak, our Chief Financial Officer, and Jeffrey T. Taylor, our Executive Vice President for Capital Markets, and our ability to attract new skilled personnel. We do not have employment contracts that provide severance payments and/or change in control benefits with most of our executive officers, and there can be no assurance that we will be able to retain their services. The departure of key personnel, until suitable replacements could be identified and hired, if at all, could have a material and adverse effect on our business, results of operations and financial condition.
Our growth strategy relies upon our ability to hire and retain qualified account executives, and if we are unable to do so, our growth could be limited.
We depend on our qualified account executives to generate broker relationships which leads to repeat and referral business. Accordingly, we must be able to attract, motivate and retain qualified account executives. The market for qualified account executives is highly competitive and may lead to increased costs to hire and retain them. We cannot guarantee that we will be able to attract or retain qualified account executives. If we cannot attract, motivate or retain a sufficient number of qualified account executives, or if our hiring and retention costs increase our business, results of operations and financial condition could be materially and adversely affected.
Inaccurate or incomplete information received from potential borrowers, guarantors and sellers involved in the sale of pools of loans could have a negative impact on our results of operation.
In deciding whether to extend credit or enter into transactions with potential borrowers and their guarantors, we are forced to primarily rely on information furnished to us by or on behalf of these potential borrowers or guarantors, including financial statements. We also must rely on representations of potential borrowers and guarantors as to the accuracy and completeness of that information and we must rely on information and representations provided by sellers involved in the sale of pools of loans that we purchase when we make bulk acquisitions. Our results of operations could be negatively impacted to the extent we rely on financial statements or other information that is misleading, inaccurate or incomplete.
Deficiencies in appraisal quality in the mortgage loan origination process may result in increased principal loss severity.
During the mortgage loan underwriting process, appraisals are generally obtained on the collateral underlying each prospective mortgage. The quality of these appraisals may vary widely in accuracy and consistency. The appraiser may feel pressure from the broker or lender to provide an appraisal in the amount necessary to enable the originator to make the loan, whether or not the value of the property justifies such an appraised value. Inaccurate or inflated appraisals may result in an increase in the severity of losses on the mortgage loans, which could have a material and adverse effect on our business, results of operations and financial condition.
We use leverage in executing our business strategy, which may adversely affect the return on our assets, as well as increase losses when economic conditions are unfavorable.
We leverage certain of our assets through borrowings under warehouse repurchase facilities and securitization transactions, as well as any corporate borrowings we may incur from time to time. Our use of leverage may enhance our potential returns and increase the number of loans that can be made, but may also substantially increase the risk of loss. There are no limits on the amount of leverage we may incur in our certificate of incorporation or bylaws. Our percentage of leverage will vary depending on our ability to obtain financing. Our two warehouse repurchase facilities and our new corporate debt agreement include certain financial covenants that limit our ability to leverage our assets. Our two warehouse repurchase facilities include covenants to maintain a maximum debt-to-tangible net-
14
worth ratio of 6:1, while our new corporate debt agreement includes covenants to maintain a consolidated tangible net worth of at least $100 million plus 25% of consolidated net income (as defined in our new corporate debt agreement), a maximum debt to equity ratio of 1.50:1 or 1.25:1 (depending on the applicable term period and excluding warehouse and securitization debt), and an interest coverage ratio of 1.50:1 or 1.75:1 (depending on the applicable period and excluding warehouse and securitization debt). Our return on equity may be reduced if market conditions cause the cost of our financing to increase relative to the income that can be derived from our loan portfolio, which could adversely affect the price of our common stock. In addition, our debt service payments will reduce cash flow available for distributions to stockholders. We may not be able to meet our debt service obligations. To the extent that we cannot meet our debt service obligations, we risk the loss of some or all of our assets to foreclosure or sale to satisfy our debt obligations.
Our underwriting guidelines in the mortgage loan origination process may result in increased delinquencies and defaults.
Mortgage originators, including us, generally underwrite mortgage loans in accordance with their pre-determined loan underwriting guidelines, and from time to time and in the ordinary course of business, originators will make exceptions to these guidelines. There can be no assurance that our underwriting guidelines will identify or appropriately assess the risk that the interest and principal payments due on a loan will be repaid when due, or at all, or whether the value of the mortgaged property will be sufficient to otherwise provide for recovery of such amounts. Our underwriting guidelines are more narrow than some other mortgage lenders because we give primary consideration to the adequacy of the property as collateral and source of repayment for the loan rather than focusing on the personal income of the borrower. For example, while we emphasize credit scores in our underwriting process, there is no minimum credit score that a potential borrower must have in order to obtain a loan from us. Although we believe that this asset- driven approach is one of our competitive advantages, it may result in higher delinquency and default rates than those experienced by mortgage lenders with broader underwriting guidelines and/or those who require minimum credit scores or verify the personal income of their borrowers.
On a case by case basis, our underwriters may determine that a prospective borrower that does not strictly qualify under our underwriting guidelines warrants an underwriting exception, based upon compensating factors. Compensating factors may include, but are not limited to, a lower LTV ratio, a higher debt coverage ratio, experience as a real estate owner or investor, higher borrower net worth or liquidity, stable employment, longer length of time in business and length of time owning the property. Loans originated with exceptions may result in a higher number of delinquencies and defaults, which could have a material and adverse effect on our business, results of operations and financial condition.
We may change our strategy or underwriting guidelines without notice or stockholder consent, which may result in changes to our risk profile and net income.
Our board of directors may change our strategy or any of our underwriting guidelines at any time without notice or the consent of our stockholders. We may also change our target assets and financing strategy without notice or the consent of our stockholders. Any of these changes could result in us holding a loan portfolio with a different risk profile from the risk profile described in this prospectus. Additionally, a change in our strategy or underwriting guidelines may increase our exposure to interest rate risk, default risk, real estate market fluctuations and liquidity risk, all of which could have a material and adverse effect on our business, results of operations and financial condition.
Our inability to manage future growth effectively could have an adverse impact on our business, results of operations and financial condition.
Our ability to grow will depend on our management’s ability to originate and/or acquire investor real estate loans. In order to do this, we will need to identify, hire, train, supervise and manage new employees. Any failure to effectively manage our future growth, including a failure to successfully expand our loan origination activities could have a material and adverse effect on our business, results of operations and financial condition.
15
If we fail to develop, enhance and implement strategies to adapt to changing conditions in the real estate and capital markets, our business, results of operations and financial condition may be materially and adversely affected.
The manner in which we compete and the loans for which we compete are affected by changing conditions, which can take the form of trends or sudden changes in our industry, regulatory environment, changes in the role of government-sponsored entities, changes in the role of credit rating agencies or their rating criteria or process or the United States economy more generally. If we do not effectively respond to these changes, or if our strategies to respond to these changes are not successful, our business, results of operations and financial condition may be materially and adversely affected.
Operational risks, including the risk of cyberattacks, could disrupt our business and materially and adversely affect our business, results of operations and financial condition.
Our financial, accounting, communications and other data processing systems may fail to operate properly or become disabled as a result of tampering or a breach of the network security systems or otherwise. In addition, such systems may be from time to time subject to cyberattacks and other cybersecurity incidents, which may continue to increase in sophistication and frequency in the future.
Breaches of our network security systems could involve attacks that are intended to obtain unauthorized access to our proprietary information or personal identifying information of our stockholders, destroy data or disable, degrade or sabotage our systems, including through the introduction of computer viruses and other malicious code, network failures, computer and telecommunication failures, infiltration by unauthorized persons and security breaches, usage errors by their respective professionals or service providers. If unauthorized parties gain access to such information and technology systems, they may be able to steal, publish, delete or modify private and sensitive information. Although we take various measures to ensure the integrity of such systems, there can be no assurance that these measures will provide protection. Breaches such as those involving covertly introduced malware, impersonation of authorized users and industrial or other espionage may not be identified even with sophisticated prevention and detection systems, potentially resulting in further harm and preventing it from being addressed appropriately.
Moreover, we are highly dependent on information systems and technology. Our information systems and technology may not continue to be able to accommodate our growth, and the cost of maintaining such systems may increase from its current level. Such a failure to accommodate growth, or an increase in costs related to such information systems, could have a material adverse effect on us.
We are headquartered in Westlake Village, California, in an area known for seismic activity and prone to wildfires. An earthquake, wildfire or other disaster or a disruption in the infrastructure that supports our business, including a disruption involving electronic communications or other services used by us or third parties with whom we conduct business, or directly affecting our headquarters, could have a material adverse impact on our ability to continue to operate our business without interruption. Our disaster recovery programs may not be sufficient to mitigate the harm that may result from such a disaster or disruption. Insurance and other safeguards might only partially reimburse us for our losses, if at all.
In addition, we rely on third-party service providers for certain aspects of our business, including software vendors for portfolio management and accounting software, outside financial institutions for back office processing and custody of securities and third-party broker-dealers for the execution of trades. An interruption or deterioration in the performance of these third parties or failures of their information systems and technology could cause system interruptions, delays, loss, corruption or exposure of critical data or intellectual property and impair the quality of our operations, which could impact our reputation and hence adversely affect our business.
Any such interruption or deterioration in our operations could result in substantial recovery and remediation costs and liability. While we have implemented disaster recovery plans and backup systems to lessen the risk of any material adverse impact, its disaster recovery planning may not be sufficient to mitigate the harm and cannot account for all eventualities, and a catastrophic event that results in the destruction or disruption of any data or
16
critical business or information technology systems could severely affect our ability to conduct our business operations, and as a result, our future operating results could be materially and adversely affected.
Any disruption in the availability or functionality of our technology infrastructure and systems could have a material adverse effect on our business.
Our ability to originate and acquire investor real estate loans, execute securitizations, and manage any related interest rate risks and credit risks is critical to our success and is highly dependent upon the efficient and uninterrupted operation of our computer and communications hardware and software systems. Some of these systems are located at our facility and some are maintained by third-party vendors. Any significant interruption in the availability and functionality of these systems could harm our business. In March 2020, California and certain other states implemented rules attempting to mitigate the spread of COVID-19 by restricting residents’ movement. As a result, we have transitioned most of our employees to remote work, as have a number of our third-party service vendors. This transition to a remote work environment may exacerbate certain risks to our business, including increasing the stress on, and our vulnerability to disruptions of, our technology infrastructure and systems, increased risk of phishing and other cybersecurity attacks, and increased risk of unauthorized dissemination of confidential information.
In the event of a systems failure or interruption by our third-party vendors, we will have limited ability to affect the timing and success of systems restoration. If such interruptions continue for a prolonged period of time, it could, have a material and adverse impact on our business, results of operations and financial condition.
Our security measures may not effectively prohibit others from obtaining improper access to our information. If a person is able to circumvent our security measures, he or she could destroy or misappropriate valuable information or disrupt our operations. Any security breach could expose us to risks of data loss, litigation and liability and could seriously disrupt our operations and harm our reputation.
Risks Related to Our Loan Portfolio
A significant portion of our loan portfolio is in the form of investor real estate loans which are subject to increased risks.
Investor real estate loans are directly exposed to losses resulting from default and foreclosure. Therefore, the value of the underlying property, the creditworthiness and financial position of the borrower and the priority and enforceability of the lien will significantly impact the value of such mortgages. Whether or not we have participated in the negotiation of the terms of any such mortgages, there can be no assurance as to the adequacy of the protection of the terms of the loan, including the validity or enforceability of the loan and the maintenance of the anticipated priority and perfection of the applicable security interests. Furthermore, claims may be asserted that might interfere with enforcement of our rights. In the event of a foreclosure, we may assume direct ownership of the underlying real estate. The liquidation proceeds upon sale of such real estate may not be sufficient to recover our cost basis in the loan, resulting in a loss to us. Any costs or delays involved in the completion of a foreclosure of the loan or a liquidation of the underlying property will further reduce the proceeds and thus increase the loss.
A portion of our loan portfolio currently is, and in the future may be, delinquent and subject to increased risks of credit loss for a variety of reasons, including, without limitation, because the underlying property is too highly-leveraged or the borrower falls upon financial distress. Whatever the reason, the borrower may be unable to meet its contractual debt service obligation to us. Delinquent loans may require a substantial amount of workout negotiations or restructuring, which may divert our attention from other activities and entail, among other things, a substantial reduction in the interest rate or capitalization of past due interest. However, even if restructurings are successfully accomplished, risks still exist that borrowers will not be able or willing to maintain the restructured payments or refinance the restructured mortgage upon maturity.
Investor real estate loans, including performing and delinquent, are also subject to “special hazard” risk (property damage caused by hazards, such as earthquakes or environmental hazards, not covered by standard property insurance policies) and to bankruptcy risk (reduction in a borrower’s mortgage debt by a bankruptcy court). In addition, claims may be assessed against us on account of our position as mortgage holder or property owner, including responsibility for tax payments, environmental hazards and other liabilities.
17
Loans on properties in transition will involve a greater risk of loss than traditional investment-grade mortgage loans with fully insured borrowers.
While our primary focus is long-term maturity investor real estate loans, in March 2017, we began originating short-term, interest-only loans to be used for acquiring, repositioning or improving the quality of 1-4 unit residential investment properties. This product typically serves as an interim solution for borrowers and/or properties that do not meet the investment criteria of our primary 30-year product. The typical borrower of these rehab and resell loans has usually identified an undervalued asset that has been under-managed or is located in a recovering market. If the market in which the asset is located fails to improve according to the borrower’s projections, or if the borrower fails to improve the quality of the asset’s management or the value of the asset, the borrower may not receive a sufficient return on the asset to satisfy the transitional loan, and we bear the risk that we may not recover some or all of our investment.
In addition, borrowers usually use the proceeds of a conventional mortgage to repay a rehab and resell loan. Rehab and resell loans therefore are subject to risks of a borrower’s inability to obtain permanent financing to repay the loan. Rehab and resell loans are also subject to risks of borrower defaults, bankruptcies, fraud, losses and special hazard losses that are not covered by standard hazard insurance. In the event of any default under rehab and resell loans that may be held by us, we bear the risk of loss of principal and non-payment of interest and fees to the extent of any deficiency between the value of the mortgage collateral and the principal amount and unpaid interest of the transitional loan. To the extent we suffer such losses with respect to these loans, our business, results of operations and financial condition may be materially adversely affected.
Any costs or delays involved in the completion of a foreclosure or liquidation of the underlying property may further reduce proceeds from the property and may increase the loss.
In the future, it is possible that we may find it necessary or desirable to foreclose on some, if not many, of the loans we acquire, and the foreclosure process may be lengthy and expensive. Borrowers may resist mortgage foreclosure actions by asserting numerous claims, counterclaims and defenses against us including, without limitation, numerous lender liability claims and defenses, even when such assertions may have no basis in fact, in an effort to prolong the foreclosure action and force us into a modification of the loan or a favorable buy-out of the borrower’s position. In some states, foreclosure actions can sometimes take several years or more to litigate. At any time prior to or during the foreclosure proceedings, the borrower may file for bankruptcy, which would have the effect of staying the foreclosure actions and further delaying the foreclosure process. Foreclosure may create a negative public perception of the related mortgaged property, resulting in a decrease in its value. Even if we are successful in foreclosing on a loan, the liquidation proceeds upon sale of the underlying real estate may not be sufficient to recover our cost basis in the loan, resulting in a loss to us. Furthermore, any costs or delays involved in the completion of a foreclosure of the loan or a liquidation of the underlying property will further reduce the proceeds and thus increase the loss. Any such reductions could materially and adversely affect the value of the commercial loans in which we invest and, therefore, could have a material and adverse effect on our business, results of operations and financial condition. In addition, if the federal or a U.S. state government imposes freezes on the ability of lenders to foreclose on property or requires lenders to modify loans, we may be precluded from foreclosing on, or exercising other remedies with respect to, the property underlying loans, or may be required to accept modifications not favorable to us.
Insurance on collateral underlying mortgage loans and real estate securities may not cover all losses.
There are certain types of losses, generally of a catastrophic nature, such as earthquakes, floods, hurricanes, terrorism or acts of war, that may be uninsurable or not economically insurable. Inflation, changes in building codes and ordinances, environmental considerations and other factors, including terrorism or acts of war, also might make the insurance proceeds insufficient to repair or replace a property if it is damaged or destroyed. Under these circumstances, the insurance proceeds received might not be adequate to restore our economic position with respect to the affected real property. Uninsured losses may also reduce the value of the underlying property. Any uninsured or underinsured loss could result in the loss of cash flow from, and the asset value of, the affected property.
18
Some of the mortgage loans we originate or acquire are loans made to self-employed borrowers who may have a higher risk of delinquency and default, which could have a material and adverse effect on our business, results of operations and financial condition.
Many of our borrowers are self-employed. The unpaid principal balance, or UPB, of loans to self- employed borrowers represented 70.8% of our total loan portfolio, or $1.5 billion, as of December 31, 2019. Self-employed borrowers may be more likely to default on their mortgage loans than salaried borrowers and generally have less predictable income. In addition, many self-employed borrowers are small business owners who may be personally liable for their business debt. Consequently, a higher number of self- employed borrowers may result in increased defaults on the mortgage loans we originate or acquire and, therefore, could have a material and adverse effect on our business, results of operations and financial condition.
We may be subject to lender liability claims, and if we are held liable under such claims, we could be subject to losses.
A number of judicial decisions have upheld the right of borrowers to sue lending institutions on the basis of various evolving legal theories, collectively termed “lender liability.” Generally, lender liability is founded on the premise that a lender has either violated a duty, whether implied or contractual, of good faith and fair dealing owed to the borrower or has assumed a degree of control over the borrower resulting in the creation of a fiduciary duty owed to the borrower or its other creditors or stockholders. We cannot assure prospective investors that such claims will not arise or that we will not be subject to significant liability if a claim of this type did arise.
Our portfolio of assets may at times be concentrated in certain property types or secured by properties concentrated in a limited number of geographic areas, which increases our exposure to economic downturn and natural disasters with respect to those property types or geographic locations.
We are not required to observe specific diversification criteria, except as may be set forth in the underwriting guidelines adopted by our board of directors. Therefore, our portfolio of assets may, at times, be concentrated in certain property types that are subject to higher risk of foreclosure or secured by properties concentrated in a limited number of geographic locations.
Our loan portfolio changes over time, however, as of December 31, 2019, our loans were primarily concentrated in California, New York, Florida and New Jersey. Deterioration of economic conditions or natural disasters in these or in any other state in which we have a significant concentration of borrowers could have a material and adverse effect on our business by reducing demand for new financings, limiting the ability of customers to repay existing loans and impairing the value of our real estate collateral and real estate owned properties.
To the extent that our portfolio is concentrated in any region, or by type of property, downturns relating generally to such region, type of borrower or security, or the occurrence of natural disasters in those regions, may result in defaults on a number of our assets within a short time period, which may reduce our net income and the value of our common stock and accordingly reduce our ability to pay dividends to our stockholders.
The investor real estate loans we originate or acquire are dependent on the ability of the property owner to generate net income from operating the property, which may result in the inability of such property owner to repay a loan, as well as the risk of foreclosure.
The ability of a borrower to repay a loan secured by an income-producing property typically is dependent primarily upon the successful operation of such property rather than upon the existence of independent income or assets of the borrower. If the net operating income of the property is reduced, the borrower’s ability to repay the loan may be impaired. Net operating income of an income-producing property can be adversely affected by, among other things:
|
|
• |
tenant mix; |
|
|
• |
success of tenant businesses; |
|
|
• |
property management decisions; |
19
|
|
• |
competition from comparable types of properties; |
|
|
• |
changes in national, regional or local economic conditions or specific industry segments; |
|
|
• |
declines in regional or local real estate values; |
|
|
• |
declines in regional or local rental or occupancy rates; |
|
|
• |
increases in interest rates, real estate tax rates and other operating expenses; |
|
|
• |
costs of remediation and liabilities associated with environmental conditions; |
|
|
• |
the potential for uninsured or underinsured property losses; |
|
|
• |
changes in governmental laws and regulations, including fiscal policies, zoning ordinances and environmental legislation and the related costs of compliance; and |
|
|
• |
acts of God, significant public health events (including epidemics), terrorism, social unrest and civil disturbances. |
In the event of any default under a mortgage loan held directly by us, we will bear a risk of loss of interest and principal to the extent of any deficiency between the value of the collateral and the principal and accrued interest of the mortgage loan, which could have a material adverse effect on our cash flow from operations and limit amounts available for distribution to our stockholders. In the event of the bankruptcy of a mortgage loan borrower, the mortgage loan to such borrower will be deemed to be secured only to the extent of the value of the underlying collateral at the time of bankruptcy (as determined by the bankruptcy court), and the lien securing the mortgage loan will be subject to the avoidance powers of the bankruptcy trustee or debtor-in-possession to the extent the lien is unenforceable under state law.
Foreclosure can be an expensive and lengthy process and foreclosing on certain properties where we directly hold the mortgage loan and the borrower’s default under the mortgage loan is continuing could result in actions that could be costly to our operations, in addition to having a substantial negative effect on our anticipated return on the foreclosed mortgage loan.
We may be exposed to environmental liabilities with respect to properties to which we take title, which may in turn decrease the value of the underlying properties.
In the course of our business, we may take title to real estate, and, if we do take title, we could be subject to environmental liabilities with respect to these properties. In such a circumstance, we may be held liable to a governmental entity or to third parties for property damage, personal injury, investigation and clean-up costs incurred by these parties in connection with environmental contamination, or we may be required to investigate or clean up hazardous or toxic substances or chemical releases at a property. The costs associated with investigation or remediation activities could be substantial. If we ever become subject to significant environmental liabilities, our business, financial condition, liquidity, and results of operations could be materially and adversely affected. In addition, an owner or operator of real property may become liable under various federal, state and local laws, for the costs of removal of certain hazardous substances released on its property. Such laws often impose liability without regard to whether the owner or operator knew of, or was responsible for, the release of such hazardous substances. The presence of hazardous substances may adversely affect an owner’s ability to sell real estate or borrow using real estate as collateral. To the extent that an owner of an underlying property becomes liable for removal costs, the ability of the owner to make debt payments may be reduced, which in turn may adversely affect the value of the relevant mortgage-related assets held by us.
We will utilize analytical models and data in connection with the projections for our loan portfolio, and any incorrect, misleading or incomplete information used in connection therewith would subject us to potential risks.
We rely on analytical models (both proprietary models developed by us and those supplied by third parties) and information and data (both generated by us and supplied by third parties). Models and data will be used to make
20
projections for our loan portfolio. When models and data prove to be incorrect, misleading or incomplete, any decisions made in reliance thereon expose us to potential risks. Some of the analytical models we use, such as mortgage prepayment models or mortgage default models, are predictive in nature. The use of predictive models has inherent risks. For example, such models may incorrectly forecast future behavior, leading to volatility in results. In addition, the predictive models used by us may differ substantially from those models used by other market participants.
We may be required to repurchase or substitute mortgage loans or indemnify investors if we breach representations and warranties, which could harm our business, cash flow, results of operations and financial condition.
We have sold and, on occasion, we may sell some of our loans in the secondary market or as a part of a securitization of a portfolio of our loans. When we sell loans, we are required to make customary representations and warranties about such loans to the loan purchaser. Our mortgage loan sale agreements may require us to repurchase or substitute loans or indemnify investors in the event we breach a representation or warranty given to the loan purchaser. In addition, we may be required to repurchase loans as a result of borrower fraud or in the event of early payment default on a mortgage loan. Likewise, we may be required to repurchase or substitute loans or indemnify investors if we breach a representation or warranty in connection with our securitizations, if any.
The remedies available to a purchaser of mortgage loans are generally broader than those available to us against the originating broker or correspondent. Further, if a purchaser enforces its remedies against us, we may not be able to enforce the remedies we have against the sellers. The repurchased loans typically can only be financed at a steep discount to their repurchase price, if at all. They are also typically sold at a significant discount to the UPB. Significant repurchase activity could harm our business, cash flow, results of operations and financial condition.
Some of our portfolio assets may be recorded at fair value as estimated by management and may not reflect the price we could realize upon disposal.
Most of our portfolio assets will be in the form of loans that are not publicly traded. The fair value of securities and other assets that are not publicly traded is not readily determinable. Depending on whether these securities and other investments are classified as available-for-sale or held-to-maturity, we will value certain of these investments at fair value, as determined in accordance with Accounting Standards Codification™, or ASC, 820 — Fair Value Measurements, which may include unobservable inputs. Because such valuations are inherently uncertain, may fluctuate over short periods of time and may be based on estimates, our determinations of fair value may differ materially from the values that would have been used if a ready market for these securities existed. Our results of operations and the value of our common stock could be adversely affected if our determinations regarding the fair value of these assets are materially higher than the values that we ultimately realize.
Risks Related to Our Organization and Structure
For so long as Snow Phipps and TOBI continue to own a substantial amount of our outstanding common stock, or securities convertible or exchangeable for our common stock, they will have the ability to substantially influence us.
As of February 29, 2020, funds affiliated with Snow Phipps Group LLC, or Snow Phipps, owned approximately 35% of our outstanding common stock and an affiliate of a fund managed by Pacific Investment Management Company LLC, or TOBI, beneficially owned approximately 22% of our outstanding common stock. On April 5, 2020, we issued and sold shares of our convertible Preferred Stock (as defined below) and Warrants (as defined below) to purchase shares of our common stock to affiliates of Snow Phipps and TOBI. As of February 29, 2020, assuming the full conversion and exercise of the Preferred Stock and Warrants, funds affiliated with Snow Phipps and TOBI would have owned an aggregate of approximately 75.5% of our common stock outstanding on a pro forma, as-converted and as-exercised basis. The certificate of designations governing the terms of Preferred Stock permit holders of our Preferred Stock to vote, together with the holders of our common stock, on an as converted basis, subject to limitations of the rules of the NYSE, on all matters submitted to a vote of the holders of our common stock.
21
In addition, pursuant to a stockholders’ agreement we entered into with Snow Phipps and TOBI in connection with our IPO and a purchase agreement we entered into with Snow Phipps and TOBI in connection with the sale of our Preferred Stock and warrants, each of Snow Phipps and TOBI have the right to designate certain persons as nominees for election as directors. Specifically, each of Snow Phipps and TOBI are entitled to designate up to two persons as director nominees. Furthermore, upon certain circumstances if we default upon our obligation to repurchase the Preferred Stock, the holders of our Preferred Stock are entitled to elect two additional directors to our board of directors during the period of default. As a result, although Snow Phipps and TOBI are not affiliated with each other, they collectively own a majority of our common stock and are in a position to exercise significant influence over us, our board of directors and our management, affairs and transactions in a manner that you may not agree with or that you may not consider is in the best interest of all of our stockholders. In addition, the degree of control on our board of directors held by Snow Phipps and TOBI may be greater than their proportionate ownership of our common stock.
By virtue of their stock ownership and voting power, in addition to their board nomination rights. Snow Phipps and TOBI have the power to significantly influence our business and affairs and are able to influence the outcome of matters required to be submitted to stockholders for approval, including the election of our directors, amendments to our certificate of incorporation, mergers or sales of assets. The influence exerted by these large stockholders over our business and affairs might not be consistent with the interests of some or all of our other stockholders. In addition, the concentration of ownership in our directors or stockholders associated with them may have the effect of delaying or preventing a change in control of our company, including transactions that would be in the best interests of our stockholders and would result in receipt of a premium to the price of our shares of common stock, and might negatively affect the market price of our common stock.
Our certificate of incorporation provides that our directors who are affiliates of Snow Phipps and TOBI may engage in similar activities and lines of business as us, which may result in competition between us and such stockholders or another portfolio company of such stockholders for certain corporate opportunities.
Our certificate of incorporation provides that our directors who are also employees or affiliates of Snow Phipps and TOBI may engage in similar activities or lines of business as us. Our certificate of incorporation will provide that no employees or affiliates of such stockholders, including those persons who are also our directors, have any obligation to refrain from (1) engaging directly or indirectly in the same or similar business activities or lines of business as us or developing or marketing any products or services that compete, directly or indirectly, with us, (2) investing or owning any interest in, or developing a business relationship with, any person or entity engaged in the same or similar business activities or lines of business as, or otherwise in competition with, us or (3) doing business with any of our clients or customers. In addition, our certificate of incorporation will provide that we have waived any interest or expectancy in any business or other opportunity that becomes known to a director of ours who is also an employee or affiliate of such stockholders unless the opportunity becomes known to that individual solely in his or her capacity as our director. As a result, certain of our directors who are also employees or affiliates of Snow Phipps or TOBI may compete with us for business and other opportunities, which may not be in the interest of all of our stockholders.
Some provisions of Delaware law and our organizational documents may deter third parties from acquiring us and may diminish the value of our common stock.
Certain provisions of our certificate of incorporation and bylaws may have the effect of delaying or preventing a merger, acquisition, tender offer, takeover attempt or other change of control transaction that a stockholder might consider to be in its best interest, including attempts that might result in a premium over the market price of our common stock.
22
These provisions provide for, among other things:
|
|
• |
the ability of our board of directors to issue one or more series of preferred stock with voting or other rights or preferences that could have the effect of impeding the success of an attempt to acquire us or otherwise effect a change of control; |
|
|
• |
advance notice for nominations of directors by stockholders and for stockholders to include matters to be considered at stockholder meetings; |
|
|
• |
certain limitations on convening special stockholder meetings; and |
|
|
• |
certain limitations regarding business combinations with any “interested stockholder.” |
These provisions could make it more difficult for a third party to acquire us, even if the third-party’s offer may be considered beneficial by many of our stockholders. As a result, our stockholders may be limited in their ability to obtain a premium for their shares. Even in the absence of a takeover attempt, the existence of these provisions may adversely affect the prevailing market price of our common stock if they are viewed as discouraging future takeover attempts. These provisions could also make it more difficult for our stockholders to nominate directors for election to our board of directors and take other corporate actions.
Failure to comply with requirements to design, implement and maintain effective internal controls, as well as a failure to remediate any identified weaknesses in our internal controls, could have a material adverse effect on our reputation, business and stock price.
As a publicly-traded company, we are required to evaluate our internal control over financial reporting in a manner that meets the standards of publicly traded companies required by Section 404(a) of the Sarbanes-Oxley Act, or Section 404. The process of designing and implementing effective internal controls is a continuous effort that requires us to anticipate and react to changes in our business and the economic and regulatory environments and to expend significant resources to maintain a system of internal controls that is adequate to satisfy our reporting obligations as a public company. If we are unable to establish or maintain appropriate internal financial reporting controls and procedures, it could cause us to fail to meet our reporting obligations on a timely basis, result in material misstatements in our consolidated financial statements and harm our results of operations. In addition, we will be required, pursuant to Section 404, to furnish a report by management on, among other things, the effectiveness of our internal control over financial reporting in our second annual report on Form 10-K. This assessment will need to include disclosure of any material weaknesses identified by our management in our internal control over financial reporting. The rules governing the standards that must be met for our management to assess our internal control over financial reporting are complex and require significant documentation, testing and possible remediation. Testing and maintaining internal controls may divert management’s attention from other matters that are important to our business. We will be required to include an attestation report on the effectiveness of our internal controls over financial reporting issued by our independent registered public accounting firm in our second annual report on Form 10-K.
In reviewing the accounting for a certain transaction we completed in January 2018, as part of our 2018 election to be treated as a corporation for U.S. federal and state income tax purposes, as described below under the caption “Management’s Discussion and Analysis of Financial Condition and Results of Operation—Components of Results of Operations—Provision for Income Taxes,” our management identified a deficiency in the effectiveness of a control intended to properly document and review relevant facts and apply the appropriate tax accounting under U.S. GAAP, which impacted the beginning of year deferred tax asset and income tax benefit accounts and related disclosures. Management concluded that the deficiency constituted a material weakness in our internal control over financial reporting as of December 31, 2018.
23
In 2019, we implemented a plan to remediate this material weakness by contracting with a nationally recognized accounting firm to have experienced tax personnel supplement and train our current accounting team. As a result, additional internal controls over our income tax processes have been designed and implemented. In 2020, management will assess whether these internal controls over income taxes are performing as designed. Management has concluded that the material weakness existed as of December 31, 2019, pending further testing of the internal controls.
Although we believe this plan will be adequate to address the material weakness, there can be no assurance that the material weakness will be remediated on a timely basis or at all, or that additional material weaknesses will not be identified in the future. If we are unable to remediate the material weakness, our ability to record, process and report financial information accurately, and to prepare financial statements within the time periods specified by the rules and forms of the SEC, could be adversely affected which, in turn, to may adversely affect our reputation and business and the market price of our common stock.
Our certificate of incorporation provides, subject to limited exceptions, that the Court of Chancery of the State of Delaware and the federal district courts of the United States of America will be the sole and exclusive forums for certain stockholder litigation matters, which could limit our stockholders’ ability to obtain a favorable judicial forum for disputes with us or our directors, officers, employees or stockholders.
Our certificate of incorporation provides, subject to limited exceptions, that unless we consent to the selection of an alternative forum, the Court of Chancery of the State of Delaware shall, to the fullest extent permitted by law, be the sole and exclusive forum for any (1) derivative action or proceeding brought on behalf of our company, (2) action asserting a claim of breach of a fiduciary duty owed by any director, officer, or other employee or stockholder of our company to the Company or our stockholders, creditors or other constituents, (3) action asserting a claim against the Company or any director or officer of the Company arising pursuant to any provision of the Delaware General Corporation Law, or the DGCL, or our certificate of incorporation or our bylaws or as to which the DGCL confers jurisdiction on the Court of Chancery of the State of Delaware, or (4) action asserting a claim against the Company or any director or officer of the Company governed by the internal affairs doctrine. Our certificate of incorporation will further provide that, to the fullest extent permitted by law, the federal district courts of the United States of America will be the exclusive forum for resolving any complaint asserting a cause of action arising under the United States federal securities laws.
Any person or entity purchasing or otherwise acquiring any interest in shares of our capital stock shall be deemed to have notice of and consented to the forum provisions in our certificate of incorporation. These choice of forum provisions may limit a stockholder’s ability to bring a claim in a judicial forum that it finds favorable for disputes with us or any of our directors, officers, other employees or stockholders which may discourage lawsuits with respect to such claims. Alternatively, if a court were to find the choice of forum provisions contained in our certificate of incorporation to be inapplicable or unenforceable with respect to one or more of the specified types of actions or proceedings, we may incur additional costs associated with resolving such action in other jurisdictions, which could harm our business, operating results and financial condition.
Our board of directors is authorized to issue and designate shares of our preferred stock in additional series without stockholder approval.
Our certificate of incorporation authorizes our board of directors, without the approval of our stockholders, to issue 25,000,000 shares of our preferred stock, subject to limitations prescribed by applicable law, rules and regulations and the provisions of our certificate of incorporation, as shares of preferred stock in series, to establish from time to time the number of shares to be included in each such series and to fix the designation, powers, preferences and rights of the shares of each such series and the qualifications, limitations or restrictions thereof. The powers, preferences and rights of these additional series of preferred stock may be senior to or on parity with our common stock, which may reduce its value.
24
The terms of our outstanding Series A Convertible Preferred Stock and Warrants may adversely affect the rights of the holders of our common stock.
On April 5, 2020, we issued and sold 45,000 shares of our newly created Series A Convertible Preferred Stock, par value $0.01 per share (our “Preferred Stock”), and warrants (the “Warrants”) exercisable for up to 3,013,125 shares of our common stock to affiliates of Snow Phipps and TOBI. The Preferred Stock is initially convertible into an aggregate of approximately 11,688,312 shares of common stock. As of February 29, 2020, the Preferred Stock and Warrants would have represented an aggregate of approximately 42.3% of our common stock outstanding on a pro forma, as-converted and as-exchanged basis. Following receipt of the applicable stockholder approval, (i) the Preferred Stock will be convertible at its holders’ option at any time, in whole or in part, into a number of shares of our common stock based on the then applicable conversion rate as set forth in the certificate of designation and (ii) the Warrants will be exercisable at the warrantholder’s option at any, in whole or in part, until April 5, 2025. The initial conversion price for the Preferred Stock is approximately $3.85 per share of common stock. The conversion of the Preferred Stock and the exercise of the Warrants would dilute the ownership interest of existing holders of our common stock and sales of common stock by holders following conversion or exercise, as applicable, could adversely affect prevailing market prices of our common stock.
The certificate of designations governing the terms of Preferred Stock permit holders of our Preferred Stock to vote, together with the holders of our common stock, on an as-converted basis, subject to limitations of the rules of the NYSE, on all matters submitted to a vote of the holders of our common stock, and as a separate class as required by law. The holders of our Preferred Stock will also have the right to elect two directors to our board of directors if the Company defaults under its obligation to repurchase the Preferred Stock during the period of the default. These terms of the Preferred Stock dilute the voting power of existing holders of our common stock and may adversely affect the market price of our common stock. As a result, the holders of our Preferred Stock may exercise a significant influence over us and have interests that diverge from those of other holders of our common stock.
The holders of the Preferred Stock have certain rights to require us to repurchase their shares for such shares’ liquidation preference amount. If we default on that repurchase obligation, the Preferred Stock holders will have the right (until the repurchase price for such shares has been paid in cash or the shares converted into common stock) to force a sale of the Company and to elect two directors to our board of directors. These repurchase obligations could impact our liquidity and reduce the amount of cash flow available for other corporate purposes. Our obligations to the holders of Preferred Stock could also limit our ability to obtain additional financing or increase our borrowing costs, which could have an adverse effect on our financial condition. There can be no assurance that we will be able to repurchase the Preferred Stock when required to do so. This forced sale process may adversely impact the price or terms on which the Company is sold and the consideration paid to holders of our common stock.
In addition, the consent of the purchasers of the Preferred Stock will be required to take certain corporate actions for so long as the purchasers of our Preferred Stock maintain certain levels of ownership of the Preferred Stock. These corporate actions include, among other things, certain amendments or alterations to our certificate of incorporation or the certificate of designation for the Preferred Stock, the creation and issuance of securities with certain rights senior to, or on parity with, the Preferred Stock, and the incurrence of certain debt in excess of $20.0 million. These consent rights, together with the voting power held by the holders of our Preferred Stock and Warrants, may have the effect of delaying or preventing a merger, acquisition, tender offer, takeover attempt or other change of control transaction that a stockholder might consider to be in its best interest, including attempts that might result in a premium over the market price of our common stock.
Risks Related to Sources of Financing
We may not be able to successfully complete additional securitization transactions on attractive terms or at all, which could limit potential future sources of financing and could inhibit the growth of our business.
We have financed a large portion of our loan portfolio as securitizations, and we plan to securitize newly originated loans to repay our warehouse repurchase facilities, provide for long-term financing and generate cash for funding new loans. We plan to continue to structure these securitizations so that they are treated as financing transactions, and not as sales, for U.S. GAAP purposes. This involves creating a special-purpose vehicle, contributing a pool of our assets to the entity and selling non-recourse debt securities to purchasers. We retain a portion of the “first loss” subordinated securities issued by our trusts and, as a result, we are the first tranche
25
exposed to principal losses in the event the trust experiences a loss. We use short-term credit facilities to finance the origination or acquisition of investor real estate loans until a sufficient quantity of eligible assets has been accumulated, at which time we would refinance these short-term facilities through a securitization of the eligible assets, such as issuances of commercial mortgage-backed securities or collateralized loan obligations or the private placement of loan participations or other long-term financing. When we employ this strategy, we are subject to the risk that we would not be able to obtain, during the period that our short-term facilities are available, a sufficient amount of eligible assets to maximize the efficiency of a securitization. We are also subject to the risk that we are not able to obtain short-term credit facilities or are not able to renew any short-term credit facilities after they expire should we find it necessary to extend such short-term credit facilities to allow more time to obtain the necessary eligible assets for a long-term financing.
From time to time one or more credit rating agencies may rate our new or existing securitizations. A lower than expected rating by one or more of these agencies or a reduction or withdrawal of a credit rating may adversely impact our ability to complete new securitizations on attractive terms or at all.
The inability to consummate securitizations of our portfolio or secure other financing arrangements on satisfactory terms to finance our loans on a long-term basis could require us to seek other forms of potentially less attractive financing or to liquidate assets at an inopportune time or price, which could have a material and adverse effect on our business, results of operations and financial condition.
If one or more of our warehouse repurchase facilities, on which we are dependent, are terminated, we may be unable to find replacement financing on favorable terms on a timely basis, or at all, which would have a material adverse effect on our business, results of operations and financial condition.
We require a significant amount of short-term funding capacity for loans we originate. Consistent with industry practice, two of our existing warehouse repurchase facilities are short-term, requiring annual renewal. If any of our committed facilities are terminated or are not renewed or our uncommitted facilities are not honored, we may be unable to find replacement financing on favorable terms on a timely basis, or at all, and we might not be able to originate loans, which would have a material adverse effect on us. Additionally, as our business continues to expand, we may need additional warehouse funding capacity for loans we originate. There can be no assurance that, in the future, we will be able to obtain additional warehouse funding capacity on favorable terms, on a timely basis, or at all.
We may be required to maintain certain levels of collateral or provide additional collateral under our warehouse repurchase facilities, which may restrict us from leveraging our assets as fully as desired or forcing us to sell assets under adverse market conditions, resulting in potentially lower returns.
We currently finance our originations and investments in investor real estate using three warehouse repurchase facilities, which are our short-term revolving full recourse master repurchase agreements secured by certain of our underlying mortgage loans. Under our revolving warehouse repurchase facilities, the amount of available financing on our investor real estate loan portfolio is reduced based on the delinquency performance of the individual loans pledged under these facilities, and if the delinquency in our loan portfolio increases beyond certain levels, we may be required to pledge additional collateral, pay down a portion of the outstanding balance of these warehouse repurchase facilities, or liquidate assets at a disadvantageous time to avoid violating certain financial covenants contained therein and triggering a foreclosure on our collateral, any of which could cause us to incur further losses and have a material and adverse effect on our business, results of operations and financial condition.
In the event we do not have sufficient liquidity to pay down the financing when loan performance deteriorates, lending institutions can accelerate our indebtedness, increase our borrowing rates, liquidate our collateral and terminate our ability to borrow.
Further, our revolving warehouse repurchase facility agreements contain various financial and other restrictive covenants, including covenants that require us to maintain a certain amount of cash that is not invested or to set aside non-levered assets sufficient to maintain a specified liquidity position, which would allow us to satisfy our collateral obligations. As a result, we may not be able to leverage our assets as fully as we would choose, which could reduce our return on equity. In the event that we are unable to meet these collateral obligations, as described
26
above, our financial condition could deteriorate rapidly. In addition, if we fail to satisfy any of the financial or other restrictive covenants, or otherwise default under our revolving warehouse repurchase facilities, the lenders have the right to accelerate repayment and terminate the facilities. Accelerating repayment and terminating the facilities would require immediate repayment by us of the borrowed funds, which may require us to liquidate assets at a disadvantageous time, causing us to incur further losses and have a material and adverse effect on our business, our results of operations and financial condition.
If a counterparty to our repurchase transactions defaults on its obligation to resell the underlying asset back to us at the end of the transaction term, or if the value of the underlying asset has declined as of the end of that term, or if we default on our obligations under the repurchase agreement, we will lose money on our repurchase transactions.
When we engage in repurchase transactions, we generally sell assets to lenders and receive cash from these lenders. The lenders are obligated to resell the same assets back to us at the end of the term of the transaction. Because the cash we receive from the lender when we initially sell the assets to the lender is less than the value of those assets (this difference is the haircut), if the lender defaults on its obligation to resell the same assets back to us we may incur a loss on the transaction equal to the amount of the haircut (assuming there was no change in the value of the assets). We would also lose money on a repurchase transaction if the value of the underlying assets has declined as of the end of the transaction term, as we would have to repurchase the assets for their initial value but would receive assets worth less than that amount. Further, if we default on one of our obligations under a repurchase transaction, the lender can terminate all of the outstanding repurchase transactions with us and can cease entering into any other repurchase transactions with us. Our repurchase agreements contain cross-default provisions, so that if a default occurs under any one agreement, the lenders under our other agreements could also declare a default. Any losses we incur on our repurchase transactions could have a material and adverse effect on our business, our results of operations and financial condition.
Interest rate fluctuations could negatively impact our net interest income, cash flows and the market value of our investments.
Our primary interest rate exposures will relate to the yield on our investments and the financing cost of our debt, as well as interest rate swaps we may utilize for hedging purposes. Changes in interest rates will affect our net interest income, which is the difference between the interest income we earn on our interest- earning investments and the interest expense we incur in financing these investments. Changes in the level of interest rates also may affect our ability to invest in assets, the value of our investments and our ability to realize gains from the disposition of assets. Changes in interest rates may also affect borrower default rates if a significant percentage of borrowers have mortgages that reset to a substantially higher interest rate and are unable to make their new monthly payments as obligated under the terms of the mortgage loan.
While the interest rates used to calculate interest expense on our financing lines are subject to floors to the extent that our financing costs will be determined by reference to floating rates (such as LIBOR or a Treasury index) plus a margin, the amount of such margin will depend on a variety of factors, including, without limitation, (1) for collateralized debt, the value and liquidity of the collateral, and for non-collateralized debt, our credit, (2) the level and movement of interest rates and (3) general market conditions and liquidity. In a period of rising interest rates, our interest expense on floating rate debt would increase, and it is possible that any additional interest income we earn on our floating rate investments may not compensate for such increase in interest expense. Furthermore, during a period of rising interest rates, the interest income we earn on our fixed rate investments would not change, the duration and weighted average life of our fixed rate investments would increase and the market value of our fixed rate investments would decrease. Similarly, in a period of declining interest rates, the interest income generated on floating rate investments would decrease, while any decrease in the interest we are charged on our floating rate debt may not compensate for such decrease in interest income and interest we are charged on our fixed rate debt would not change. Any such scenario could materially and adversely affect or business, results of operations and financial condition.
27
Interest rate mismatches between our loans and our borrowings used to fund our portfolio may reduce our income during periods of changing interest rates.
We fund some of our loan portfolio with borrowings that have interest rates based on indices and repricing terms similar to, but of shorter maturities than, the interest rate indices and repricing terms of our loans. Accordingly, if short-term interest rates increase, this may adversely affect our profitability.
The majority of our loan portfolio is comprised of adjustable rate mortgages, or ARMs. The interest rate indices and re-pricing terms of the loans and their funding sources will not be identical, thereby creating an interest rate mismatch between our assets and liabilities. There have been periods when the spread between these indices was volatile. During periods of changing interest rates, these mismatches could reduce our net income and the market price of our common stock.
Interest rate caps on our ARMs may reduce our income or cause us to suffer a loss during periods of rising interest rates.
Our ARMs are subject to periodic and lifetime interest rate caps. Periodic interest rate caps limit the amount an interest rate can increase during any given period. Lifetime interest rate caps limit the amount an interest rate can increase through maturity of a loan. Our borrowings, including our warehouse repurchase facilities and securitizations, are not subject to similar restrictions. Accordingly, in a period of rapidly increasing interest rates, the interest rates paid on our borrowings could increase without limitation while interest rate caps would limit the interest rates on our ARMs. This problem is magnified for our ARMs that are not fully indexed. As a result, we could receive less cash income on ARMs than we need to pay interest on our related borrowings. These factors could lower our net interest income or cause us to suffer a loss during periods of rising interest rates.
Our existing and future financing arrangements and any debt securities we may issue could restrict our operations and expose us to additional risk.
Our existing and future financing arrangements (including term loan facilities, revolving credit facilities, warehouse repurchase facilities and securitizations) and any debt securities we may issue in the future are or will be governed by a credit agreement, indenture or other instrument containing covenants restricting our operating flexibility. Additionally, any convertible or exchangeable securities that we issue in the future may have rights, preferences and privileges more favorable than those of our common stock. We will bear the cost of issuing and servicing such credit facilities, arrangements or securities.
Under our warehouse repurchase facilities, the lenders have specific rights, including but not limited to, the right to review assets for which we are seeking financing, the right to hold a perfected security interest in certain of our assets, the right to accelerate payments due under the warehouse repurchase facilities, the right to restrict dividend payments made to us by certain of our wholly owned subsidiaries and the right to approve the sale of assets. We are a holding company that conducts all of our operations through wholly owned subsidiaries. Although our warehouse repurchase facilities do not limit our rights to pay dividends directly to stockholders, restrictions on our subsidiaries paying dividends to us limits our ability to receive cash from such wholly owned subsidiaries. These restrictive covenants and operating restrictions could have a material adverse effect on our business and operating results, restrict our ability to finance or securitize new originations and acquisitions, force us to liquidate collateral.
We may use derivative instruments, which could subject us to increased risk of loss.
We may use derivative instruments to help manage interest rate exposure. The prices of derivative instruments, including futures and options, are highly volatile. Payments made pursuant to swap agreements may also be highly volatile. In addition, our derivative instruments are subject to the risk of the failure of the exchanges on which our positions trade or of our clearinghouses or counterparties. Our option transactions may be part of a hedging strategy (i.e., offsetting the risk involved in another securities position) or a form of leverage, in which we will have the right to benefit from price movements in a large number of securities with a small commitment of capital. These activities involve risks that can be substantial, depending on the circumstances.
28
Uncertainty about the future of LIBOR could negatively impact our cost of funds, net interest income, cash flows and financial performance.
Borrowings under our 2019 Term Loans, revolving credit facility and warehouse repurchase facilities bear interest at rates that are calculated based on LIBOR. On July 27, 2017, the Chief Executive of the United Kingdom Financial Conduct Authority, which regulates LIBOR, announced that it intends to stop persuading or compelling banks to submit rates for the calibration of LIBOR to the administrator of LIBOR after 2021. The announcement indicates that the continuation of LIBOR in its current form cannot be assured after 2021. It is impossible to predict whether and to what extent banks will continue to provide LIBOR submissions to the administrator of LIBOR, if the administrator will continue to quote LIBOR after 2021 or, if it does continue to quote LIBOR, whether it will be determined on a consistent basis with the existing definition and will behave in a consistent manner to existing LIBOR, or whether any additional reforms to LIBOR may be enacted in the United Kingdom or elsewhere. Although alternative reference rates have been proposed, it is unknown whether these alternative reference rates will attain market acceptance as replacements of LIBOR.
If LIBOR ceases to exist, the method and rate used to calculate our interest rates and/or payments on our 2019 Term Loans, revolving credit facility and warehouse repurchase facilities in the future may result in interest rates and/or payments that are higher than, lower than, or that do not otherwise correlate over time with the interest rates and/or payments that would have been made on our obligations if LIBOR was available in its current form. Furthermore, although the variable interest component of our existing loan portfolio is based on the prime rate rather than LIBOR, uncertainty in the lending markets related to the future of LIBOR could increase the prime rate, which may increase borrower defaults and increase our credit losses. In addition, while our existing securitizations are largely fixed-rate debt, uncertainty in the lending markets related to the future of LIBOR could increase the general level of interest rates and risk spreads on our future securitizations. There is currently no definitive information regarding the future utilization of LIBOR or of any particular replacement rate. As such, the potential effect of any such event on our cost of capital, financial results, cash flows and financial performance cannot yet be determined.
Risks Relating to Regulatory Matters
The increasing number of proposed United States federal, state and local laws may affect certain mortgage-related assets in which we intend to invest and could materially increase our cost of doing business.
Various legislation, including related to federal bankruptcy law and foreclosure actions under state law, has been proposed that, among other provisions, could allow judges to modify the terms of residential mortgages in bankruptcy proceedings, could hinder the ability of the servicer to foreclose promptly on defaulted mortgage loans or permit limited assignee liability for certain violations in the mortgage loan origination process, any or all of which could adversely affect our business or result in us being held responsible for violations in the mortgage loan origination process even where we were not the originator of the loan. We do not know what impact this type of legislation, which has been primarily, if not entirely, focused on residential mortgage originations, would have on the investor real estate loan market. We are unable to predict whether United States federal, state or local authorities, or other pertinent bodies, will enact legislation, laws, rules, regulations, handbooks, guidelines or similar provisions that will affect our business or require changes in our practices in the future, and any such changes could materially and adversely affect our cost of doing business and profitability. We may be subject to liability for potential violations of various lending laws, which could adversely impact our business, results of operations and financial condition.
Mortgage loan originators and servicers operate in a highly regulated industry and are required to comply with various federal, state and local laws and regulations. If any of our loans are found to have been originated, serviced or owned by us or a third-party in violation of applicable law, we could be subject to lawsuits or governmental actions, or we could be fined or incur losses. In respect of our mortgage loan originations and acquisitions, if any third-party mortgage brokers, originators or servicers fail to comply with applicable law, it could subject us, as lender, assignee or purchaser of the related mortgage loans, to monetary penalties or other losses. Any such outcome could have a material and adverse effect on our business, results of operations and financial condition.
29
The securitization process is subject to an evolving regulatory environment that may affect certain aspects of our current business.
As a result of the dislocation of the credit markets during the previous recession, and in anticipation of more extensive regulation, including regulations promulgated pursuant to the Dodd-Frank Act, the securitization industry has crafted and continues to craft changes to securitization practices, including changes to representations and warranties in securitization transaction documents, new underwriting guidelines and disclosure guidelines. Various U.S. federal agencies, including the SEC, as well as the European Union have promulgated regulations with respect to issues that affect securitizations.
On October 21, 2014, the final rules implementing the credit risk retention requirements of Section 941 of the Dodd–Frank Act, or the U.S. Risk Retention Rules, were issued and have since become effective with respect to all asset classes. The risk retention rules generally require the sponsor of a securitization to retain not less than 5% of the credit risk of the assets collateralizing the issuer’s mortgage- backed securities. When applicable, the risk retention rules generally require the “securitizer” of a “securitization transaction” to retain at least 5% of the “credit risk” of “securitized assets,” as such terms are defined for purposes of that statute, and generally prohibit a securitizer from directly or indirectly eliminating or reducing its credit exposure by hedging or otherwise transferring the credit risk that the securitizer is required to retain. Our securitizations are subject to the U.S. Risk Retention Rules and, as a result, we have retained at least 5% of the credit risk for all of our securitizations since the U.S. Risk Retention Rules went into effect. The European Union has also adopted certain risk retention and due diligence requirements in respect of various types of European Union-regulated investors that, among other things, restrict investors from taking positions in securitizations. To the extent our securitizations are marketed in Europe, we would become subject to these additional regulations, which may increase our risk retention requirements and increase the complexity and costs of new securitizations.
The current regulatory environment may be impacted by future legislative developments, such as amendments to key provisions of the Dodd-Frank Act, including provisions setting forth capital and risk retention requirements. On February 3, 2017, President Trump signed an executive order calling for the administration to review U.S. financial laws and regulations in order to determine their consistency with a set of core principles identified in the order. The full scope of President Trump’s short-term legislative agenda is not yet fully known, but it may include certain deregulatory measures for the U.S. financial services industry, including changes to the Financial Stability Oversight Board, the Volcker Rule and credit risk retention requirements, among other areas. These legislative developments or those in the European Union, and other proposed regulations affecting securitization, could alter the structure of securitizations in the future, pose additional risks to our participation in future securitizations or reduce or eliminate the economic incentives for participating in future securitizations, increase the costs associated with our origination, securitization or acquisition activities, or otherwise increase the risks or costs of our doing business.
We are subject to state licensing and operational requirements in certain states that may result in substantial compliance costs.
Although we do not engage in the highly regulated residential mortgage lending practice, we may be subject to licensing and operational requirements in certain states in which we do business. There can be no assurance that will be able to obtain any or all of the approvals and licenses that we desire or that we will avoid experiencing significant delays in seeking such approvals and licenses. In addition, in those states in which we are licensed, we are subject to periodic examinations by state regulators, which can result in refunds to borrowers of certain fees earned by us, and we may be required to pay substantial penalties imposed by state regulators due to compliance errors. Future regulatory changes may increase our costs and obligations by expanding the types of lending to which such laws apply or through stricter licensing laws, disclosure laws or increased fees, or may impose conditions to licensing that we are unable to meet. Future state legislation and changes in existing regulation may significantly increase our compliance costs or reduce the amount of ancillary fees, including late fees, that we may charge to borrowers. This could make our business cost-prohibitive in the affected state or states and could materially and adversely affect our business, results of operations and financial condition.
Any failure to obtain or maintain required licenses will restrict our options and ability to engage in desired activities, and could subject us to fines, suspensions, terminations and various other adverse actions if it is
30
determined that we have engaged without the requisite approvals or licenses in activities that required an approval or license, which could have a material and adverse effect on our business, results of operation and financial condition.
Maintenance of our Investment Company Act exclusion imposes limits on our operations, which may adversely affect our operations.
We currently conduct, and intend to continue to conduct, our operations so that neither we nor any of our subsidiaries are required to register as an investment company under the Investment Company Act of 1940, as amended, or the 1940 Act.
We believe we are not an investment company under Section 3(a)(1) of the 1940 Act because we will not engage primarily, or hold ourselves out as being engaged primarily, in the business of investing, reinvesting or trading in securities, nor will we own investment securities with a combined value in excess of 40% of the value of our total assets (exclusive of U.S. Government securities and cash items) on an unconsolidated basis. Rather, we, through our wholly owned subsidiaries, are primarily engaged in the business of originating and managing investor real estate loans.
We hold our assets primarily through direct or indirect wholly owned subsidiaries, certain of which are excluded from the definition of investment company pursuant to Section 3(c)(5)(C) and/or Section 3(c)(6) of the 1940 Act. To qualify for the exclusion pursuant to Section 3(c)(5)(C), based on positions set forth by the staff of the SEC, each such subsidiary generally is required to hold at least (i) 55% of its assets in “qualifying” real estate assets and (ii) at least 80% of its assets in “qualifying” real estate assets and “real estate-related” assets. “Qualifying” real estate assets for this purpose include mortgage loans that satisfy conditions set forth in SEC staff no-action letters and other guidance, and other assets that the SEC staff has determined are the functional equivalent of whole mortgage loans for the purposes of the 1940 Act. Section 3(c)(6) of the 1940 Act excludes, among other categories of issuers, issuers that are primarily engaged in a Section 3(c)(5)(C) business activity directly or through majority-owned subsidiaries. The SEC staff has stated in a no-action letter that an issuer that acquires whole mortgage loans that are eventually transferred into a securitization trust which it sponsors for the purpose of obtaining financing to acquire additional whole mortgage loans, may treat as qualifying real estate assets for purposes of Section 3(c)(5)(C) any securities issued by that trust that it retains because such securities are acquired as a direct result of the issuer being engaged in the business of purchasing or otherwise acquiring whole mortgage loans. As the factual basis of this no-action position aligns with our business model, we accordingly the treat mortgage backed securities issued by our securitization trusts that we have retained as qualifying real estate assets.
As a consequence of our seeking to avoid the need to register under the 1940 Act on an ongoing basis, we and/or our subsidiaries may be restricted from holding certain securities or may structure securitizations in a manner that would be less advantageous to us than would be the case in the absence of such requirements. For example, the restrictions of Section 3(c)(5)(C) may limit our and our subsidiaries’ ability to retain certain mortgage-backed securities issued by our securitization trusts. Thus, avoiding registration under the 1940 Act may hinder our ability to finance our operations using securitizations and execute our growth strategy.
There can be no assurance that we and our subsidiaries will be able to successfully maintain the exceptions to the 1940 Act we currently rely on. If it were established that we or any of our subsidiaries were operating as an unregistered investment company, there would be a risk that we would be subject to monetary penalties and injunctive relief in an action or actions brought by the SEC, that we would be unable to enforce contracts with third parties, that third parties could seek to obtain rescission of transactions undertaken during the period it was established that we were an unregistered investment company, and that we would be subject to limitations on corporate leverage that would have an adverse impact on our investment returns.
If we fail to comply with laws, regulations and market standards regarding the privacy, use, and security of customer information, or if we are the target of a successful cyber-attack, we may be subject to legal and regulatory actions and our reputation would be harmed.
We receive, maintain, and store non-public personal information of our loan applicants. The technology and other controls and processes designed to secure our customer information and to prevent, detect, and remedy any unauthorized access to that information were designed to obtain reasonable, not absolute, assurance that such
31
information is secure and that any unauthorized access is identified and addressed appropriately. We are not aware of any data breaches, successful hacker attacks, unauthorized access and misuse, or significant computer viruses affecting our networks that may have occurred in the past; however, our controls may not have detected, and may in the future fail to prevent or detect, unauthorized access to our borrower information. In addition, we are exposed to the risks of denial-of-service, or DOS, attacks and damage to or destruction of our network or other information systems. A successful DOS attack or damage to our systems could result in a delay in the processing of our business, or even lost business. Additionally, we could incur significant costs associated with the recovery from a DOS attack or damage to our systems.
If borrower information is inappropriately accessed and used by a third-party or an employee for illegal purposes, such as identity theft, we may be responsible to the affected applicant or borrower for any losses he or she may have incurred as a result of misappropriation. In such an instance, we may also be liable to a governmental authority for fines or penalties associated with a lapse in the integrity and security of our customers’ information. Additionally, if we are the target of a successful cyber-attack, we may experience reputational harm that could impact our standing with our borrowers and adversely impact our financial results.
We may be subject to liability for potential violations of predatory lending laws, which could adversely impact our business, results of operations and financial condition.
Although we have certain controls and procedures in place in order to confirm that all loans we make or acquire are undertaken for business purposes, from time to time we may inadvertently originate or acquire a loan subject to the various U.S. federal, state and local laws that have been enacted to discourage predatory lending practices. The Federal Home Ownership and Equity Protection Act of 1994, or the HOEPA, prohibits inclusion of certain provisions in residential mortgage loans that have mortgage rates or origination costs in excess of prescribed levels and requires that borrowers be given certain disclosures prior to origination. Some states have enacted, or may enact, similar laws or regulations, which in some cases impose restrictions and requirements greater than those in the HOEPA.
Risks Related to Ownership of Our Common Stock
The trading and price of our common stock has been and may continue to be volatile, which could result in substantial losses for purchasers of our common stock.
The market price of our common stock has been highly volatile and may continue to fluctuate substantially due to a number of factors such as those listed in “—Risks Related to Our Business” and the following:
|
|
• |
our operating performance and the performance of other similar companies; |
|
|
• |
actual or anticipated changes in our business strategy prospects; |
|
|
• |
actual or anticipated valuations in our quarterly operating results or dividends; |
|
|
• |
our failure to meet, or the lowering of, our earnings estimates or those of any securities analysts; |
|
|
• |
publication of research reports about the real estate industry; |
|
|
• |
speculation in the press or investment community; |
|
|
• |
equity issuances by us, or stock resales by our stockholders, or the perception that such issuances or resales could occur; |
|
|
• |
the passage of legislation or other regulatory developments that adversely affect us or the assets in which we seek to invest; |
|
|
• |
the use of significant leverage to finance our assets; |
|
|
• |
loss of a major funding source; |
|
|
• |
changes in market valuations of similar companies; |
|
|
• |
actions by our stockholders; |
32
|
|
• |
general market and economic conditions and trends including inflationary concerns, and the current state of the credit and capital markets; |
|
|
• |
actual or anticipated accounting problems; |
|
|
• |
price and volume fluctuations in the overall stock market from time to time; |
|
|
• |
additions or departures of our executive officers or key personnel; |
|
|
• |
changes in the value of our portfolio; |
|
|
• |
any shortfall in revenue or net income or any increase in losses from levels expected by investors or securities analysts; and |
|
|
• |
the realization of any other risk factor in this Annual Report. |
These broad market and industry fluctuations may materially adversely affect the market price of our common stock, regardless of our actual operating performance. In addition, price volatility may be greater if the public float and trading volume of our common stock are low. In the past, following periods of market volatility, stockholders have instituted securities class action litigation. If we were involved in securities litigation, it could have a substantial cost and divert resources and the attention of executive management from our business regardless of the outcome of such litigation.
We have incurred increased costs as a result of being a public company.
As a result of having publicly traded common stock, we are also required to comply with, and incur costs associated with such compliance with, the Sarbanes-Oxley Act, the Dodd-Frank Wall Street Reform and Consumer Protection Act, as well as rules and regulations implemented by the SEC and the NYSE. The expenses incurred by public companies generally for reporting and corporate governance purposes have been increasing. These rules and regulations have increased our legal and financial compliance costs and made some activities more time-consuming and costly. Our management will need to devote a substantial amount of time to ensure that we comply with all of these requirements, diverting the attention of management away from revenue-producing activities. These laws and regulations also could make it more difficult or costly for us to obtain certain types of insurance, including director and officer liability insurance, and we may be forced to accept reduced policy limits and coverage or incur substantially higher costs to obtain the same or similar coverage. These laws and regulations could also make it more difficult for us to attract and retain qualified persons to serve on our board of directors, our board committees or as our executive officers. Furthermore, if we are unable to satisfy our obligations as a public company, we could be subject to delisting of our common stock, fines, sanctions and other regulatory action and potentially civil litigation.
Future offerings of debt securities, which would rank senior to our common stock upon our liquidation, and future offerings of equity securities, which would dilute our existing stockholders and may be senior to our common stock for the purposes of dividend and liquidating distributions, may adversely affect the market price of our common stock.
In the future, we may attempt to increase our capital resources by making offerings of debt or additional offerings or distributions of equity securities, including commercial paper, medium-term notes, senior or subordinated notes and classes of preferred stock or common stock. Upon liquidation, holders of our debt securities and shares of preferred stock, if issued, and lenders with respect to other borrowings will receive a distribution of our available assets prior to the holders of our common stock. Additional equity offerings may dilute the holdings of our existing stockholders or reduce the market price of our common stock, or both. Our preferred stock, if issued, would likely have a preference on liquidating distributions or a preference on dividend payments that could limit our ability to make a dividend distribution to the holders of our common stock. Because our decision to issue securities in any future offering will depend on market conditions and other factors beyond our control, we cannot predict or estimate the amount, timing or nature of our future offerings. Thus, holders of our common stock bear the risk of any future offerings reducing the market price of our common stock and diluting their stock holdings in us.
33
Future sales of shares of our common stock, including by our existing stockholders, could depress the market price of our shares.
We cannot predict the effect, if any, of future sales of our common stock, or the availability of shares for future sales, on the value of our common stock. Sales of these shares by our existing stockholders, or the perception that such sales could occur, may cause the trading price of our common stock to decrease or be lower than it might be in the absence of those sales or perceptions.
As of February 29, 2020, Snow Phipps beneficially owned approximately 37% of our outstanding common stock and TOBI beneficially owned approximately 24% of our outstanding common stock. In connection with our IPO we entered into a registration rights agreement with Snow Phipps, TOBI, certain other stockholders, and certain members of our management and directors which, among other things, gives Snow Phipps and TOBI and their respective affiliates the right to cause us to file registration statements under the Securities Act covering their shares of our common stock, or to include the shares of common stock held by such stockholders in registration statements that we may file. If we were to include common stock held by such stockholders in a registration statement initiated by us, those additional shares could impair our ability to raise needed capital by depressing the price at which we could sell common stock.
You should not rely on lock-up agreements in connection with our IPO to limit the amount of common stock sold into the market.
In connection with our IPO, we, Snow Phipps, TOBI, certain other stockholders, and certain members of our management and directors entered into lock-up agreements that, subject to limited exceptions, required us and such persons not to issue, sell or transfer, as applicable, shares of our common stock or any securities convertible into or exercisable or exchangeable for our common stock, or to file a registration statement under the Securities Act with respect to our common stock or any securities convertible into or exercisable or exchangeable for our common stock, or to publicly disclose the intention to do any of the above until July 15, 2020, without the prior written consent of Wells Fargo Securities, LLC, Citigroup Global Markets Inc. and JMP Securities LLC. However, Wells Fargo Securities, LLC, Citigroup Global Markets Inc. and JMP Securities LLC may, at any time, release all or a portion of the securities subject to these lock-up agreements. If the restrictions under the lock-up agreements with the persons or entities subject to the lock-up agreements are waived or terminated, or upon expiration of the lock-up periods, approximately 11,749,994 shares will be available for sale into the market, subject only to applicable securities rules and regulations. These sales or a perception that these sales may occur could reduce the market price for our common stock.
We have not historically paid dividends on our common stock and, as a result, your only opportunity to achieve a return on your investment may be if the price of our common stock appreciates.
We have not declared or paid cash dividends to date on our common stock and do not intend to pay dividends for the foreseeable future. Instead, we anticipate that all of our earnings in the foreseeable future will be used to provide working capital, to support our operations and to finance the growth and development of our business. Any determination to declare or pay dividends in the future will be at the discretion of our board of directors, subject to applicable laws and dependent upon a number of factors, including our earnings, capital requirements, overall financial conditions and limitations in our debt instruments. In addition, our ability to pay dividends on our common stock is currently limited by the covenants of our warehouse repurchase facilities and other credit facilities and may be further restricted by the terms of any future debt or preferred securities. Accordingly, your only opportunity to achieve a return on your investment in our company may be if the market price of our common stock appreciates and you sell your shares at a profit. The market price for our common stock may never exceed, and may fall below, the price that you pay for such common stock.
If securities analysts do not publish research or reports about our business or if they downgrade our stock or our core market, our stock price and trading volume could decline.
The trading market for our common stock will rely in part on the research and reports that industry or financial analysts publish about us or our business or industry. We do not control these analysts. Furthermore, if one or more of the analysts who do cover us downgrade our stock or our industry, or the stock of any of our competitors, or
34
publish inaccurate or unfavorable research about our business or industry, the price of our stock could decline. If one or more of these analysts ceases coverage of us or fails to publish reports on us regularly, we could lose visibility in the market, which in turn could cause our stock price or trading volume to decline.
There can be no assurance that we will not inadvertently originate or acquire a consumer loan. If we were to originate or acquire such a loan, we would be required to comply with these laws and any breach of such laws could subject us to monetary penalties or give the borrowers a rescission right. Lawsuits have been brought in various states making claims against assignees or purchasers of high cost loans for violations of state law. If any of our loans are found to have been originated in violation of predatory or abusive lending laws, we could incur losses, which could materially and adversely impact our business, results of operations and financial condition.
Item 1B. Unresolved Staff Comments.
None.
Other than real estate owned in connection with our lending activities, we do not own any real property. Our corporate headquarters are located in leased space at 30699 Russell Ranch Road, Suite 295, Westlake Village, CA 91362.
From time to time, in the ordinary course of business, we are involved in various judicial, regulatory or administrative claims, proceedings and investigations. These proceedings and actions may include, among other things, allegations of violation of banking and other applicable regulations, competition law, labor laws and consumer protection laws, as well as claims or litigation relating to intellectual property, securities, breach of contract and tort. We intend to defend ourselves vigorously against any pending or future judicial, regulatory or administrative claims or proceedings. Although occasional adverse decisions or settlements may occur, our management does not believe that the final disposition of any currently pending or threatened matter will have a material adverse effect on our business, financial position, results of operations or cash flows.
Item 4. Mine Safety Disclosures.
Not applicable.
35
Item 5. Market for Registrant’s Common Equity, Related Stockholder Matters and Issuer Purchases of Equity Securities.
Market Information
Our common stock has been listed on The New York Stock Exchange (the “NYSE”) under the symbol “VEL” since January 17, 2020. Prior to that date, there was no public trading market for our common stock.
As of February 29, 2020, there were 13 holders of record of our common stock. The actual number of stockholders is greater than this number of record holders and includes stockholders who are beneficial owners but whose shares are held in street name by brokers and other nominees.
Dividend Policy
We have not declared or paid cash dividends to date on our common stock and we do not intend to pay dividends for the foreseeable future. Any future determination to declare dividends will be made at the discretion of our board of directors and will depend on our financial condition, operating results, capital requirements, general business conditions, limitations in our debt instruments and other factors that our board of directors may deem relevant.
Stock Performance Graph
We did not have a class of common stock registered under Section 12 of the Securities Act as of December 31, 2019, the close of our last completed fiscal year.
Recent Sales of Unregistered Securities
None.
Issuer Purchases of Equity Securities
None.
Use of Proceeds
On January 22, 2020, we completed our initial public offering (the “IPO”) in which we sold 7,250,000 shares of our common stock at a public offering price of $13.00 per share. On January 28, 2020, we completed the sale of an additional 1,087,500 shares of our common stock, representing the full exercise of the underwriters’ option to purchase additional shares, at a public offering price of $13.00 per share.
The offer and sale of the shares in the IPO were registered under the Securities Act pursuant to a registration statement on Form S-1 (File No. 333-234250), which was declared effective by the SEC on January 16, 2020. We received net proceeds of $87.7 million after deducting underwriting discounts and commissions of $6.6 million in respect of the initial IPO closing. We received net proceeds of $13.1 million after deducting underwriting discounts and commissions of $1.0 million in respect of the exercise of the underwriters’ option to purchase additional shares. We incurred estimated offering costs for our IPO payable by us of $5.9 million.
We utilized the net proceeds of the IPO to repay an aggregate of $75.0 million in principal amount of our outstanding 2019 Term Loans, plus related prepayment penalties and accrued interest of $0.7 million. We used the remainder of the net proceeds from the IPO for general corporate purposes, including originating or acquiring investor real estate loans. The 2019 Term Loans bear interest at a rate equal to one-month LIBOR plus 7.50% and mature in August 2024.
36
The underwriters of our IPO were Wells Fargo Securities, LLC, Citigroup Global Markets Inc. and JMP Securities LLC.
No payments were made by us to directors, officers or persons owning ten percent or more of our common stock or to their associates, or to our affiliates, other than payments in the ordinary course of business to officers for salaries and to non-employee directors pursuant to our director compensation policy.
Unregistered Sales of Equity Securities and Use of Proceeds
None.
Repurchases of Common Stock
None.
Issuer Purchases of Equity Securities
None.
Securities Authorized for Issuance under Equity Compensation Plan
For information regarding securities authorized under our equity compensation plans, please refer to Part III, Item 12.
37
Item 6. Selected Financial Data.
The consolidated statements of income information for the years ended December 31, 2019, 2018 and 2017 and the consolidated statements of financial condition information presented below as of December 31, 2019 and 2018 have been derived from our audited consolidated financial statements. The information presented below is only a summary and does not provide all of the information contained in our historical consolidated financial statements, including the related notes. You should read it in conjunction with “Management’s Discussion and Analysis of Financial Condition and Results of Operations,” and our consolidated financial statements, including the related notes, included elsewhere in this Annual Report on Form 10-K. Our historical results are not necessarily indicative of the results that may be expected for any other period in the future.
|
|
|
Year Ended December 31, |
|
|||||||||||||||||
|
Consolidated Statements of Income Information |
|
2019 |
|
|
2018 |
|
|
2017 |
|
|
2016 |
|
|
2015 |
|
|||||
|
|
|
(in thousands) |
|
|||||||||||||||||
|
Interest income |
|
$ |
157,531 |
|
|
$ |
124,722 |
|
|
$ |
97,830 |
|
|
$ |
78,418 |
|
|
$ |
55,544 |
|
|
Interest expense — portfolio related |
|
|
83,903 |
|
|
|
62,597 |
|
|
|
47,638 |
|
|
|
37,406 |
|
|
|
25,159 |
|
|
Net interest income — portfolio related |
|
|
73,628 |
|
|
|
62,125 |
|
|
|
50,192 |
|
|
|
41,012 |
|
|
|
30,385 |
|
|
Interest expense — corporate debt |
|
|
14,618 |
|
|
|
13,322 |
|
|
|
13,654 |
|
|
|
13,419 |
|
|
|
9,717 |
|
|
Net interest income |
|
|
59,010 |
|
|
|
48,803 |
|
|
|
36,538 |
|
|
|
27,593 |
|
|
|
20,668 |
|
|
Provision for loan losses |
|
|
1,139 |
|
|
|
201 |
|
|
|
421 |
|
|
|
1,455 |
|
|
|
378 |
|
|
Net interest income after provision for loan losses |
|
|
57,871 |
|
|
|
48,602 |
|
|
|
36,117 |
|
|
|
26,138 |
|
|
|
20,290 |
|
|
Other operating income |
|
|
|
|
|
|
|
|
|
|
|
|
|
|
|
|
|
|
|
|
|
Gain on disposition of loans |
|
|
4,410 |
|
|
|
1,200 |
|
|
|
984 |
|
|
|
196 |
|
|
|
683 |
|
|
Unrealized (loss) gain on fair value loans |
|
|
(9 |
) |
|
|
241 |
|
|
|
39 |
|
|
|
152 |
|
|
|
1,209 |
|
|
Other (expense) income |
|
|
(1,752 |
) |
|
|
1,366 |
|
|
|
985 |
|
|
|
362 |
|
|
|
272 |
|
|
Total other operating income |
|
|
2,649 |
|
|
|
2,807 |
|
|
|
2,008 |
|
|
|
710 |
|
|
|
2,164 |
|
|
|
|
|
|
|
|
|
|
|
|
|
|
|
|
|
|
|
|
|
|
|
|
Operating expenses |
|
|
|
|
|
|
|
|
|
|
|
|
|
|
|
|
|
|
|
|
|
Compensation and employee benefits |
|
|
15,511 |
|
|
|
15,105 |
|
|
|
11,904 |
|
|
|
10,085 |
|
|
|
6,617 |
|
|
Rent and occupancy |
|
|
1,531 |
|
|
|
1,320 |
|
|
|
1,115 |
|
|
|
801 |
|
|
|
500 |
|
|
Loan servicing |
|
|
7,396 |
|
|
|
6,009 |
|
|
|
4,907 |
|
|
|
3,657 |
|
|
|
3,139 |
|
|
Professional fees |
|
|
2,056 |
|
|
|
3,040 |
|
|
|
1,661 |
|
|
|
2,637 |
|
|
|
2,284 |
|
|
Real estate owned, net |
|
|
2,647 |
|
|
|
1,373 |
|
|
|
603 |
|
|
|
451 |
|
|
|
710 |
|
|
Other operating expenses |
|
|
5,981 |
|
|
|
5,313 |
|
|
|
3,946 |
|
|
|
2,420 |
|
|
|
2,050 |
|
|
Total operating expenses |
|
|
35,122 |
|
|
|
32,160 |
|
|
|
24,136 |
|
|
|
20,051 |
|
|
|
15,300 |
|
|
Income before income taxes |
|
|
25,398 |
|
|
|
19,249 |
|
|
|
13,989 |
|
|
|
6,797 |
|
|
|
7,154 |
|
|
Income tax expense |
|
|
8,106 |
|
|
|
11,618 |
|
|
|
— |
|
|
|
— |
|
|
|
— |
|
|
Net income |
|
$ |
17,292 |
|
|
$ |
7,631 |
|
|
$ |
13,989 |
|
|
$ |
6,797 |
|
|
$ |
7,154 |
|
38
|
|
|
December 31, |
|
|||||||||||||||||
|
Consolidated Statements of Financial Condition Information |
|
2019 |
|
|
2018 |
|
|
2017 |
|
|
2016 |
|
|
2015 |
|
|||||
|
|
|
(in thousands) |
|
|||||||||||||||||
|
Assets |
|
|
|
|
|
|
|
|
|
|
|
|
|
|
|
|
|
|
|
|
|
Cash and cash equivalents |
|
$ |
21,465 |
|
|
$ |
15,008 |
|
|
$ |
15,422 |
|
|
$ |
49,978 |
|
|
$ |
4,726 |
|
|
Restricted cash |
|
|
6,087 |
|
|
|
1,669 |
|
|
|
305 |
|
|
|
1,766 |
|
|
|
7,561 |
|
|
Loans held for sale, net |
|
|
214,467 |
|
|
|
78,446 |
|
|
|
5,651 |
|
|
|
— |
|
|
|
— |
|
|
Loans held for investment, net |
|
|
1,863,360 |
|
|
|
1,567,408 |
|
|
|
1,299,041 |
|
|
|
1,039,401 |
|
|
|
868,592 |
|
|
Loans held for investment at fair value |
|
|
2,960 |
|
|
|
3,463 |
|
|
|
4,632 |
|
|
|
7,278 |
|
|
|
10,143 |
|
|
Total loans, net |
|
|
2,080,787 |
|
|
|
1,649,317 |
|
|
|
1,309,324 |
|
|
|
1,046,679 |
|
|
|
878,735 |
|
|
Accrued interest receivables |
|
|
13,295 |
|
|
|
10,096 |
|
|
|
7,678 |
|
|
|
5,954 |
|
|
|
4,633 |
|
|
Receivables due from servicers |
|
|
49,659 |
|
|
|
40,473 |
|
|
|
25,306 |
|
|
|
22,234 |
|
|
|
12,667 |
|
|
Other receivables |
|
|
4,778 |
|
|
|
974 |
|
|
|
1,287 |
|
|
|
439 |
|
|
|
1,591 |
|
|
Real estate owned, net |
|
|
13,068 |
|
|
|
7,167 |
|
|
|
5,322 |
|
|
|
1,454 |
|
|
|
751 |
|
|
Property and equipment, net |
|
|
4,680 |
|
|
|
5,535 |
|
|
|
5,766 |
|
|
|
3,875 |
|
|
|
1,473 |
|
|
Net deferred tax asset |
|
|
8,280 |
|
|
|
517 |
|
|
|
— |
|
|
|
— |
|
|
|
— |
|
|
Other assets |
|
|
12,667 |
|
|
|
4,479 |
|
|
|
1,435 |
|
|
|
750 |
|
|
|
512 |
|
|
Total assets |
|
$ |
2,214,766 |
|
|
$ |
1,735,235 |
|
|
$ |
1,371,845 |
|
|
$ |
1,133,129 |
|
|
$ |
912,649 |
|
|
Liabilities and Members’ Equity |
|
|
|
|
|
|
|
|
|
|
|
|
|
|
|
|
|
|
|
|
|
Accounts payable and accrued expenses |
|
$ |
56,146 |
|
|
$ |
26,797 |
|
|
$ |
22,029 |
|
|
$ |
12,264 |
|
|
$ |
8,562 |
|
|
Secured financing, net |
|
|
145,599 |
|
|
|
127,040 |
|
|
|
126,486 |
|
|
|
119,286 |
|
|
|
96,169 |
|
|
Securitizations, net |
|
|
1,438,629 |
|
|
|
1,202,202 |
|
|
|
982,393 |
|
|
|
742,890 |
|
|
|
396,983 |
|
|
Warehouse repurchase facilities, net |
|
|
421,548 |
|
|
|
215,931 |
|
|
|
85,303 |
|
|
|
110,308 |
|
|
|
324,502 |
|
|
Total liabilities |
|
|
2,061,922 |
|
|
|
1,571,970 |
|
|
|
1,216,211 |
|
|
|
984,748 |
|
|
|
826,216 |
|
|
Commitments and contingencies |
|
|
|
|
|
|
|
|
|
|
|
|
|
|
|
|
|
|
|
|
|
Class C preferred units |
|
|
— |
|
|
|
26,465 |
|
|
|
24,691 |
|
|
|
23,036 |
|
|
|
— |
|
|
Members’ equity |
|
|
152,844 |
|
|
|
136,800 |
|
|
|
130,943 |
|
|
|
125,345 |
|
|
|
86,433 |
|
|
Total liabilities and members’ equity |
|
$ |
2,214,766 |
|
|
$ |
1,735,235 |
|
|
$ |
1,371,845 |
|
|
$ |
1,133,129 |
|
|
$ |
912,649 |
|
39
Item 7. Management’s Discussion and Analysis of Financial Condition and Results of Operations.
The following discussion and analysis of our financial condition and results of operations should be read together with “Item 6. Selected Financial Data” and the consolidated financial statements and related notes and the other financial information included elsewhere in the Annual Report on Form 10-K. This discussion contains forward-looking statements, as described under the heading “Forward-Looking Statements” that involve risks and uncertainties. Our actual results could differ materially from those anticipated in these forward-looking statements as a result of various factors, including those discussed below and elsewhere in this prospectus, particularly under “Item 1A. Risk Factors.”
Business
We are a vertically integrated real estate finance company founded in 2004. We primarily originate and manage investor loans secured by 1-4 unit residential rental and small commercial properties, which we refer to collectively as investor real estate loans. We originate loans nationwide across our extensive network of independent mortgage brokers which we have built and refined over the 15 years since our inception. Our objective is to be the preferred and one of the most recognized brands in our core market, particularly within our network of mortgage brokers.
We operate in a large and highly fragmented market with substantial demand for financing and limited supply of institutional financing alternatives. We have developed the highly-specialized skill set required to effectively compete in this market, which we believe has afforded us a durable business model capable of generating compelling risk-adjusted returns for our stockholders throughout various business cycles. We offer competitive pricing to our borrowers by pursuing low-cost financing strategies and by driving front- end process efficiencies through customized technology designed to control the cost of originating a loan. Furthermore, by originating loans through our efficient and scalable network of approved mortgage brokers, we are able to maintain a wide geographical presence and nimble operating infrastructure capable of reacting quickly to changing market environments.
Our growth strategy is predicated on continuing to serve and build loyalty within our network of mortgage brokers, while also expanding our network with new mortgage brokers through targeted marketing, improved brand awareness, and the growth and development of our team of account executives. We believe our reputation and 15-year history within our core market position us well to capture future growth opportunities.
Our primary source of revenue is interest income earned on our loan portfolio. Our typical loan is secured by a first lien on the underlying property with a personal guarantee and, based on all loans in our portfolio as of December 31, 2019, has an average balance of approximately $323,000. As of December 31, 2019, our loan portfolio, including both loans held for investment and loans held for sale, totaled $2.1 billion of UPB on properties in 45 states and the District of Columbia. The total portfolio had a weighted average loan-to-value ratio, or LTV at origination, of 65.8%, and was concentrated in 1-4 unit residential rental loans, which we refer to as investor 1-4 loans, representing 52.2% of the UPB. During the year ended December 31, 2019, the yield on our total portfolio was 8.84%.
We fund our portfolio primarily through a combination of committed and uncommitted secured warehouse repurchase facilities, securitizations, corporate debt and equity. The securitization market is our primary source of long-term financing. We have successfully executed twelve securitizations, resulting in a total of over $2.5 billion in gross debt proceeds from May 2011 through October 2019. In January 2020, we repaid $75.0 million of our existing corporate debt with a portion of the net proceeds from our IPO. In February 2020, we completed the securitization of $261.9 million of investor real estate loans, measured by UPB as of the January 1, 2020 cut-off date, issuing $248.7million of non-recourse notes payable through the Velocity Commercial Capital Loan Trust 2020-1, or 2020-1. We are the sole beneficial interest holder of 2020-1, a variable interest entity that will be included in our consolidated financial statements. We refer to this transaction as the “February 2020 Securitization.”
One of our core profitably measurements is our portfolio related net interest margin, which measures the difference between interest income earned on our loan portfolio and interest expense paid on our portfolio-related debt, relative to the amount of loans outstanding over the period. Our portfolio-related debt consists of our warehouse repurchase facilities and securitizations and excludes our corporate debt. For the year ended December 31, 2019, our portfolio related net interest margin was 4.13%. We generate profits to the extent that our portfolio related net interest income exceeds our interest expense on corporate debt, provision for loan losses and operating expenses. For the year ended December 31, 2019, we generated income before income taxes and net income of $25.4 million and $17.3 million, respectively, and earned a pre-tax return on equity and return on equity of 17.4% and 11.8%, respectively.
40
Items Affecting Comparability of Results
Due to a number of factors, our historical financial results may not be comparable, either from period to period, or to our financial results in future periods. We have summarized the key factors affecting the comparability of our financial results below.
Income Taxes
Prior to our initial public offering, the Company operated as Velocity Financial, LLC, which was formed as a Delaware Limited Liability Company, or LLC, in 2012. Until January 1, 2018, as an LLC, we had elected to be treated as a partnership for U.S. federal and state income tax purposes, and as such, had generally not been subject to federal and state income taxes prior to January 1, 2018. Accordingly, the results of operations presented for the years prior to January 1, 2018 do not include any provision for federal or state income taxes.
As part of our initial public offering, we converted Velocity Financial, LLC into a Delaware corporation and changed our name to Velocity Financial, Inc., a transaction that we refer to as the “conversion” in this Annual Report Form 10-K. The conversion is accounted for in accordance with ASC 805-50 –Business Combinations, as a transaction between entities under common control. The conversion is not expected to impact our provision for income taxes or our deferred tax assets and liabilities.
Effective January 1, 2018, we elected to be treated as a corporation for U.S. federal and state income tax purposes. Accordingly, the results of operations for the year ended December 31, 2018 include the impacts of income taxes. As a result, the historical net income reported for any period prior to January 1, 2018, is not comparable to the net income reported for the year ended December 31, 2018 or the net income anticipated in future periods.
Furthermore, in connection with the new tax treatment, we began recognizing, and will continue to recognize, deferred tax assets and liabilities for future tax consequences attributable to differences between the financial statement carrying amounts of our existing assets and liabilities and their respective tax bases. Deferred tax assets and liabilities are measured using the tax rates expected to apply to taxable income in the years in which those temporary differences are expected to be recovered or settled. The effect on deferred tax assets and liabilities of a change in tax rates is recognized in the statements of operations in the period that included the enactment date, as applicable.
Interest Expense on Corporate Debt
In 2014, we entered into a five-year, $100.0 million corporate debt agreement with the owners of our Class C preferred units, pursuant to which we issued at par senior secured notes, the 2014 Senior Secured Notes, that mature on December 16, 2019. The 2014 Senior Secured Notes bear interest, at our election, at either 10% annually paid in cash or 11% annually paid in kind.
In August 2019, we entered into a five-year $153.0 million corporate debt agreement with Owl Rock Capital Corporation (“2019 Term Loans”). The 2019 Term Loans under this agreement bear interest at a rate equal to one-month LIBOR plus 7.50% and mature in August 2024. A portion of the net proceeds from the 2019 Term Loans was used to redeem all of the outstanding 2014 Senior Secured Notes in August 2019. Another portion of the net proceeds from the 2019 Term Loans, together with cash on hand, was used to repurchase our outstanding Class C preferred units.
As of December 31, 2018, including paid-in-kind interest, the 2014 Senior Secured Notes balance was $127.6 million, and is presented as secured financing, net of debt issuance costs, on the consolidated statement of financial condition. The 2019 Term Loans balance was $153.0 million as of December 31, 2019. During the year ended December 31, 2019, we incurred $14.6 million of interest expense related to the 2014 Senior Secured Notes and the 2019 Term Loans.
We used $75.7 million of the net proceeds from our IPO to lower our interest expense through the repayment of the $75.0 million outstanding principal amount on the 2019 Term Loans.
41
January 2020 IPO
On January 16, 2020, Velocity Financial, LLC converted from a Delaware limited liability company to a Delaware corporation and changed its name to Velocity Financial, Inc. The Conversion was accounted for in accordance with ASC 805-50 –Business Combinations, as a transaction between entities under common control. All assets and liabilities of Velocity Financial, LLC were contributed to Velocity Financial, Inc. at their carrying value. The Conversion had no impact on our provision for income taxes or our deferred tax assets and liabilities. Upon completion of the Conversion, Velocity Financial, LLC’s Class A equity units of 97,513,533 and Class D equity units of 60,193,989 were converted to 11,749,994 shares of Velocity Financial, Inc. common stock. On January 22, 2020, we completed our initial public offering (“IPO”). The net proceeds received from the sale of our common stock in the IPO was $100.7 million, including $13.1 million from the underwriters fully exercising their over-allotment option to purchase an additional 1,087,500 shares of our common stock. The proceeds were net of underwriting discounts and commissions and offering expenses payable by us.
We used $75.7 million of the net proceeds from our IPO to repay $75.0 million principal amount of our outstanding 2019 Term Loans described below (plus $0.7 million for related prepayment penalties and accrued interest), and the remainder for general corporate purposes, including originating or acquiring investor real estate loans. The 2019 Term Loans bear interest at a rate equal to one-month LIBOR plus 7.50% and mature in August 2024.
Strategies to Address Uncertainties Caused by COVID-19
The COVID-19 outbreak has caused significant disruption in business activity and the financial markets both globally and in the United States. As a result of the spread of COVID-19, economic uncertainties have arisen which are likely to negatively impact our financial condition, results of operations and cash flows. The extent of the impact of COVID-19 on our operational and financial performance will depend on certain developments, including the duration and spread of the outbreak and impact on our customers, employees and vendors, all of which is uncertain at this time and cannot be predicted. The extent to which COVID-19 may impact our financial condition or results of operations cannot be reasonably estimated at this time. For more information on the potential impacts of the COVID-19 outbreak on our business see “Item 1A. Risk Factors—The outbreak of the recent coronavirus, COVID-19, or an outbreak of another highly infectious or contagious disease, could adversely affect our business, financial condition, results of operations and cash flow, and limit our ability to obtain additional financing.”
We have proactively executed a number of business initiatives to strengthen our liquidity position and re-focus our business strategies in light of the effects of the COVID-19 pandemic, including the following:
|
|
• |
On April 6, 2020, we entered into amendments to the master repurchase agreements on both of our warehouse repurchase agreements with the lenders under such agreements. We believe that the amended warehouse repurchase agreements provide us with a flexible and more stabilized financing solution that will allow us to better operate our business under the current market conditions. For more information about the amended warehouse repurchase agreements see “—Liquidity and Capital Resources—Warehouse Repurchase Facilities” below. |
42
Critical Accounting Policies and Use of Estimates
The preparation of financial statements in accordance with U.S. GAAP requires certain judgments and assumptions, based on information available at the time of preparation of the consolidated financial statements, in determining accounting estimates used in preparation of the consolidated financial statements. The following discussion addresses the accounting policies that we believe apply to us based on the nature of our operations. Our most critical accounting policies involve decisions and assessments that could affect our reported assets and liabilities, as well as our reported revenues and expenses. We believe that all of the decisions and assessments used to prepare the company’s financial statements are based upon reasonable assumptions given the information available at that time. We believe the following are critical accounting policies that require the most significant judgments and estimates used in the preparation of the consolidated financial statements. The summary below should be read in conjunction with the disclosure of our accounting policies and use of estimates in Note 2 to the consolidated financial statements.
Allowance for Loan Losses
The allowance for loan and lease losses, or ALLL, on loans held for investment is maintained at a level deemed adequate by management to provide for probable and inherent losses in the portfolio at the balance sheet date. The ALLL has a general reserve component for loans with no credit impairment and a specific reserve component for loans determined to be impaired.
The allowance methodology for the general reserve component includes both quantitative and qualitative loss factors which are applied to the population of unimpaired loans to estimate the general reserves. The quantitative loss factors include loan type, age of the loan, borrower FICO score, past loan loss experience, historical default rates, and delinquencies. The qualitative loss factors consider, among other things, the loan portfolio composition and risk, current economic conditions that may affect the borrower’s ability to pay, and the underlying collateral value. While our management uses available information to estimate its required ALLL, future additions to the ALLL may be necessary based on changes in estimates resulting from economic and other conditions. The provision for loan losses and recoveries of previously recognized charge-offs are added to the ALLL, while charge-offs on loans are recorded as a reduction to ALLL.
Loans are considered impaired when, based on current information and events, it is probable that we will be unable to collect the scheduled payments of principal and interest according to the contractual terms of the loan agreements. Impairment is measured on a loan-by-loan basis by comparing the estimated fair value of the underlying collateral, net of estimated selling costs (net realizable value) against the recorded investment of the loan. To the extent the recorded investment of the loan exceeds the estimated fair value, a specific reserve or charge-off is recorded depending upon either the certainty of the estimate of loss or the fair value of the loan’s collateral.
Deferred Income Tax Assets and Liabilities
Our deferred income tax assets and liabilities arise from differences between the financial statement carrying amounts of existing assets and liabilities and their respective tax bases. Deferred tax assets and liabilities are measured using enacted tax rates expected to apply to taxable income in the years in which those temporary differences are expected to be recovered or settled. We determine whether a deferred tax asset is realizable based on facts and circumstances, including our current and projected future tax position, the historical level of our taxable income, and estimates of our future taxable income. In most cases, the realization of deferred tax assets is based on our future profitability. If we were to experience either reduced profitability or operating losses in a future period,
43
the realization of our deferred tax assets may no longer be considered more likely than not and, accordingly, we could be required to record a valuation allowance on our deferred tax assets by charging earnings.
How We Assess Our Business Performance
Net income is the primary metric by which we assess our business performance. Accordingly, we closely monitor the primary drivers of net income which consist of the following:
Net Interest Income
Net interest income is the largest contributor to our net income and is monitored on both an absolute basis and relative to provisions for loan losses and operating expenses. We generate net interest income to the extent that the rate at which we lend in our portfolio exceeds the cost of financing our portfolio, which we primarily achieve through long-term securitizations. Accordingly, we closely monitor the financing markets and maintain consistent dialogue with investors and financial institutions as we evaluate our financing sources and cost of funds.
To evaluate net interest income, we measure and monitor: (1) the yields on our loans, (2) the costs of our funding sources, (3) our net interest spread and (4) our net interest margin. Net interest spread measures the difference between the rates earned on our loans and the rates paid on our funding sources. Net interest margin measures the difference between our annualized interest income and annualized interest expense, or net interest income, as a percentage of average loans outstanding over the specified time period.
Periodic changes in net interest income are primarily driven by: (1) origination volume and changes in average outstanding loan balances and (2) interest rates and changes in interest earned on our portfolio or paid on our debt. Historically, origination volume and portfolio size have been the largest contributors to the growth in our net interest income. We measure net interest income before and after interest expense related to our corporate debt and before and after our provisions for loan losses.
Credit Losses
We strive to minimize actual credit losses through our rigorous screening and underwriting process and life of loan portfolio management and special servicing practices. We closely monitor the credit performance of our loan portfolio, including delinquency rates and expected and actual credit losses, as a key factor in assessing our overall business performance.
Operating Expenses
We incur operating expenses from compensation and benefits related to our employee base, rent and other occupancy costs associated with our leased facilities, our third-party primary loan servicing vendors, professional fees to the extent we utilize third-party legal, consulting and advisory firms, and costs associated with the resolution and disposition of real estate owned, among other items. We monitor and strive to prudently manage operating expenses and to balance current period profitability with investment in the continued development of our platform. Because volume and portfolio size determine the magnitude of the impact of each of the above factors on our earnings, we also closely monitor origination volume along with all key terms of new loan originations, such as interest rates, loan-to-value ratios, estimated credit losses and expected duration.
Factors Affecting Our Results of Operations
We believe there are a number of factors that impact our business, including those discussed below and in this Form 10K titled “Item 1A Risk Factors.”
Our results of operations depend on, among other things, the level of our net interest income, the credit performance of our loan portfolio and the efficiency of our operating platform. These measures are affected by a number of factors, including the demand for investor real estate loans, the competitiveness of the market for originating or acquiring investor real estate loans, the cost of financing our portfolio, the availability of funding
44
sources and the underlying performance of the collateral supporting our loans. While we have been successful at managing these elements in the past, there are certain circumstances beyond our control, including the current disruption caused by the COVID-19 pandemic, macroeconomic conditions and market fundamentals, which can affect each of these factors and potentially impact our business performance.
Origination Volume
Portfolio related net interest income is the largest contributor to our net income. We have grown our portfolio related net interest income by $11.5 million or 18.5% from $62.1 million for the year ended December 31, 2018 to $73.6 million for the year ended December 31, 2019. Our portfolio related net interest income grew by $11.9 million or 23.8% from $50.2 million for the year ended December 31, 2018 to $62.1 million for the year ended December 31, 2018. The growth in net interest income is largely attributable to our growth in loan originations which we have achieved by executing our principal strategies of expanding our broker network and further penetrating our network of existing brokers. We anticipate that our future performance will continue to depend on growing our origination volume and believe that the large and highly fragmented nature of our core market provides meaningful opportunity to achieve this. We intend to grow originations by continuing to serve and build loyalty within our existing network of brokers while expanding our network with new brokers through targeted marketing and improved brand awareness.
Our future performance could be impacted to the extent that our origination volumes decline as we rely on new loans to offset maturities and prepayments in our existing portfolio. To augment our core origination business, we continually assess opportunities to acquire portfolios of loans that meet our investment criteria. In our experience, portfolio acquisition opportunities have generally been more attractive and plentiful during market conditions when origination opportunities are less favorable. Accordingly, we believe our acquisition strategy not only expands our core business, but also provides a counter-cyclical benefit.
Competition
The investor real estate loan market is highly competitive which could affect our profitability and growth. We believe we compete favorably through diversified borrower access driven by our extensive network of mortgage brokers and by emphasizing a high level of real estate and financial expertise, customer service, and flexibility in structuring transactions, as well as by attracting and retaining experienced managerial and marketing personnel. However, some of our competitors may be better positioned to market their services and financing programs because of their ability to offer more favorable rates and terms and other services.
Availability and Cost of Funding
Our primary funding sources have historically included cash from operations, warehouse repurchase facilities, term securitizations, corporate debt and equity. We believe we have an established brand in the term securitization market and that this market will continue to support our portfolio growth with long-term financing. Changes in macroeconomic conditions can adversely impact our ability to issue securitizations and, thereby, limit our options for long-term financing. In consideration of this potential risk, we have entered into a credit facility for longer-term financing that will provide us with capital resources to fund loan growth in the event we are not able to issue securitizations.
We used $75.7 million of the net proceeds from our IPO to lower our interest expense through the repayment of $75.0 million in outstanding principal amount on the 2019 Term Loans.
Loan Performance
We underwrite and structure our loans to minimize potential losses. We believe our fully amortizing loan structures and avoidance of large balloon payments, coupled with meaningful borrower equity in properties, limit the probability of losses and that our proven in-house asset management capability allows us to minimize potential losses in situations where there is insufficient equity in the property. Our income is highly dependent upon
45
borrowers making their payments and resolving delinquent loans as favorably as possible. Macroeconomic conditions can, however, impact credit trends in our core market and have an adverse impact on financial results.
Macroeconomic Conditions
The investor real estate loan market may be impacted by a wide range of macroeconomic factors such as interest rates, residential and commercial real estate prices, home ownership and unemployment rates, and availability of credit, among others. We believe our prudent underwriting, conservative loan structures and interest rate protections, and proven in-house asset management capability leave us well positioned to manage changing macroeconomic conditions.
Operating Efficiency
We generate positive operating leverage to the extent that our revenue grows at a faster rate than our expenses. We believe our platform is highly scalable and that we can generate positive operating leverage in future periods, primarily due to the technology and other investments we have made in our platform to date and our focus on a scalable, cost-effective mortgage broker network to generate new loan originations.
Portfolio and Asset Quality
Key Portfolio Statistics
|
|
|
December 31, |
|
|||||||||
|
|
|
2019 |
|
|
2018 |
|
|
2017 |
|
|||
|
|
|
($ in thousands) |
|
|||||||||
|
Total loans |
|
$ |
2,059,344 |
|
|
$ |
1,631,326 |
|
|
$ |
1,295,567 |
|
|
Loan count |
|
|
6,373 |
|
|
|
5,171 |
|
|
|
4,136.00 |
|
|
Average loan balance |
|
$ |
323 |
|
|
$ |
315 |
|
|
$ |
313 |
|
|
Weighted average loan-to-value |
|
|
65.8 |
% |
|
|
63.8 |
% |
|
|
64.4 |
% |
|
Weighted average coupon |
|
|
8.69 |
% |
|
|
8.56 |
% |
|
|
8.33 |
% |
|
Nonperforming loans (UPB) |
|
$ |
141,607 |
|
|
$ |
95,385 |
|
|
$ |
74,943 |
|
|
Nonperforming loans (% of total) |
|
|
6.88 |
% |
|
|
5.85 |
% |
|
|
5.78 |
% |
Total Loans. Total loans reflects the aggregate UPB at the end of the period. It excludes deferred origination costs, acquisition discounts, fair value adjustments and allowance for loan losses.
Loan Count. Loan count reflects the number of loans at the end of the period. It includes all loans with an outstanding principal balance.
Average Loan Balance. Average loan balance reflects the average UPB at the end of the period (i.e., total loans divided by loan count).
Weighted Average Loan-to-Value. Loan-to-value, or LTV, reflects the ratio of the original loan amount to the appraised value of the underlying property at the time of origination. In instances where the LTV at origination is not available for an acquired loan, the LTV reflects our best estimate of value at the time of acquisition. Weighted average LTV is calculated for the population of loans outstanding at the end of each specified period using the original loan amounts and appraised LTVs at the time of origination of each loan. LTV is a key statistic because requiring the borrower to invest more equity in the collateral minimizes our exposure for future credit losses.
Nonperforming Loans. Loans that are 90 or more days past due, in bankruptcy, or in foreclosure are not accruing interest and are considered nonperforming loans. The dollar amount of nonperforming loans presented in the table above reflects the UPB of all loans that meet this definition.
46
The following table presents new loan originations and acquisitions and includes average loan size, weighted average coupon and weighted average loan-to-value for the periods indicated:
|
($ in thousands) |
|
Loan Count |
|
|
Loan Balance |
|
|
Average Loan Size |
|
|
Weighted Average Coupon |
|
|
Weighted Average LTV |
|
|||||
|
Year Ended December 31, 2019: |
|
|
|
|
|
|
|
|
|
|
|
|
|
|
|
|
|
|
|
|
|
Loan originations — held for investment |
|
|
1,881 |
|
|
$ |
673,877 |
|
|
$ |
358 |
|
|
|
8.5 |
% |
|
|
67.1 |
% |
|
Loan originations — held for sale |
|
|
1,152 |
|
|
$ |
338,846 |
|
|
$ |
294 |
|
|
|
10.0 |
% |
|
|
68.4 |
% |
|
Total loan originations |
|
|
3,033 |
|
|
$ |
1,012,723 |
|
|
$ |
334 |
|
|
|
9.0 |
% |
|
|
67.5 |
% |
|
Loan acquisitions — held for investment |
|
|
35 |
|
|
$ |
9,062 |
|
|
$ |
259 |
|
|
|
7.2 |
% |
|
|
61.9 |
% |
|
Total loans originated and acquired |
|
|
3,068 |
|
|
$ |
1,021,785 |
|
|
|
|
|
|
|
|
|
|
|
|
|
|
Year Ended December 31, 2018: |
|
|
|
|
|
|
|
|
|
|
|
|
|
|
|
|
|
|
|
|
|
Loan originations — held for investment |
|
|
1,708 |
|
|
$ |
587,241 |
|
|
$ |
344 |
|
|
|
8.4 |
% |
|
|
63.4 |
% |
|
Loan originations — held for sale |
|
|
619 |
|
|
$ |
150,056 |
|
|
$ |
242 |
|
|
|
9.9 |
% |
|
|
65.1 |
% |
|
Total loan originations |
|
|
2,327 |
|
|
$ |
737,297 |
|
|
$ |
317 |
|
|
|
8.7 |
% |
|
|
63.8 |
% |
|
Loan acquisitions — held for investment |
|
|
19 |
|
|
$ |
16,243 |
|
|
$ |
855 |
|
|
|
7.3 |
% |
|
|
53.5 |
% |
|
Total loans originated and acquired |
|
|
2,346 |
|
|
$ |
753,540 |
|
|
|
|
|
|
|
|
|
|
|
|
|
|
Year Ended December 31, 2017: |
|
|
|
|
|
|
|
|
|
|
|
|
|
|
|
|
|
|
|
|
|
Loan originations — held for investment |
|
|
1,630 |
|
|
$ |
511,284 |
|
|
$ |
314 |
|
|
|
8.4 |
% |
|
|
64.3 |
% |
|
Loan originations — held for sale |
|
|
176 |
|
|
$ |
43,426 |
|
|
$ |
247 |
|
|
|
9.6 |
% |
|
|
69.7 |
% |
|
Total loan originations |
|
|
1,806 |
|
|
$ |
554,710 |
|
|
$ |
307 |
|
|
|
8.5 |
% |
|
|
64.7 |
% |
|
Loan acquisitions — held for investment |
|
|
6 |
|
|
|
985 |
|
|
$ |
164 |
|
|
|
6.9 |
% |
|
|
64.4 |
% |
|
Total loans originated and acquired |
|
|
1,812 |
|
|
$ |
555,695 |
|
|
|
|
|
|
|
|
|
|
|
|
|
Over the periods shown, we have increased our origination volume by executing our strategy of continuing to serve and build loyalty within our network of mortgage brokers, while also expanding our network with new mortgage brokers through improved brand recognition. For the year ended December 31, 2019, we originated $1.0 billion of loans, which was an increase of $275.4 million, or 37.4% from $737.3 million for the year ended December 31, 2018. For the year ended December 31, 2018, we originated $737.3 million of loans, which was an increase of $182.6 million, or 32.9%, from $554.7 million for the year ended December 31, 2017.
Loans Held for Investment
Our total portfolio of loans held for investment consists of both loans held for investment at cost, which are presented in the consolidated financial statements as loans held for investment, net, and loans held for investment at fair value, which are presented in the financial statements as loans held for investment at fair value. The following tables show the various components of loans held for investment as of the dates indicated:
|
|
|
December 31, |
|
|||||||||
|
(in thousands) |
|
2019 |
|
|
2018 |
|
|
2017 |
|
|||
|
Unpaid principal balance |
|
$ |
1,843,290 |
|
|
$ |
1,551,866 |
|
|
$ |
1,289,739 |
|
|
Discount on acquired loans |
|
|
— |
|
|
|
(541 |
) |
|
|
(911 |
) |
|
Valuation adjustments on FVO loans |
|
|
(444 |
) |
|
|
(586 |
) |
|
|
(841 |
) |
|
Deferred loan origination costs |
|
|
25,714 |
|
|
|
21,812 |
|
|
|
17,572 |
|
|
Total loans held for investment, gross |
|
|
1,868,560 |
|
|
|
1,572,551 |
|
|
|
1,305,559 |
|
|
Allowance for loan losses |
|
|
(2,240 |
) |
|
|
(1,680 |
) |
|
|
(1,886 |
) |
|
Loans held for investment, net |
|
$ |
1,866,320 |
|
|
$ |
1,570,871 |
|
|
$ |
1,303,673 |
|
47
The following table illustrates the contractual maturities for our loans held for investment in aggregate UPB and as a percentage of our total held for investment loan portfolio as of December 31, 2019:
|
contractual maturities |
|
December 31, 2019 |
|
|||||
|
|
|
UPB |
|
|
% |
|
||
|
($ in thousands) |
|
|
|
|
|
|
|
|
|
Loans due in less than one year |
|
$ |
2,170 |
|
|
|
0.1 |
% |
|
Loans due in one to five years |
|
|
3,023 |
|
|
|
0.2 |
% |
|
Loans due in more than five years |
|
|
1,838,097 |
|
|
|
99.7 |
% |
|
Total loans held for investment |
|
|
1,843,290 |
|
|
|
100.0 |
% |
Allowance for Loan Losses
Our allowance for loan losses increased to $2.2 million as of December 31, 2019, compared to $1.7 million as of December 31, 2018. The increase in allowance is primarily due to the increase in our loan portfolio from December 31, 2018 to December 31, 2019.
Our allowance decreased to $1.7 million as of December 31, 2018, compared to $1.9 million as of December 31, 2017. The decrease in the allowance for loan losses is based on an analysis of historical loan loss data from January 1, 2012 through December 31, 2019. We strive to minimize actual credit losses through our rigorous screening and underwriting process, life of loan portfolio management and special servicing practices. Additionally, we believe borrower equity of 25% to 40% provides significant protection against credit losses should a loan become impaired.
To estimate the allowance for loan losses in our loans held for investment portfolio, we follow a detailed internal process, considering a number of different factors including, but not limited to, our ongoing analyses of loans, historical loss rates, relevant environmental factors, relevant market research, trends in delinquencies, effects and changes in credit concentrations, and ongoing evaluation of fair values.
The following table illustrates the activity in our allowance for loan losses over the periods indicated:
|
|
|
December 31, |
|
|||||||||
|
($ in thousands) |
|
2019 |
|
|
2018 |
|
|
2017 |
|
|||
|
Beginning balance |
|
$ |
1,680 |
|
|
|
1,886 |
|
|
|
2,529 |
|
|
Provision for loan losses |
|
|
1,139 |
|
|
|
201 |
|
|
|
421 |
|
|
Net charge-offs |
|
|
(579 |
) |
|
|
(407 |
) |
|
|
(1,064 |
) |
|
Ending balance |
|
$ |
2,240 |
|
|
|
1,680 |
|
|
|
1,886 |
|
Credit Quality – Loans Held for Investment
The following table provides delinquency information on our held for investment loan portfolio as of the dates indicated:
|
|
|
December 31, 2019 |
|
|
|
December 31, 2018 |
|
|
|
December 31, 2017 |
|
|
|||||||||||||||
|
Current |
|
$ |
1,559,373 |
|
|
|
84.6 |
|
% |
|
$ |
1,358,043 |
|
|
|
87.50 |
|
% |
|
$ |
1,138,749 |
|
|
|
88.3 |
|
% |
|
30-59 days past due |
|
|
123,704 |
|
|
6.7 |
|
|
|
|
78,848 |
|
|
5.1 |
|
|
|
|
59,207 |
|
|
|
4.6 |
|
|
||
|
60-89 days past due |
|
|
48,062 |
|
|
2.6 |
|
|
|
|
23,881 |
|
|
1.5 |
|
|
|
|
18,467 |
|
|
|
1.4 |
|
|
||
|
Nonperforming loans: |
|
|
|
|
|
|
|
|
|
|
|
|
|
|
|
|
|
|
|
|
|
|
|
|
|
|
|
|
90+ days past due |
|
|
24,790 |
|
|
1.3 |
|
|
|
|
16,181 |
|
|
1 |
|
|
|
|
22,114 |
|
|
|
1.7 |
|
|
||
|
Bankruptcy |
|
|
8,695 |
|
|
0.5 |
|
|
|
|
5,901 |
|
|
0.4 |
|
|
|
|
5,631 |
|
|
|
0.5 |
|
|
||
|
In foreclosure |
|
|
78,666 |
|
|
4.3 |
|
|
|
|
69,012 |
|
|
4.5 |
|
|
|
|
45,571 |
|
|
|
3.5 |
|
|
||
|
Total nonperforming loans |
|
|
112,151 |
|
|
6.1 |
|
|
|
|
91,094 |
|
|
5.9 |
|
|
|
|
73,316 |
|
|
|
5.7 |
|
|
||
|
Total loans held for investment |
|
$ |
1,843,290 |
|
|
|
100 |
|
% |
|
$ |
1,551,866 |
|
|
|
100 |
|
% |
|
$ |
1,289,739 |
|
|
|
100 |
|
% |
48
Loans that are 90+ days past due, in bankruptcy, or in foreclosure are not accruing interest and are considered nonperforming loans. Nonperforming loans were $112.2 million, or 6.1% of our held for investment loan portfolio as of December 31, 2019, compared to $91.1 million, or 5.9% as of December 31, 2018, and $73.3 million, or 5.7% of the loan portfolio as of December 31, 2017. We believe the significant equity cushion at origination and the active management of loans will continue to minimize credit losses on the resolution of defaulted loans and disposition of REO properties.
Historically, most loans that become nonperforming resolve prior to converting to REO. This is due to low LTVs at origination and our active management of the portfolio. The following table summarizes the cumulative number and UPB of all loans originated since January 1, 2013 that became nonperforming at some point through December 31, 2019. We classify a loan as nonperforming when it becomes 90 days delinquent or when it enters bankruptcy or foreclosure. Of the 899 loans totaling $334.6 million in UPB that became nonperforming over the specified period, we have resolved 493 loans totaling $183.8 million in UPB, or 54.9% of the cumulative nonperforming loans. We realized a net gain of $6.0 million, or 3.3% of the resolved principal balance, on these resolutions, which is largely the result of collecting default interest and prepayment penalties in excess of the contractual interest due and collected.
|
($ in thousands) |
|
Loan Count |
|
UPB (1) |
|
|
% of Total Resolved UPB |
|
|
|
Gain / (Loss) ($) |
|
|
Gain / (Loss) ($) |
|
|
||||
|
Resolved — paid in full |
|
347 |
|
$ |
137,459 |
|
|
|
74.8 |
|
% |
|
$ |
7,343 |
|
|
|
5.3 |
|
% |
|
Resolved — paid current |
|
112 |
|
|
32,505 |
|
|
|
17.7 |
|
|
|
|
511 |
|
|
|
1.6 |
|
% |
|
Resolved — REO sold |
|
34 |
|
|
13,862 |
|
|
|
7.5 |
|
|
|
|
(1,877 |
) |
|
|
(13.5 |
) |
% |
|
Total resolutions |
|
493 |
|
|
183,826 |
|
|
100 |
|
% |
|
|
5,977 |
|
|
|
3.3 |
|
% |
|
|
Not yet resolved |
|
406 |
|
|
150,811 |
|
|
|
|
|
|
|
|
|
|
|
|
|
|
|
|
Cumulative nonperforming loans (2) |
|
899 |
|
$ |
334,637 |
|
|
|
|
|
|
|
|
|
|
|
|
|
|
|
|
(1) |
Reflects the unpaid principal balance at time of delinquency. |
|
(2) |
Reflects all loans originated since 2013 that became nonperforming at some point on or prior to December 31, 2019. |
Our actual losses incurred are very small as a percentage of all loans that have ever become nonperforming. The table below shows our actual loan losses from January 1, 2013 through December 31, 2019, and through the years ended December 31, 2018, 2017 and 2016. Our average annual charge-off percentage since January 1, 2013 is approximately 0.02%. The table includes all loans originated over those periods, the year-end UPB amounts, the amount of loans that were ever nonperforming during those periods, and the actual losses for all loans that were either liquidated or converted to REO (life of loan) during the periods.
|
($ in thousands) |
|
January 1, 2013 to December 31, 2019 |
|
|
|
January 1, 2013 to December 31, 2018 |
|
|
|
January 1, 2013 to December 31, 2017 |
|
|
|
January 1, 2013 to December 31, 2016 |
|
|
||||
|
Loan originations |
|
$ |
3,046,257 |
|
|
|
$ |
2,373,034 |
|
|
|
$ |
1,786,023 |
|
|
|
$ |
1,274,509 |
|
|
|
End of period UPB |
|
|
1,792,789 |
|
|
|
|
1,502,526 |
|
|
|
|
1,248,087 |
|
|
|
|
982,191 |
|
|
|
Nonperforming loans(1) |
|
|
334,637 |
|
|
|
|
227,469 |
|
|
|
|
152,209 |
|
|
|
|
76,449 |
|
|
|
Cumulative charge-offs(2) |
|
|
2,255 |
|
|
|
|
1,551 |
|
|
|
|
1,171 |
|
|
|
|
326 |
|
|
|
Average annual charge-offs(3) |
|
|
322 |
|
|
|
|
258 |
|
|
|
|
234 |
|
|
|
|
81 |
|
|
|
Cumulative charge-off percentage(4) |
|
|
0.13 |
|
% |
|
|
0.10 |
|
% |
|
|
0.09 |
|
% |
|
|
0.03 |
|
% |
|
Average annual charge-off percentage(5) |
|
|
0.02 |
|
% |
|
|
0.02 |
|
% |
|
|
0.02 |
|
% |
|
|
0.01 |
|
% |
|
(1) |
Reflects UPB of all loans originated since January 1, 2013 that became nonperforming at some point during the period indicated. |
|
(2) |
Reflects the total charge-offs on loans that were nonperforming and have been liquidated or converted to REO from January 1, 2013 through the date indicated. |
|
(3) |
Reflects the average annual charge-offs on loans that were nonperforming and have been liquidated or converted to REO from January 1, 2013 through the date indicated. |
|
(4) |
Reflects the cumulative charge-offs as a percent of the end of period UPB. |
|
(5) |
Reflects the average annual charge-offs as a percent of the end of period UPB. |
49
Concentrations – Loans Held for Investment
As of December 31, 2019, our held for investment loan portfolio was concentrated in investor 1-4 loans, representing 46.6% of the UPB. Mixed used properties represented 13.6% of the UPB and multifamily properties represented 10.7% of the UPB. No other property type represented more than 10.0% of our held for investment loan portfolio. By geography, the principal balance of our loans held for investment were concentrated 23.7% in New York, 22.2% in California, 12.1% in Florida, and 8.1% in New Jersey.
|
Property Type |
|
December 31, 2019 |
|
|
|||||||||
|
($ in thousands) |
|
Loan Count |
|
|
UPB |
|
|
% of Total UPB |
|
|
|||
|
Investor 1-4 |
|
|
3,245 |
|
|
$ |
859,417 |
|
|
|
46.6 |
|
% |
|
Mixed use |
|
|
666 |
|
|
|
251,339 |
|
|
|
13.6 |
|
|
|
Multifamily |
|
|
475 |
|
|
|
198,018 |
|
|
|
10.7 |
|
|
|
Retail |
|
|
417 |
|
|
|
179,778 |
|
|
|
9.8 |
|
|
|
Office |
|
|
281 |
|
|
|
117,018 |
|
|
|
6.4 |
|
|
|
Warehouse |
|
|
192 |
|
|
|
100,853 |
|
|
|
5.5 |
|
|
|
Other(1) |
|
|
364 |
|
|
|
136,867 |
|
|
|
7.4 |
|
|
|
Total loans held for investment |
|
|
5,640 |
|
|
$ |
1,843,290 |
|
|
|
100 |
|
% |
|
(1) |
All other properties individually comprise less than 5.0% of the total unpaid principal balance. |
|
Geography (State) |
|
December 31, 2019 |
|
|
|||||||||
|
($ in thousands) |
|
Loan Count |
|
|
UPB |
|
|
% of Total UPB |
|
|
|||
|
New York |
|
938 |
|
|
$ |
437,538 |
|
|
|
23.7 |
|
% |
|
|
California |
|
923 |
|
|
|
409,557 |
|
|
|
22.2 |
|
|
|
|
Florida |
|
794 |
|
|
|
222,224 |
|
|
|
12.1 |
|
|
|
|
New Jersey |
|
605 |
|
|
|
148,484 |
|
|
|
8.1 |
|
|
|
|
Other(1) |
|
|
2,380 |
|
|
|
625,487 |
|
|
|
33.9 |
|
|
|
Total loans held for investment |
|
|
5,640 |
|
|
$ |
1,843,290 |
|
|
|
100.0 |
|
% |
|
(1) |
All other states individually comprise less than 5.0% of the total unpaid principal balance. |
Loans Held for Sale
We started originating short-term, interest-only loans in March 2017, which we have historically aggregated and sold at a premium to par to institutional investors. During the year ended December 31, 2019 and 2018, we originated $338.8 million and $150.1 million of loans held for sale and sold $179.6 million and $72.9 million of held for sale loans, respectively. Given our increased experience providing these loans, we are currently evaluating long-term financing alternatives for these short-term, interest-only loans, and may elect to retain these loans in the future to be more consistent with our investment strategy of holding loans in our portfolio and earning a longer-term spread. As of December 31, 2019, our portfolio of loans held for sale, which were carried at the lower of cost or estimated fair value consisted of 733 loans with an aggregate UPB of $216.1 million, and carried a weighted average original loan term of 17.7 months, a weighted average coupon of 10.0%, and a weighted average LTV at origination of 68.6%.
The following tables show the various components of loans held for sale as of the dates indicated:
|
|
|
December 31, |
|
|||||||||
|
($ in thousands) |
|
2019 |
|
|
2018 |
|
|
2017 |
|
|||
|
UPB |
|
$ |
216,054 |
|
|
$ |
79,335 |
|
|
$ |
5,701 |
|
|
Valuation adjustments |
|
|
(396 |
) |
|
|
(173 |
) |
|
|
— |
|
|
Deferred loan origination fees, net |
|
|
(1,191 |
) |
|
|
(716 |
) |
|
|
(50 |
) |
|
Total loans held for sale, net |
|
$ |
214,467 |
|
|
$ |
78,446 |
|
|
$ |
5,651 |
|
50
Concentrations – Loans Held for Sale
As of December 31, 2019, our held for sale loan portfolio was entirely concentrated in investor 1-4 loans, representing 100.0% of the UPB. By geography, the principal balance of our loans held for sale were concentrated 25.2% in California, 11.5% in New York, 9.1% in Florida, 8.2% in New Jersey, and 5.2% in Massachusetts.
|
Geography (State) |
|
December 31, 2019 |
|
|
|||||||
|
($ in thousands) |
|
Loan Count |
|
UPB |
|
|
% of Total UPB |
|
|
||
|
California |
|
89 |
|
$ |
24,549 |
|
|
|
11.4 |
|
% |
|
New York |
|
56 |
|
|
55,103 |
|
|
|
25.5 |
|
|
|
Florida |
|
87 |
|
|
19,668 |
|
|
|
9.1 |
|
|
|
New Jersey |
|
75 |
|
|
17,479 |
|
|
|
8.1 |
|
|
|
Massachusetts |
|
30 |
|
|
11,363 |
|
|
|
5.2 |
|
|
|
Texas |
|
55 |
|
|
16,587 |
|
|
|
7.7 |
|
|
|
Georgia |
|
51 |
|
|
12,538 |
|
|
|
5.8 |
|
|
|
Other(1) |
|
290 |
|
|
58,767 |
|
|
|
27.2 |
|
|
|
Total loans held for sale |
|
733 |
|
$ |
216,054 |
|
|
|
100.0 |
|
% |
|
(1) |
All other states individually comprise less than 5.0% of the total UPB. |
Real Estate Owned (REO)
REO includes real estate we acquire through foreclosure or by deed-in-lieu of foreclosure. REO assets are initially recorded at fair value, less estimated costs to sell, on the date of foreclosure. Adjustments that reduce the carrying value of the loan to the fair value of the real estate at the time of foreclosure are recognized as charge-offs in the allowance for loan losses. Positive adjustments at the time of foreclosure are recognized in other operating income. After foreclosure, we periodically obtain new valuations and any subsequent changes to fair value, less estimated costs to sell, are reflected as valuation adjustments.
As of December 31, 2019, our REO included 24 properties with an estimated fair value of $13.1 million compared to 12 properties with an estimated fair value of $7.2 million as of December 31, 2018.
Key Performance Metrics
|
|
|
Year Ended December 31, |
|
|
|||||||||||
|
($ in thousands) |
|
2019 |
|
|
|
2018 |
|
|
|
2017 |
|
|
|||
|
Average loans |
|
$ |
1,782,558 |
|
|
|
$ |
1,429,877 |
|
|
|
$ |
1,167,999 |
|
|
|
Portfolio yield |
|
|
8.84 |
|
% |
|
|
8.72 |
|
% |
|
|
8.38 |
|
% |
|
Average debt — portfolio related |
|
|
1,603,459 |
|
|
|
|
1,234,818 |
|
|
|
|
965,987 |
|
|
|
Average debt — total company |
|
|
1,745,728 |
|
|
|
|
1,362,412 |
|
|
|
|
1,090,532 |
|
|
|
Cost of funds — portfolio related |
|
|
5.23 |
|
% |
|
|
5.07 |
|
% |
|
|
4.93 |
|
% |
|
Cost of funds — total company |
|
|
5.64 |
|
% |
|
|
5.57 |
|
% |
|
|
5.62 |
|
% |
|
Net interest margin — portfolio related |
|
|
4.13 |
|
% |
|
|
4.34 |
|
% |
|
|
4.30 |
|
% |
|
Net interest margin — total company |
|
|
3.31 |
|
% |
|
|
3.41 |
|
% |
|
|
3.13 |
|
% |
|
Charge-offs |
|
|
0.03 |
|
% |
|
|
0.03 |
|
% |
|
|
0.09 |
|
% |
|
Pre-tax return on equity |
|
|
17.37 |
|
% |
|
|
14.30 |
|
% |
|
|
10.80 |
|
% |
|
Return on equity |
|
|
11.78 |
|
% |
|
|
7.80 |
|
% |
|
|
10.80 |
|
% |
Average Loans
Average loans reflects the daily average of total outstanding loans, including both loans held for investment and loans held for sale, as measured by UPB, over the specified time period.
51
Portfolio yield is an annualized measure of the total interest income earned on our loan portfolio as a percentage of average loans over the given period. Interest income includes interest earned on performing loans, cash interest received on nonperforming loans, default interest and prepayment fees. The increase in our portfolio yield over the periods shown was driven by higher collections of contractual and default interest on nonperforming loans due to the efficiency and expertise of our asset management area, and, to a lesser extent, an increase in the weighted average coupon on the loans in our portfolio.
Average Debt — Portfolio Related and Total Company
Portfolio-related debt consists of borrowings related directly to financing our loan portfolio, which includes our warehouse repurchase facilities and securitizations. Total company debt consists of portfolio- related debt and corporate debt. The measures presented here reflects the monthly average of all portfolio- related and total company debt, as measured by outstanding principal balance, over the specified time period.
Cost of Funds — Portfolio Related and Total Company
Portfolio related cost of funds is an annualized measure of the interest expense incurred on our portfolio-related debt as a percentage of average portfolio-related debt outstanding over the given period. Total company cost of funds is an annualized measure of the interest expense incurred on our portfolio-related debt and corporate debt outstanding over the given period. Interest expense includes the amortization of expenses incurred in connection with our portfolio related financing activities and corporate debt. Through the issuance of long-term securitizations, we have been able to fix a significant portion of our borrowing costs over time. The strong credit performance on our securitizations has allowed us to issue debt at attractive rates. Our portfolio related cost of funds increased to 5.23% for the year ended December 31, 2019 from 5.07% and 4.93% for the years ended December 31, 2018 and 2017, respectively. The increase in portfolio related cost of funds was the result of the seasoning of older, more costly securitizations, and to a lesser extent, the increasing LIBOR index rates, partially offset by lower spreads paid to investors in our more recent securitizations. As we have continued to add more of the lower-cost securitizations, our interest cost has started to decrease, averaging 5.00% for the fourth quarter of 2019.
Net Interest Margin — Portfolio Related and Total Company
Portfolio related net interest margin measures the difference between the interest income earned on our loan portfolio and the interest expense paid on our portfolio-related debt as a percentage of average loans over the specified time period. Total company net interest margin measures the difference between the interest income earned on our loan portfolio and the interest expense paid on our portfolio-related debt and corporate debt as a percentage of average loans over the specified time period. Over the periods shown, our portfolio related net interest margin decreased as a result of the seasoning of older, more costly securitizations and, to a lesser extent, the increasing LIBOR index rates, partially offset by higher portfolio yields and lower spreads paid to investors in our more recent securitizations. In addition to achieving lower spreads in our more recent securitizations, we have also been able to utilize more favorable structures that will result in a lower and more stable cost of funds over the life of the securities.
52
The following tables show the average outstanding balance of our loan portfolio and portfolio-related debt, together with interest income and the corresponding yield earned on our portfolio, and interest expense and the corresponding rate paid on our portfolio-related debt for the periods indicated:
|
|
|
Year Ended December 31, 2019 |
|
|
Year Ended December 31, 2018 |
|
|
Year Ended December 31, 2017 |
|
|||||||||||||||||||||||||||
|
|
|
|
|
|
|
Interest |
|
|
Average |
|
|
|
|
|
|
Interest |
|
|
Average |
|
|
|
|
|
|
Interest |
|
|
Average |
|
||||||
|
|
|
Average |
|
|
Income / |
|
|
Yield / |
|
|
Average |
|
|
Income / |
|
|
Yield / |
|
|
Average |
|
|
Income / |
|
|
Yield / |
|
|||||||||
|
($ in thousands) |
|
Balance |
|
|
Expense |
|
|
Rate |
|
|
Balance |
|
|
Expense |
|
|
Rate |
|
|
Balance |
|
|
Expense |
|
|
Rate |
|
|||||||||
|
Loan portfolio: |
|
|
|
|
|
|
|
|
|
|
|
|
|
|
|
|
|
|
|
|
|
|
|
|
|
|
|
|
|
|
|
|
|
|
|
|
|
Loans held for sale |
|
$ |
106,852 |
|
|
|
|
|
|
|
|
|
|
$ |
26,306 |
|
|
|
|
|
|
|
|
|
|
$ |
3,657 |
|
|
|
|
|
|
|
|
|
|
Loans held for investment |
|
|
1,675,706 |
|
|
|
|
|
|
|
|
|
|
|
1,403,571 |
|
|
|
|
|
|
|
|
|
|
|
1,164,342 |
|
|
|
|
|
|
|
|
|
|
Total loans |
|
$ |
1,782,558 |
|
|
$ |
157,531 |
|
|
|
8.84 |
% |
|
$ |
1,429,877 |
|
|
$ |
124,722 |
|
|
|
8.72 |
% |
|
$ |
1,167,999 |
|
|
$ |
97,830 |
|
|
|
8.38 |
% |
|
|
|
|
|
|
|
|
|
|
|
|
|
|
|
|
|
|
|
|
|
|
|
|
|
|
|
|
|
|
|
|
|
|
|
|
|
|
|
Debt: |
|
|
|
|
|
|
|
|
|
|
|
|
|
|
|
|
|
|
|
|
|
|
|
|
|
|
|
|
|
|
|
|
|
|
|
|
|
Warehouse and repurchase facilities |
|
$ |
240,608 |
|
|
|
13,583 |
|
|
|
5.65 |
% |
|
$ |
171,637 |
|
|
$ |
9,213 |
|
|
|
5.37 |
% |
|
$ |
145,878 |
|
|
$ |
7,185 |
|
|
|
4.93 |
% |
|
Securitizations |
|
|
1,362,851 |
|
|
|
70,320 |
|
|
|
5.16 |
% |
|
|
1,063,181 |
|
|
|
53,384 |
|
|
|
5.02 |
% |
|
|
820,109 |
|
|
|
40,453 |
|
|
|
4.93 |
% |
|
Total debt - portfolio related |
|
|
1,603,459 |
|
|
|
83,903 |
|
|
|
5.23 |
% |
|
|
1,234,818 |
|
|
|
62,597 |
|
|
|
5.07 |
% |
|
|
965,987 |
|
|
|
47,638 |
|
|
|
4.93 |
% |
|
Corporate debt |
|
|
142,269 |
|
|
|
14,617 |
|
|
|
10.27 |
% |
|
|
127,594 |
|
|
|
13,322 |
|
|
|
10.44 |
% |
|
|
124,545 |
|
|
|
13,654 |
|
|
|
10.96 |
% |
|
Total debt |
|
$ |
1,745,728 |
|
|
$ |
98,520 |
|
|
|
5.64 |
% |
|
$ |
1,362,412 |
|
|
$ |
75,919 |
|
|
|
5.57 |
% |
|
$ |
1,090,532 |
|
|
$ |
61,292 |
|
|
|
5.62 |
% |
|
|
|
|
|
|
|
|
|
|
|
|
|
|
|
|
|
|
|
|
|
|
|
|
|
|
|
|
|
|
|
|
|
|
|
|
|
|
|
Net interest spread - portfolio related (1) |
|
|
|
|
|
|
|
|
|
|
3.60 |
% |
|
|
|
|
|
|
|
|
|
|
3.65 |
% |
|
|
|
|
|
|
|
|
|
|
3.45 |
% |
|
Net interest margin - portfolio related |
|
|
|
|
|
|
|
|
|
|
4.13 |
% |
|
|
|
|
|
|
|
|
|
|
4.34 |
% |
|
|
|
|
|
|
|
|
|
|
4.30 |
% |
|
|
|
|
|
|
|
|
|
|
|
|
|
|
|
|
|
|
|
|
|
|
|
|
|
|
|
|
|
|
|
|
|
|
|
|
|
|
|
Net interest spread - total company (2) |
|
|
|
|
|
|
|
|
|
|
3.19 |
% |
|
|
|
|
|
|
|
|
|
|
3.15 |
% |
|
|
|
|
|
|
|
|
|
|
2.76 |
% |
|
Net interest margin - total company |
|
|
|
|
|
|
|
|
|
|
3.31 |
% |
|
|
|
|
|
|
|
|
|
|
3.41 |
% |
|
|
|
|
|
|
|
|
|
|
3.13 |
% |
|
(1) |
Net interest spread — portfolio related is the difference between the rate earned on our loan portfolio and the interest rates paid on our portfolio-related debt. |
|
(2) |
Net interest spread — total company is the difference between the rate earned on our loan portfolio and the interest rates paid on our total debt. |
Charge-Offs
The charge-offs ratio reflects charge-offs as a percentage of average loans held for investment over the specified time period. We do not record charge-offs on our loans held for sale which are carried at the lower of cost or estimated fair value.
53
Pre-Tax Return on Equity and Return on Equity
Pre-tax return on equity and return on equity reflect income before income taxes and net income, respectively, as a percentage of the monthly average of members’ equity over the specified time period. The Company was not subject to income tax prior to January 1, 2018 because prior to that time it elected to be treated as a partnership for U.S. federal income tax purposes.
|
|
|
Year Ended December 31, |
|
|
||||||||||
|
($ in thousands) |
|
2019 |
|
|
|
2018 |
|
|
2017 |
|
|
|||
|
Income before income taxes (A) |
|
$ |
25,398 |
|
|
|
$ |
19,249 |
|
|
$ |
13,989 |
|
|
|
Net income (B) |
|
|
17,292 |
|
|
|
|
7,631 |
|
|
|
13,989 |
|
|
|
|
|
|
|
|
|
|
|
|
|
|
|
|
|
|
|
Monthly average balance: |
|
|
|
|
|
|
|
|
|
|
|
|
|
|
|
Members' equity (C) |
|
|
146,236 |
|
|
|
|
134,913 |
|
|
|
128,940 |
|
|
|
|
|
|
|
|
|
|
|
|
|
|
|
|
|
|
|
Pre-tax return on equity (A / C) |
|
|
17.4 |
|
% |
|
|
14.3 |
|
% |
|
10.8 |
|
% |
|
|
|
|
|
|
|
|
|
|
|
|
|
|
|
|
|
Return on equity (B / C) |
|
|
11.8 |
|
% |
|
|
5.7 |
|
% |
|
10.8 |
|
% |
Components of Results of Operations
Interest Income
We accrue interest on the UPB of our loans in accordance with the individual terms and conditions of each loan, discontinuing interest and reversing previously accrued interest once a loan becomes 90 days or more past due (nonaccrual status). When a loan is placed on nonaccrual status, the accrued and unpaid interest is reversed as a reduction to interest income and accrued interest receivable. Interest income is subsequently recognized only to the extent that cash payments are received or when the loan has returned to accrual status. Payments received on nonaccrual loans are first applied to interest due, then principal. Interest accrual resumes once a borrower has made all principal and interest payments due, bringing the loan back to current status.
Interest income on loans held for investment is comprised of interest income on loans and prepayment fees less the amortization of deferred net costs related to the origination of loans. Interest income on loans held for sale is comprised of interest income earned on loans prior to their sale. The net fees and costs associated with loans held for sale are deferred as part of the carrying value of the loan and recognized as a gain or loss on the sale of the loan.
Interest Expense — Portfolio Related
Portfolio related interest expense is incurred on the debt we incur to fund our loan origination and portfolio activities and consists of our warehouse repurchase facilities and securitizations. Portfolio related interest expense also includes the amortization of expenses incurred as a result of issuing the debt, which are amortized using the level yield method. Key drivers of interest expense include the debt amounts outstanding, interest rates, and the mix of our securitizations and warehouse liabilities.
Net Interest Income — Portfolio Related
Portfolio related net interest income represents the difference between interest income and portfolio related interest expense.
Interest Expense — Corporate Debt
Through December 31, 2019, interest expense on corporate debt primarily consists of interest expense paid with respect to the 2014 Senior Secured Notes and the 2019 Term Loans, as reflected on our consolidated statement of financial condition, and the related amortization of deferred debt issuance costs.
54
In August 2019, we redeemed the 2014 Senior Secured Notes and repurchased our outstanding Class C preferred units with the proceeds of the 2019 Term Loans, which bear interest at a rate equal to the one-month LIBOR plus 7.50% and mature in August 2024, together with cash on hand. We used $75.7 million of the net proceeds from our IPO to repay $75.0 million in outstanding principal amount on the 2019 Term Loans.
Net Interest Income
Net interest income represents the difference between portfolio related net interest income and interest expense on corporate debt.
Provision for Loan Losses
Provision for loan losses consists of amounts charged to income during the period to maintain an estimated allowance for loan and lease losses, or ALLL, to provide for probable credit losses inherent in our existing portfolio of loans held for investment (excluding those loans which we have elected to carry at fair value). The ALLL consists of a specific valuation allowance on those loans that are 90 days or more delinquent, in bankruptcy, or in foreclosure, and a general reserve allowance for all other loans in our existing portfolio.
Other Operating Income
Gain on Disposition of Loans. When we sell a loan held for sale, we record a gain or loss that reflects the difference between the proceeds received for the sale of the loans and their respective carrying values. The gain or loss that we ultimately realize on the sale of our loans held for sale is primarily determined by the terms of the originated loans, current market interest rates and the sales price of the loans. In addition, when we transfer a loan to REO, we record the REO at its fair value at the time of the transfer. The difference between the fair value of the real estate and the carrying value of the loan is recorded as a gain or loss. Lastly, when our acquired loans, which were purchased at a discount, pay off, we record a gain related the write-off of the remaining purchase discount.
Unrealized Gain/(Loss) on Fair Value Loans. We have elected to account for certain purchased distressed loans at fair value using FASB ASC Topic 825, Financial Instruments (ASC 825). We regularly estimate the fair value of these loans as discussed more fully in the notes to our consolidated financial statements included elsewhere in this prospectus. Changes in fair value are reported as a component of other operating income within our consolidated statements of operations.
Other Income. Other income includes the following:
Unrealized Gains/(Losses) on Retained Interest Only Securities. As part of the proceeds received for the sale of our held for sale loans, we may receive an interest only security that we mark to fair value at the end of each period.
Fee Income. In certain situations, we collect fee income by originating loans and realizing miscellaneous fees such as late fees.
Operating Expenses
Compensation and Employee Benefits. Costs related to employee compensation, commissions and related employee benefits, such as health, retirement, and payroll taxes.
Rent and Occupancy. Costs related to occupying our locations, including rent, maintenance and property taxes.
Loan Servicing. Costs related to our third-party servicers.
Professional Fees. Costs related to professional services, such as external audits, legal fees, tax, compliance and outside consultants.
55
Real Estate Owned, Net. Costs related to our real estate owned, net, including gains/(losses) on disposition of REO, maintenance of REO properties, and taxes and insurance.
Other Operating Expenses. Other operating expenses consist of general and administrative costs such as, travel and entertainment, marketing, data processing, insurance and office equipment.
Provision for Income Taxes
The provision for income taxes consists of the current and deferred U.S. federal and state income taxes we expect to pay, currently and in future years, with respect to the net income for the year. The amount of the provision is derived by adjusting our reported net income with various permanent differences. The tax- adjusted net income amount is then multiplied by the applicable federal and state income tax rates to arrive at the provision for income taxes. Prior to January 1, 2018, we had elected to be treated as a partnership for U.S. federal income tax purposes and were, therefore, not required to pay income taxes because of our treatment as a pass-through entity. Effective January 1, 2018, we changed our election to be taxed as a corporation for U.S. federal income tax purposes and are now recording provisions for income taxes.
Consolidated Results of Operations
The following table summarizes our consolidated results of operations for the periods indicated:
|
Summary Consolidated Results of Operations |
|
Year Ended December 31, |
|
|||||||||
|
($ in thousands) |
|
2019 |
|
|
2018 |
|
|
2017 |
|
|||
|
Interest income |
|
$ |
157,531 |
|
|
$ |
124,722 |
|
|
$ |
97,830 |
|
|
Interest expense - portfolio related |
|
|
83,903 |
|
|
|
62,597 |
|
|
|
47,638 |
|
|
Net interest income - portfolio related |
|
|
73,628 |
|
|
|
62,125 |
|
|
|
50,192 |
|
|
Interest expense - corporate debt |
|
|
14,618 |
|
|
|
13,322 |
|
|
|
13,654 |
|
|
Net interest income |
|
|
59,010 |
|
|
|
48,803 |
|
|
|
36,538 |
|
|
Provision for loan losses |
|
|
1,139 |
|
|
|
201 |
|
|
|
421 |
|
|
Net interest income after provision for loan losses |
|
|
57,871 |
|
|
|
48,602 |
|
|
|
36,117 |
|
|
Other operating income |
|
|
2,649 |
|
|
|
2,807 |
|
|
|
2,008 |
|
|
Total operating expenses |
|
|
35,122 |
|
|
|
32,160 |
|
|
|
24,136 |
|
|
Income before income taxes |
|
|
25,398 |
|
|
|
19,249 |
|
|
|
13,989 |
|
|
Income tax expense |
|
|
8,106 |
|
|
|
11,618 |
|
|
|
— |
|
|
Net income |
|
$ |
17,292 |
|
|
$ |
7,631 |
|
|
$ |
13,989 |
|
Year Ended December 31, 2019 Compared to Year Ended December 31, 2018
Our earnings increase is mainly attributable to significant growth in our loan originations of 37.4% and the corresponding income earned from a higher balance of loans under management. Net interest income increased 20.9% partially offset by an increase in operating costs of 9.2%. Our net income increased 126.6% from $7.6 million for the year ended December 31, 2018 to $17.3 million for the year ended December 31, 2019.
Net Interest Income — Portfolio Related
|
|
|
Year Ended December 31, |
|
|
|
|
|
|
|
|
|
|||||
|
($ in thousands) |
|
2019 |
|
|
2018 |
|
|
$ Change |
|
|
%Change |
|
||||
|
Interest income |
|
$ |
157,531 |
|
|
$ |
124,722 |
|
|
$ |
32,809 |
|
|
|
26.3 |
% |
|
Interest expense - portfolio related |
|
|
83,903 |
|
|
|
62,597 |
|
|
|
21,306 |
|
|
|
34.0 |
% |
|
Net interest income - portfolio related |
|
|
73,628 |
|
|
|
62,125 |
|
|
$ |
11,503 |
|
|
|
18.5 |
% |
56
Interest Income. Interest income increased by $32.8 million, or 26.3%, to $157.5 million during the year ended December 31, 2019, compared to $124.7 million during the year ended December 31, 2018. The increase is primarily attributable to an increase in average loans (volume), which increased $352.7 million, or 24.7%, from $1.4 billion for the year ended December 31, 2018 to $1.8 billion for the year ended December 31, 2019. The average yield (rate) over those same periods increased from 8.72% to 8.84%.
The following table distinguishes between the change in interest income attributable to change in volume and the change in interest income attributable to change in rate. The effect of changes in volume is determined by multiplying the change in volume (i.e., $352.7 million) by the previous period’s average rate (i.e., 8.72%). Similarly, the effect of rate changes is calculated by multiplying the change in average rate (i.e., 0.12%) by the current period’s volume (i.e., $1.8 billion).
|
($ in thousands) |
|
Average Loans |
|
|
Interest Income |
|
|
Average Yield |
|
|
|||
|
Year ended December 31, 2019 |
|
$ |
1,782,558 |
|
|
$ |
157,531 |
|
|
|
8.84 |
|
% |
|
Year ended December 31, 2018 |
|
|
1,429,877 |
|
|
|
124,722 |
|
|
|
8.72 |
|
|
|
Volume variance |
|
|
352,681 |
|
|
|
30,763 |
|
|
|
|
|
|
|
Rate variance |
|
|
|
|
|
|
2,046 |
|
|
|
0.12 |
|
|
|
Total interest income variance |
|
|
|
|
|
$ |
32,809 |
|
|
|
|
|
|
Interest Expense — Portfolio Related. Interest expense related to our warehouse repurchase facilities increased $4.4 million to approximately $13.6 million during the year ended December 31, 2019, compared to approximately $9.2 million during the year ended December 31, 2018. Interest expense related to our securitizations increased by $16.9 million to approximately $70.3 million during the year ended December 31, 2019, compared to approximately $53.4 million during the year ended December 31, 2018. Our cost of funds increased to 5.23% during the year ended December 31, 2019 from 5.07% during the year ended December 31, 2018. The increase in interest expense — portfolio related was primarily due to the increase in borrowings for loan originations, as well as the impact of increased seasoning of older securitizations. As we have continued to add more of the lower-cost securitizations, our interest cost has started to decrease, averaging 5.00% for the fourth quarter of 2019.
The following table presents information regarding the increase in portfolio related interest expense and distinguishes between the dollar amount of change in interest expense attributable to changes in the average outstanding debt balance (volume) versus changes in cost of funds (rate).
|
($ in thousands) |
|
Average Debt (1) |
|
|
Interest Expense |
|
|
Cost of Funds |
|
|
|||
|
Year ended December 31, 2019 |
|
$ |
1,603,459 |
|
|
$ |
83,903 |
|
|
|
5.23 |
|
% |
|
Year ended December 31, 2018 |
|
|
1,234,818 |
|
|
|
62,597 |
|
|
|
5.07 |
|
|
|
Volume variance |
|
|
368,641 |
|
|
|
18,688 |
|
|
|
|
|
|
|
Rate variance |
|
|
|
|
|
|
2,618 |
|
|
|
0.16 |
|
|
|
Total interest expense variance |
|
|
|
|
|
$ |
21,306 |
|
|
|
|
|
|
(1)Includes securitizations and warehouse repurchase agreements.
Net Interest Income After Provision for Loan Losses
|
|
|
Year Ended December 31, |
|
|
|
|
|
|
|
|
|
|
|||||
|
($ in thousands) |
|
2019 |
|
|
2018 |
|
|
$ Change |
|
|
% Change |
|
|
||||
|
Net interest income - portfolio related |
|
$ |
73,628 |
|
|
$ |
62,125 |
|
|
$ |
11,503 |
|
|
|
18.5 |
|
% |
|
Interest expense - corporate debt |
|
|
14,618 |
|
|
|
13,322 |
|
|
|
1,296 |
|
|
|
9.7 |
|
% |
|
Net interest income |
|
|
59,010 |
|
|
|
48,803 |
|
|
|
10,207 |
|
|
|
20.9 |
|
% |
|
Provision for loan losses |
|
|
1,139 |
|
|
|
201 |
|
|
|
938 |
|
|
|
466.7 |
|
% |
|
Net interest income after provision for loan losses |
|
$ |
57,871 |
|
|
$ |
48,602 |
|
|
$ |
9,269 |
|
|
|
19.1 |
|
% |
57
Interest Expense — Corporate Debt. Corporate debt interest expense increased by $1.3 million from $13.3 million for the year ended December 31, 2018 to $14.6 million for the year ended December 31, 2019 primarily due to the increase in the corporate debt balance. In August 2019, we refinanced the 2014 Senior Secured Notes with a portion of the net proceeds from the 2019 Term Loans — a five-year $153.0 million corporate debt agreement with a new lender. The corporate debt balance was $153.0 million as of December 31, 2019 compared to $127.6 million as of December 31, 2018.
Provision for Loan Losses. Our provision for loan losses increased by $0.9 million from $0.2 million during the year ended December 31, 2018 to $1.1 million during the year ended December 31, 2019 primarily due to the increase in the loan portfolio.
Other Operating Income
The table below presents the various components of other operating income for the year ended December 31, 2019 compared to the year ended December 31, 2018. The $0.2 million net decrease is primarily due to the increase in gain on disposition of loans, offset by the valuation adjustments on interest-only strips included within other (expense) income.
|
|
|
Year Ended December 31, |
|
|
|
|
|
|
|
|
|
|
|||||
|
($ in thousands) |
|
2019 |
|
|
2018 |
|
|
$ Change |
|
|
% Change |
|
|
||||
|
Gain on disposition of loans |
|
$ |
4,410 |
|
|
$ |
1,201 |
|
|
$ |
3,209 |
|
|
|
267.2 |
|
% |
|
Unrealized gain on fair value loans |
|
|
(9 |
) |
|
|
241 |
|
|
|
(250 |
) |
|
|
(103.7 |
) |
|
|
Other (expense) income |
|
|
(1,752 |
) |
|
|
1,365 |
|
|
|
(3,117 |
) |
|
|
(228.4 |
) |
|
|
Total other operating income |
|
$ |
2,649 |
|
|
$ |
2,807 |
|
|
$ |
(158 |
) |
|
|
(5.6 |
) |
% |
Operating Expenses
Total operating expenses increased by $3.0 million, or 9.2%, to $35.1 million during the year ended December 31, 2019 from $32.2 million during the year ended December 31, 2018. This increase is primarily the result of loan servicing costs associated with higher loan origination volumes and the increase in REO expense.
|
|
|
Year Ended December 31, |
|
|
|
|
|
|
|
|
|
|
|||||
|
($ in thousands) |
|
2019 |
|
|
2018 |
|
|
$ Change |
|
|
% Change |
|
|
||||
|
Compensation and employee benefits |
|
$ |
15,511 |
|
|
$ |
15,105 |
|
|
$ |
406 |
|
|
|
2.7 |
|
% |
|
Rent and occupancy |
|
|
1,531 |
|
|
|
1,320 |
|
|
|
211 |
|
|
|
16.0 |
|
% |
|
Loan servicing |
|
|
7,396 |
|
|
|
6,009 |
|
|
|
1,387 |
|
|
|
23.1 |
|
% |
|
Professional fees |
|
|
2,056 |
|
|
|
3,040 |
|
|
|
(984 |
) |
|
|
(32.4 |
) |
|
|
Real estate owned, net |
|
|
2,647 |
|
|
|
1,373 |
|
|
|
1,274 |
|
|
|
92.8 |
|
% |
|
Other operating expenses |
|
|
5,981 |
|
|
|
5,313 |
|
|
|
668 |
|
|
|
12.6 |
|
% |
|
Total operating expenses |
|
$ |
35,122 |
|
|
$ |
32,160 |
|
|
$ |
2,962 |
|
|
|
9.2 |
|
% |
Compensation and Employee Benefits. Compensation and employee benefits increased from $15.1 million during the year ended December 31, 2018 to $15.5 million during year ended December 31, 2019, mainly due to higher commission expenses and increased operations and sales staff to support our growth in loan origination volume.
Rent and Occupancy. Rent and occupancy expenses increased from $1.3 million during the year ended December 31, 2018 to $1.5 million during the year ended December 31, 2019, due to the increase in office space.
Loan Servicing. Loan servicing expenses increased from $6.0 million during the year ended December 31, 2018 to $7.4 million during the year ended December 31, 2019. The $1.4 million increase during the year ended December 31, 2019 is mainly due to the increase in our loan portfolio.
58
Professional Fees. Professional fees decreased from $3.0 million for the year ended December 31, 2018 to $2.1 million for the year ended December 31, 2019, mainly due to the timing of legal and external audit services rendered related to our public offering initiative.
Net Expenses of Real Estate Owned. Net expenses of real estate owned increased from $1.3 million during the year ended December 31, 2018 to $2.6 million during the year ended December 31, 2019, mainly due to the increase in valuation adjustment expense during the year ended December 31, 2019.
Other Operating Expenses. Other operating expenses increased from $5.3 million for the year ended December 31, 2018 to $6.0 million for the year ended December 31, 2019, mainly due to increased data processing costs related to technology investments.
Income Tax Expense. Income tax expense was $8.1 million for the year ended December 31, 2019, compared to $11.6 million for the year ended December 31, 2018. Our consolidated effective tax rate as a percentage of pre-tax income for 2019 was 31.9%, compared to 60.4% for 2018. The 2019 effective tax rate differed from the federal statutory rate of 21.0% principally because of state taxes.
Year Ended December 31, 2018 Compared to Year Ended December 31, 2017
Our income before income taxes increased 37.6% from $14.0 million for the year ended December 31, 2017 to $19.2 million for the year ended December 31, 2018. Our strong earnings growth is mainly attributable to significant growth in our loan originations and a slight increase in our net interest margin. Net interest margin expansion was attributable to an increase in portfolio yield, partially offset by increasing portfolio related cost of funds.
Net Interest Income — Portfolio Related
|
|
|
Year Ended |
|
|
|
|
|
|
|
|
|
|||||
|
|
|
December 31, |
|
|
|
|
|
|
|
|
|
|||||
|
($ in thousands) |
|
2018 |
|
|
2017 |
|
|
$ Change |
|
|
% Change |
|
||||
|
Interest income |
|
$ |
124,722 |
|
|
$ |
97,830 |
|
|
$ |
26,892 |
|
|
|
27.5 |
% |
|
Interest expense — portfolio related |
|
|
62,597 |
|
|
|
47,638 |
|
|
|
14,959 |
|
|
|
31.4 |
% |
|
Net interest income — portfolio related |
|
$ |
62,125 |
|
|
$ |
50,192 |
|
|
$ |
11,933 |
|
|
|
23.8 |
% |
Interest Income. Interest income increased by $26.9 million, or 27.5%, to $124.7 million during the year ended December 31, 2018, compared to $97.8 million during the year ended December 31, 2017. The increase is attributable to a combination of an increase in average loans (volume) and an increase in average yield (rate). Average loans increased $261.9 million, or 22.4%, from $1.2 billion during the year ended December 31, 2017 to $1.4 billion during the year ended December 31, 2018. The average yield over those same periods increased from 8.38% to 8.72%.
The following table distinguishes between the change in interest income attributable to change in volume and the change in interest income attributable to change in rate. The effect of changes in volume is determined by multiplying the change in volume (i.e., $261.9 million) by the previous period’s average rate (i.e., 8.38%). Similarly, the effect of rate changes is calculated by multiplying the change in average rate (i.e., 0.34%) by the current period’s volume (i.e., $1.4 billion).
|
|
|
Average |
|
|
Interest |
|
|
Average |
|
|||
|
($ in thousands) |
|
Loans |
|
|
Income |
|
|
Yield |
|
|||
|
Year ended December 31, 2018 |
|
$ |
1,429,877 |
|
|
$ |
124,722 |
|
|
|
8.72 |
% |
|
Year ended December 31, 2017 |
|
|
1,167,999 |
|
|
|
97,830 |
|
|
|
8.38 |
|
|
Volume variance |
|
$ |
261,878 |
|
|
$ |
21,929 |
|
|
|
|
|
|
Rate variance |
|
|
|
|
|
|
4,963 |
|
|
|
0.34 |
% |
|
Total interest income variance |
|
|
|
|
|
$ |
26,892 |
|
|
|
|
|
59
Interest Expense — Portfolio Related. Interest expense related to our warehouse repurchase facilities increased $2.0 million, or 28.2%, to approximately $9.2 million during the year ended December 31, 2018, compared to approximately $7.2 million during the year ended December 31, 2017. Interest expense related to our securitizations increased by $12.9 million to approximately $53.4 million during the year ended December 31, 2018, compared to approximately $40.5 million during the year ended December 31, 2017. The increase in interest expense — portfolio related was primarily due to the increase in borrowings for loan originations. Our average cost of funds increased slightly to 5.07% during the year ended December 31, 2018 from 4.93% during the year ended December 31, 2017.
The following table presents information regarding the increase in portfolio related interest expense and distinguishes between the dollar amount of change in interest expense attributable to changes in the average outstanding debt balance (volume) versus changes in cost of funds (rate).
|
|
|
Average |
|
|
Interest |
|
|
Cost of |
|
|||
|
($ in thousands) |
|
Debt(1) |
|
|
Expense |
|
|
Funds |
|
|||
|
Year ended December 31, 2018 |
|
$ |
1,234,818 |
|
|
$ |
62,597 |
|
|
|
5.07 |
% |
|
Year ended December 31, 2017 |
|
|
965,987 |
|
|
|
47,638 |
|
|
|
4.93 |
|
|
Volume variance |
|
$ |
268,831 |
|
|
$ |
13,257 |
|
|
|
|
|
|
Rate variance |
|
|
|
|
|
|
1,702 |
|
|
|
0.14 |
% |
|
Total interest expense variance |
|
|
|
|
|
$ |
14,959 |
|
|
|
|
|
|
(1) |
Includes securitizations and warehouse repurchase agreements. |
Net Interest Income After Provision for Loan Losses
|
|
|
Year Ended December 31, |
|
|
|
|
|
|
|
|
|
|||||
|
($ in thousands) |
|
2018 |
|
|
2017 |
|
|
$ Change |
|
|
% Change |
|
||||
|
Net interest income — portfolio related |
|
$ |
62,125 |
|
|
$ |
50,192 |
|
|
$ |
11,933 |
|
|
|
23.8 |
% |
|
Interest expense — corporate debt |
|
|
13,322 |
|
|
|
13,654 |
|
|
|
(332 |
) |
|
|
(2.4 |
) |
|
Net interest income |
|
|
48,803 |
|
|
|
36,538 |
|
|
|
12,265 |
|
|
|
33.6 |
|
|
Provision for loan losses |
|
|
201 |
|
|
|
421 |
|
|
|
(220 |
) |
|
|
(52.3 |
) |
|
Net interest income after provision for loan losses |
|
$ |
48,602 |
|
|
$ |
36,117 |
|
|
$ |
12,485 |
|
|
|
34.6 |
% |
Interest Expense — Corporate Debt. Under the 2014 Senior Secured Notes, interest paid-in-kind accrues at an 11.0% interest rate and interest paid in cash accrues at a 10.0% interest rate. During the first half of 2017, the interest due on the 2014 Senior Secured Notes was paid-in-kind. During the second half of 2017, and during the year ended 2018, the interest due was paid in cash. The change in interest payments resulted in a 2.4% decrease in corporate debt interest expense from $13.7 million during the year ended December 31, 2017 to $13.3 million during the year ended December 31, 2018. We used $75.7 million of the net proceeds from our IPO to reduce interest expense through the repayment of $75.0 million in outstanding principal amount on the 2019 Term Loans, which refinanced the 2014 Senior Secured Notes in August 2019.
Provision for Loan Losses. Our provision for loan losses decreased $0.2 million from $0.4 million during the year ended December 31, 2017 to $0.2 million during the year ended December 31, 2018 as a result of an improvement in incurred losses, as the Company experienced fewer losses in 2018.
60
The table below presents the various components of other operating income for the year ended December 31, 2018 compared to the year ended December 31, 2017. The $0.8 million increase is primarily the result of the increased gain on sale of loans.
|
|
|
Year Ended |
|
|
|
|
|
|
|
|
|
|||||
|
|
|
December 31, |
|
|
|
|
|
|
|
|
|
|||||
|
($ in thousands) |
|
2018 |
|
|
2017 |
|
|
$ Change |
|
|
% Change |
|
||||
|
Gain on disposition of loans |
|
$ |
1,200 |
|
|
$ |
984 |
|
|
$ |
216 |
|
|
|
22.0 |
% |
|
Unrealized gain on fair value loans |
|
|
241 |
|
|
|
39 |
|
|
|
202 |
|
|
|
— |
|
|
Other income |
|
|
1,366 |
|
|
|
985 |
|
|
|
381 |
|
|
|
38.7 |
% |
|
Total other operating income |
|
$ |
2,807 |
|
|
$ |
2,008 |
|
|
$ |
799 |
|
|
|
39.8 |
% |
Operating Expenses
Total operating expenses increased $8.0 million, or 33.2%, to $32.2 million during the year ended December 31, 2018 from $24.1 million during the year ended December 31, 2017. This increase is primarily the result of additional personnel and loan servicing costs associated with higher loan origination volumes.
|
|
|
Year Ended December 31, |
|
|
|
|
|
|
|
|
|
|||||
|
($ in thousands) |
|
2018 |
|
|
2017 |
|
|
$ Change |
|
|
% Change |
|
||||
|
Compensation and employee benefits |
|
$ |
15,105 |
|
|
$ |
11,904 |
|
|
$ |
3,201 |
|
|
|
26.9 |
% |
|
Rent and occupancy |
|
|
1,320 |
|
|
|
1,115 |
|
|
|
205 |
|
|
|
18.4 |
% |
|
Loan servicing |
|
|
6,009 |
|
|
|
4,907 |
|
|
|
1,102 |
|
|
|
22.5 |
% |
|
Professional fees |
|
|
3,040 |
|
|
|
1,661 |
|
|
|
1,379 |
|
|
|
83.0 |
% |
|
Real estate owned, net |
|
|
1,373 |
|
|
|
603 |
|
|
|
770 |
|
|
|
127.7 |
% |
|
Other operating expenses |
|
|
5,313 |
|
|
|
3,946 |
|
|
|
1,367 |
|
|
|
34.6 |
% |
|
Total operating expenses |
|
$ |
32,160 |
|
|
$ |
24,136 |
|
|
$ |
8,024 |
|
|
|
33.2 |
% |
Compensation and Employee Benefits. Compensation and employee benefits increased from $11.9 million during the year ended December 31, 2017 to $15.1 million during the year ended December 31, 2018 mainly due to higher commission expenses and increased operations and sales staff to support our growth in loan origination volume.
Rent and Occupancy. Rent and occupancy expenses increased from $1.1 million during the year ended December 31, 2017 to $1.3 million during the year ended December 31, 2018 due to the opening of two new sales offices.
Loan Servicing. Loan servicing expenses increased from $4.9 million during the year ended December 31, 2017 to $6.0 million during the year ended December 31, 2018. The $1.1 million increase during 2018 is primarily related to the increase in our loan portfolio.
Professional Fees. Professional fees increased from $1.7 million for the year ended December 31, 2017 to $3.0 million for the year ended December 31, 2018 mainly due to increased legal and external audit fees related to our public offering initiative.
Net Expenses of Real Estate Owned. Net expenses of real estate owned increased from $0.6 million during the year ended December 31, 2017 to $1.4 million during the year ended December 31, 2018, mainly as a result of a $0.7 million increase in REO valuation adjustments.
Other Operating Expenses. Other operating expenses increased from $3.9 million for the year ended December 31, 2017 to $5.3 million for the year ended December 31, 2018 mainly due to increased data processing costs related to technology investments.
61
Income Tax Expense. Income tax expense was $11.6 million, and our consolidated effective tax rate was 60.4% for the year ended December 31, 2018. The Company elected to be treated as a corporation for U.S. federal and state income tax purposes effective January 1, 2018. Prior to January 1, 2018, the Company was a limited liability company and it was not subject to U.S. federal and state income tax.
Liquidity and Capital Resources
Sources and Uses of Liquidity
We fund our lending activities primarily through borrowings under our warehouse repurchase facilities, securitizations, members’ equity and other corporate-level debt, equity and debt securities, and net cash provided by operating activities to manage our business. We use cash to originate and acquire investor real estate loans, repay principal and interest on our borrowings, fund our operations and meet other general business needs.
As a result of the spread of the COVID-19, economic uncertainties have arisen which are likely to negatively impact our financial condition, results of operations and cash flows. We have recently executed a number of business initiatives to strengthen our liquidity and capital resources position in light of the impact of COVID-19. As part of these initiatives, on April 6, 2020, we entered into amendments to our warehouse repurchase agreements and issued and sold $45.0 million in gross proceeds of Preferred Stock and Warrants. See below under “—Warehouse Repurchase Facilities” and “—April 2020 Preferred Stock and Warrants.”
Cash and Cash Equivalents
As of December 31, 2019, we had liquidity of approximately $26.4 million in cash and eligible collateral borrowings under our warehouse facilities. Cash comprised $21.5 million of our liquidity and eligible collateral borrowings under our warehouse facilities comprised $4.9 million of our liquidity. As of December 31, 2019, we had $80.3 million of uncommitted available capacity under our warehouse facilities.
As of December 31, 2018, we had liquidity of approximately $60.0 million in cash and eligible collateral borrowings under our warehouse facilities. Cash comprised $15.0 million of our liquidity and eligible collateral borrowings under our warehouse facilities comprised $45.0 million of our liquidity. As of December 31, 2018, we had $283.3 million of uncommitted available capacity under our warehouse facilities.
During the year ended December 31, 2019, we generated approximately $10.9 million of net cash and cash equivalents from operations, investing and financing activities. During the year ended December 31, 2018, we generated approximately $1.0 million of net cash and cash equivalents from operations, investing and financing activities.
Warehouse Repurchase Facilities
As of December 31, 2019, we had two warehouse repurchase agreements to support our loan origination and acquisition activities. Both agreements are short-term borrowing facilities. The borrowings are collateralized by pools of primarily performing loans, bearing interest at one-month LIBOR plus a margin that ranges from 2.75% to 3.00%. As of December 31, 2019, these two agreements had an aggregated maximum borrowing capacity of $450.0 million, of which $200.0 million were committed amounts and $250.0 million were uncommitted amounts. The maximum capacity increased from $450.0 million to $500.0 million effective March 11, 2020. Borrowings under these repurchase facilities as of December 31, 2019 were $417.2 million.
As of December 31, 2018, we had two warehouse repurchase agreements to support our loan origination and acquisition activities. Both agreements are short-term borrowing facilities. The borrowings are collateralized by pools of primarily performing loans, bearing interest at one-month LIBOR plus a margin that ranges from 2.75% to 3.00%. As of December 31, 2018, these two agreements had an aggregated maximum borrowing capacity of $450.0 million, of which $200.0 million were committed amounts and $250.0 million were uncommitted amounts. Borrowings under these repurchase facilities as of December 31, 2018 were $216.4 million.
62
In addition to the two warehouse repurchase agreements, we also have a longer term warehouse agreement, which was added in September 2018. The borrowings are collateralized by pools of primarily performing loans, with a maximum borrowing capacity of $50 million, bearing interest at one-month LIBOR plus a margin of 3.50%. The warehouse repurchase facility has a maturity date of September 12, 2021 and allows loans to be financed for a period of up to three years. Borrowings under this warehouse agreement as of December 31, 2019 were $2.5 million.
All warehouse repurchase facilities fund less than 100% of the principal balance of the mortgage loans we own requiring us to use working capital to fund the remaining portion. We may need to use additional working capital if loans become delinquent, because the amount permitted to be financed by the facilities may change based on the delinquency performance of the pledged collateral.
All borrower payments on loans financed under the warehouse agreements are segregated into pledged accounts with the loan servicer. All principal amounts in excess of the interest due are applied to reduce the outstanding borrowings under the warehouse repurchase facilities, which then allows us to draw additional funds on a revolving basis under the facilities. The revolving warehouse repurchase facilities also contain customary covenants, including financial covenants that require us to maintain a minimum net worth, a maximum debt-to- net worth ratio and a ratio of a minimum earnings before interest, taxes, depreciation and amortization to interest expense. If we fail to meet any of the covenants or otherwise default under the facilities, the lenders have the right to terminate their facility and require immediate repayment, which may require us to sell our loans at less than optimal terms. As of December 31, 2019, we were in compliance with these covenants.
In response to the dislocations in the markets related to the COVID-19 pandemic and its unknown future impact on the value of our financed collateral, on April 6, 2020, we entered into amendments to the master repurchase agreements on both of our warehouse repurchase agreements with the lenders under such agreements. We believe that the amended warehouse repurchase agreements provide us with a flexible and more stabilized financing solution that will allow us to better operate our business under the current market conditions. Pursuant to the terms of the warehouse repurchase amendments, (i) we must maintain unrestricted cash and cash equivalents of at least $7.5 million, (ii) we were required to make aggregate payments of $20.0 million to reduce our obligations under the warehouse repurchase agreements on April 6, 2020, and (iii) we must ensure that payments of at least $3.0 million per month are made to each lender, from the cash flow of the underlying financed loans and/or corporate cash each month from April 6 through August 3, 2020, in reduction of its obligations thereunder. In addition, the interest rate under each warehouse repurchase facility was increased by 25 basis points, effective as of April 6, 2020.
Securitizations
From May 2011 through October 2019, we have completed twelve securitizations of $2.7 billion of investor real estate loans, issuing $2.5 billion in principal amount of securities to third parties through twelve respective transactions. In February 2020, we completed our thirteenth securitization issuing $248.7million in principal amount of securities for $261.9 million of mortgage loans. All borrower payments are segregated into remittance accounts at the primary servicer and remitted to the trustee of each trust monthly. We are the sole beneficial interest holder of the applicable trusts, which are variable interest entities included in our consolidated financial statements. The transactions are accounted for as a secured borrowings under U.S. GAAP. Table summarizing the investor real estate loans securitized, securities issued, securities retained by the Company at the time of the securitization, and as of December 31, 2019 and 2018, the stated maturity for each securitization, the outstanding bond balances, and the weighted average on the securities for the Trusts as of December 31, 2019 and 2018, are included in Item 15. Exhibits, Financial Statement Schedules. The securities are callable by us when the stated principal balance is less than a certain percentage, ranging from 5%—30%, of the original stated principal balance of loans at issuance. As a result, the actual maturity date of the securities issued will likely be earlier than their respective stated maturity date.
Our intent is to use the proceeds from the issuance of new securities primarily to repay our warehouse borrowings and originate new investor real estate loans in accordance with our underwriting guidelines, as well as for general corporate purposes. Our financing sources may include borrowings in the form of additional bank credit facilities (including term loans and revolving credit facilities), repurchase agreements, warehouse repurchase facilities and other sources of private financing. We also plan to continue using securitization as long-term financing for our portfolio, and we do not plan to structure any securitizations as sales or utilize off-balance-sheet vehicles.
63
We believe any financing of assets and/or securitizations we may undertake will be sufficient to fund our working capital requirements.
Cash Flows
The following table summarizes the net cash provided by (used in) operating activities, investing activities and financing activities as of the periods indicated:
|
|
|
Year Ended December 31, |
|
|||||||||
|
($ in thousands) |
|
2019 |
|
|
2018 |
|
|
2017 |
|
|||
|
Cash provided by (used in): |
|
|
|
|
|
|
|
|
|
|
|
|
|
Operating activities |
|
$ |
(105,336 |
) |
|
$ |
(72,485 |
) |
|
$ |
37,644 |
|
|
Investing activities |
|
|
(305,934 |
) |
|
|
(270,196 |
) |
|
|
(274,779 |
) |
|
Financing activities |
|
|
422,145 |
|
|
|
343,631 |
|
|
|
201,118 |
|
|
Net change in cash, cash equivalents, and restricted cash |
|
$ |
10,875 |
|
|
$ |
950 |
|
|
$ |
(36,017 |
) |
Operating Activities
Cash flows from operating activities primarily includes net income adjusted for (1) cash used for origination of held for sale loans and the related cash proceeds from the sales of such loans, (2) non-cash items including depreciation, provision for loan loss, discount accretion, and valuation changes, and (3) changes in the balances of operating assets and liabilities.
For the year ended December 31, 2019, our net cash used in operating activities of $105.3 million consisted mainly of $336.9 million cash used to originate held for sale loans, offset by $179.6 million proceeds from sale of loans held for sale, $25.1 million in repayments on loans held for sale, and net income of $17.3 million.
For the year ended December 31, 2018, our net cash used in operating activities of $72.5 million consisted mainly of net income of $7.6 million, offset by $148.8 million in cash used to originate held for sale loans, less proceeds from the sale and repayments of loans held for sale of $72.9 million and $3.5 million, respectively. Changes in operating assets and liabilities resulted in cash used of $18.9 million, mainly as a result of a $16.2 million increase in interest receivable due to portfolio growth.
For the year ended December 31, 2017, our net cash provided by operating activities of $37.6 million consisted mainly of net income of $14.0 million, offset by $42.9 million in cash used to originate held for sale loans, less proceeds from the sale of such loans of $46.3 million. Changes in operating assets and liabilities resulted in cash provided of $4.8 million. Interest paid in kind on our corporate debt resulted in a positive non-cash adjustment to net income of $6.7 million.
Investing Activities
For the year ended December 31, 2019, our net cash used in investing activities of $305.9 million consisted mainly of $682.9 million in cash used to originate held for investment loans, offset by $379.3 million in cash received in payments on held for investment loans. We also used cash to purchase $9.3 million of loans for investment. We also received cash of $4.5 million from proceeds of the sale of REO.
For the year ended December 31, 2018, our net cash used in investing activities of $270.2 million consisted mainly of $595.7 million in cash used to originate held for investment loans, less $334.7 million in cash received in payments on held for investment loans. We also received cash of $6.2 million from proceeds of the sale of REO.
For the year ended December 31, 2017, our net cash used in investing activities of $274.8 million consisted mainly of $518.9 million in cash used to originate held for investment loans, less $240.9 million in cash received in payments on held for investment loans. We also received cash of $6.3 million from proceeds of the sale of loans and $2.5 million from proceeds on the sale of REO.
64
For the year ended December 31, 2019, our net cash provided by financing activities of $422.1 million consisted mainly of $961.7 million and $608.1 million in cash from borrowings from our warehouse repurchase facilities and securitizations issued, respectively. This cash generated was partially offset by payments we made of $756.0 million and $371.4 million on our warehouse repurchase facilities and securitizations issued, respectively. The 2019 Term Loans generated $153.0 million of cash, of which $127.6 million was used to redeem the 2014 Secured Notes, and $27.7 million was used to repurchase the Class C preferred units as return of capital. We used cash of $17.9 million for debt issuance costs.
For the year ended December 31, 2018, our net cash provided by financing activities of $343.6 million consisted mainly of $658.5 million and $535.5 million in cash from borrowings from our warehouse repurchase facilities and securitizations issued, respectively. This cash generated was partially offset by payments we made of $527.9 million and $314.7 million on our warehouse repurchase facilities and securitizations issued, respectively. We used cash of $7.8 million for debt issuance costs.
For the year ended December 31, 2017, our net cash provided by financing activities of $201.1 million consisted mainly of $420.5 million and $455.3 million in cash from borrowings from our warehouse repurchase facilities and securitizations issued, respectively. This cash generated was partially offset by payments we made of $445.7 million and $214.4 million on our warehouse repurchase facilities and securitizations issued, respectively. We used cash of $7.8 million for debt issuance costs and $6.9 million for tax distributions.
April 2020 Preferred Stocks and Warrants
On April 5, 2020, we sold 45,000 shares of Preferred Stock and Warrants to purchase 3,013,125 shares of our common stock in a private placement to two of our largest stockholders. These offerings resulted in aggregate gross proceeds of $45.0 million, before expenses payable by us of approximately $1.0 million. The proceeds will be used for general corporate purposes and to strengthen our liquidity position during this current economic crisis.
Beginning on October 5, 2022, but in no event later than November 28, 2024, each holder of Preferred Stock has the option to cause us to repurchase all or a portion of such holder’s shares of Preferred Stock, for an amount in cash equal to the liquidation preference of each share repurchased. The Preferred Stock has a liquidation preference equal to the greater of (i) $2,000 per share from April 5, 2020 through October 5, 2022, which amount increases ratably to $3,000 per share between October 6, 2022 and November 28, 2024 and to $3,000 per share from and after November 28, 2024 and (ii) the amount such Preferred Stock holder would have received if the Preferred Stock had converted into common stock immediately prior to such liquidation. We also have an obligation to repurchase the Preferred Stock for cash at a price per share equal to the liquidation preference in the event of a change of control (as defined in the certificate of designation governing the Preferred Stock).
The Warrants are exercisable at the warrantholder’s option at any time and from time to time, in whole or in part, until April 5, 2025 at an exercise price of $2.96 per share of common stock with respect to 2,008,750 of the Warrants, and at an exercise price of $4.94 per share of common stock with respect to 1,004,374 of the Warrants. For more information about the Preferred Stock and the Warrants, see “Note 24 — Subsequent Events” in the footnotes to the consolidated financial statements included in this Annual Report.
Contractual Obligations and Commitments
In 2014, we entered into a five-year, $100.0 million corporate debt agreement with the owners of the Class C preferred units, pursuant to which we issued at par senior secured notes that mature on December 16, 2019, the 2014 Senior Secured Notes. The 2014 Senior Secured Notes bear interest at either 10% annually paid in cash or 11% annually paid-in-kind on June 15 and December 15 of each year. All principal and paid-in-kind interests are due at maturity. In August 2019, we entered into a five-year $153.0 million corporate debt agreement with Owl Rock Capital Corporation. The 2019 Term Loans under this agreement bear interest a rate equal to one-month LIBOR plus 7.50% and mature in August 2024. A portion of the net proceeds from the 2019 Term Loans was used to redeem the 2014 Senior Secured Notes. As of December 31, 2019, 2018, and 2017, including paid-in-kind interest, the aggregate outstanding principal amount of the 2014 Senior Secured Notes was zero, $127.6 million and$127.6
65
million, respectively. As of December 31, 2019, the outstanding principal amount of the 2019 Term Notes was $153.0 million. Another portion of the net proceeds from the 2019 Term Loans, together with cash on hand, was used to repurchase our outstanding Class C preferred units. The 2019 Term Loans mature in August 2024 and are subject to a 0.25% quarterly amortization beginning on the fifth full fiscal quarter after August 2019. Velocity Commercial Capital, LLC is the borrower of the 2019 Term Loans, which are secured by substantially all of the borrower’s non-warehoused assets, with a guarantee from Velocity Financial, Inc., formerly Velocity Financial LLC, that is secured by the equity interests of the borrower. The corporate debt agreement contains customary affirmative and negative covenants, including financial maintenance covenants and limitations on dividends by the borrower.
As of December 31, 2019, we maintained warehouse and repurchase facilities to finance our investor real estate loans and had approximately $417.2 million in outstanding borrowings with $80.3 million of available capacity under our warehouse and repurchase facilities.
The following table illustrates our contractual obligations existing as of December 31, 2019:
|
|
|
January 1, 2020 - |
|
|
January 1, 2021 - |
|
|
January 1, 2023 - |
|
|
|
|
|
|
|
|
|
|
|||
|
($ in thousands) |
|
December 31, 2020 |
|
|
December 31, 2022 |
|
|
December 31, 2024 |
|
|
Thereafter |
|
|
Total |
|
|
|||||
|
Warehouse repurchase facilities |
|
$ |
417,188 |
|
|
$ |
5,499 |
|
|
$ |
- |
|
|
$ |
- |
|
|
$ |
422,687 |
|
(1) |
|
Notes payable (corporate debt) (2) |
|
|
382 |
|
|
|
3,060 |
|
|
|
149,558 |
|
|
|
− |
|
|
|
153,000 |
|
|
|
Leases payments under noncancelable operating leases |
|
|
1,526 |
|
|
|
3,184 |
|
|
|
2,460 |
|
|
|
55 |
|
|
|
7,225 |
|
|
|
Total |
|
$ |
419,096 |
|
|
$ |
11,743 |
|
|
$ |
152,018 |
|
|
$ |
55 |
|
|
$ |
582,912 |
|
|
|
(1) |
Amount represents gross warehouse and repurchase borrowing. Balance of $421.5 million in the consolidated statement of financial condition as of December 31, 2019 is net of $1.1 million debt issuance costs. In August 2019, the Citibank Repurchase Agreement was amended to be due in August 2020. In October 2019, the Barclays Repurchase Agreement was amended to be due in October 2020. In April 2020, the Barclays Repurchase Agreement was further amended to be due August 2020. |
|
(2) |
In August 2019, we entered into a five-year $153.0 million corporate debt agreement and a portion of the proceeds of the 2019 Term Loans under this agreement were used to redeem the then outstanding corporate debt. The 2019 Term Loans mature in August 2024 and are subject to a 0.25% quarterly amortization beginning on the fifth full fiscal quarter after August 2019. In January 2020, we repaid $75.0 million of our existing corporate debt with a portion of the net proceeds from our IPO. |
Off-Balance-Sheet Arrangements
At no time have we maintained any relationships with unconsolidated entities or financial partnerships, such as entities referred to as structured finance, or special-purpose or variable interest entities, established for the purpose of facilitating off-balance-sheet arrangements or other contractually narrow or limited purposes. Further, we have never guaranteed any obligations of unconsolidated entities or entered into any commitment or intent to provide funding to any such entities.
New Accounting Standards
In June 2016, the FASB issued ASU 2016-13, Measurement of Credit Losses on Financial Instruments, which significantly changes the way entities recognize credit losses and impairment of financial assets recorded at amortized cost. Currently, the credit loss and impairment model for loans and leases is based on incurred losses, and investments are recognized as impaired when there is no longer an assumption that future cash flows will be collected in full under the originally contracted terms. Under the new current expected credit loss (“CECL”) model, the standard requires immediate recognition of estimated credit losses expected to occur over the remaining life of the asset. This standard also expands the disclosure requirements regarding an entity’s assumptions, models and methods for estimating the allowance for loan and lease losses, and requires disclosure of the amortized cost balance for each class of financial asset by credit quality indicator, disaggregated by the year of origination (i.e., by vintage year). ASU 2016-13 is effective for interim and annual periods in fiscal years beginning after December 15, 2019, with earlier adoption permitted. Entities are required to use a cumulative-effect adjustment to retained earnings as of the beginning of the first reporting period in which the guidance is adopted (modified-retrospective approach). The Company has developed a detailed implementation plan, selected a new software solution, reached accounting
66
decisions on various matters, developed econometric models for our reasonable and supportable forecast period, selected key assumptions used in the model, and performed preliminary calculations. The Company continues to test and refine the CECL models, including its qualitative methodology to estimate losses that are not expected to be captured in the quantitative models. The Company is in the final stage of the independent third-party model validation. Based on multiple parallel testing performed using the Company’s portfolio data, we expect the impact from the adoption of this standard to be immaterial to the Company’s consolidated financial statements.
In August 2018, the FASB issued ASU 2018-15, Intangibles — Goodwill and Other — Internal-Use Software (Subtopic 350-40): Customer’s Accounting for Implementation Costs Incurred in a Cloud Computing Arrangement That is a Service Contract, which aligns the requirements for capitalizing implementation costs in a cloud computing arrangement service contract with the requirements for capitalizing implementation costs incurred for an internal-use software license. Specifically, if a cloud computing arrangement is deemed to be a service contract, certain implementation costs are eligible for capitalization. The new guidance prescribes the balance sheet and income statement presentation and cash flow classification for the capitalized costs and related amortization expense. The amendments in this ASU should be applied either retrospectively or prospectively to all implementation costs incurred after the date of adoption. The Company adopted this standard on a prospective basis on January 1, 2020. The adoption of ASU 2018-15 did not have a material impact on the Company’s consolidated financial statements.
In August 2018, the FASB issued ASU 2018-13, “Fair Value Measurement (Topic 820): Disclosure Framework - Changes to Disclosure Requirements for Fair Value Measurements”, which modified the disclosure requirements in ASC Topic 820 to add disclosures regarding changes in unrealized gains and losses, the range and weighted average of significant unobservable inputs used to develop Level 3 fair value measurements and the narrative description of measurement uncertainty. Certain disclosure requirements in ASC Topic 820 are also removed or modified. Certain disclosures in ASU 2018-13 would need to be applied on a retrospective basis and others on a prospective basis and early adoption is permitted. The Company has early adopted those provisions of the standard that permitted the removal or modification of certain disclosures effective January 1, 2019 but deferred adoption of the additional new disclosures until January 1, 2020. The adoption of this standard will modify disclosures in 2020 but will not have an impact on the Company’s consolidated financial statements.
In April 2019, the FASB issued ASU No. 2019-04, “Codification Improvements to Topic 326, Financial Instruments Credit Losses, Topic 815, Derivatives and Hedging, and Topic 825, Financial Instruments,” which clarifies and improves areas of guidance related to the recently issued standards on credit losses (ASU 2016-13), hedging (ASU 2017-12), and recognition of financial instruments (ASU 2016-01). The amendments generally have the same effective dates as their related standards. Impacts from the adoption of 2019-04 have been considered in the Company's overall CECL implementation and will be adopted concurrent with the adoption of ASU 2016-13. ASU 2017-12 and ASU 2016-01 are not applicable to the Company and therefore had no impact on the Company’s consolidated financial statements.
Item 7A. Quantitative and Qualitative Disclosures about Market Risk
Market risk is the exposure to loss resulting from changes in interest rates, foreign currency exchange rates, commodity prices, equity prices, real estate values and other market-based risks. The primary market risks that we will be exposed to are real estate risk, interest rate risk, market value risk and credit risk.
Interest Rate Risk. Interest rate risk is highly sensitive to many factors, including governmental monetary and tax policies, domestic and international economic and political considerations and other factors beyond our control. Our operating results will depend, in part, on differences between the income from our investments and our financing costs.
Our loan portfolio consists mainly of a 30-year amortizing term loan product with a three-year fixed- rate period which floats at a spread to the prime rate thereafter subject to a floor equal to the starting fixed rate. In June 2019, we began originating a 30-year fixed-rate amortizing term loan to complement our primary product as we believe there is meaningful demand for fixed-rate loans within our core market.
Fluctuations in the prime rate can cause variability in our interest income, limited by the floor in a downside scenario. Our warehouse repurchase financing is based on a floating rate of interest calculated on a fixed spread over one-month LIBOR, as determined by the particular financing arrangement. Our existing securitizations are largely fixed-rate debt and less impacted by changes in interest rates; however, our future securitizations will be impacted by the general level of interest rates and risk spreads.
67
While we do not currently hedge our interest rate risk, we may attempt to reduce interest rate risk in the future on any outstanding debt and to minimize exposure to interest rate fluctuations thereon through the use of match funded financing structures. When appropriate, we may seek to match the maturities of our debt with the maturities of the assets that we finance and to match the interest rates on our leveraged investments with like kind debt (e.g., floating rate assets are financed with floating rate debt and fixed-rate assets are financed with fixed-rate debt), directly or through the use of interest rate swaps, caps or other financial instruments, or through a combination of these strategies. We expect this approach to help us minimize the risk that we have to refinance our liabilities before the maturities of our assets and to reduce the impact of changing interest rates on our earnings.
To assess the potential impact for the following twelve months on our net interest income from fluctuations in interest rates, we considered both an instantaneous 100 basis point increase and 100 basis point decrease in the one-month LIBOR and prime rates. The effect of the interest rate changes would apply to our interest rate sensitive assets and liabilities. Some of our interest income on our portfolio is based on the prime rate. A 100 basis point increase in the prime rate would increase our annual interest income approximately $9.0 million based on our portfolio balance as of December 31, 2019, while a 100 basis point decrease in the prime rate would decrease our annual interest income by approximately $7.9 million. Our interest expense on our warehouse repurchase financing is based on one-month LIBOR. A 100 basis point increase or decrease in LIBOR would increase or decrease, respectively, our annual interest expense by approximately $3.6 million based on our warehouse repurchase financing balance as of December 31, 2019.
In the event of a significant rising interest rate environment and/or economic downturn, defaults could increase and result in credit losses to us, which could materially and adversely affect our business, financial condition, liquidity, results of operations and prospects. Furthermore, such defaults could have an adverse effect on the spread between our interest-earning assets and interest-bearing liabilities.
Market Value Risk. Traditional warehouse repurchase facilities have, in the past, established market values of the collateral pledged for financing. When the market value of the pledged collateral decreases, lenders have typically required additional collateral or a cash margin to support the existing borrowings. Our current warehouse repurchase facilities routinely establish a market value on the loans pledged under these facilities. We may be required to satisfy these requirements if the market value of our loans decreases significantly, which could have a material impact on our operations, cash and liquidity.
Credit Risk. We are subject to credit risk in connection with our loans. The credit risk related to these loans pertains to the ability and willingness of the borrowers to pay, which is assessed before credit is granted or renewed and periodically reviewed throughout the loan or security term. We believe that loan credit quality is primarily determined by the value of the real estate securing the loan, the borrowers’ credit profiles and loan characteristics.
Prepayment Risk. Our interest income and financial results are affected by changes in prepayment rates. As we receive prepayments of principal on our loans, we will receive prepayment premiums from borrowers if they are still in the early payment period which will increase our interest income. In general, an increase in prepayment rates will accelerate the amortization of deferred costs, thereby reducing the interest income earned on the loans. Conversely, deferred origination fees recognized on prepayment would increase interest income. Additionally, an increase in prepayment rates will accelerate the accretion of debt issuance costs for our securitizations, thereby increasing our interest expense.
Inflation Risk. Virtually all of our assets and liabilities are and will be interest rate sensitive in nature. As a result, interest rates and other factors influence our performance far more so than does inflation. Changes in interest rates do not necessarily correlate with inflation rates or changes in inflation rates. Our consolidated financial statements are prepared in accordance with U.S. GAAP and our activities and balance sheet shall be measured with reference to historical cost or fair market value without considering inflation.
Item 8. Financial Statements and Supplemental Data
Our consolidated financial statements and the notes related to the financial statements, together with the independent registered public accounting firm’s report thereon, are included in Item 15. Exhibits, Financial
68
Statements and Schedules and are filed as part of this Annual Report on Form 10-K and are incorporated herein by reference.
Item 9. Changes in and Disagreements with Accountants on Accounting and Financial Disclosure
None.
Item 9A. Controls and Procedures
Evaluation of Disclosure Controls and Procedures
Under the supervision and with the participation of our management, including our Chief Executive Officer and Chief Financial Officer, we evaluated the effectiveness of the design and operation of our disclosure controls and procedures pursuant to Rule 13a-15(e) and 15d-15(e) under the Exchange Act as of the end of the period covered by this report. Our disclosure controls and procedures are designed to ensure that information required to be disclosed in the reports we file or submit under the Exchange Act is recorded, processed, summarized and reported within the time periods specified in the SEC’s rules and forms, and that such information is accumulated and communicated to our management, including the Chief Executive Officer and the Chief Financial Officer, to allow timely decisions regarding required disclosures. Any controls and procedures, no matter how well designed and operated, can provide only reasonable assurance of achieving the desired control objective and management necessarily applies its judgment in evaluating the cost-benefit relationship of possible controls and procedures.
In reviewing the accounting for a certain transaction we completed in January 2018, as part of our 2018 election to be treated as a corporation for U.S. federal and state income tax purposes, our management identified a deficiency in the effectiveness of a control intended to properly document and review relevant facts and apply the appropriate tax accounting under U.S. GAAP, which impacted the beginning of year deferred tax asset and income tax benefit accounts and related disclosures. Management concluded that it had not implemented an effective control structure to prevent or detect the material misstatements in calculating the beginning of year deferred tax position. In 2019, we implemented a plan to remediate this material weakness by contracting with a nationally recognized accounting firm to have experienced tax personnel supplement and train our current accounting team. As a result, additional internal controls over our income tax processes have been designed and implemented. In 2020, management will assess whether these internal controls over income taxes are performing as designed. Management has concluded that the material weakness will remain as of December 31, 2019, pending further testing of the internal controls.
Management’s Annual Report on Internal Control over Financial Reporting
This Annual Report does not include a report of management’s assessment regarding internal control over financial reporting or an attestation report of our independent registered public accounting firm due to a transition period established by the rules of the SEC for newly public companies.
Changes in Internal Control over Financial Reporting
Other than the material weakness described above, there was not any change in our internal control over financial reporting (as such term is defined in Rules 13a-15(f) under the Exchange Act) during the year ended December 31, 2019 that has materially affected, or is reasonably likely to materially affect, our internal control over financial reporting. Our remediation of the material weakness remains ongoing.
None.
69
Item 10. Directors, Executive Officers and Corporate Governance.
Directors and Officers
The following table sets forth the names, ages and positions of our executive officers and individuals who currently serve as our directors.
|
Name |
|
Age |
|
Position(s) |
|
Christopher D. Farrar |
|
53 |
|
Chief Executive Officer and Director |
|
Mark R. Szczepaniak |
|
61 |
|
Chief Financial Officer |
|
Jeffrey T. Taylor |
|
51 |
|
Executive Vice President, Capital Markets |
|
Graham M. Comley |
|
40 |
|
Chief Information Officer, Velocity Commercial Capital LLC |
|
Joseph A. Cowell |
|
40 |
|
Chief Operating Officer, Velocity Commercial Capital LLC |
|
Daniel J. Ballen |
|
37 |
|
Director |
|
Alan H. Mantel |
|
56 |
|
Director, Chairman of the Board |
|
John P. Pitstick |
|
46 |
|
Director |
|
John A. Pless |
|
43 |
|
Director |
|
Joy L. Schaefer |
|
60 |
|
Director |
Biographical Information
Christopher D. Farrar has served as our Chief Executive Officer, and as a member of our board of directors since 2004, and is a founding member of the Company. Mr. Farrar brings extensive operating experience and history with the Company and management skills to our board of directors. Mr. Farrar has an extensive background in finance, lending, raising capital and business operations. Mr. Farrar co-founded the Company in June 2004. Prior to that time, Mr. Farrar served as a Vice President for Namco Capital Group, Inc., originating commercial real estate loans, and as Senior Vice President of United States Production at Weyerhaeuser Mortgage Company. Prior to his tenure at Weyerhaeuser Mortgage Company, Mr. Farrar formed and served as Chief Credit Officer for Worth Funding, a mortgage banking firm. Mr. Farrar received a Bachelor of Science in business administration from Pepperdine University and is a licensed California Real Estate Broker (inactive).
Jeffrey T. Taylor has served as our Executive Vice President, Capital Markets since 2004 and is a founding member of the Company. Mr. Taylor has more than 26 years of experience in the secondary mortgage market. Mr. Taylor co-founded the Company in June 2004. Prior to that time, Mr. Taylor worked for two different opportunity funds that purchased Resolution Trust Corporation and FDIC loan portfolios and as Vice President of Operations for 2dmkt.com, an Internet start-up that created a platform for trading commercial real estate loan portfolios on the Internet. Mr. Taylor also served as a Vice President with BayView Financial Trading Group L.P. where he managed the Northern California, Oregon and Washington markets for the commercial lending group and at Countrywide Securities Corporation where he served as a Transaction Manager. Mr. Taylor received a Bachelor of Arts from the University of California, Santa Cruz in economics and history and a Master of Real Estate Development from the University of Southern California.
Mark R. Szczepaniak has served as our Chief Financial Officer since May 2017. Mr. Szczepaniak has more than 30 years of industry experience in the real estate/financial services industry and has held various senior positions with both publicly and privately-held finance companies. Mr. Szczepaniak served as Managing Director of Finance at PennyMac Loan Services, LLC from November 2013 until joining us in 2017. From 2009 to 2012, Mr. Szczepaniak served as Chief Financial Officer of Prospect Mortgage. From 2004 to 2007, Mr. Szczepaniak served as Chief Financial Officer and Vice President of Finance of the Federal Home Loan Bank of Seattle and from 1996 to 2004 he served as Senior Vice President and Corporate Controller at the Federal Home Loan Bank of Chicago. Mr. Szczepaniak is a Certified Public Accountant, licensed in the state of California, and a Chartered Global Management Accountant. Mr. Szczepaniak received his Bachelor of Science in finance and accounting from St. Joseph’s College.
70
Graham M. Comley has served as Chief Information Officer of our operating subsidiary, Velocity Commercial Capital LLC, since September 2016. He has held various senior and executive positions with both publicly and privately-held companies. From February 2015 to August 2016, Mr. Comley was Director of Advanced Analytics for the West Coast at West Monroe Partners, where he practiced consulting in numerous industries undergoing profound change. From September 2013 to January 2015, he served as Director of Strategic Services at TIBCO Inc., a software company providing business intelligence solutions. From 2010 to 2013, Mr. Comley served as Senior Vice President of Consulting at Extended Results, a business intelligence company which he helped position for acquisition by TIBCO Inc. in 2013. From 2009 to 2010, he served as Business Development Manager at P2 Solutions, a consulting company that provides technology services to clients. From 2001 to 2007 he served as Vice President of Operations at Deterministics, a restaurant labor management, productivity and engineering company. Mr. Comley is a Trustee Board Member for The Leukemia & Lymphoma Society’s Washington/Alaska Chapter. Mr. Comley received his Bachelor of Science in Metallurgical Engineering from the University of Washington.
Joseph A. Cowell has served as our Chief Operating Officer since April 1, 2016. Mr. Cowell has 15 years’ experience in real estate finance and mortgage lending operations. Mr. Cowell has held a variety of roles at Velocity Commercial Capital since joining in 2004. From 2012 to 2016, he served as Chief Credit Officer, Senior Vice President of Whole Loan Acquisitions, and Vice President of Production and Operations. Prior to joining Velocity, Mr. Cowell worked at BayView Financial Trading Group as a capital markets analyst and an account executive for a Bayview subsidiary company, Interbay Funding. Mr. Cowell received a Bachelor of Arts from Western Colorado State University in Business Administration, a Certificate in Real Estate from the University of California Los Angeles, and a Master of Science degree in Banking and Financial Services Management from Boston University.
Daniel J. Ballen has served as a member of our board of directors since December 2016. He has led numerous private equity investments in both the U.S. and Europe, and currently serves as a board member on a wide range of both private and public companies in the financial services and technology sectors. Mr. Ballen brings significant private equity and investment experience to our board of directors. Since June 2014, Mr. Ballen has served as a Portfolio Manager and Executive Vice President at Pacific Investment Management Company LLC, where he helps lead the corporate private equity investment strategy for the firm’s alternative investment complex. Prior to joining Pacific Investment Management Company LLC, Mr. Ballen was a member of the private equity investment teams at Pine Brook Partners from 2011 to April 2014 and at Bain Capital from 2007 to 2010, where he executed and managed private equity investments in the U.S. across a variety of sectors. Mr. Ballen started his career in the investment banking division of Bear, Stearns & Co., where he was a member of the U.S. financial institutions advisory team. Mr. Ballen received a bachelor’s degree from Emory University.
Alan H. Mantel has served as a member of our board of directors since 2007 and as Chairman of our board of directors since 2020. With over 25 years on Wall Street, Mr. Mantel has experience across a wide array of investment banking disciplines including corporate finance, financial advisory services and structured finance. Mr. Mantel brings to our board of directors extensive experience in the financial services sector, including leveraged and structured finance, and background with and knowledge of accounting principles. Mr. Mantel is a Partner of Snow Phipps and has served in such capacity since its inception in 2005. Mr. Mantel served as Managing Director at Donaldson, Lufkin & Jenrette Inc. prior to its merger with Credit Suisse. Mr. Mantel served as Managing Director in the Leveraged Finance department at Credit Suisse from 2000 to 2004. Mr. Mantel was a Senior Accountant and Certified Public Accountant (inactive) at Ernst & Young LLP from 1985 to 1988. Mr. Mantel received a Bachelor of Science in accounting from the State University of New York at Albany and a Master of Business Administration in finance from the University of Chicago.
John P. Pitstick has served as a member of our board of directors since 2020. Mr. Pitstick has experience in accounting, taxes, capital markets, financial operations, internal controls, and SEC reporting/compliance matters. Mr. Pitstick brings over 20 years of combined experience as an executive of publicly traded and privately held companies along with experience at a major accounting firm to our board of directors. Mr. Pitstick served as Executive Vice President from 2005 to 2007 and then as Chief Financial Officer from 2007 to 2015 of publicly traded Conversant, Inc. Since September 2015, Mr. Pitstick has served as the Chief Financial Officer of privately held software company Seven Lakes Enterprises, Inc. From 1995 to 2004, Mr. Pitstick worked for Ernst & Young LLP serving a broad range of clients in the technology, biotech and financial services industries as a Certified Public
71
Accountant and ultimately as a Senior Manager. Mr. Pitstick received a Bachelor of Science in accounting from the University of San Francisco.
John A. Pless has served as a member of our board of directors since 2007. Mr. Pless brings broad finance and corporate governance experience to our board of directors. Mr. Pless joined Snow Phipps at the inception of the firm in 2005 and became a Partner in 2012. Prior to that time, Mr. Pless served as Associate Director in the Financial Institutions Group at UBS Investment Bank, the investment banking arm of UBS AG, where he worked on a wide range of mergers and acquisitions and capital raising transactions for banks and specialty finance companies. Before joining UBS, Mr. Pless worked at Guggenheim Merchant Banking. Mr. Pless currently serves on the boards of BlackHawk, Cascade, EnviroFinance Group, HCTec, Ideal Tridon, Kele and Winchester Interconnect. Mr. Pless received a Bachelor of Arts in economics from Middlebury College.
Joy L. Schaefer has served as a member of our board of directors since 2020. Ms. Schaefer brings to our board a broad range of experience in a variety of asset classes including auto finance, residential mortgages, multi-family mortgages and home equity lending. Since August 2005, Ms. Schaefer has served as president of Golden Eagle Advisors, LLC, a consulting firm focused on organizational development and growth through strategic, operational and financial improvements. From 2005 until August 2018, Ms. Schaefer served as an operating partner of Snow Phipps. From 2002 until 2005, Ms. Schaefer served as president of JL Schaefer Consulting, a strategic, financial and operational consulting practice, advising privately held and family-owned businesses. In 2002, Ms. Schaefer served as president and chief operating officer of Ameriquest Mortgage, a privately held mortgage banking company. From 1990 until 2002, Ms. Schaefer served in various senior management positions within the Westcorp family of companies, including as president and chief operating officer of Westcorp, Inc., a publicly traded financial services holding company; vice chairman, chief executive officer, president and chief operating officer of WFS Financial, Inc., a publicly traded national automobile finance company; and chief operating officer, senior executive vice president, chief financial officer and treasurer of Western Financial Bank, Inc. Earlier in her career, Ms. Schaefer was an audit manager for Ernst & Young. Ms. Schaefer serves on the board of directors of American Assets Trust, Inc. Ms. Schaefer received a Bachelor of Science degree in Accounting from Illinois Wesleyan University.
There are no family relationships among any of our directors, prospective directors or executive officers.
Role of Board of Directors in Risk Oversight
The board of directors has extensive involvement in the oversight of risk management related to us and our business and accomplishes this oversight through the regular reporting by the Audit Committee. The Audit Committee represents the board of directors by periodically reviewing our accounting, reporting and financial practices, including the integrity of our financial statements, the surveillance of administrative and financial controls and our compliance with legal and regulatory requirements. Through its regular meetings with management, including the finance, legal, and internal audit functions, the Audit Committee reviews and discusses all significant areas of our business and summarizes for the board of directors all areas of risk and the appropriate mitigating factors. In addition, our board of directors receives periodic detailed operating performance reviews from management.
Committees of the Board of Directors
Audit Committee
Our Audit Committee is comprised of Mr. Mantel, Ms. Schaefer and Mr. Pitstick, each of whom is “financially literate” under the rules of the NYSE. Mr. Pitstick, Ms. Schaefer and Mr. Mantel each qualify as independent directors under the NYSE corporate governance standards, and Mr. Pitstick and Ms. Schaefer each qualify as an independent director under the independent requirements of Rule 10A-3 of the Exchange Act. Mr. Pitstick is the chair of our Audit Committee and serves as our Audit Committee financial expert, as that term is defined by the Sarbanes-Oxley Act.
The purpose of our Audit Committee is to assist our board of directors in overseeing and monitoring:
|
|
• |
our financial reporting, auditing and internal control activities, including the quality and integrity of our financial statements; |
72
|
|
• |
our independent registered public accounting firm’s qualifications and independence; and |
|
|
• |
the performance of our internal audit team and our independent registered public accounting firm. |
The Audit Committee is also responsible for engaging our independent registered public accounting firm, reviewing with our independent registered public accounting firm the plans and results of the audit engagement, approving professional services provided by our independent registered public accounting firm, considering the range of audit and non-audit fees, reviewing the adequacy of our internal accounting controls and preparing the Audit Committee Report that will be included in our annual proxy statement.
Compensation Committee
Our Compensation Committee is comprised of Mr. Ballen, Mr. Mantel and Mr. Pitstick, each of whom is an independent director under the rules of the NYSE. Mr. Mantel is the chair of our Compensation Committee.
The Compensation Committee is responsible for approving, administering and interpreting the compensation arrangements and benefit policies of our executive officers, including our executive officer incentive programs. It reviews and makes recommendations to our board of directors to ensure that our compensation and benefit policies are consistent with our compensation philosophy and corporate governance guidelines. The Compensation Committee is also responsible for reviewing and approving all of our equity-based compensation plans, implementing, administering and interpreting all equity-based and similar compensation plans to the extent provided under the terms of such plans, including the power to amend such plans, and reviewing and approving awards of shares or options to our executive officers and employees pursuant to our equity-based plans.
Nominating/Corporate Governance Committee
Our Nominating/Corporate Governance Committee is comprised of Mr. Ballen, Mr. Pless and Ms. Schaefer, each of whom is an independent director under the rules of the NYSE. Mr. Pless is the chair of our Nominating/Corporate Governance Committee.
The purpose of the Nominating/Corporate Governance Committee is to take a leadership role in shaping the corporate governance policies of the Company, identify individuals qualified to be nominated for election to the board of directors by stockholders, nominate committee chairpersons and, in consultation with the committee chairpersons, nominate directors for membership on the committees of our board of directors. When nominating directors for election to the board of directors, the Nominating/ Corporate Governance Committee considers such potential nominees’ individual qualifications, including strength of character, mature judgment, familiarity with our business and industry, independence of thought and ability to work collegially with others, as well as other factors the committee may deem appropriate, which may include ensuring that the board of directors, as a whole, is appropriately diverse and consists of individuals with various and relevant career experience, technical skills, industry knowledge and financial expertise. It also oversees the evaluation of members of the board of directors and management. In addition, the Nominating/Corporate Governance Committee develops and recommends applicable Corporate Governance Guidelines to our board of directors.
Director Nomination Rights
We are party to a stockholders agreement with Snow Phipps and TOBI. Pursuant to the terms of this stockholders agreement, Snow Phipps has the right to nominate up to two directors to our board of directors for so long as Snow Phipps and its affiliates, together with their permitted transferees, hold at least 15% of the number of shares of our common stock outstanding immediately following the consummation of our IPO. Snow Phipps has the right to nominate one director to our board of directors for so long as Snow Phipps and its affiliates, together with their permitted transferees, hold at least 7.5% of the number of shares of our common stock outstanding immediately following the consummation of our IPO. TOBI has the right to nominate one director to our board of directors for so long as TOBI and its affiliates, together with their permitted transferees, hold at least 7.5% of the number of shares of our common stock outstanding immediately following the consummation of our IPO. Furthermore, Mr. Farrar has the right to nominate one director until he ceases to beneficially own at least 50% of the number of shares of our
73
common stock that he owns immediately following the consummation of our IPO. Our stockholders agreement provides that we may, at our discretion, require that one of Snow Phipps’ director nominees be “independent” as defined by the NYSE. In addition, our stockholders agreement provides that for so long as they are entitled to nominate at least one member of our board of directors, each of Snow Phipps and TOBI, as applicable, shall be entitled to have one of their director nominees appointed to each of our Compensation Committee and Nominating/Corporate Governance Committee, subject to qualification under applicable NYSE rules. For so long as Snow Phipps and its affiliates have the right to designate at least one director, we must take all action necessary to ensure the board of directors does not exceed seven members.
We are also party to a securities purchase agreement with Snow Phipps and TOBI. Pursuant to this securities purchase agreement, in addition to the nomination rights described above, TOBI has the right to nominate one additional director to the our board of directors so long as TOBI and its permitted transferees beneficially own 25% of the Preferred Stock (and any common stock issued upon conversion thereof). Further, pursuant to this securities purchase agreement, if Snow Phipps and its affiliates, together with its permitted transferees, ceases to beneficially own at least 7.5% of the number of shares of our common stock outstanding immediately following the consummation of our IPO, Snow Phipps will retain the right to nominate one director to serve on our board of directors for so long as Snow Phipps and its permitted transferees continue to beneficially own at least 25% of the of the Preferred Stock (and any common stock issued upon conversion thereof).
As of the date of filing this Annual Report, TOBI has not yet exercised its right pursuant to the securities purchase agreement to designate an additional nominee to serve as a member of our board of directors. Upon TOBI’s exercise of this right, our board of directors will promptly increase the size of the board to seven members and appoint such nominee to serve on our board of directors.
Stockholder Director Nominations
Our bylaws permit any stockholder entitled to vote at our annual meeting to submit director nominations to be included in our proxy materials for such annual meeting so long as such stockholder complies with the notice procedures set forth in our bylaws and is a stockholder of record at the time such notice is delivered. The notice required to nominate a director for the 2021 annual meeting through this proxy access process must be delivered to (or mailed to and received at) the address set forth below no later than October 18, 2020 and no earlier than September 18, 2020; provided, however, that if we elect to hold the annual meeting either before December 17, 2020 or after March 27, 2021, notice will be timely if delivered not earlier than 120 days prior to the annual meeting or later than the later of (a) 90 days prior to the annual meeting or (b) the tenth day following the day on which public announcement of the annual meeting date is made. The notice must set forth the information required by our bylaws with respect to each proxy access director nomination that the eligible stockholder or stockholders intend to present at the 2021 annual meeting and must otherwise be in compliance with our bylaws.
Code of Business Conduct and Ethics
We have adopted a written Code of Business Conduct and Ethics (the “Code of Ethics”) applicable to all employees, executive officers and directors that addresses legal and ethical issues that may be encountered in carrying out their duties and responsibilities, including the requirement to report any conduct they believe to be a violation of the Code of Ethics. A current copy of the Code of Ethics is posted on the Governance section of our investor relations website, which is located at https://www.velfinance.com/, and will be made available in printed form to any stockholder who requests it. If we ever were to amend or waive any provision of our Code of Ethics that applies to our principal executive officer, principal financial officer, principal accounting officer or any person performing similar functions, we intend to satisfy our disclosure obligations with respect to any such waiver or amendment by posting such information on our internet website set forth above rather than by filing a Form 8-K.
Item 11. Executive Compensation.
Compensation Discussion and Analysis
This Compensation Discussion and Analysis provides an overview of our executive compensation philosophy, the overall objectives of our executive compensation program, and each material element of compensation for the fiscal year ended December 31, 2019 that we provided to each person who served as our principal executive officer
74
or principal financial officer during 2019 and our three most highly compensated executive officers employed at the end of 2019 other than those persons, all of whom we refer to collectively as our Named Executive Officers.
Our Named Executive Officers for the fiscal year ended December 31, 2019 were as follows:
|
|
• |
Christopher D. Farrar, Chief Executive Officer; |
|
|
• |
Mark R. Szczepaniak, Chief Financial Officer; |
|
|
• |
Jeffrey T. Taylor, Executive Vice President, Capital Markets; |
|
|
• |
Joseph Cowell, Chief Operating Officer, Velocity Commercial Capital LLC; and |
|
|
• |
Graham Comley, Chief Information Officer, Velocity Commercial Capital LLC. |
Prior to our IPO, our board of directors was responsible for establishing, implementing, and evaluating our employee compensation and benefit programs. Our board of directors annually evaluated the performance of our Chief Executive Officer and our other executive officers, established the annual salaries and cash bonus awards for our Chief Executive Officer and our other executive officers, and approved all equity awards. Our board of directors’ objective was to ensure that the total compensation paid to our Named Executive Officers as well as our other senior officers was fair, reasonable, and competitive. Generally, the types of compensation and benefits provided to our Named Executive Officers was similar to those provided to other senior members of our management team. Since the completion of our IPO in January 2020, the Compensation Committee of our board of directors has been responsible for overseeing our compensation program.
Executive Compensation Objectives and Philosophy
The goal of our executive compensation program is to create long-term value for our investors while at the same time rewarding our executives for superior financial and operating performance and encouraging them to remain with us for long, productive careers. We believe the most effective way to achieve this objective is to design an executive compensation program rewarding the achievement of specific annual, long-term and strategic goals and aligning executives’ interests with those of our investors by further rewarding performance above established goals. We use this philosophy as the foundation for evaluating and improving the effectiveness of our executive pay program. The following are the core elements of our executive compensation philosophy:
|
|
• |
Market Competitive: Compensation levels and programs for executives, including our Named Executive Officers, should be competitive relative to the marketplace in which we operate. It is important for us to leverage an understanding of what constitutes competitive pay in our market and build unique strategies to attract the high caliber talent we require to manage and grow our Company; |
|
|
• |
Performance-Based: Most executive compensation should be performance-based pay that is “at risk,” based on short-term and long-term goals, which reward both organizational and individual performance; |
|
|
• |
Investor Aligned: Incentives should be structured to create a strong alignment between executives and investors on both a short-term and a long-term basis; and |
|
|
• |
Financially Efficient: Pay programs and features should attempt to minimize the impact on our earnings and maximize our tax benefits, all other things being equal. |
By incorporating these elements, we believe our executive compensation program is responsive to our investors’ objectives and effective in attracting, motivating, and retaining the level of talent necessary to grow and manage our business successfully.
Process for Determining Compensation
In determining the compensation of the Chief Executive Officer, our board of directors annually follows a thorough and detailed process. At the end of each year, our board of directors reviews a self-assessment prepared by the Chief Executive Officer regarding his performance and our performance, and meets (with and without the Chief Executive Officer) to evaluate and discuss his performance and our performance. While our board of directors tries
75
to ensure that a substantial portion of the Chief Executive Officer’s compensation is directly linked to his performance and the performance of our business, our board of directors also seeks to set his compensation in a manner that is competitive with compensation for similarly performing executive officers with similar responsibilities in companies we consider our peers.
In determining the compensation of each of our Named Executive Officers (other than the Chief Executive Officer), our board of directors seeks the input of the Chief Executive Officer. At the end of each year, the Chief Executive Officer reviews a self-assessment prepared by each Named Executive Officer and assesses our Named Executive Officer’s performance against the business unit (or area of responsibility) and individual goals and objectives. Our board of directors and the Chief Executive Officer then review the Chief Executive Officer’s assessments and, in that context, our board of directors approves the compensation for each Named Executive Officer.
Considerations in Setting 2019 Compensation
In approving 2019 compensation for our Named Executive Officers, our board of directors took under advisement the recommendation of the Chief Executive Officer relating to the total compensation package for our Named Executive Officers and, based on company-wide operating results and the extent to which individual performance objectives were met, our board of directors determined 2019 compensation for each of our Named Executive Officers. Our board of directors believes that the total 2019 compensation opportunity for our Named Executive Officers was competitive while at the same time being responsible to our investors because a significant percentage of total compensation in 2019 was allocated to variable compensation, paid only upon achievement of both individual and Company performance objectives.
The following is a summary of key considerations that affected the development of 2019 compensation decisions for our Named Executive Officers, and which our board of directors believes will continue to affect the compensation decisions of the Compensation Committee in future years:
Use of Market Data. We establish target compensation levels that are consistent with market practice and internal equity considerations (including position, responsibility and contribution) relative to base salaries, cash bonuses, and long-term equity compensation, as well as with the assessment of the appropriate pay mix for a particular position. In order to gauge the competitiveness of our compensation programs, we may also review compensation practices and pay opportunities from financial services and real estate lending industry survey data. We attempt to position ourselves to attract and retain qualified senior executives in the face of competitive pressures in relevant labor markets.
Emphasis on Performance. Our compensation program provides increased pay opportunity correlated with superior performance over the long term. When evaluating base salary, individual performance is the primary driver that determines our Named Executive Officer’s annual increase, if any. Historically, we have used discretionary cash bonuses to reward corporate and individual performance.
Importance of Company Results. In determining the amount of cash bonus for each Named Executive Officer, we may consider performance with respect to our success in implementing our short-term business strategies that yield long-term benefits, such as increasing or maintaining the amount of loans in our portfolio, credit quality and portfolio earnings. Our board of directors believes it is important to hold our Named Executive Officers accountable for overall company results.
We expect that going forward, the Compensation Committee will adhere to the compensation philosophy described above. In addition, we anticipate that the Compensation Committee will retain an independent compensation consultant who will provide the Compensation Committee with input and guidance on all components of our executive compensation program and will advise the Compensation Committee with respect to market data for base salary, annual bonus and long-term equity compensation for similarly situated executives in our peer group.
76
Elements of 2019 Compensation Program
There are three key components of our executive compensation program for our Named Executive Officers:
|
|
• |
base salary; |
|
|
• |
cash incentive bonus; and |
|
|
• |
long-term equity incentive compensation. |
In addition to these key compensation elements, our Named Executive Officers are provided certain other compensation, as described in “—Other Compensation.”
We believe that offering each of the components of our executive compensation program is necessary to remain competitive in attracting and retaining talented executives. Base salaries and discretionary cash bonuses are designed to reward executives for their performance and our performance. Furthermore, the cash incentive bonuses and long-term equity incentive compensation align the executive’s goals with our goals and those of our stockholders. The components of incentive compensation (the cash bonus and equity awards) are significantly “at risk,” as the cash bonuses and the intrinsic value of the equity awards may depend on the extent to which certain of our operating and financial goals are achieved. Collectively, these components are designed to reward and influence the executive’s individual performance and our short-term and long-term performance.
Base Salary
We pay our Named Executive Officers base salaries to compensate them for services rendered each year. Base salary is a regular, cash payment, the amount of which is based on position, experience, and performance after considering the following primary factors: internal review of the executive’s compensation, relative to both U.S. national market targets and other executives’ salaries, and our board of directors’ assessment of the executive’s individual prior performance. Salary levels are typically considered annually as part of our performance review process but can be adjusted in connection with a promotion or other change in job responsibility.
The base salary of Mr. Farrar was increased from $300,000 to $350,000, effective January 7, 2019, reflecting our board of directors’ assessment of his individual contributions and performance during the 2019 fiscal year, and to provide a competitive salary for his particular position and duties. None of our other Named Executive Officers received a base salary increase in the 2019 fiscal year.
The following table summarizes the annual base salaries for the year ended December 31, 2019 of our Named Executive Officers.
|
Name |
|
2019 Salary ($) |
|
|
|
Christopher D. Farrar |
|
|
348,077 |
|
|
Mark R. Szczepaniak |
|
|
275,000 |
|
|
Jeffrey T. Taylor |
|
|
250,000 |
|
|
Joseph Cowell |
|
|
215,000 |
|
|
Graham Comley |
|
|
250,000 |
|
Effective January 6, 2020, the base salaries of each of Messrs. Farrar, Szczepaniak and Taylor were increased to $450,000, $325,000 and $275,000, respectively.
Cash Incentive Bonus
In addition to receiving base salaries, our Named Executive Officers are eligible to receive cash incentive bonuses.
We awarded discretionary cash bonuses to our Named Executive Officers for fiscal year 2019. Cash bonuses are designed to incentivize our Named Executive Officers at a variable level of compensation that is “at risk,” based
77
on our performance and the performance of such individual. Bonuses have historically been awarded, if at all, at the discretion of the board of directors, with input from our Chief Executive Officer. We use discretionary bonuses to reward corporate and individual performance. In determining the amount of cash bonus for each Named Executive Officer, we may consider performance with respect to our success in implementing our short-term business strategies that yield long-term benefits, such as increasing or maintaining the amount of loans in our portfolio, credit quality and portfolio earnings and increasing distributions to our stockholders. The bonus amount is payable in a lump sum cash amount, and the payment with respect to any bonus amount is subject to the executive’s continued employment through the payment date.
Commencing in 2020, we expect our Compensation Committee to decide whether the cash bonus will continue to be paid on a discretionary basis or pursuant to a formal bonus program.
The following table provides the cash incentive bonus earned by each Named Executive Officer in fiscal year 2019. Each bonus was paid in January 2020.
|
Name |
|
2019 Cash Incentive Bonus ($) |
|
|
|
Christopher D. Farrar |
|
|
500,000 |
|
|
Mark R. Szczepaniak |
|
|
137,500 |
|
|
Jeffrey T. Taylor |
|
|
210,000 |
|
|
Joseph Cowell |
|
|
200,000 |
|
|
Graham Comley |
|
|
120,000 |
|
Long-Term Equity Incentive Compensation
In addition to base salary and cash bonus compensation, each of our Named Executive Officers is provided long-term equity incentive compensation. The use of long-term equity incentives creates a link between executive compensation and our long-term performance, thereby creating alignment between executive and investor interests.
2012 Equity Incentive Plan
The Velocity Financial, LLC 2012 Equity Incentive Plan became effective on July 23, 2012 (the “2012 Plan”). Under the 2012 Plan, Velocity Financial, LLC granted each Named Executive Officer awards of Class B units, which were non-voting profits interests in Velocity Financial, LLC that entitled each executive to participate in the appreciation in Velocity Financial, LLC’s value above the applicable monetary distribution thresholds set forth in the Class B unit award agreements and to share in our future profits. Equity awards granted to our Named Executive Officers under the 2012 Plan were determined based on market competitiveness, criticality of position and individual performance (both historical and expected future performance).
Purpose
The principal purpose of the 2012 Plan was to provide our employees, including our executive officers, as well as our directors and consultants, with incentives for continuing their service relationship with us, and to closely align their interests with those of our stockholders.
Administration
Our board of managers administered the 2012 Plan and had the sole discretion and authority to designate grantees of awards and make all decisions and determinations on matters relating to the 2012 Plan.
Awards Subject to 2012 Plan
The 2012 Plan provided for the grant of units to employees, officers, directors and consultants of the Company. As a condition to the issuance of a unit pursuant to the 2012 Plan, each grantee was required to enter into
78
a unit award agreement, which provided the number of units issued to such grantee and the terms of such grant as determined by the board of directors. Velocity Financial, LLC reserved an aggregate of 16,071,791 units under the 2012 Plan (including the Class B units outstanding on the effective date of the 2012 Plan). As of December 31, 2019, no Class B units remained available for grant under the 2012 Plan.
Nontransferability and Distributions of Awards
Pursuant to the terms of the 2012 Plan, the Class B unit award agreements, and the limited liability company agreement of the Company, Class B units were not transferable and were only entitled to receive distributions in the event that distributions to Class A unitholders were in excess of the applicable distribution threshold set forth in the Unit Grant Agreement (as defined below).
Amendment and Termination
The 2012 Plan provided that the board of managers could terminate or amend the 2012 Plan in any respect. The termination or any modification or amendment of the 2012 Plan, could not affect a grantee’s rights regarding units previously issued to such grantee without such grantee’s consent.
The 2012 Plan was terminated effective as of the conversion of Velocity Financial, LLC to Velocity Financial, Inc. and all Class B units issued thereunder were cancelled at the time as our initial public offering exceeded the applicable monetary distribution thresholds of the Class B units.
Class B Unit Awards
Each Named Executive Officer was issued his Class B units pursuant to the terms of Velocity Financial, LLC’s standard Class B unit award agreement under the 2012 Plan (the “Unit Grant Agreement”), as described below. On July 9, 2012, Mr. Farrar was granted 4,787,342 Class B units; Mr. Taylor was granted 1,367,812 Class B units; and Mr. Cowell was granted 150,000 Class B units (these awards replaced Class B units previously granted by Velocity Commercial Capital, LLC under the Velocity Commercial Capital, LLC 2007 Equity Incentive Plan). On May 19, 2017, Mr. Farrar was granted 1,986,872 Class B units; Mr. Szczepaniak was granted 2,000,000 Class B units; Mr. Taylor was granted 2,000,000 Class B units; Mr. Cowell was granted 750,000 Class B units; and Mr. Comley was granted 400,000 Class B units. None of our Named Executive Officers were granted any Class B unit awards in 2019.
Vesting
Pursuant to the terms of the Unit Grant Agreement, the Class B units vested in equal annual installments on each of the first three anniversaries of the date of grant subject to continued service on each applicable vesting date. The Unit Grant Agreement further provided that upon the occurrence of an accelerated vesting event (as defined below), all otherwise unvested Class B units would vest immediately prior to the effective date of such accelerated vesting event.
Pursuant to the Unit Grant Agreement, “accelerated vesting event” means a transaction or transactions involving (i) a liquidation, dissolution or winding-up of Velocity Financial, LLC, whether voluntary or involuntary; (ii) a change in control; or (iii) a sale, lease or other disposition of all or substantially all of the assets of the Company and its subsidiaries on a consolidated basis.
Pursuant to the Unit Grant Agreement, “change in control” means any transaction or transaction in which, after giving effect to such transaction or transactions, securities representing in excess of 50% of the voting power of Velocity Financial, LLC (calculated on a fully-diluted basis) are owned directly, or indirectly through one or more entities, by any person other than Snow Phipps and its affiliates.
As of December 31, 2019, the Class B units granted to the Named Executive Officers in 2012 were fully vested, and the Class B units granted to the Named Executive Officers in 2017 were two-thirds vested with the remaining one-third scheduled to vest in May 2020. However, all such Class B units issued thereunder were
79
cancelled in the conversion of Velocity Financial, LLC to Velocity Financial, Inc. as our initial public offering price exceeded the applicable monetary distribution thresholds of the Class B units.
Effect of Certain Events on Awards
Pursuant to the Unit Grant Agreement, upon termination of employment without cause (as defined below) all unvested Class B units would have continued to vest for a period of six months following such termination date; and upon termination for any other reason, all unvested Class B units would have been immediately forfeited. In addition, upon termination of employment without cause, termination upon death or disability, or resignation by the executive, all vested Class B units (or Class B units that would have vested within six months following termination) could have been purchased by Velocity Financial, LLC for an aggregate purchase price equal to the fair market value of such Class B units as of the termination date. Upon termination of employment for cause or if the executive breaches a covenant provided in the Unit Grant Agreement, all vested Class B units would have been immediately forfeited.
Pursuant to the 2012 Plan, “cause” means (i) grantee’s conviction of, or plea of guilty or no contest to, a felony or other offense involving moral turpitude; (ii) grantee’s material breach of the Unit Grant Agreement; (iii) the nonprescription use of any controlled substance or abuse of alcohol that interferes with grantee’s job performance; (iv) the refusal by grantee to perform lawful duties directed by the board of directors; (v) grantee’s fraudulent act, bad faith or willful misconduct in the performance of his or her duties to Velocity Financial, LLC or its affiliates; (vi) grantee’s material dishonesty in the performance of his duties to Velocity Financial, LLC or its affiliates; or (vii) grantee’s gross negligence in the performance of his or her duties to Velocity Financial, LLC or its affiliates.
Confidentiality and Non-Solicitation Covenants
Pursuant to the Unit Grant Agreement, each Named Executive Officer is subject to a confidentiality covenant that survives the termination of the Named Executive Officer’s employment and any termination of the Unit Grant Agreement. Upon breach or threatened breach of the confidentiality covenant, the Company is entitled to an injunction restraining the Named Executive Officer from engaging in any activity constituting such breach or threatened breach, and may pursue any other remedies available at law or in equity. Pursuant to the Unit Grant Agreement, each Named Executive Officer is also subject to a post-termination non-solicitation of employees covenant for a period that is the longer of (i) a period of twelve consecutive months after the Named Executive Officer’s employment terminates, and (ii) a period during which the Company is providing benefits to the Named Executive Officer under any employment agreement or consulting agreement.
Conversion of Class B Units into Shares
Because our initial public offering price of $13.00 per share exceed the applicable monetary distribution thresholds of the Class B units, all Class B units were cancelled for no consideration in the conversion of Velocity Financial, LLC to Velocity Financial, Inc.
2020 Omnibus Incentive Plan
In connection with our IPO, our board of directors adopted, and our stockholders approved, the Velocity Financial, Inc. 2020 Omnibus Incentive Plan. Equity awards under the 2020 Plan are designed to reward our Named Executive Officers for long-term stockholder value creation. In determining equity awards, we anticipate that our Compensation Committee will take into account the Company’s overall financial performance as well as its performance versus competitor firms. The awards made to certain key employees under the 2020 Plan concurrent with the closing of our IPO were granted to recognize such individuals’ efforts on our behalf in connection with our formation and the IPO to ensure their alignment with our stockholder’s interests, and to provide a retention element to their compensation.
Purpose The purpose of the 2020 Plan is to provide a means through which to attract and retain key personnel and to provide a means whereby our directors, officers, employees, consultants and advisors can acquire and maintain an equity interest in us, or be paid incentive compensation, including incentive compensation measured
80
by reference to the value of our common stock, thereby strengthening their commitment to our welfare and aligning their interests with those of our stockholders.
Administration The 2020 Plan is administered by the Compensation Committee of our board of directors or such other committee of our board of directors to which it has properly delegated power, or if no such committee or subcommittee exists, our board of directors. The Compensation Committee is authorized to interpret, administer, reconcile any inconsistency in, correct any defect in and/or supply any omission in the 2020 Plan and any instrument or agreement relating to, or any award granted under, the 2020 Plan; establish, amend, suspend, or waive any rules and regulations and appoint such agents as the Compensation Committee deems appropriate for the proper administration of the 2020 Plan; adopt sub-plans; and to make any other determination and take any other action that the Compensation Committee deems necessary or desirable for the administration of the 2020 Plan. Except to the extent prohibited by applicable law or the applicable rules and regulations of any securities exchange or inter-dealer quotation system on which our securities are listed or traded, the Compensation Committee may allocate all or any portion of its responsibilities and powers to any one or more of its members and may delegate all or any part of its responsibilities and powers to any person or persons selected by it in accordance with the terms of the 2020 Plan. Unless otherwise expressly provided in the 2020 Plan, all designations, determinations, interpretations, and other decisions under or with respect to the 2020 Plan or any award or any documents evidencing awards granted pursuant to the 2020 Plan are within the sole discretion of the Compensation Committee, may be made at any time and are final, conclusive and binding upon all persons or entities, including, without limitation, us, any participant, any holder or beneficiary of any award, and any of our stockholders. The Compensation Committee may make grants of awards to eligible persons pursuant to terms and conditions set forth in the applicable award agreement, including subjecting such awards to performance criteria listed in the 2020 Plan.
Awards Subject to 2020 Plan The 2020 Plan provides that the total number of shares of common stock that may be issued under the 2020 Plan is 1,520,000, which is referred to as the Absolute Share Limit. No more than the number of shares of common stock equal to the Absolute Share Limit may be issued in the aggregate pursuant to the exercise of incentive stock options. The maximum number of shares of common stock granted during a single fiscal year to any non-employee director, taken together with any cash fees paid to such non-employee director during the fiscal year, may not exceed $1,000,000 in total value. Except for substitute awards (as described below), in the event any award expires or is cancelled, forfeited or terminated without issuance to the participant of the full number of shares to which the award related, the unissued shares of common stock may be granted again under the 2020 Plan. Awards may, in the sole discretion of the Compensation Committee, be granted in assumption of, or in substitution for, outstanding awards previously granted by an entity directly or indirectly acquired by us or with which we combine, referred to as substitute awards, and such substitute awards will not be counted against the Absolute Share Limit, except that substitute awards intended to qualify as “incentive stock options” will count against the limit on incentive stock options described above. No award may be granted under the 2020 Plan after the tenth anniversary of the effective date (as defined therein), but awards granted before then may extend beyond that date.
Options The Compensation Committee may grant non-qualified stock options and incentive stock options, under the 2020 Plan, with terms and conditions determined by the Compensation Committee that are not inconsistent with the 2020 Plan. All stock options granted under the 2020 Plan are required to have a per share exercise price that is not less than 100% of the fair market value of our common stock underlying such stock options on the date such stock options are granted (other than in the case of options that are substitute awards). All stock options that are intended to qualify as incentive stock options must be granted pursuant to an award agreement expressly stating that the options are intended to qualify as incentive stock options and will be subject to the terms and conditions that comply with the rules as may be prescribed by Section 422 of the Internal Revenue Code of 1986, as amended (the “Code”). The maximum term for stock options granted under the 2020 Plan will be ten years from the initial date of grant, or with respect to any stock options intended to qualify as incentive stock options, such shorter period as prescribed by Section 422 of the Code. However, if a non-qualified stock option would expire at a time when trading of shares of our common stock is prohibited by our insider trading policy (or “blackout period” imposed by us), the term will automatically be extended to the 30th day following the end of such period. The purchase price for the shares as to which a stock option is exercised may be paid to us, to the extent permitted by law, (i) in cash or its equivalent at the time the stock option is exercised; (ii) in shares having a fair market value equal to the aggregate exercise price for the shares being purchased and satisfying any requirements that may be imposed by the Compensation Committee (so long as such shares have been held by the participant for at least six months or such other period established by the Compensation Committee to avoid adverse accounting treatment); or
81
(iii) by such other method as the Compensation Committee may permit in its sole discretion, including, without limitation, (A) in other property having a fair market value on the date of exercise equal to the purchase price, (B) if there is a public market for the shares at such time, through the delivery of irrevocable instructions to a broker to sell the shares being acquired upon the exercise of the stock option and to deliver to us the amount of the proceeds of such sale equal to the aggregate exercise price for the shares being purchased or (C) through a “net exercise” procedure effected by withholding the minimum number of shares needed to pay the exercise price. Any fractional shares of common stock will be settled in cash.
Stock Appreciation Rights The Compensation Committee may grant stock appreciation rights under the 2020 Plan, with terms and conditions determined by the Compensation Committee that are not inconsistent with the 2020 Plan. The Compensation Committee may award stock appreciation rights in tandem with options or independent of any option. Generally, each stock appreciation right will entitle the participant upon exercise to an amount (in cash, shares or a combination of cash and shares, as determined by the Compensation Committee) equal to the product of (i) the excess of (A) the fair market value on the exercise date of one share of common stock, over (B) the strike price per share, times (ii) the number of shares of common stock covered by the stock appreciation right. The strike price per share of a stock appreciation right will be determined by the Compensation Committee at the time of grant but in no event may such amount be less than 100% of the fair market value of a share of common stock on the date the stock appreciation right is granted (other than in the case of stock appreciation rights granted in substitution of previously granted awards).
Restricted Shares and Restricted Stock Units The Compensation Committee may grant restricted shares of our common stock or restricted stock units, representing the right to receive, upon vesting and the expiration of any applicable restricted period, one share of common stock for each restricted stock unit, or, in the sole discretion of the Compensation Committee, the cash value thereof (or any combination thereof). As to restricted shares of our common stock, subject to the other provisions of the 2020 Plan, the holder will generally have the rights and privileges of a stockholder as to such restricted shares of common stock, including, without limitation, the right to vote such restricted shares of common stock. Participants have no rights or privileges as a stockholder with respect to restricted stock units.
Other Equity-Based Awards and Cash-Based Awards The Compensation Committee may grant other equity-based or cash-based awards under the 2020 Plan, with terms and conditions determined by the Compensation Committee that are not inconsistent with the 2020 Plan.
Effect of Certain Events on 2020 Plan and Award In the event of (i) any dividend (other than regular cash dividends) or other distribution (whether in the form of cash, shares of common stock, other securities or other property), recapitalization, stock split, reverse stock split, reorganization, merger, consolidation, split-up, split-off, spin-off, combination, repurchase or exchange of shares of common stock or other securities, issuance of warrants or other rights to acquire shares of common stock or other securities, or other similar corporate transaction or event that affects the shares of common stock (including a change in control, as defined in the 2020 Plan), or (ii) unusual or nonrecurring events affecting the Company, including changes in applicable rules, rulings, regulations or other requirements, that the Compensation Committee determines, in its sole discretion, could result in substantial dilution or enlargement of the rights intended to be granted to, or available for, participants (any event in (i) or (ii), being referred to as an Adjustment Event), the Compensation Committee will, in respect of any such Adjustment Event, make such proportionate substitution or adjustment, if any, as it deems equitable, to any or all of: (A) the Absolute Share Limit, or any other limit applicable under the 2020 Plan with respect to the number of awards which may be granted thereunder, (B) the number of shares of common stock or other securities of the Company (or number and kind of other securities or other property) which may be issued in respect of awards or with respect to which awards may be granted under the 2020 Plan or any sub-plan and (C) the terms of any outstanding award, including, without limitation, (1) the number of shares of common stock or other securities of the Company (or number and kind of other securities or other property) subject to outstanding awards or to which outstanding awards relate, (2) the exercise price or strike price with respect to any award, or (3) any applicable performance measures; it being understood that, in the case of any “equity restructuring,” the Compensation Committee will make an equitable or proportionate adjustment to outstanding awards to reflect such equity restructuring.
82
In connection with any change in control, the Compensation Committee may, in its sole discretion, provide for any one or more of the following: (i) a substitution or assumption of awards, or to the extent the surviving entity does not substitute or assume the awards, the acceleration of vesting of, the exercisability of, or lapse of restrictions on awards and (ii) cancellation of any one or more outstanding awards and payment to the holders of such awards that are vested as of such cancellation (including any awards that would vest as a result of the occurrence of such event but for such cancellation) the value of such awards, if any, as determined by the Compensation Committee (which value, if applicable, may be based upon the price per share of common stock received or to be received by other holders of our common stock in such event), including, in the case of stock options and stock appreciation rights, a cash payment equal to the excess, if any, of the fair market value of the shares of common stock subject to the option or stock appreciation right over the aggregate exercise price or strike price thereof.
Nontransferability of Awards Each award will not be transferable or assignable by a participant other than by will or by the laws of descent and distribution and any such purported assignment, alienation, pledge, attachment, sale, transfer or encumbrance will be void and unenforceable against us or any of our subsidiaries. However, the Compensation Committee may, in its sole discretion, permit awards (other than incentive stock options) to be transferred, including transfers to a participant’s family members, any trust established solely for the benefit of a participant or such participant’s family members, any partnership or limited liability company of which a participant, or such participant and such participant’s family members, are the sole member(s), and a beneficiary to whom donations are eligible to be treated as “charitable contributions” for tax purposes.
Amendment and Termination Our board of directors may amend, alter, suspend, discontinue, or terminate the 2020 Plan or any portion thereof at any time; but no such amendment, alteration, suspension, discontinuance or termination may be made without stockholder approval if (i) such approval is necessary to comply with any regulatory requirement applicable to the 2020 Plan or for changes in U.S. GAAP to new accounting standards; (ii) it would materially increase the number of securities which may be issued under the 2020 Plan (except for adjustments in connection with certain corporate events); or (iii) it would materially modify the requirements for participation in the 2020 Plan; and any such amendment, alteration, suspension, discontinuance or termination that would materially and adversely affect the rights of any participant or any holder or beneficiary of any award will not to that extent be effective without such individual’s consent.
The Compensation Committee may, to the extent consistent with the terms of any applicable award agreement, waive any conditions or rights under, amend any terms of, or alter, suspend, discontinue, cancel or terminate, any award granted or the associated award agreement, prospectively or retroactively (including after a participant’s termination). However, except as otherwise permitted in the 2020 Plan, any such waiver, amendment, alteration, suspension, discontinuance, cancellation or termination that would materially and adversely affect the rights of any participant with respect to such award will not to that extent be effective without such individual’s consent. In addition, without stockholder approval, except as otherwise permitted in the 2020 Plan, (i) no amendment or modification may reduce the exercise price of any option or the strike price of any stock appreciation right; (ii) the Compensation Committee may not cancel any outstanding option or stock appreciation right and replace it with a new option or stock appreciation right (with a lower exercise price or strike price, as the case may be) or other award or cash payment that is greater than the value of the cancelled option or stock appreciation right; and (3) the Compensation Committee may not take any other action which is considered a “repricing” for purposes of the stockholder approval rules of any securities exchange or inter-dealer quotation system on which our securities are listed or quoted.
Dividends and Dividend Equivalents The Compensation Committee in its sole discretion may provide part of an award with dividends or dividend equivalents, on such terms and conditions as may be determined by the Compensation Committee in its sole discretion. Unless otherwise provided in the award agreement, any dividend payable in respect of any share of restricted stock that remains subject to vesting conditions at the time of payment of such dividend will be retained by the Company and remain subject to the same vesting conditions as the share of restricted stock to which the dividend relates.
Clawback/Repayment All awards are subject to reduction, cancellation, forfeiture or recoupment to the extent necessary to comply with (i) any clawback, forfeiture or other similar policy adopted by our board of directors or the Compensation Committee and as in effect from time to time and (ii) applicable law. To the extent that a participant receives any amount in excess of the amount that the participant should otherwise have received
83
under the terms of the award for any reason (including, without limitation, by reason of a financial restatement, mistake in calculations or other administrative error), the participant will be required to repay any such excess amount to the Company.
IPO Option Awards In connection with our IPO, we granted the following number of nonqualified options to purchase shares of our common stock to our Named Executive Officers, as shown in the table below. The options were granted pursuant to our 2020 Plan and have a per share exercise price equal to $13.00, our initial public offering price. Each option will vest as to one-third of the shares subject to such option on each anniversary of the grant date, subject to continued employment on each applicable vesting date. Upon termination of employment without cause or resignation for good reason during the 12 month period following a change in control, any then-unvested shares subject to the option will vest in full.
|
Name |
|
Number of Options Granted |
|
|
|
Christopher D. Farrar |
|
|
375,000 |
|
|
Mark R. Szczepaniak |
|
|
100,000 |
|
|
Jeffrey T. Taylor |
|
|
100,000 |
|
|
Joseph Cowell |
|
|
75,000 |
|
|
Graham Comley |
|
|
20,000 |
|
Other Compensation
Health Benefits
We offer group health plan coverage, which is fully insured, to employees and pay 80% of the insurance premiums of our employees and 50% of the insurance premiums on their covered dependents. During 2019, we paid 100% of the health insurance premiums for our two founding Named Executive Officers and each of their covered dependents (dollar amounts below represent the amount of premiums we paid on behalf of those Named Executive Officers in excess of the amount of premiums paid on behalf of employees generally, which excess amounts we treated as taxable wages for each executive):
|
Christopher D. Farrar |
$ |
10,175 |
|
|
Jeffrey T. Taylor |
$ |
10,345 |
|
Retirement Benefits
We maintain a defined contribution pension plan (the “401(k) Plan”) for all full-time employees, including our Named Executive Officers, with at least three months of service. The 401(k) Plan is intended to qualify as a tax-qualified plan under Section 401(k) of the Code. The 401(k) Plan provides that each participant may contribute up to 90% of such participant’s compensation pursuant to certain restrictions. The 401(k) Plan allows for discretionary employer matching contributions, and we made discretionary contributions for the year ended December 31, 2019.
Tax and Accounting Implications
The board of directors operates its compensation programs with the good faith intention of complying with Section 409A of the Code. We account for equity-based payments with respect to our long-term equity incentive award programs in accordance with the requirements of FASB Accounting Standards Codification Topic 718, Compensation—Stock Compensation, or FASB ASC Topic 718.
84
The following table summarizes the total compensation earned by our Named Executive Officers in fiscal year 2019. We have omitted from this table the columns for Change in Pension Value and Nonqualified Deferred Compensation Earnings, because no Named Executive Officer received such types of compensation during fiscal year 2019. We have omitted from this table the column for Stock Awards, because no equity awards were granted to any Named Executive Officers during fiscal year 2019.
Summary Compensation Table
|
Name and Principal Position |
|
Year |
|
Salary ($)(1) |
|
|
Bonus ($)(2) |
|
|
All Other Compensation ($)(3) |
|
|
Total ($) |
|
||||
|
Christopher D. Farrar |
|
2019 |
|
|
348,077 |
|
|
|
500,000 |
|
|
|
15,775 |
|
|
|
863,852 |
|
|
Chief Executive Officer |
|
2018 |
|
|
300,000 |
|
|
|
400,000 |
|
|
|
14,952 |
|
|
|
714,952 |
|
|
|
|
|
|
|
|
|
|
|
|
|
|
|
|
|
|
|
|
|
|
Mark R. Szczepaniak |
|
2019 |
|
|
275,000 |
|
|
|
137,500 |
|
|
|
5,600 |
|
|
|
418,100 |
|
|
Chief Financial Officer |
|
2018 |
|
|
275,000 |
|
|
|
137,500 |
|
|
|
5,500 |
|
|
|
418,000 |
|
|
|
|
|
|
|
|
|
|
|
|
|
|
|
|
|
|
|
|
|
|
Jeffrey T. Taylor |
|
2019 |
|
|
250,000 |
|
|
|
210,000 |
|
|
|
15,945 |
|
|
|
475,945 |
|
|
Executive Vice President, Capital Markets |
|
2018 |
|
|
250,000 |
|
|
|
175,000 |
|
|
|
14,952 |
|
|
|
439,952 |
|
|
|
|
|
|
|
|
|
|
|
|
|
|
|
|
|
|
|
|
|
|
Joseph Cowell |
|
2019 |
|
|
215,000 |
|
|
|
200,000 |
|
|
|
5,600 |
|
|
|
420,600 |
|
|
Chief Operating Officer |
|
2018 |
|
|
215,000 |
|
|
|
150,000 |
|
|
|
5,500 |
|
|
|
370,500 |
|
|
|
|
|
|
|
|
|
|
|
|
|
|
|
|
|
|
|
|
|
|
Graham Comley |
|
2019 |
|
|
250,000 |
|
|
|
120,000 |
|
|
|
5,600 |
|
|
|
375,600 |
|
|
Chief Information Officer |
|
2018 |
|
|
250,000 |
|
|
|
100,000 |
|
|
|
5,500 |
|
|
|
355,500 |
|
|
(1) |
The amounts reported in the “Salary” column represent the base salary earned by each Named Executive Officer during the fiscal year covered. |
|
(2) |
The amounts reported in the “Bonus” column represent bonuses awarded for the fiscal year covered at the discretion of our board of directors. |
|
(3) |
The amounts reported in the “All Other Compensation” column for fiscal year 2019 represent the following with respect to each Named Executive Officer: |
|
|
• |
Mr. Farrar: matching contribution amount of $5,600 under the 401(k) Plan; reimbursement for medical insurance premiums in the amount of $10,175. |
|
|
• |
Mr. Szczepaniak: matching contribution amount of $5,600 under the 401(k) Plan. |
|
|
• |
Mr. Taylor: matching contribution amount of $5,600 under the 401(k) Plan; reimbursement for medical insurance premiums in the amount of $10,345. |
|
|
• |
Mr. Cowell: matching contribution amount of $5,600 under the 401(k) Plan. |
|
|
• |
Mr. Comley: matching contribution amount of $5,600 under the 401(k) Plan. |
Grants of Plan-Based Awards in 2019
None of our Named Executive Officers were granted any equity awards in 2019.
85
Outstanding Equity Awards at 2019 Year End
The following table provides certain information regarding outstanding equity awards held by our Named Executive Officers as of December 31, 2019. Because our initial public offering price of $13.00 per share exceeded the applicable monetary distribution thresholds of the Class B units, all Class B units were cancelled for no consideration in the conversion of Velocity Financial, LLC to Velocity Financial, Inc.
Outstanding Equity Awards at Fiscal Year End
|
|
|
Class B Unit Awards |
|
|||||||
|
Name |
|
Grant Date |
|
Number of Units that have Not Vested (#)(1) |
|
|
Market Value of Units that Have Not Vested ($)(2) |
|
||
|
Christopher D. Farrar |
|
5/19/2017 |
|
|
662,291 |
|
|
|
— |
|
|
Mark R. Szczepaniak |
|
5/19/2017 |
|
|
666,667 |
|
|
|
— |
|
|
Jeffrey T. Taylor |
|
5/19/2017 |
|
|
666,667 |
|
|
|
— |
|
|
Joseph Cowell |
|
5/19/2017 |
|
|
250,000 |
|
|
|
— |
|
|
Graham Comley |
|
5/19/2017 |
|
|
133,333 |
|
|
|
— |
|
|
(1) |
The numbers in this column represent unvested time-vesting Class B units granted in 2017 under the 2012 Plan to each Named Executive Officer. Each Named Executive Officer was issued the Class B units pursuant to the terms of the Unit Grant Agreement, as described in “—Long-Term Equity Incentive Compensation—Class B Unit Awards.” The Class B units vested in equal annual installments on each of the first three anniversaries of the date of grant subject to continued service on each applicable vesting date. On May 19, 2017, Mr. Farrar was granted 1,986,872 Class B units; Mr. Szczepaniak was granted 2,000,000 Class B units; Mr. Taylor was granted 2,000,000 Class B units; Mr. Cowell was granted 750,000 Class B units; and Mr. Comley was granted 400,000 Class B units. None of the Named Executive Officers were granted any equity awards in 2018 or in 2019. |
|
(2) |
The fair market value of a Class B unit on December 31, 2019 was determined to be zero, as no shares of common stock would be issued in respect of such Class B units had the conversion of Velocity Financial, LLC to Velocity Financial, Inc. occurred at December 31, 2019, assuming a value of $13.00 per share, which was the initial public offering price, and as noted above, all such Class B units were cancelled without consideration in the conversion. |
Class B Units Vested During Fiscal Year 2019
The following table provides information regarding the amounts received by our Named Executive Officers upon the vesting of Class B units during fiscal year 2019.
CLASS B UNITS VESTED
|
Name |
|
|
|
Number of Units Acquired on Vesting (#)(1) |
|
|
Value Received on Vesting ($)(2) |
|
||
|
Christopher D. Farrar |
|
|
|
|
662,291 |
|
|
|
— |
|
|
Mark R. Szczepaniak |
|
|
|
|
666,667 |
|
|
|
— |
|
|
Jeffrey T. Taylor |
|
|
|
|
666,667 |
|
|
|
— |
|
|
Joseph Cowell |
|
|
|
|
250,000 |
|
|
|
— |
|
|
Graham Comley |
|
|
|
|
133,333 |
|
|
|
— |
|
|
(1) |
The numbers in this column represent time-vesting Class B units granted in 2017 under the 2012 Plan to each Named Executive Officer which vested in 2019. Each Named Executive Officer was issued the Class B units pursuant to the Unit Grant Agreement, as described in “—Long-Term Equity Incentive Compensation—Class B Unit Awards.” The Class B units vest in equal annual installments on each of the first three anniversaries of the date of grant subject to continued service on each applicable vesting date. On May 19, 2017, Mr. Farrar was granted 1,986,872 Class B units; Mr. Szczepaniak was granted 2,000,000 Class B units; Mr. Taylor was granted 2,000,000 Class B units; Mr. Cowell was granted 750,000 Class B units; and Mr. Comley was granted 400,000 Class B units. |
|
(2) |
The fair market value of a Class B unit on each applicable vesting date in 2019 was $0, based on the most recently completed valuation of the Company’s Class B units by our board of directors in accordance with our equity grant policy. |
86
Potential Payments Upon Termination or Change in Control
Accelerated Vesting of Class B Units upon Change in Control
In 2017, each of Messrs. Farrar, Szczepaniak, Taylor, Cowell, and Comley were granted Class B units in the Company, pursuant to the Unit Grant Agreement under the 2012 Plan. Pursuant to the terms of the Unit Grant Agreement, these Class B units vested in equal annual installments on each of the first three anniversaries of the date of grant subject to continued service on each applicable vesting date. The Unit Grant Agreement further provided that upon the occurrence of an accelerated vesting event, which included a change in control, all otherwise unvested Class B units would have vested immediately prior to the effective date of such accelerated vesting event. No value is associated with the accelerated vesting of unvested Class B units held by each executive upon a change in control because the estimated fair value per Class B unit as of December 31, 2019 was $0 and, as noted above, all such Class B units were cancelled without consideration in the conversion of Velocity Financial, LLC to Velocity Financial, Inc.
Director Compensation
During 2019, we did not grant any equity awards or pay any other compensation to our non-employee directors. Our Chief Executive Officer does not receive any additional compensation for his service on our board of directors. None of our non-employee directors held any unvested equity awards on December 31, 2019.
Director Compensation Program
Our non-employee directors (other than those affiliated with Snow Phipps or TOBI) are eligible to receive cash compensation for service on our board of directors and committees of our board of directors as follows:
|
Board or Board Committee |
|
Membership |
|
Annual Retainer |
|
|
Meeting Fee (per Board or Committee meeting) |
|
||
|
Board of Directors |
|
Member |
|
$ |
20,000 |
|
|
$ |
1,000 |
|
|
Audit Committee |
|
Chairperson |
|
$ |
60,000 |
|
|
$ |
1,000 |
|
|
|
|
Member |
|
$ |
50,000 |
|
|
$ |
1,000 |
|
|
Compensation Committee |
|
Chairperson |
|
$ |
60,000 |
|
|
$ |
1,000 |
|
|
|
|
Member |
|
$ |
50,000 |
|
|
$ |
1,000 |
|
|
Nominating / Corporate Governance Committee |
|
Chairperson |
|
$ |
60,000 |
|
|
$ |
1,000 |
|
|
|
|
Member |
|
$ |
50,000 |
|
|
$ |
1,000 |
|
All members of our board of directors are also reimbursed for their reasonable out-of-pocket travel and other expenses incurred in attending meetings of our board of directors and its committees.
In connection with our IPO, we granted nonqualified options to purchase 12,500 shares of our common stock to each of our non-employee directors (other than those affiliated with Snow Phipps or TOBI). The options were granted pursuant to our 2020 Plan and have a per share exercise price equal to the initial public offering price of $13.00 per share. Each option will vest as to one-third of the shares subject to such option on each anniversary of the grant date, subject to continued service on each applicable vesting date. All unvested options will become fully vested in the event of a “change in control” (as such term is defined in the 2020 Plan). While it is anticipated that non-employee directors (other than those affiliated with Snow Phipps or TOBI) will receive annual equity grants, the form and amount of such grants has not yet been determined.
Compensation Committee Report
The Compensation Committee reviewed and discussed with management of the company the foregoing Compensation Discussion and Analysis. Based on such review and discussion, the Compensation Committee has recommended to the Board that the Compensation Discussion and Analysis be included in this Annual Report on Form 10-K for the fiscal year ended December 31, 2019.
87
Alan Mantel, Chair
Daniel Ballen
John Pitstick
Notwithstanding any statement in any of our filings with the SEC that might incorporate part or all of any filings with the SEC by reference, including this Annual Report on Form 10-K, the foregoing Compensation Committee Report is not incorporated into any such filings.
Compensation Committee Interlocks and Insider Participation
The members of the Compensation Committee are Messrs. Mantel, Ballen and Pitstick. None of the members of our Compensation Committee has ever been an officer or employee of the company or any of its subsidiaries and during 2019, none of our directors was employed as an executive officer of another entity where any of our executive officers served on that entity’s board of directors or compensation committee (or its equivalent). During 2019, Messrs. Mantel and Ballen were affiliated with Snow Phipps and TOBI, respectively, and we were party to certain agreements with Snow Phipps and TOBI described below under “Item 13. Certain Relationships and Related Transactions, and Director Independence—Related Party Transactions.” Neither Messr. Mantal nor Ballen had an interest in such transactions that would give rise to a relationship with us requiring disclosure under Item 404 of Regulation S-K under the Exchange Act.
Item 12. Security Ownership of Certain Beneficial Owners and Management and Related Stockholder Matters.
Securities Authorized for Issuance Under Equity Compensation Plans
As of December 31, 2019 we had a single equity compensation plan, the Velocity Financial, LLC 2012 Equity Incentive Plan (the “2012 Plan”). All outstanding awards under the 2012 Plan as of such date related to Class B units of Velocity Financial, LLC, our predecessor. These Class B units were non-voting profits interests in Velocity Financial, LLC that entitled holders to participate in the appreciation in Velocity Financial, LLC’s value above the applicable monetary distribution thresholds set forth in the Class B unit award agreements.
|
|
|
Number of Securities to be Issued upon Exercise of Outstanding Options, Warrants and Rights |
|
|
Weighted- average Exercise Price of Outstanding Options, Warrants and Rights |
|
|
Number of Securities Remaining Available for Future Issuance under Equity Compensation Plans (Excluding Securities Reflected in Column ( a )) |
|
|||
|
|
|
( a ) |
|
|
( b ) |
|
|
( c ) |
|
|||
|
Equity compensation plans approved by security holders (1) |
|
|
16,071,791 |
|
|
$ |
— |
|
|
$ |
— |
|
|
Equity compensation plans not approved by security holders |
|
|
— |
|
|
|
— |
|
|
|
— |
|
|
Total |
|
|
16,071,791 |
|
|
$ |
— |
|
|
$ |
— |
|
|
(1) |
Consists of Class B units of Velocity Financial, LLC issued under the 2012 Plan. On January 22, 2020, based on the initial public offering price of our common stock, all outstanding Class B units were cancelled for no value in the conversion of Velocity Financial, LLC to Velocity Financial, Inc. We cannot issue any further equity securities under the 2012 Plan. |
88
Security Ownership of Principal Stockholders
Based on information available to us as of February 29, 2020, the only stockholders known to us to beneficially own more than five percent of the outstanding shares of our common stock are (all percentages in the table are based on 20,087,494 shares of common stock outstanding as of February 29, 2020):
|
Name of Beneficial Owner |
|
Shares Beneficially Owned |
|
|
Percentage of Shares Beneficially Owned |
|
||
|
Snow Phipps(1) |
|
|
7,077,961 |
|
|
|
35.2 |
% |
|
TOBI III SPE I LLC(2) |
|
|
4,470,300 |
|
|
|
22.3 |
% |
|
(1) |
Includes 6,427,025 shares held by Snow Phipps Group AIV, L.P., 61,737 shares held by Snow Phipps Group (B), L.P., 207,730 shares held by Snow Phipps Group AIV (Offshore), L.P., 334,670 shares held by Snow Phipps Group (RPV), L.P. and 48,867 shares held by SPG Co-Investment, L.P. SPG GP, LLC (the “General Partner”) is the general partner of Snow Phipps Group AIV, L.P., Snow Phipps Group (B), L.P., Snow Phipps Group AIV (Offshore), L.P., Snow Phipps Group (RPV), L.P. and SPG Co-Investment, L.P. (collectively, the “Fund Entities”). As the general partner of the Fund Entities, the General Partner may be deemed to have beneficial ownership of the securities over which any of the Fund Entities has voting or dispositive power. Ian K. Snow, as the managing member of the General Partner, has the power to vote or direct the vote of, and to dispose or to direct the disposition of the securities that are held by the Fund Entities. Excludes shares of common stock issuable upon the conversion of 19,010 shares of Preferred Stock held by Snow Phipps Group AIV, L.P. and 990 shares of Preferred Stock held by Snow Phipps Group (RPV), L.P. and the exercise of 1,272,882 Warrants held by Snow Phipps Group AIV, L.P. and 66,284 Warrants held by Snow Phipps Group (RPV), L.P., each of which was acquired on April 5, 2020. The Preferred Stock and Warrants may not be converted or exercised until approved by the affirmative vote of the holders of the common stock. The address of Mr. Snow, the General Partner and the Fund Entities is c/o Snow Phipps Group, LLC, 667 Madison Avenue, 10th Floor, New York, New York 10065. |
|
(2) |
Represents shares held by TOBI III SPE I LLC (“TOBI III”). TOBI III is a Delaware limited liability company that was formed solely for the purpose of investing in the Company. TOBI III is a wholly owned subsidiary of LVS III Holding LP (“LVS”). PIMCO GP XVII, LLC (“PIMCO GP”), a Delaware limited liability company, is the sole general partner of LVS. Pacific Investment Management Company LLC, a Delaware limited liability company, is the sole managing member of PIMCO GP and has the power to make voting and investment decisions regarding the shares held by TOBI III. Excludes shares of common stock issuable upon the conversion of 25,000 shares of Preferred Stock held by TOBI III and the exercise of 1,272,882 Warrants held by TOBI III, each of which was acquired on April 5, 2020. The Preferred Stock and Warrants may not be converted or exercised until approved by the affirmative vote of the holders of the common stock. The address of the principal business office of TOBI III, LVS, PIMCO GP and Pacific Investment Management Company LLC is 650 Newport Center Drive, Newport Beach, California 92660. |
89
Security Ownership of Management and Directors
The following table below sets forth information as of the close of business on February 29, 2020 regarding the beneficial ownership of our common stock by: (i) each of our current directors; (ii) each of our executive officers named in the “Summary Compensation Table”; and (iii) all current directors and current executive officers as a group. Unless otherwise noted, the beneficial owners exercise sole voting and/or investment power over their shares. All percentages in the table are based on 20,087,494 shares of common stock outstanding as of February 29, 2020.
|
Name of Beneficial Owner |
|
Shares Beneficially Owned |
|
|
Percentage of Shares Beneficially Owned |
|
||
|
Christopher D. Farrar(1) |
|
|
142,916 |
|
|
* |
|
|
|
Jeffrey T. Taylor |
|
|
2,423 |
|
|
* |
|
|
|
Mark R. Szczepaniak |
|
|
— |
|
|
|
— |
|
|
Graham M. Comley |
|
|
— |
|
|
|
— |
|
|
Joseph A. Cowell |
|
|
722 |
|
|
* |
|
|
|
Daniel J. Ballen(2) |
|
|
— |
|
|
|
— |
|
|
Alan H. Mantel(3) |
|
|
— |
|
|
|
— |
|
|
John A. Pless(3) |
|
|
— |
|
|
|
— |
|
|
John P. Pitstick |
|
|
— |
|
|
|
— |
|
|
Joy L. Schaefer |
|
|
7,467 |
|
|
* |
|
|
|
All executive officers and directors as a group (10 persons) |
|
|
153,528 |
|
|
* |
|
|
|
* |
Indicates beneficial ownership of less than 1%. |
|
(1) |
Includes shares beneficially owned by Christopher D. Farrar and the Farrar Family Trust dated February 16, 2001, of which Christopher D. Farrar is a trustee. |
|
(2) |
The address for Mr. Ballen is c/o Pacific Investment Management Company LLC, 1633 Broadway, New York, New York 10019. |
|
(3) |
The address for Mr. Mantel and Mr. Pless is 667 Madison Avenue, 10th Floor, New York, New York 10065. |
Item 13. Certain Relationships and Related Transactions, and Director Independence.
Related Party Transactions
Stockholders Agreement
We are party to a stockholders agreement with Snow Phipps and TOBI. Pursuant to the terms of this stockholders agreement, Snow Phipps has the right to nominate up to two directors to our board of directors for so long as Snow Phipps and its affiliates, together with their permitted transferees, hold at least 15% of the number of shares of our common stock outstanding immediately following the consummation of our IPO. Snow Phipps has the right to nominate one director to our board of directors for so long as Snow Phipps and its affiliates, together with their permitted transferees, hold at least 7.5% of the number of shares of our common stock outstanding immediately following the consummation of our IPO. TOBI has the right to nominate one director to our board of directors for so long as TOBI and its affiliates, together with their permitted transferees, hold at least 7.5% of the number of shares of our common stock outstanding immediately following the consummation of our IPO. Furthermore, Mr. Farrar has the right to nominate one director until he ceases to beneficially own at least 50% of the number of shares of our common stock that he owns immediately following the consummation of our IPO. Our stockholders agreement provides that we may, at our discretion, require that one of Snow Phipps’ director nominees be “independent” as defined by the NYSE. In addition, our stockholders agreement provides that for so long as they are entitled to nominate at least one member of our board of directors, each of Snow Phipps and TOBI, as applicable, shall be entitled to have one of their director nominees appointed to each of our Compensation Committee and Nominating/Corporate Governance Committee, subject to qualification under applicable NYSE rules. For so long as Snow Phipps and its affiliates have the right to designate at least one director, we must take all action necessary to ensure the board of directors does not exceed seven members.
90
We are party to a registration rights agreement with stockholders who held units of the Company prior to our IPO, pursuant to which we granted them the right, subject to certain limitations, to require us to register under the Securities Act shares of common stock held by them for resale and to execute piggyback rights to sell shares held by them in certain registered offerings initiated by us.
Securities Purchase Agreement and Registration Rights Agreement
On April 5, 2020, we entered into a securities purchase agreement with investment funds affiliated with Snow Phipps and an investment fund affiliated with TOBI (each, a “Purchaser”) to issue and sell in a private placement (i) an aggregate of 20,000 newly issued shares of Preferred Stock to the Snow Phipps Purchasers, (ii) an aggregate of 25,000 newly issued shares of Preferred Stock to the TOBI Purchaser, (iii) Warrants to purchase an aggregate of 1,339,116 shares of common stock to the Snow Phipps Purchasers and (iv) Warrants to purchase an aggregate of 1,673,954 shares of common stock to the TOBI Purchaser. The Snow Phipps Purchasers paid us cash consideration of $20.0 million for the purchase of such Preferred Stock and Warrants and the TOBI Purchaser paid us cash consideration of $25.0 million for the purchase of such Preferred Stock and Warrants. Two thirds of the Warrants held by each Purchaser are exercisable $2.96 per share of common stock with the remainder exercisable at $4.94 per share of common stock. For additional information about the Preferred Stock and the Warrants see “Note 24—Subsequent Events” to the consolidated financial statements included in this Annual Report.
Pursuant to the securities purchase agreement, for so long as each Purchaser and its respective permitted transferees continue to hold at least 50% of the Preferred Stock initially issued to such Purchaser and the Purchasers and their respective permitted transferees collectively continue to hold at least 50% of the aggregate Preferred Stock initially issued, the prior written consent of each Purchaser that continues to hold at least 50% of the Preferred Stock initially issued to such Purchaser will be necessary for certain corporate events, including, among other things, certain amendments or alterations to our certificate of incorporation or the certificate of designation for the Preferred Stock, the creation and issuance of securities with certain rights senior to, or on parity with, the Preferred Stock, and the incurrence of certain debt in excess of $20.0 million.
In addition, for so long as TOBI and its permitted transferees continue to beneficially own at least 25% of the Preferred Stock initially issued to it (and any common stock issued upon conversion thereof), TOBI shall be entitled to nominate one additional director to our board of directors in addition to its nomination right under the stockholders agreement described above.
In connection with the purchase of the Preferred Stock and Warrants, we also entered into a registration rights agreement with the Purchasers, pursuant to which we agreed to provide certain registration and other rights with respect to the shares of common stock issuable upon conversion of the Preferred Stock and upon exercise of the Warrants. This registration rights agreement includes a provision that prohibits us from granting registration rights that are on parity with or senior to the rights granted to the Purchasers.
In connection the above described transactions, the Company has agreed to reimburse each of Snow Phipps and TOBI up to $250,000 in transaction costs. The stock purchase agreement, registration rights agreement and related transactions were approved by a special transaction committee of the board of directors consisting solely of independent, disinterested directors.
Other Transactions
In August 2019, we entered into a five-year $153.0 million corporate debt agreement with Owl Rock Capital Corporation. The 2019 Term Loans under this agreement bear interest at a rate equal to one-month LIBOR plus 7.50% and mature in August 2024. A portion of the net proceeds from the 2019 Term Loans was used to redeem the 2014 Senior Secured Notes for an aggregate amount of approximately $130.1 million, equal to the principal and accrued interest. Another portion of the net proceeds from the 2019 Term Loans, together with cash on hand, was used to repurchase our outstanding Class C preferred units from the holders of the Class C preferred units for an aggregate purchase price equal to the Class C liquidation preference of approximately $27.7 million.
91
In the ordinary course of business, we sell held for sale loans to various financial institutions. From time to time, an affiliate of TOBI has purchased such loans from us through an arm’s length bidding process.
Corporate Opportunities
Our certificate of incorporation provides that our directors who are also employees or affiliates of Snow Phipps or TOBI may engage in similar activities or lines of business as us. Our certificate of incorporation provides that no Snow Phipps or TOBI employees or affiliates, including those persons who are also our directors, have any obligation to refrain from (1) engaging directly or indirectly in the same or similar business activities or lines of business as us or developing or marketing any products or services that compete, directly or indirectly, with us, (2) investing or owning any interest in, or developing a business relationship with, any person or entity engaged in the same or similar business activities or lines of business as, or otherwise in competition with, us or (3) doing business with any of our clients or customers. In addition, our certificate of incorporation provides that we have waived any interest or expectancy in any business or other opportunity that becomes known to a director of ours who is also a Snow Phipps or TOBI employee or affiliate unless the opportunity becomes known to that individual solely in his or her capacity as our director.
Indemnification of Directors and Officers
We have entered into indemnification agreements with each of our directors and executive officers. These agreements require us to indemnify these individuals to the fullest extent permitted under the DGCL against expenses, losses and liabilities that may arise in connection with actual or threatened proceedings in which they are involved by reason of their service to us, and to advance expenses incurred as a result of any proceeding against them as to which they could be indemnified.
Our bylaws provide that we will indemnify our directors and officers to the fullest extent permitted by the DGCL. In addition, our certificate of incorporation provides that our directors will not be liable for monetary damages for breach of fiduciary duty to the fullest extent permitted by the DGCL.
Review and Approval of Transactions with Interested Persons
We have adopted a written statement of policy regarding transactions with related persons, which we refer to as our “related person policy.” Our related person policy requires that a “related person” (as defined as in paragraph (a) of Item 404 of Regulation S-K) must promptly disclose to our chief financial officer any “related person transaction” (defined as any transaction that is anticipated would be reportable by us under Item 404(a) of Regulation S-K in which we were or are to be a participant and the amount involved exceeds $120,000 and in which any related person had or will have a direct or indirect material interest) and all material facts with respect thereto. The chief financial officer will then promptly communicate that information to our board of directors. No related person transaction entered into shall be executed without the approval or ratification of our board of directors or a duly authorized committee of our board of directors. It is our policy that directors interested in a related person transaction will recuse themselves from any vote on a related person transaction in which they have an interest.
Director Independence
Pursuant to the corporate governance listing standards of the NYSE a director employed by us cannot be deemed to be an “independent director,” and each other director will qualify as “independent” only if our board of directors affirmatively determines that he has no material relationship with us, either directly or as a partner, stockholder or officer of an organization that has a relationship with us. Ownership of a significant amount of our stock, by itself, does not constitute a material relationship.
In addition, all members of the Audit Committee, Compensation Committee and Nominating/Corporate Governance Committee must be independent directors as defined by the corporate governance listing standards of the NYSE. Members of the Compensation Committee must also meet applicable NYSE independence requirements for compensation committee members, and members of the Audit Committee must further satisfy a separate SEC independence requirement, which generally provides that they may not (i) accept directly or indirectly any consulting, advisory or other compensatory fee from us or any of our subsidiaries, other than their compensation as
92
directors or members of the Audit Committee or any other committees of our board of directors or (ii) be an affiliated person of ours.
Our board of directors has determined that none of the members of our board of directors other than Mr. Farrar has a relationship that would interfere with the exercise of independent judgment in carrying out the responsibilities of a director and that each of the members of our board of directors other than Mr. Farrar is “independent” as that term is defined under the rules of the NYSE.
Item 14. Principal Accounting Fees and Services.
Audit and Other Fees
The following table shows the fees for audit and other services provided by KPMG LLP for the fiscal years ended December 31, 2019 and 2018 (in thousands):
|
Fees |
|
Fiscal 2019 |
|
|
Fiscal 2018 |
|
||
|
Audit Fees |
|
$ |
1,138 |
|
|
|
877 |
|
|
Audit-Related Fees |
|
|
29 |
|
|
|
— |
|
|
Tax Fees |
|
|
95 |
|
|
|
972 |
|
|
All Other Fees |
|
|
— |
|
|
|
— |
|
|
Total Fees |
|
$ |
1,261 |
|
|
|
1,849 |
|
A description of the types of services provided in each category is as follows:
Audit Fees—Includes fees associated with the audit of our annual financial statements and consents and assistance with and review of registration statements filed with the SEC.
Audit-Related Fees—Includes fees associated with the Uniform Single Attestation Program (USAP) attest engagement.
Tax Fees—Includes fees associated with tax compliance, advice and planning.
The Board considered whether providing the non-audit services included in this table was compatible with maintaining KPMG LLP’s independence and concluded that it was.
Audit Committee Pre-Approval Process
Consistent with SEC policies regarding auditor independence and our Audit Committee’s charter, the Audit Committee has responsibility for engaging, setting compensation for and reviewing the performance of the independent registered public accounting firm. In exercising this responsibility, the Audit Committee has established procedures relating to the approval of all audit and non-audit services that are to be performed by our independent registered public accounting firm and pre-approves all audit and permitted non-audit services provided by any independent registered public accounting firm prior to each engagement.
93
Item 15. Exhibits, Financial Statement Schedules.
|
|
(a) |
The following documents are filed as part of this Annual Report: |
|
|
(1) |
Financial Statements |
The financial statements filed as part of this Annual Report are included in Part II, Item 8 of this Annual Report.
|
|
(2) |
Financial Statement Schedules |
Financial statement schedules have been omitted in this Annual Report because they are not applicable, not required under the instructions or the information requested is set forth in the financial statements or related notes thereto.
|
|
(3) |
List of Exhibits required by Item 601 of Regulation S-K |
|
|
|
|
Incorporated by Reference |
|||
|
Exhibit Number |
|
Exhibit Title |
Form |
File No. |
Exhibit |
Filing Date |
|
|
|
|
|
|
|
|
|
3.1 |
|
8-K |
001-39183 |
3.1 |
1/22/2020 |
|
|
|
|
|
|
|
|
|
|
3.2 |
|
8-K |
001-39183 |
3.2 |
1/22/2020 |
|
|
|
|
|
|
|
|
|
|
3.3 |
|
8-K |
001-39183 |
3.3 |
1/22/2020 |
|
|
|
|
|
|
|
|
|
|
3.4 |
|
Certificate of Designation of Series A Convertible Preferred Stock of Velocity Financial, Inc. |
8-K |
001-39183 |
3.1 |
4/07/2020 |
|
|
|
|
|
|
|
|
|
4.1 |
|
S-1 |
333-234250 |
4.1 |
10/18/2019 |
|
|
|
|
|
|
|
|
|
|
4.2 |
|
8-K |
001-39183 |
4.1 |
4/07/2020 |
|
|
|
|
|
|
|
|
|
|
4.3 |
|
|
|
|
|
|
|
|
|
|
|
|
|
|
|
10.1 |
|
|
|
|
|
|
|
|
|
|
|
|
|
|
|
10.2 |
|
|
|
|
|
|
|
|
|
|
|
|
|
|
|
10.3 |
|
S-1 |
333-234250 |
10.3 |
10/18/2019 |
|
|
|
|
|
|
|
|
|
|
10.4 |
|
Form of Class B Unit Award Agreement under the 2012 Equity Incentive Plan* |
S-1 |
333-234250 |
10.4 |
10/18/2019 |
|
|
|
|
|
|
|
|
|
10.5 |
|
8-K |
001-39183 |
10.1 |
1/22/2020 |
|
|
|
|
|
|
|
|
|
|
10.6 |
|
Form of Nonqualified Stock Option Award Notice and Agreement under the 2020 Omnibus Incentive Plan* |
S-1/A |
333-234250 |
10.6 |
1/6/2020 |
|
|
|
|
|
|
|
|
|
10.7 |
|
S-1/A |
333-234250 |
10.7 |
1/6/2020 |
|
|
|
|
|
|
|
|
|
|
10.8 |
|
S-1/A |
333-234250 |
10.8 |
1/6/2020 |
|
|
|
|
|
|
|
|
|
|
10.9 |
|
S-1/A |
333-234250 |
10.9 |
1/6/2020 |
|
|
|
|
|
|
|
|
|
|
10.10 |
|
S-1/A |
333-234250 |
10.10 |
1/6/2020 |
|
|
|
|
|
|
|
|
|
|
10.11 |
|
Form of Restricted Stock Grant and Agreement under the 2020 Omnibus Incentive Plan* |
S-1/A |
333-234250 |
10.11 |
1/6/2020 |
|
|
|
|
|
|
|
|
|
10.12 |
|
Offer Letter between the Registrant and Mark Szczepaniak, dated as of April 27, 2017* |
S-1 |
333-234250 |
10.9 |
10/18/2019 |
|
|
|
|
|
|
|
|
94
|
|
Offer Letter between the Registrant and Graham Comley, dated as of July 26, 2016* |
S-1 |
333-234250 |
10.10 |
10/18/2019 |
|
|
|
|
|
|
|
|
|
|
10.14 |
|
S-1 |
333-234250 |
10.11 |
10/18/2019 |
|
|
|
|
|
|
|
|
|
|
10.15 |
|
S-1 |
333-234250 |
10.12 |
10/18/2019 |
|
|
|
|
|
|
|
|
|
|
10.16 |
|
S-1 |
333-234250 |
10.13 |
10/18/2019 |
|
|
|
|
|
|
|
|
|
|
10.17 |
|
S-1 |
333-234250 |
10.14 |
10/18/2019 |
|
|
|
|
|
|
|
|
|
|
10.18 |
|
S-1 |
333-234250 |
10.15 |
10/18/2019 |
|
|
|
|
|
|
|
|
|
|
10.19 |
|
S-1 |
333-234250 |
10.16 |
10/18/2019 |
|
|
|
|
|
|
|
|
|
|
10.20 |
|
S-1 |
333-234250 |
10.17 |
10/18/2019 |
|
|
|
|
|
|
|
|
|
|
10.21 |
|
S-1 |
333-234250 |
10.18 |
10/18/2019 |
|
|
|
|
|
|
|
|
|
|
10.22 |
|
S-1 |
333-234250 |
10.19 |
10/18/2019 |
|
|
|
|
|
|
|
|
|
|
10.23 |
|
S-1 |
333-234250 |
10.20 |
10/18/2019 |
|
|
|
|
|
|
|
|
|
|
10.24 |
|
S-1 |
333-234250 |
10.21 |
10/18/2019 |
|
|
|
|
|
|
|
|
|
|
10.25 |
|
S-1 |
333-234250 |
10.22 |
10/18/2019 |
|
|
|
|
|
|
|
|
|
|
10.26 |
|
S-1 |
333-234250 |
10.23 |
10/18/2019 |
|
|
|
|
|
|
|
|
|
95
|
|
S-1 |
333-234250 |
10.24 |
10/18/2019 |
||
|
|
|
|
|
|
|
|
|
10.28 |
|
S-1 |
333-234250 |
10.25 |
10/18/2019 |
|
|
|
|
|
|
|
|
|
|
10.29 |
|
S-1 |
333-234250 |
10.26 |
10/18/2019 |
|
|
|
|
|
|
|
|
|
|
10.30 |
|
S-1 |
333-234250 |
10.27 |
10/18/2019 |
|
|
|
|
|
|
|
|
|
|
10.31 |
|
S-1 |
333-234250 |
10.28 |
10/18/2019 |
|
|
|
|
|
|
|
|
|
|
10.32 |
|
S-1 |
333-234250 |
10.29 |
10/18/2019 |
|
|
|
|
|
|
|
|
|
|
10.33 |
|
S-1 |
333-234250 |
10.30 |
10/18/2019 |
|
|
|
|
|
|
|
|
|
|
10.34 |
|
S-1 |
333-234250 |
10.31 |
10/18/2019 |
|
|
|
|
|
|
|
|
|
|
10.35 |
|
S-1 |
333-234250 |
10.32 |
10/18/2019 |
|
|
|
|
|
|
|
|
|
|
10.36 |
|
S-1 |
333-234250 |
10.33 |
10/18/2019 |
|
|
|
|
|
|
|
|
|
|
10.37 |
|
S-1 |
333-234250 |
10.34 |
10/18/2019 |
|
|
|
|
|
|
|
|
|
|
10.38 |
|
S-1 |
333-234250 |
10.35 |
10/18/2019 |
|
|
|
|
|
|
|
|
|
|
10.39(a) |
|
S-1 |
333-234250 |
10.36 |
10/18/2019 |
|
|
|
|
|
|
|
|
|
|
10.39(b) |
|
|
|
|
|
|
|
|
|
|
|
|
|
|
96
|
|
S-1/A |
333-234250 |
10.37 |
11/6/2019 |
||
|
|
|
|
|
|
|
|
|
10.41 |
|
S-1/A |
333-234250 |
10.38 |
11/6/2019 |
|
|
|
|
|
|
|
|
|
|
21.1 |
|
S-1 |
333-234250 |
21.1 |
10/18/2019 |
|
|
|
|
|
|
|
|
|
|
23.1 |
|
|
|
|
|
|
|
|
|
|
|
|
|
|
|
24.1 |
|
Power of Attorney (included in the signature page to this Annual Report) |
|
|
|
|
|
|
|
|
|
|
|
|
|
31.1 |
|
|
|
|
|
|
|
|
|
|
|
|
|
|
|
31.2 |
|
|
|
|
|
|
|
|
|
|
|
|
|
|
|
32.1 |
|
|
|
|
|
|
|
|
|
|
|
|
|
|
|
32.2 |
|
|
|
|
|
|
|
|
|
|
||||
|
* |
Management contract or compensatory plan or arrangement. |
|
+ |
This certification is deemed not filed for purposes of Section 18 of the Exchange Act, or otherwise subject to the liability of that section, nor shall it be deemed incorporated by reference into any filing under the Securities Act or the Exchange Act. |
Item 16. Form 10-K Summary.
None.
97
VELOCITY FINANCIAL, INC. AND SUBSIDIARIES
(FORMERLY KNOWN AS VELOCITY FINANCIAL, LLC AND SUBSIDIARIES)
Index to Consolidated Financial Statements
December 31, 2019
F-1
Report of Independent Registered Public Accounting Firm
To the Stockholders and Board of Directors
Velocity Financial, Inc.
Opinion on the Consolidated Financial Statements
We have audited the accompanying consolidated statements of financial condition of Velocity Financial, Inc. (formerly known as Velocity Financial, LLC) and subsidiaries (the Company) as of December 31, 2019 and 2018, the related consolidated statements of income, members’ equity, and cash flows for each of the years in the three‑year period ended December 31, 2019, and the related notes (collectively, the consolidated financial statements). In our opinion, the consolidated financial statements present fairly, in all material respects, the financial position of the Company as of December 31, 2019 and 2018, and the results of its operations and its cash flows for each of the years in the three‑year period ended December 31, 2019, in conformity with U.S. generally accepted accounting principles.
Basis for Opinion
These consolidated financial statements are the responsibility of the Company’s management. Our responsibility is to express an opinion on these consolidated financial statements based on our audits. We are a public accounting firm registered with the Public Company Accounting Oversight Board (United States) (PCAOB) and are required to be independent with respect to the Company in accordance with the U.S. federal securities laws and the applicable rules and regulations of the Securities and Exchange Commission and the PCAOB.
We conducted our audits in accordance with the standards of the PCAOB. Those standards require that we plan and perform the audit to obtain reasonable assurance about whether the consolidated financial statements are free of material misstatement, whether due to error or fraud. Our audits included performing procedures to assess the risks of material misstatement of the consolidated financial statements, whether due to error or fraud, and performing procedures that respond to those risks. Such procedures included examining, on a test basis, evidence regarding the amounts and disclosures in the consolidated financial statements. Our audits also included evaluating the accounting principles used and significant estimates made by management, as well as evaluating the overall presentation of the consolidated financial statements. We believe that our audits provide a reasonable basis for our opinion.
/s/ KPMG LLP
We have served as the Company’s auditor since 2011.
Los Angeles, California
April 7, 2020
F-2
VELOCITY FINANCIAL, INC. AND SUBSIDIARIES
(FORMERLY KNOWN AS VELOCITY FINANCIAL, LLC AND SUBSIDIARIES)
CONSOLIDATED STATEMENTS OF FINANCIAL CONDITION
December 31, 2019 and 2018
(In thousands)
|
|
|
December 31, |
|
|||||
|
|
|
2019 |
|
|
2018 |
|
||
|
Assets |
|
|
|
|
|
|
|
|
|
Cash and cash equivalents |
|
$ |
21,465 |
|
|
$ |
15,008 |
|
|
Restricted cash |
|
|
6,087 |
|
|
|
1,669 |
|
|
Loans held for sale, net |
|
|
214,467 |
|
|
|
78,446 |
|
|
Loans held for investment, net |
|
|
1,863,360 |
|
|
|
1,567,408 |
|
|
Loans held for investment, at fair value |
|
|
2,960 |
|
|
|
3,463 |
|
|
Total loans, net |
|
|
2,080,787 |
|
|
|
1,649,317 |
|
|
Accrued interest receivables |
|
|
13,295 |
|
|
|
10,096 |
|
|
Receivables due from servicers |
|
|
49,659 |
|
|
|
40,473 |
|
|
Other receivables |
|
|
4,778 |
|
|
|
974 |
|
|
Real estate owned, net |
|
|
13,068 |
|
|
|
7,167 |
|
|
Property and equipment, net |
|
|
4,680 |
|
|
|
5,535 |
|
|
Net deferred tax asset |
|
|
8,280 |
|
|
|
517 |
|
|
Other assets |
|
|
12,667 |
|
|
|
4,479 |
|
|
Total assets |
|
$ |
2,214,766 |
|
|
$ |
1,735,235 |
|
|
Liabilities and Members’ Equity |
|
|
|
|
|
|
|
|
|
Accounts payable and accrued expenses |
|
$ |
56,146 |
|
|
$ |
26,797 |
|
|
Secured financing, net |
|
|
145,599 |
|
|
|
127,040 |
|
|
Securitizations, net |
|
|
1,438,629 |
|
|
|
1,202,202 |
|
|
Warehouse repurchase facilities, net |
|
|
421,548 |
|
|
|
215,931 |
|
|
Total liabilities |
|
|
2,061,922 |
|
|
|
1,571,970 |
|
|
Commitments and contingencies (Note 18) |
|
|
|
|
|
|
|
|
|
Class C preferred units |
|
|
— |
|
|
|
26,465 |
|
|
Members’ equity |
|
|
152,844 |
|
|
|
136,800 |
|
|
Total liabilities and members’ equity |
|
$ |
2,214,766 |
|
|
$ |
1,735,235 |
|
See accompanying notes to consolidated financial statements.
F-3
VELOCITY FINANCIAL, INC. AND SUBSIDIARIES
(FORMERLY KNOWN AS VELOCITY FINANCIAL, LLC AND SUBSIDIARIES)
CONSOLIDATED STATEMENTS OF INCOME
For the years ended December 31, 2019, 2018 and 2017
(In thousands)
|
|
|
2019 |
|
|
2018 |
|
|
2017 |
|
|||
|
Interest income |
|
$ |
157,531 |
|
|
$ |
124,722 |
|
|
$ |
97,830 |
|
|
Interest expense — portfolio related |
|
|
83,903 |
|
|
|
62,597 |
|
|
|
47,638 |
|
|
Net interest income — portfolio related |
|
|
73,628 |
|
|
|
62,125 |
|
|
|
50,192 |
|
|
Interest expense — corporate debt |
|
|
14,618 |
|
|
|
13,322 |
|
|
|
13,654 |
|
|
Net interest income |
|
|
59,010 |
|
|
|
48,803 |
|
|
|
36,538 |
|
|
Provision for loan losses |
|
|
1,139 |
|
|
|
201 |
|
|
|
421 |
|
|
Net interest income after provision for loan losses |
|
|
57,871 |
|
|
|
48,602 |
|
|
|
36,117 |
|
|
|
|
|
|
|
|
|
|
|
|
|
|
|
|
Other operating income |
|
|
|
|
|
|
|
|
|
|
|
|
|
Gain on disposition of loans |
|
|
4,410 |
|
|
|
1,200 |
|
|
|
984 |
|
|
Unrealized gain (loss) on fair value loans |
|
|
(9 |
) |
|
|
241 |
|
|
|
39 |
|
|
Other income (expense) |
|
|
(1,752 |
) |
|
|
1,366 |
|
|
|
985 |
|
|
Total other operating income |
|
|
2,649 |
|
|
|
2,807 |
|
|
|
2,008 |
|
|
|
|
|
|
|
|
|
|
|
|
|
|
|
|
Operating expenses |
|
|
|
|
|
|
|
|
|
|
|
|
|
Compensation and employee benefits |
|
|
15,511 |
|
|
|
15,105 |
|
|
|
11,904 |
|
|
Rent and occupancy |
|
|
1,531 |
|
|
|
1,320 |
|
|
|
1,115 |
|
|
Loan servicing |
|
|
7,396 |
|
|
|
6,009 |
|
|
|
4,907 |
|
|
Professional fees |
|
|
2,056 |
|
|
|
3,040 |
|
|
|
1,661 |
|
|
Real estate owned, net |
|
|
2,647 |
|
|
|
1,373 |
|
|
|
603 |
|
|
Other operating expenses |
|
|
5,981 |
|
|
|
5,313 |
|
|
|
3,946 |
|
|
Total operating expenses |
|
|
35,122 |
|
|
|
32,160 |
|
|
|
24,136 |
|
|
Income before income taxes |
|
|
25,398 |
|
|
|
19,249 |
|
|
|
13,989 |
|
|
Income tax expense |
|
|
8,106 |
|
|
|
11,618 |
|
|
|
— |
|
|
Net income |
|
$ |
17,292 |
|
|
$ |
7,631 |
|
|
$ |
13,989 |
|
See accompanying notes to consolidated financial statements.
F-4
VELOCITY FINANCIAL, INC. AND SUBSIDIARIES
(FORMERLY KNOWN AS VELOCITY FINANCIAL, LLC AND SUBSIDIARIES)
CONSOLIDATED STATEMENTS OF MEMBERS’ EQUITY
For the years ended December 31, 2019, 2018 and 2017
(In thousands)
|
|
|
Total Members’ Equity |
|
|
|
Balance – December 31, 2016 |
|
$ |
125,345 |
|
|
Issuance of preferred D units |
|
|
194 |
|
|
Deal costs — preferred D units |
|
|
(34 |
) |
|
Tax payments, Class C |
|
|
(1,600 |
) |
|
Tax payments, Class D |
|
|
(5,296 |
) |
|
Liquidation preference return, Class C |
|
|
(1,655 |
) |
|
Net income |
|
|
13,989 |
|
|
Balance – December 31, 2017 |
|
$ |
130,943 |
|
|
Liquidation preference return, Class C |
|
|
(1,774 |
) |
|
Net income |
|
|
7,631 |
|
|
Balance – December 31, 2018 |
|
$ |
136,800 |
|
|
Liquidation preference return, Class C |
|
|
(1,248 |
) |
|
Net income |
|
|
17,292 |
|
|
Balance – December 31, 2019 |
|
$ |
152,844 |
|
See accompanying notes to consolidated financial statements.
F-5
VELOCITY FINANCIAL, INC. AND SUBSIDIARIES
(FORMERLY KNOWN AS VELOCITY FINANCIAL, LLC AND SUBSIDIARIES)
CONSOLIDATED STATEMENTS OF CASH FLOWS
For the years ended December 31, 2019, 2018 and 2017
(In thousands)
|
|
|
Year Ended December 31, |
|
|||||||||
|
|
|
2019 |
|
|
2018 |
|
|
2017 |
|
|||
|
Cash flows from operating activities: |
|
|
|
|
|
|
|
|
|
|
|
|
|
Net income |
|
$ |
17,292 |
|
|
$ |
7,631 |
|
|
$ |
13,989 |
|
|
Adjustments to reconcile net income to net cash (used in) provided by operating activities: |
|
|
|
|
|
|
|
|
|
|
|
|
|
Depreciation and amortization |
|
|
1,414 |
|
|
|
1,434 |
|
|
|
1,191 |
|
|
Amortization of right-of-use assets |
|
|
1,054 |
|
|
|
— |
|
|
|
— |
|
|
Provision for loan losses |
|
|
1,139 |
|
|
|
201 |
|
|
|
421 |
|
|
Provision for held for sale loan losses |
|
|
8 |
|
|
|
— |
|
|
|
68 |
|
|
Origination of loans held for sale |
|
|
(336,876 |
) |
|
|
(148,825 |
) |
|
|
(42,868 |
) |
|
Proceeds from sales of loans held for sale |
|
|
192,523 |
|
|
|
76,819 |
|
|
|
46,296 |
|
|
Purchase of held for sale loans |
|
|
(12,919 |
) |
|
|
(3,926 |
) |
|
|
(1,537 |
) |
|
Repayments on loans held for sale |
|
|
25,137 |
|
|
|
3,541 |
|
|
|
630 |
|
|
Net accretion of discount on purchased loans and deferred loan origination costs |
|
|
4,904 |
|
|
|
3,519 |
|
|
|
1,624 |
|
|
Interest paid in kind on secured financing |
|
|
— |
|
|
|
— |
|
|
|
6,652 |
|
|
Provision for (reversal of) uncollectible borrower advances |
|
|
112 |
|
|
|
56 |
|
|
|
(11 |
) |
|
Gain on sale of loans |
|
|
(4,119 |
) |
|
|
(709 |
) |
|
|
(806 |
) |
|
Real estate acquired through foreclosure in excess of recorded investment |
|
|
(291 |
) |
|
|
(491 |
) |
|
|
(178 |
) |
|
Amortization of debt issuance discount and costs |
|
|
10,442 |
|
|
|
7,360 |
|
|
|
7,193 |
|
|
Loss on disposal of property & equipment |
|
|
322 |
|
|
|
100 |
|
|
|
— |
|
|
Change in valuation of real estate owned |
|
|
1,631 |
|
|
|
888 |
|
|
|
211 |
|
|
Change in valuation of fair value loans |
|
|
9 |
|
|
|
(241 |
) |
|
|
(39 |
) |
|
Change in valuation of held for sale loans |
|
|
224 |
|
|
|
174 |
|
|
|
103 |
|
|
(Gain) loss on sale of real estate owned |
|
|
(207 |
) |
|
|
(640 |
) |
|
|
(133 |
) |
|
Net deferred tax benefit |
|
|
(7,763 |
) |
|
|
(517 |
) |
|
|
— |
|
|
(Increase) decrease in operating assets and liabilities: |
|
|
|
|
|
|
|
|
|
|
|
|
|
Accrued interest and other receivables |
|
|
(14,452 |
) |
|
|
(16,248 |
) |
|
|
(3,690 |
) |
|
Other assets |
|
|
(3,234 |
) |
|
|
(3,045 |
) |
|
|
(686 |
) |
|
Accounts payable and accrued expenses |
|
|
18,314 |
|
|
|
434 |
|
|
|
9,214 |
|
|
Net cash (used in) provided by operating activities |
|
|
(105,336 |
) |
|
|
(72,485 |
) |
|
|
37,644 |
|
|
Cash flows from investing activities: |
|
|
|
|
|
|
|
|
|
|
|
|
|
Purchase of loans held for investment |
|
|
(9,276 |
) |
|
|
(16,868 |
) |
|
|
(992 |
) |
|
Origination of loans held for investment |
|
|
(682,878 |
) |
|
|
(595,746 |
) |
|
|
(518,888 |
) |
|
Proceeds from sales of loans |
|
|
— |
|
|
|
— |
|
|
|
6,280 |
|
|
Payoffs of loans held for investment and loans at fair value |
|
|
379,286 |
|
|
|
334,679 |
|
|
|
240,855 |
|
|
Proceeds from sale of real estate owned |
|
|
4,497 |
|
|
|
6,185 |
|
|
|
2,507 |
|
|
Proceeds from insurance related real estate owned |
|
|
961 |
|
|
|
|
|
|
|
|
|
|
Capitalized real estate owned improvements |
|
|
(1,122 |
) |
|
|
(398 |
) |
|
|
— |
|
|
Change in advances |
|
|
(1,549 |
) |
|
|
(1,080 |
) |
|
|
(1,943 |
) |
|
Change in impounds and deposits |
|
|
5,029 |
|
|
|
4,335 |
|
|
|
484 |
|
|
Purchase of property and equipment |
|
|
(882 |
) |
|
|
(1,303 |
) |
|
|
(3,082 |
) |
|
Net cash used in investing activities |
|
|
(305,934 |
) |
|
|
(270,196 |
) |
|
|
(274,779 |
) |
|
Cash flows from financing activities: |
|
|
|
|
|
|
|
|
|
|
|
|
|
Warehouse repurchase facilities advances |
|
|
961,658 |
|
|
|
658,536 |
|
|
|
420,476 |
|
|
Warehouse repurchase facilities repayments |
|
|
(755,997 |
) |
|
|
(527,883 |
) |
|
|
(445,743 |
) |
|
Proceeds from secured financing |
|
|
153,000 |
|
|
|
— |
|
|
|
— |
|
|
Repayment of secured financing |
|
|
(127,594 |
) |
|
|
— |
|
|
|
— |
|
|
Proceeds of securitizations, net |
|
|
608,121 |
|
|
|
535,506 |
|
|
|
455,309 |
|
|
Repayment of securitizations |
|
|
(371,447 |
) |
|
|
(314,682 |
) |
|
|
(214,426 |
) |
|
Debt issuance cost |
|
|
(17,882 |
) |
|
|
(7,846 |
) |
|
|
(7,761 |
) |
|
Issuance of Class D Preferred units, net |
|
|
— |
|
|
|
— |
|
|
|
160 |
|
|
Redemption of Class C preferred units |
|
|
(27,714 |
) |
|
|
— |
|
|
|
|
|
|
Tax distributions |
|
|
— |
|
|
|
— |
|
|
|
(6,897 |
) |
|
Net cash provided by financing activities |
|
|
422,145 |
|
|
|
343,631 |
|
|
|
201,118 |
|
|
Net increase (decrease) in cash, cash equivalents, and restricted cash |
|
|
10,875 |
|
|
|
950 |
|
|
|
(36,017 |
) |
|
Cash, cash equivalents, and restricted cash at beginning of year |
|
|
16,677 |
|
|
|
15,727 |
|
|
|
51,744 |
|
|
Cash, cash equivalents, and restricted cash at end of year |
|
$ |
27,552 |
|
|
$ |
16,677 |
|
|
$ |
15,727 |
|
|
Supplemental cash flow information: |
|
|
|
|
|
|
|
|
|
|
|
|
|
Cash paid during the year for interest |
|
$ |
86,448 |
|
|
$ |
66,457 |
|
|
$ |
46,253 |
|
|
Cash paid during the year for income taxes |
|
|
15,416 |
|
|
|
13,217 |
|
|
|
127 |
|
|
Noncash transactions from investing and financing activities: |
|
|
|
|
|
|
|
|
|
|
|
|
|
Transfer of loans held for investment to loans held for sale |
|
|
— |
|
|
|
— |
|
|
|
(8,276 |
) |
|
Transfer of loans held for investment to real estate owned |
|
|
11,369 |
|
|
|
7,389 |
|
|
|
6,275 |
|
|
Interest paid in kind on secured financing |
|
|
— |
|
|
|
— |
|
|
|
6,652 |
|
|
Return paid-in-kind on Class C preferred units |
|
|
1,248 |
|
|
|
1,774 |
|
|
|
1,655 |
|
|
Discount (premium) on issuance of securitizations |
|
|
37 |
|
|
|
(1,222 |
) |
|
|
2,202 |
|
See accompanying notes to consolidated financial statements.
F-6
VELOCITY FINANCIAL, INC. AND SUBSIDIARIES
(FORMERLY KNOWN AS VELOCITY FINANCIAL, LLC AND SUBSIDIARIES)
NOTES TO CONSOLIDATED FINANCIAL STATEMENTS
December 31, 2019 and 2018
Note 1 — Organization and Description of Business
Velocity Financial, LLC (VF or the Company) was a Delaware limited liability company (LLC) formed on July 9, 2012 for the purpose of acquiring all membership units in Velocity Commercial Capital, LLC (VCC). On January 16, 2020, Velocity Financial, LLC converted from a Delaware limited liability company to a Delaware corporation and changed its name to Velocity Financial, Inc. Upon completion of the conversion, the Velocity Financial, LLC’s Class A equity units of 97,513,533 and Class D equity units of 60,193,989 were converted to 11,749,994 shares of Velocity Financial, Inc. common stock. On January 22, 2020, the Company completed its initial public offering of 7,250,000 shares of common stock at a price to the public of $13.00 per share. On January 28, 2020, the Company completed the sale of an additional 1,087,500 shares of its common stock, representing the full exercise of the underwriters’ option to purchase additional shares, at a public offering price of $13.00 per share. See “Note 24 — Subsequent Events.” The Company’s stock trades on The New York Stock Exchange under the symbol “VEL”.
VCC, a California LLC formed on June 2, 2004, is a mortgage lender that originates and acquires small balance investor real estate loans, providing capital to the investor real estate loan market. The Company is licensed as a California Finance Lender and, as such, is required to maintain a minimum net worth of $250 thousand. The Company does not believe there is any potential risk of not being able to meet this regulatory requirement. The Company uses its equity capital and borrowed funds to originate and invest in investor real estate loans and seeks to generate income based on the difference between the yield on its investor real estate loan portfolio and the cost of its borrowings. The Company does not engage in any other significant line of business or offer any other products or services, nor does it originate or acquire investments outside of the United States of America.
The Company, through its wholly owned subsidiaries, is the sole beneficial owner of the Velocity Commercial Capital Loan Trusts, from the 2014-1 Trust through and including the 2019-3 Trust, all of which are New York common law trusts. The Trusts are bankruptcy remote, variable interest entities (VIE) formed for the purpose of providing secured borrowings to the Company and are consolidated with the accounts of the Company.
In July 2019, the Company collapsed Velocity Commercial Capital Loan Trust 2011-1, a Delaware statutory trust formed on April 5, 2011.
Note 2 — Basis of Presentation and Summary of Significant Accounting Policies
The consolidated financial statements of the Company have been prepared on the accrual basis of accounting and in accordance with United States Generally Accepted Accounting Principles (U.S. GAAP).
|
(a) |
Use of Estimates |
The preparation of financial statements in conformity with U.S. GAAP requires management to make estimates and assumptions that affect the reported amounts of assets and liabilities, the disclosures of contingent assets and liabilities at the date of the consolidated financial statements, and the reported amounts of consolidated income and expenses during the reporting period.
Significant estimates subject to change include determination of the allowance for loans losses, determination of asset fair values, and other valuations using expected future cash flows. Actual results could differ from those estimates.
|
(b) |
Principles of Consolidation |
The principles of consolidation require management to determine and reassess the requirement to consolidate
F-7
VIEs each reporting period, and therefore, the determination may change based on new facts and circumstances pertaining to each VIE. This could result in a material impact to the Company’s consolidated financial statements in subsequent reporting periods.
The Company consolidates the assets, liabilities, and remainder interests of the Trusts as management determined that VCC is the primary beneficiary of these entities. The Company’s ongoing asset management responsibilities provide the Company with the power to direct the activities that most significantly impact the VIE’s economic performance, and the remainder interests provide the Company with the right to receive benefits and the obligation to absorb losses, limited to its investment in the remainder interest of the Trusts.
The following table presents a summary of the assets and liabilities of the Trusts as of December 31, 2019 and 2018.
Intercompany balances have been eliminated for purposes of this presentation (in thousands):
|
|
|
2019 |
|
|
2018 |
|
||
|
Restricted cash |
|
$ |
— |
|
|
$ |
305 |
|
|
Loans held for investment, net |
|
|
1,571,100 |
|
|
|
1,328,619 |
|
|
Accrued interest and other receivables |
|
|
56,675 |
|
|
|
44,840 |
|
|
Real estate owned, net |
|
|
6,091 |
|
|
|
1,132 |
|
|
Other assets |
|
|
11 |
|
|
|
4 |
|
|
Total assets |
|
$ |
1,633,877 |
|
|
$ |
1,374,900 |
|
|
Accounts payable and accrued expenses |
|
$ |
21,265 |
|
|
$ |
17,087 |
|
|
Securities issued |
|
|
1,438,630 |
|
|
|
1,202,202 |
|
|
Total liabilities |
|
$ |
1,459,895 |
|
|
$ |
1,219,289 |
|
The consolidated financial statements as of December 31, 2019 and 2018 include only those assets, liabilities, and results of operations related to the business of the Company, its subsidiaries, and VIEs, and do not include any assets, liabilities, revenues, and expenses attributable to limited liability members’ individual activities. The liability of each member in an LLC is limited to the amounts reflected in their respective member accounts.
|
(c) |
Cash and Cash Equivalents |
Cash and cash equivalents include funds held by depository institutions and short-term investments with original maturities of less than three months. The Company maintains cash in deposit accounts in federally insured banks, which, at times, may be in excess of federally insured limits.
|
(d) |
Restricted Cash |
Restricted cash consisted of the required specified reserve by the 2011-1 Trust agreement to pay the notes on each payment date if collections on mortgage loans are insufficient to make payments on the notes, and cash held by the Company for potential future advances due certain borrowers. In July 2019, the Company collapsed the 2011-1 Trust and released the restriction on the related reserve. Subsequent to July 2019, restricted cash only represents cash held by the Company for potential future advances due to certain borrowers.
|
(e) |
Loans Held for Investment |
Originated loans and purchased loans are classified as held-for-investment when management has the intent and ability to hold such loans for the foreseeable future or until maturity. Loans held for investment are carried at their outstanding principal balance, adjusted for net deferred loan origination costs and fees and allowance for loan losses. Interest income is accrued on the unpaid principal balance (UPB) at their respective stated interest rates. Generally, loans are placed on nonaccrual status when they become 90 days past due. Loans are considered past due when contractually required principal or interest payments have not been made on the due dates. When a loan is placed on nonaccrual status, the accrued and unpaid interest is reversed as a reduction of interest income and accrued interest receivable. Interest income is subsequently recognized only to the extent cash payments are received or when the loan has been placed back in accrual status. Loans are restored to accrual status when (1) the loan becomes
F-8
current and none of its principal and interest is due and unpaid, and the Company expects repayment of the remaining contractual principal and interest, or (2) if the loan has been formally restructured in a manner that reasonably assures repayment and performance according to its modified terms. Under these terms, the Company requires that the borrower continue to make the full restructured principal and interest payments for six consecutive months before restoring the loan to accrual status.
For originated loans, net deferred loan origination costs are amortized to interest income using the level yield method.
|
(f) |
Loans Held for Sale |
Loans are classified as held for sale when management has the intent to sell them. These are generally short-term, interest-only loans. They are carried at lower of cost or estimated fair value. On occasion, as part of the Company’s management strategy of the loans held in its portfolio, the Company will transfer loans from held for investment to held for sale. Upon transfer, any associated allowance for loan and lease loss is charged off and the carrying value of the loan is adjusted to the lower of cost or estimated fair value. The net deferred fees and costs associated with loans held for sale are deferred (not accreted or amortized to interest income) until the related loans are sold.
The Company recognizes transfers of loans as sales when it surrenders control over the loans. Control over transferred loans is deemed to be surrendered when (1) the loans have been isolated from the Company, (2) the transferee has the right (free of conditions that constrain it from taking advantage of that right) to pledge or exchange the transferred loans, and (3) the Company does not maintain effective control over the transferred loans through either (a) an agreement that entitles and obligates the Company to repurchase or redeem them before their maturity or (b) the ability to unilaterally cause the holder to return the specific loans. Gains or losses on the sale of these loans are included in “Gain on disposition of loans” in the consolidated statements of income.
Interest income on loans held for sale is recognized over the life of the loans using their contractual interest rates. Income recognition is suspended and the unpaid interest receivable is reversed against interest income when loans become 90 days delinquent, or when, in management’s opinion, a full recovery of interest and principal becomes doubtful. Income recognition is resumed when the loan becomes contractually current.
|
(g) |
Purchased Credit Impaired Loans |
Prior to July 2019, purchased credit impaired (PCI) loans were accounted for in accordance with ASC Subtopic 310-30, Loans and Debt Securities Acquired with Deteriorated Credit Quality (formerly, SOP 03-3). A purchased loan is deemed to be credit impaired when there is evidence of credit deterioration since its origination and it is probable at the acquisition date that the company will be unable to collect all contractually required payments. As the unpaid principal balance of the Company’s PCI loan portfolio represented approximately 0.7% of total loans as of March 31, 201, beginning July 2019 the PCI loans were accounted for as Non-PCI loans.
|
(h) |
Loans Held for Investment at Fair Value |
VCC has elected to account for certain purchased distressed loans held for investment at fair value using FASB ASC Topic 825, Financial Instruments (ASC 825). These loans do not have an observable market price or other significant observable market inputs (Level 1 or 2) and, therefore, are accounted for as Level 3 assets. In situations where quoted prices or observable inputs are unavailable (e.g., when there is little or no market activity for an investment at the end of the period), unobservable inputs may be used, which reflect the Company’s own assumptions about the factors that market participants use in pricing an asset or liability, and are based on the best information available in the circumstances. The Company uses a discounted cash flow technique to estimate the fair value of these loans. This technique incorporates forecasting of expected cash flows discounted at an appropriate market discount rate that is intended to reflect the lack of liquidity in the market. The valuation method used to estimate fair value may produce a fair value measurement that may not be indicative of the ultimate realizable value. Furthermore, while management believes its valuation methods are appropriate and consistent with those used by other market participants, the use of different methods or assumptions to estimate the fair value of certain financial instruments could result in a different estimate of fair value at the reporting date. Those estimated values may differ
F-9
significantly from the values that would have been used had a readily available market for such loans existed, or had such loans been liquidated, and those differences could be material to the consolidated financial statements.
|
(i) |
Impaired Loans |
Loans are considered impaired when, based on current information and events, it is probable that the Company will be unable to collect the scheduled payments of principal and interest according to the contractual terms of the loan agreements. Impaired loans include loans on nonaccrual status and performing troubled debt restructured loans. Income from impaired loans is recognized on an accrual basis unless the loan is on nonaccrual status. Income from loans on nonaccrual status is recognized to the extent cash is received and when the loan’s principal balance is deemed collectible. Loans that experience insignificant payment delays and payment shortfalls generally are not classified as impaired. Management determines the significance of payment delays and payment shortfalls on a case by case basis, taking into consideration all the circumstances surrounding the loan and the borrower, including the length of the delay, the reasons for the delay, the borrower’s prior payment record, and the amount of the shortfall in relation to the principal and interest owed. Impairment is measured on a loan by loan basis by comparing the fair value of the underlying collateral, net of estimated selling costs (net realizable value) against the recorded investment of the loan. The net realizable values of the underlying collateral are estimated by management using third-party broker price opinions or appraisals obtained when loans are deemed impaired.
|
(j) |
Allowance for Loan and Lease Losses |
The allowance for loan and lease losses (ALLL) on loans held for investment is maintained at a level deemed adequate by management to provide for probable and inherent losses in the portfolio at the balance sheet date. The ALLL has a general reserve component for loans with no credit impairment and a specific reserve component for loans determined to be impaired.
The allowance methodology for the general reserve component includes both quantitative and qualitative loss factors which are applied to the population of unimpaired loans to estimate the general reserves. The quantitative loss factors include loan type, age of the loan, borrower FICO score, past loan loss experience, historical default rates, and delinquencies. The qualitative loss factors consider, among other things, the loan portfolio composition and risk, current economic conditions that may affect the borrower’s ability to pay, and the underlying collateral value. While management uses available information to estimate its required ALLL, future additions to the ALLL may be necessary based on changes in estimates resulting from economic and other conditions. The provision for loan losses and recoveries of previously recognized charge-offs are added to the ALLL, while charge-offs on loans are recorded as a reduction to ALLL.
Impairment on loans is measured on a loan-by-loan basis by comparing the estimated fair value of the underlying collateral, net of estimated selling costs (net realizable value) against the recorded investment of the loan. To the extent the recorded investment of the loan exceeds the estimated fair value, a specific reserve or charge-off is recorded depending upon either the certainty of the estimate of loss or the fair value of the loan’s collateral.
|
(k) |
Troubled Debt Restructurings |
Troubled debt restructurings (TDRs) are renegotiated loans where borrower concessions have been granted, such as reduction of the UPB or interest rate and for which the borrower is experiencing financial difficulty. Insignificant concessions, such as short-term forbearances, do not constitute a TDR. Accrued but unpaid interest and advances are added to the outstanding principal balance with a corresponding allowance established. Loans classified as TDRs are reported as impaired loans.
F-10
Accrued interest and other receivables represent accrued and uncollected interest on loans in accrual status; principal and interest payments received, but unremitted by the servicer; and receivables from borrowers for escrow and other advances, net of an allowance for uncollectible borrower advances.
|
(m) |
Real Estate Owned, Net (REO) |
Properties acquired through foreclosure, deed in lieu of foreclosure, or from third parties that meet all of the following criteria are classified as real estate owned: (i) management has the intent to sell the property; (ii) the property is available for immediate sale in its present condition, or management intends on making necessary repairs to render the property saleable, subject only to terms that are usual and customary; and (iii) it is unlikely that any significant changes to the plan will be made or that the plan will be withdrawn.
Real estate owned is initially recorded at the property’s estimated fair value, based on appraisals or broker price opinions obtained, less estimated costs to sell, at the acquisition date, establishing a new cost basis. If the recorded loan balance at the time of transfer exceeds the estimated fair value of the property less estimated costs to sell, the charge is recorded to the allowance for loan losses. If the estimated fair value of the property less estimated costs to sell exceeds the recorded loan balance at the time of transfer, the write-up is first recorded as a recapture to the allowance for loan losses to the extent of any previous charge and then to gain on the REO. Any subsequent write-downs in the fair value of the REO after the transfer date are charged to real estate owned, net in the consolidated statements of income and recognized through a valuation allowance. Subsequent increases in the fair value of the REO less selling costs reduce the valuation allowance, but not below zero, and are credited to real estate owned, net.
|
(n) |
Property and Equipment, Net |
Property and equipment is recorded at cost, less accumulated depreciation, computed principally by the straight-line method based on the estimated useful lives of the specific assets, which range from three to seven years. Software is amortized over the estimated useful lives of the specific assets, which range from three to ten years using the straight-line method. Leasehold improvements are amortized over the lives of the respective leases or the service lives of the improvements, whichever is shorter.
|
(o) |
Off Balance Sheet Credit Exposure |
The Company has no off-balance-sheet assets or liabilities and, therefore, no off-balance-sheet credit exposure.
|
(p) |
Income Taxes |
Income taxes are accounted for using the asset and liability method. Under this method a deferred tax asset or liability is determined based on the enacted tax rates which will be in effect when the differences between the financial statement carrying amounts and tax basis of existing assets and liabilities are expected to be reported in the Company's income tax returns. The effect on deferred taxes of a change in tax rates is recognized in income in the period that includes the enactment date. Valuation allowances are established to reduce the net carrying amount of deferred tax assets ("DTA") if it is determined to be more likely than not, that all or some portion of the potential deferred tax asset will not be realized.
Deferred tax assets are recognized subject to management's judgment that realization is "more likely than not." Uncertain tax positions that meet the more likely than not recognition threshold are measured to determine the amount of benefit to recognize. An uncertain tax position is measured at the amount of benefit that management believes has a greater than 50% likelihood of realization upon settlement.
In assessing the realizability of deferred tax assets, management considers whether it is more likely than not that some portion or all of the DTA will or will not be realized. The Company's ultimate realization of the DTA is dependent upon the generation of future taxable income during the periods in which temporary differences become
F-11
deductible. Management considers the nature and amount of historical and projected future taxable income, the scheduled reversal of deferred tax assets and liabilities, and available tax planning strategies in making this assessment. The amount of deferred taxes recognized could be impacted by changes to any of these variables.
Correction of an Error in Prior Period
As described in Note 11 in our Notes to the Consolidated Financial Statements as of and for the year ended December 31, 2018 in the Form S-1, filed with the SEC on January 6, 2020, prior to January 1, 2018, the Company was treated as a partnership and was generally not subject to income taxes. The Company has elected to be treated as a corporation, for tax purposes, effective January 1, 2018. As a result, the Company calculated its deferred tax asset balance as of January 1, 2018 and, per U.S. GAAP, recognized the deferred tax liability offsetting to income in January 2018, the period in which the change was made. During the year ended December 31, 2019, immaterial errors were discovered in prior periods in the determination of deferred tax assets and liabilities and reporting of the GAAP income tax expense. While we have concluded that the impact of these errors on our previously-issued reported consolidated statements of financial condition as of December 31, 2018 and related consolidated statements of income, members equity and cash flows was not material, we have revised our previously reported consolidated statements of financial condition as of December 31, 2018 and related consolidated statements of income, members equity and cash flows.
Revisions to the previously-issued consolidated statements of financial condition consisted of:
|
|
• |
Other assets was reported as $4.8 million and has been revised to $4.5 million; |
|
|
• |
Total assets was reported as $1,738.0 million and has been revised to $1,735.2 million; |
|
|
• |
Accounts payable and accrued expenses was reported as $26.6 million and has been revised to $26.8 million; |
|
|
• |
Total liabilities was reported as $1,571.8 million and has been revised to $1,572.0 million; |
|
|
• |
Members’ equity was reported as $139.7 million and has been revised to $136.8 million; |
|
|
• |
Total liabilities and members’ equity was reported as $1,738.0 million and has been revised to $1,735.2 million; |
Revisions to the previously-issued consolidated statements of income consisted of:
Revisions to the previously-issued consolidated statements of members’ equity consisted of:
|
|
• |
2018 net income was reported as $10.5 million and has been revised to $7.6 million; |
|
|
• |
Balance – December 31, 2018 was reported as $139.7 million and has been revised to $136.8 million |
Revisions to the previously-issued consolidated statements of cash flows consisted of:
|
|
• |
Net income was reported as $10.5 million and has been revised to $7.6 million; |
|
|
• |
Change in net deferred tax benefit was reported as $3.0 million and has been revised to $0.5 million; |
|
|
• |
Change in other assets was reported as ($3.3) million and has been revised to ($3.0) million; and |
|
|
• |
Change in accounts payable and accrued expenses was reported as $0.3 million and has been revised to $0.4 million. |
F-12
In July 2012, the Company adopted its equity incentive plan (note 16) to allow the grant of profits interest units to its officers, directors, and employees. The cost of these awards is measured at grant date, based on the fair value of the award, and is recognized as an expense over the related service period.
Note 3 — Current Accounting Developments
|
(a) |
Accounting Standards Adopted in 2019 |
Effective January 1, 2019, the Company adopted ASU 2016-02, “Leases (Topic 842),” and the related amendments to this new standard issued in 2018. ASU 2016-02 supersedes Topic 840, “Leases,” and is intended to increase transparency and comparability among organizations by requiring the recognition of right-of-use (“ROU”) assets and lease liabilities by lessees for those leases classified as operating leases. Under the standard, disclosures are required to meet the objective of enabling users of the financial statements to assess the amount, timing, and uncertainty of cash flows arising from leases.
The Company adopted the new standard using the optional transition method under ASU 2018-11, “Leases (Topic 842): Targeted Improvements,” on January 1, 2019. Upon adoption, the Company recognized an operating lease liability of $2.8 million, and a corresponding right-of-use asset of $2.6 million based on the present value of the remaining minimum lease payments for existing operating leases. The Company has elected the following practical expedients: (1) As a lessee the Company will not separate lease and non-lease components when determining the amount of right of use assets; (2) to not reassess whether any expired or existing contracts are or contain leases and to maintain existing lease classifications; (3) to not record short-term leases (initial term of 12 months or less) on the balance sheet.
Effective January 1, 2019, the Company early-adopted any removed or modified disclosures as permitted by ASU 2018-13, “Fair Value Measurement (Topic 820): Disclosure Framework — Changes to Disclosure Requirements for Fair Value Measurements,” but will defer adoption of the additional disclosures until the effective date of January 1, 2020 as permitted in the transition guidance in ASU 2018-13.
Note 4 — Cash, Cash Equivalents, and Restricted Cash
The 2011-1 securitization agreement required the Company to set aside cash to cover potential shortfall. The Company is also required to hold cash for potential future advances due certain borrowers. The following table provides a reconciliation of cash, cash equivalents, and restricted cash reported within the Company’s consolidated statement of financial condition that sum to the total of the same such amounts shown in the consolidated statements of cash flows for the year ended December 31, 2019 and 2018.
|
|
|
2019 |
|
|
2018 |
|
||
|
Cash and cash equivalents |
|
$ |
21,465 |
|
|
$ |
15,008 |
|
|
Restricted cash |
|
|
6,087 |
|
|
|
1,669 |
|
|
Total cash, cash equivalents, and restricted cash shown in the statement of cash flows |
|
$ |
27,552 |
|
|
$ |
16,677 |
|
Note 5 — Loans Held for Sale, Net
The unpaid principal balance of loans held for sale as of December 31, 2019 and 2018 was $216.1 million and $79.3 million, respectively. The net deferred loan origination costs as of December 31, 2019 and 2018 was $1.2 million and $0.7 million, respectively, and the valuation adjustment was $0.4 million and $0.2 million for the years ended December 31, 2019 and 2018, respectively.
F-13
Note 6 — Loans Held for Investment and Loans Held for Investment at Fair Value
The following tables summarize loans held for investment as of December 31, 2019 and 2018 (in thousands):
|
|
|
December 31, 2019 |
|
|||||||||
|
|
|
Loans held for |
|
|
Loans held for |
|
|
Total loans |
|
|||
|
|
|
investment, |
|
|
investment, at |
|
|
held for |
|
|||
|
|
|
net |
|
|
fair value |
|
|
investment |
|
|||
|
Unpaid principal balance |
|
$ |
1,839,886 |
|
|
$ |
3,404 |
|
|
$ |
1,843,290 |
|
|
Valuation adjustments on FVO loans |
|
|
— |
|
|
|
(444 |
) |
|
|
(444 |
) |
|
Deferred loan origination costs |
|
|
25,714 |
|
|
|
— |
|
|
|
25,714 |
|
|
|
|
|
1,865,600 |
|
|
|
2,960 |
|
|
|
1,868,560 |
|
|
Allowance for loan losses |
|
|
(2,240 |
) |
|
|
— |
|
|
|
(2,240 |
) |
|
|
|
$ |
1,863,360 |
|
|
$ |
2,960 |
|
|
$ |
1,866,320 |
|
|
|
|
December 31, 2018 |
|
|||||||||
|
|
|
Loans held for |
|
|
Loans held for |
|
|
Total loans |
|
|||
|
|
|
investment, |
|
|
investment, at |
|
|
held for |
|
|||
|
|
|
net |
|
|
fair value |
|
|
investment |
|
|||
|
Unpaid principal balance |
|
$ |
1,547,817 |
|
|
$ |
4,049 |
|
|
$ |
1,551,866 |
|
|
Discount on acquired loans |
|
|
(541 |
) |
|
|
— |
|
|
|
(541 |
) |
|
Valuation adjustments on FVO loans |
|
|
— |
|
|
|
(586 |
) |
|
|
(586 |
) |
|
Deferred loan origination costs |
|
|
21,812 |
|
|
|
— |
|
|
|
21,812 |
|
|
|
|
|
1,569,088 |
|
|
|
3,463 |
|
|
|
1,572,551 |
|
|
Allowance for loan losses |
|
|
(1,680 |
) |
|
|
— |
|
|
|
(1,680 |
) |
|
|
|
$ |
1,567,408 |
|
|
$ |
3,463 |
|
|
$ |
1,570,871 |
|
As of December 31, 2019 and 2018, the gross unpaid principal balance of loans held for investment pledged as collateral for the Company’s warehouse facility agreements, and securitizations issued were as follows (in thousands):
|
|
|
2019 |
|
|
2018 |
|
||
|
Citibank warehouse repurchase agreement |
|
$ |
108,504 |
|
|
$ |
114,112 |
|
|
Barclays warehouse repurchase agreement |
|
|
175,689 |
|
|
|
85,448 |
|
|
Pacific Western Bank agreement |
|
|
3,331 |
|
|
|
— |
|
|
Total pledged loans |
|
|
287,524 |
|
|
|
199,560 |
|
|
|
|
|
|
|
|
|
|
|
|
2011-1 Trust |
|
|
— |
|
|
|
17,226 |
|
|
2014-1 Trust |
|
|
29,559 |
|
|
|
45,770 |
|
|
2015-1 Trust |
|
|
64,876 |
|
|
|
100,414 |
|
|
2016-1 Trust |
|
|
97,727 |
|
|
|
173,494 |
|
|
2016-2 Trust |
|
|
68,961 |
|
|
|
120,937 |
|
|
2017-1 Trust |
|
|
116,670 |
|
|
|
155,861 |
|
|
2017-2 Trust |
|
|
173,390 |
|
|
|
214,111 |
|
|
2018-1 Trust |
|
|
141,567 |
|
|
|
168,615 |
|
|
2018-2 Trust |
|
|
260,278 |
|
|
|
314,860 |
|
|
2019-1 Trust |
|
|
229,151 |
|
|
|
— |
|
|
2019-2 Trust |
|
|
210,312 |
|
|
|
— |
|
|
2019-3 Trust |
|
|
157,119 |
|
|
|
— |
|
|
Total |
|
$ |
1,549,610 |
|
|
$ |
1,311,288 |
|
Prior to July 2019, the Company accounted for PCI loans using the expected cash flows method. Under the expected cash flows method, management estimates the fair value of PCI loans at acquisition by (a) calculating the contractual amount and timing of undiscounted principal and interest payments (the undiscounted contractual cash
F-14
flows) and (b) estimating the amount and timing of undiscounted expected principal and interest payments (the undiscounted expected cash flows). The undiscounted expected cash flows are determined using a projected cash flow model that utilizes the outstanding principal balance, weighted average interest rate and weighted average remaining term of the PCI loan portfolio, and assumptions surrounding the amount and timing of loans that are projected to voluntarily prepay (the prepayment rate), the amount and timing of loans that are projected to involuntarily prepay (the default rate), and the amount of principal loss projected to be incurred upon the liquidation of defaulted loans (the loss severity rate). The undiscounted contractual cash flows were determined using a projected cash flow model that utilizes the outstanding principal balance, weighted average interest rate and weighted average remaining term of the PCI loan portfolio, and the prepayment rate used to determine the undiscounted expected cash flows.
The following table summarizes the accretable yield on PCI loans accounted for under ASC subtopic 310-30 as of December 31, 2019 and December 31, 2018, and the related activity for the periods then ended (in thousands):
|
|
|
Year ended December 31, |
|
|||||
|
|
|
2019 |
|
|
2018 |
|
||
|
Beginning balance |
|
$ |
3,748 |
|
|
$ |
4,666 |
|
|
Accretion |
|
|
(443 |
) |
|
|
(1,242 |
) |
|
Disposals |
|
|
(12 |
) |
|
|
(118 |
) |
|
Change due to expected cash flows |
|
|
1,755 |
|
|
|
442 |
|
|
Reclass to non-PCI loan portfolio |
|
|
(5,048 |
) |
|
|
— |
|
|
Ending balance |
|
$ |
— |
|
|
$ |
3,748 |
|
PCI loans were accounted for as Non-PCI loans effective July 2019. As of December 31, 2018, the outstanding balance of PCI loans was $11.6 million. The carrying amount of PCI loans, included in loans held for investment, net in the consolidated statements of financial condition, was $11.1 million as of December 31, 2018. An allowance for PCI loan losses was not required at December 31, 2018.
|
(a) |
Nonaccrual Loans |
The following table presents certain information about the Company’s loans held for investment and loans that were considered impaired and on nonaccrual status as of December 31, 2019 and 2018. Loans accounted for under ASC subtopic 310-30 are not included in impaired loans as the loans are accounted for as a single asset and are not subject to review for specific allowance requirements. Other than loans accounted for under ASC subtopic 310-30, there were no loans accruing interest that were greater than 90 days past due as of December 31, 2019 or 2018.
F-15
The following table provides information on impaired loans held for investment as of December 31, 2019 and 2018 (dollars in thousands):
|
|
|
2019 |
|
|
2018 |
|
||
|
Nonaccrual loans: |
|
|
|
|
|
|
|
|
|
Recorded investment |
|
$ |
125,819 |
|
|
$ |
93,653 |
|
|
Percentage of the originated loans held for investment |
|
|
6.7 |
% |
|
|
5.9 |
% |
|
Impaired loans: |
|
|
|
|
|
|
|
|
|
Unpaid principal balance |
|
$ |
124,050 |
|
|
$ |
92,410 |
|
|
Recorded investment |
|
|
125,998 |
|
|
|
93,841 |
|
|
Recorded investment of impaired loans requiring a specific allowance |
|
|
12,286 |
|
|
|
6,283 |
|
|
Specific allowance |
|
|
913 |
|
|
|
636 |
|
|
Specific allowance as a percentage of recorded investment of impaired loans requiring a specific allowance |
|
|
7.4 |
% |
|
|
10.1 |
% |
|
Recorded investment of impaired loans not requiring a specific allowance |
|
$ |
113,712 |
|
|
$ |
87,558 |
|
|
Percentage of recorded investment of impaired loans not requiring a specific allowance |
|
|
90.2 |
% |
|
|
93.3 |
% |
|
TDRs included in impaired loans: |
|
|
|
|
|
|
|
|
|
Recorded investment of TDRs |
|
$ |
179 |
|
|
$ |
188 |
|
|
Recorded investment of TDRs with a specific allowance |
|
|
179 |
|
|
|
188 |
|
|
Specific allowance |
|
|
25 |
|
|
|
25 |
|
|
Recorded investment of TDRs without a specific allowance |
|
|
— |
|
|
|
— |
|
For the years ended December 31, 2019 and 2018, there was no accrued interest income recognized on nonaccrual loans, cash basis interest income recognized on nonaccrual loans was $12.7 million and $9.0 million, respectively, and the average recorded investment of impaired loans, computed using month-end balances, was $111.2 million and $78.0 million, respectively. There were no commitments to lend additional funds to debtors whose loans have been modified as of December 31, 2019 and 2018.
|
(b) |
Allowance for Loan Losses |
Activity in the allowance for loan losses during the years ended December 31, 2019 and 2018 was as follows (in thousands):
|
|
|
2019 |
|
|
2018 |
|
||
|
Beginning balance |
|
$ |
1,680 |
|
|
$ |
1,886 |
|
|
Provision for loan losses |
|
|
1,139 |
|
|
|
201 |
|
|
Charge-offs |
|
|
(579 |
) |
|
|
(407 |
) |
|
Ending balance |
|
$ |
2,240 |
|
|
$ |
1,680 |
|
|
Allowance related to: |
|
|
|
|
|
|
|
|
|
Loans individually evaluated for impairment |
|
$ |
913 |
|
|
$ |
636 |
|
|
Loans collectively evaluated for impairment |
|
|
1,327 |
|
|
|
1,044 |
|
|
Recorded investment related to: |
|
|
|
|
|
|
|
|
|
Loans individually evaluated for impairment |
|
$ |
125,998 |
|
|
$ |
93,841 |
|
|
Loans collectively evaluated for impairment |
|
|
1,739,587 |
|
|
|
1,475,247 |
|
F-16
A credit quality indicator is a statistic used by management to monitor and assess the credit quality of loans held for investment, excluding loans held for investment at fair value. Management monitors delinquencies, bankruptcies, and foreclosures as its primary credit quality indicator, and the following table provides delinquency information on the recorded investment in the loans held for investment portfolio as of December 31, 2019 and 2018 (in thousands):
|
|
|
30–59 days |
|
|
60–89 days |
|
|
90+days |
|
|
Total |
|
|
|
|
|
|
Total |
|
|||||
|
|
|
past due |
|
|
past due |
|
|
past due(1) |
|
|
past due |
|
|
Current |
|
|
loans |
|
||||||
|
December 31, 2019: |
|
|
|
|
|
|
|
|
|
|
|
|
|
|
|
|
|
|
|
|
|
|
|
|
|
Impaired loans |
|
$ |
6,195 |
|
|
$ |
7,696 |
|
|
$ |
111,928 |
|
|
$ |
125,819 |
|
|
$ |
179 |
|
|
$ |
125,998 |
|
|
Nonimpaired loans |
|
|
119,465 |
|
|
|
41,138 |
|
|
|
— |
|
|
|
160,603 |
|
|
|
1,578,984 |
|
|
|
1,739,587 |
|
|
Ending balance |
|
$ |
125,660 |
|
|
$ |
48,834 |
|
|
$ |
111,928 |
|
|
$ |
286,422 |
|
|
$ |
1,579,163 |
|
|
$ |
1,865,585 |
|
|
|
|
|
|
|
|
|
|
|
|
|
|
|
|
|
|
|
|
|
|
|
|
|
|
|
|
December 31, 2018: |
|
|
|
|
|
|
|
|
|
|
|
|
|
|
|
|
|
|
|
|
|
|
|
|
|
Impaired loans |
|
$ |
1,421 |
|
|
$ |
2,286 |
|
|
$ |
90,134 |
|
|
$ |
93,841 |
|
|
$ |
— |
|
|
$ |
93,841 |
|
|
Nonimpaired loans |
|
|
78,538 |
|
|
|
21,930 |
|
|
|
187 |
|
|
|
100,655 |
|
|
|
1,374,592 |
|
|
|
1,475,247 |
|
|
Ending balance |
|
$ |
79,959 |
|
|
$ |
24,216 |
|
|
$ |
90,321 |
|
|
$ |
194,496 |
|
|
$ |
1,374,592 |
|
|
$ |
1,569,088 |
|
|
(1) |
Includes loans in bankruptcy and foreclosure less than 90 days past due. |
Note 7 — Mortgage Loans on Real Estate
The following table presents the Company’s loans collateralized by real estate as of December 31, 2019 and 2018 (in thousands).
|
December 31, 2019 |
|
|||||||||||
|
|
|
|
|
|
|
|
|
|
|
|
|
|
|
Description |
|
Interest Rate |
|
Final Maturity Date |
|
Unpaid Principal Balance (1) (2) |
|
|
Nonaccrual |
|
||
|
1-4 unit residential (3) |
|
|
|
|
|
|
|
|
|
|
|
|
|
Under $1.0 million |
|
5.2% - 16.3% |
|
January 1, 2050 |
|
$ |
916,809 |
|
|
$ |
85,680 |
|
|
$1.0 million and over |
|
6.0% - 11.5% |
|
January 1, 2050 |
|
|
158,662 |
|
|
|
15,492 |
|
|
|
|
|
|
|
|
|
1,075,471 |
|
|
|
101,172 |
|
|
Traditional commercial (4) |
|
|
|
|
|
|
|
|
|
|
|
|
|
Under $1.0 million |
|
4.5% - 13.0% |
|
January 1, 2050 |
|
|
802,142 |
|
|
|
42,725 |
|
|
$1.0 million and over |
|
4.1% - 10.5% |
|
January 1, 2050 |
|
|
181,731 |
|
|
|
11,927 |
|
|
|
|
|
|
|
|
|
983,873 |
|
|
|
54,652 |
|
|
Total at December 31, 2019 |
|
|
|
|
|
$ |
2,059,344 |
|
|
$ |
155,824 |
|
F-17
|
|
||||||||||||
|
Description |
|
Interest Rate |
|
Final Maturity Date |
|
Unpaid Principal Balance (1) (2) |
|
|
Nonaccrual |
|
||
|
1-4 unit residential (3) |
|
|
|
|
|
|
|
|
|
|
|
|
|
Under % $1.0 million |
|
6.0% - 13.3% |
|
January 1, 2049 |
|
$ |
731,262 |
|
|
$ |
43,975 |
|
|
$1.0 million and over |
|
6.0 - 10.3% |
|
January 1, 2049 |
|
|
79,787 |
|
|
|
7,455 |
|
|
|
|
|
|
|
|
|
811,049 |
|
|
|
51,430 |
|
|
Traditional commercial (4) |
|
|
|
|
|
|
|
|
|
|
|
|
|
Under % $1.0 million |
|
4.5% - 13.0% |
|
January 1, 2049 |
|
|
647,802 |
|
|
|
40,925 |
|
|
$1.0 million and over |
|
4.1% - 11.8% |
|
January 1, 2049 |
|
|
172,475 |
|
|
|
18,585 |
|
|
|
|
|
|
|
|
|
820,277 |
|
|
|
59,510 |
|
|
Total at December 31, 2018 |
|
|
|
|
|
$ |
1,631,326 |
|
|
$ |
110,940 |
|
|
Note (1): |
The aggregate cost of the Company’s loan portfolio for Federal income tax purposes was $2,082,426 and $1,651,123 as of December 31, 2019 and 2018, respectively. |
|
Note (2): |
As of December 31, 2019 and 2018, $217.5 million and $79.3 million, respectively, of the total UPB were interest-only loans with interest payable monthly and the principal payable at maturity. These loans generally contain a 4-months interest prepayment penalty provision if the loan is paid-off within the first 4 months. |
|
Note (3): |
The principal and interest on the 1-4 unit residential mortgage loans is payable monthly at a level amount over the life of the loan to maturity. These loans generally contain a 3% prepayment penalty provision if the loan is prepaid within the first 3 years. |
|
Note (4): |
The principal and interest on the traditional commercial mortgage loans is payable monthly at a level amount over the life of the loan to maturity. These loans generally contain a 5% prepayment penalty provision if the loan is prepaid within the first 3 years. |
The following table presents the reconciliation of the UPB of mortgage loans for the years ended December 31, 2019, 2018, and 2017:
|
|
|
2019 |
|
|
2018 |
|
|
2017 |
|
|||
|
Balance at beginning of period |
|
$ |
1,631,326 |
|
|
$ |
1,295,439 |
|
|
$ |
1,037,857 |
|
|
Addition during period: |
|
|
|
|
|
|
|
|
|
|
|
|
|
New mortgage loans |
|
|
1,012,068 |
|
|
|
737,297 |
|
|
|
554,710 |
|
|
Acquisition |
|
|
21,759 |
|
|
|
16,243 |
|
|
|
985 |
|
|
Deduction during period: |
|
|
|
|
|
|
|
|
|
|
|
|
|
Collection of principal |
|
|
(404,757 |
) |
|
|
(337,565 |
) |
|
|
(238,805 |
) |
|
Foreclosures |
|
|
(10,442 |
) |
|
|
(7,481 |
) |
|
|
(6,929 |
) |
|
Mortgages sold |
|
|
(190,610 |
) |
|
|
(72,607 |
) |
|
|
(52,379 |
) |
|
Balance at end of period |
|
$ |
2,059,344 |
|
|
$ |
1,631,326 |
|
|
$ |
1,295,439 |
|
Note 8 — Property and Equipment, Net
As of December 31, 2019 and 2018, property and equipment consisted of the following (in thousands):
|
|
|
2019 |
|
|
2018 |
|
||
|
Furniture |
|
$ |
805 |
|
|
$ |
565 |
|
|
Computer equipment |
|
|
1,044 |
|
|
|
964 |
|
|
Office equipment |
|
|
241 |
|
|
|
380 |
|
|
Leasehold improvements |
|
|
275 |
|
|
|
181 |
|
|
Capitalized software |
|
|
7,466 |
|
|
|
7,482 |
|
|
|
|
|
9,831 |
|
|
|
9,572 |
|
|
Accumulated depreciation and amortization |
|
|
(5,151 |
) |
|
|
(4,037 |
) |
|
Ending balance |
|
$ |
4,680 |
|
|
$ |
5,535 |
|
F-18
During the years ended December 31, 2019, 2018 and 2017, depreciation and amortization expense was $1.4 million, $1.4 million and $1.2 million, respectively.
The Company engaged a third-party consulting firm to assist in the building and implementation of a data warehouse and loan origination systems. The data warehouse was placed into service in 2017 and the loan origination system was placed into service in 2018. The total capitalized costs for the data warehouse and loan origination systems was $5.7 million and $5.8 million as of December 31, 2019 and 2018, respectively. Total accumulated depreciation and amortization included accumulated amortization on capitalized software of $2.2 million and $2.7 million for the years ended December 31, 2019 and 2018, respectively. The estimated aggregate amortization expense related to capitalized software for each of the next five years is $0.8 million for 2020, $0.7 million for 2021, $0.4 million for 2022, $0.4 million for 2023, and $0.4 million for 2024.
Note 9 — Real Estate Owned, Net
The Company’s real estate owned activities were as follows during the years ended December 31, 2019 and 2018 (in thousands):
|
|
|
2019 |
|
|
2018 |
|
||
|
Beginning balance |
|
$ |
7,167 |
|
|
$ |
5,322 |
|
|
Additions |
|
|
11,661 |
|
|
|
7,880 |
|
|
Capitalized improvements |
|
|
1,122 |
|
|
|
397 |
|
|
Sales |
|
|
(4,290 |
) |
|
|
(5,544 |
) |
|
Other adjustments |
|
|
(961 |
) |
|
|
— |
|
|
Valuation adjustments |
|
|
(1,631 |
) |
|
|
(888 |
) |
|
Ending balance |
|
$ |
13,068 |
|
|
$ |
7,167 |
|
The following table summarizes information about real estate operating income and expenses, realized gains and losses on sales of real estate, and unrealized gains and losses resulting from adjustments to valuation allowances for the years ended December 31, 2019, 2018 and 2017 (in thousands):
|
|
|
2019 |
|
|
2018 |
|
|
2017 |
|
|||
|
Operating income |
|
$ |
242 |
|
|
$ |
2 |
|
|
$ |
258 |
|
|
Operating expenses |
|
|
(1,465 |
) |
|
|
(1,127 |
) |
|
|
(783 |
) |
|
Valuation adjustments |
|
|
(1,631 |
) |
|
|
(888 |
) |
|
|
(211 |
) |
|
Net gain on sales of real estate |
|
|
207 |
|
|
|
640 |
|
|
|
133 |
|
|
Total |
|
$ |
(2,647 |
) |
|
$ |
(1,373 |
) |
|
$ |
(603 |
) |
Net gain (loss) on sales of real estate represent the difference between the net proceeds from the liquidation of the underlying properties and their respective carrying values. The following table provides additional information about the number of properties sold and the gross gains and losses recognized in real estate owned, net, in the consolidated statements of income, during the years ended December 31, 2019, 2018 and 2017 (in thousands, except properties sold):
|
|
|
2019 |
|
|
2018 |
|
|
2017 |
|
|||||||||||||||
|
|
|
Properties |
|
|
Gain |
|
|
Properties |
|
|
Gain |
|
|
Properties |
|
|
Gain |
|
||||||
|
|
|
sold |
|
|
(loss) |
|
|
sold |
|
|
(loss) |
|
|
sold |
|
|
(loss) |
|
||||||
|
Sales resulting in gains |
|
|
10 |
|
|
$ |
320 |
|
|
|
13 |
|
|
$ |
649 |
|
|
|
8 |
|
|
$ |
163 |
|
|
Sales resulting in losses |
|
|
5 |
|
|
|
(113 |
) |
|
|
2 |
|
|
|
(9 |
) |
|
|
3 |
|
|
|
(30 |
) |
|
Total |
|
|
15 |
|
|
$ |
207 |
|
|
|
15 |
|
|
$ |
640 |
|
|
|
11 |
|
|
$ |
133 |
|
F-19
In 2017, the Company started originating and selling interest-only short-term loans either at a cash premium without any beneficial interest or at par value with a retained beneficial interest in the excess interest spread over a stated coupon rate. The retained beneficial interest or interest-only strips is included in other assets in the consolidated statements of financial condition.
Other assets were comprised of the following as of December 31, 2019 and 2018 (in thousands):
|
|
|
December 31, |
|
|||||
|
|
|
2019 |
|
|
2018 (1) |
|
||
|
Prepaid expenses |
|
$ |
1,574 |
|
|
$ |
1,115 |
|
|
Interest-only strips and deposits |
|
|
1,086 |
|
|
|
946 |
|
|
Deferred costs |
|
|
4,000 |
|
|
|
1,259 |
|
|
Income tax receivable |
|
|
— |
|
|
|
1,159 |
|
|
Operating leases-Right of Use Assets, net |
|
|
6,007 |
|
|
|
— |
|
|
Total other assets |
|
$ |
12,667 |
|
|
$ |
4,479 |
|
|
|
(1) |
Income tax receivable and total other assets were previously reported at $1.4 million and $4.8 million, respectively, and have been revised to $1.2 million and $4.5 million, respectively. |
Note 11 — Leases
The Company adopted ASU 2016-02, Leases (Topic 842) and all subsequent related ASUs using the alternative transition method effective January 1, 2019. The Company has elected the package of practical expedients that permits the Company to not reassess prior conclusions about lease identification, lease classification and initial direct costs. The Company also elected all of the new standard’s available transition practical expedients, including the short-term lease recognition exemption that includes not recognizing ROU assets or lease liabilities for existing short-term leases, and the practical expedient to not separate lease and non-lease components for all leases.
The Company determines if a contract arrangement is a lease at inception. The Company primarily enters into operating lease contracts for office space and certain equipment. As part of the property lease agreements, the Company may include options to extend or terminate the lease when it is reasonably certain that the Company will exercise those options. The ROU lease asset also includes any lease payments made and lease incentives. Lease expense for lease payments is recognized on a straight-line basis over the lease term. The Company does not possess any leases that have variable lease payments or residual value guarantees.
The Company uses its incremental borrowing rates to determine the present value of its lease liabilities. The weighted average borrowing rate was 6.01% as of December 31, 2019. The Company’s leases have remaining terms ranging from 2 years to 5 years, and the weighted average remaining lease term was 4.0 years as of December 31, 2019. Short-term leases (initial term of less than 12 months) are not recorded on the balance sheet and lease expense is recognized on a straight-line basis over the lease term.
As of December 31, 2019, the Company recorded a ROU asset of $6.0 million, net of accumulated amortization of $1.1 million. Operating lease expense is a component of “Rent and occupancy” expense on the consolidated statements of income. Operating lease expense was $1.3 million for the year ended December 31, 2019 and included short-term leases that were immaterial. Operating cash flows from operating leases were $1.1 million for year ended December 31, 2019.
The following table presents supplemental cash flow information related to leases for the year ended December 31, 2019 (in thousands):
|
|
|
|
December 31, 2019 |
|
|
|
Cash paid for amounts included in the measurement of lease liabilities: |
|
|
|
|
|
|
Operating cash flows from operating leases |
|
|
$ |
1,267 |
|
|
ROU assets obtained in exchange for lease obligations: |
|
|
|
|
|
|
Operating leases |
|
|
$ |
7,061 |
|
F-20
The following table presents maturities of operating lease liabilities as of December 31, 2019 (in thousands):
|
|
|
December 31, 2019 |
|
|
|
|
|
Operating Leases |
|
|
|
2020 |
|
$ |
1,526 |
|
|
2021 |
|
|
1,602 |
|
|
2022 |
|
|
1,582 |
|
|
2023 |
|
|
1,394 |
|
|
2024 |
|
|
1,066 |
|
|
Thereafter |
|
|
55 |
|
|
Total lease payments |
|
|
7,225 |
|
|
Less: Imputed interest |
|
|
(914 |
) |
|
Present value of lease liabilities |
|
$ |
6,311 |
|
Prior to the adoption of ASC Topic 842, the Company's operating leases were not recognized on the balance sheet. The following table presents the undiscounted future minimum lease payments under the Company's operating leases as of December 31, 2018 (in thousands):
|
|
|
December 31, 2018 |
|
|
|
|
|
Operating Leases |
|
|
|
2019 |
|
$ |
1,065 |
|
|
2020 |
|
|
674 |
|
|
2021 |
|
|
534 |
|
|
2022 |
|
|
463 |
|
|
2023 |
|
|
206 |
|
|
Thereafter |
|
|
217 |
|
|
Total |
|
$ |
3,159 |
|
F-21
Note 12 — Securitizations, Net
From May 2011 through October 2019, the Company completed twelve securitizations of $2.7 billion of loans, issuing $2.5 billion of securities to third parties through twelve respective Trusts. The Company is the sole beneficial interest holder of the Trusts, which are variable interest entities included in the consolidated financial statements. The transactions are accounted for as secured borrowings under U.S. GAAP. The securities are subject to redemption by the Company when the stated principal balance is less than a certain percentage, ranging from 5%–30% of the original stated principal balance of loans at issuance. As a result, the actual maturity dates of the securities issued could be earlier than their respective stated maturity dates. The following table summarizes the investor real estate loans securitized, and securities issued, ownership retained by the Company at the time of the securitization, and as of December 31, 2019 and 2018, and the stated maturity for each securitization (in thousands):
|
|
|
|
|
|
|
|
|
|
|
Securities Retained as of |
|
|
|
|||||||||
|
Trusts |
|
Mortgage Loans |
|
|
Securities Issued |
|
|
Issuance Date |
|
|
December 31, 2019 |
|
|
December 31, 2018 |
|
|
Stated Maturity Date |
|||||
|
2011-1 Trust |
|
$ |
74,898 |
|
|
$ |
61,042 |
|
|
$ |
13,856 |
|
|
$ |
— |
|
|
$ |
13,856 |
|
|
August 2040 |
|
2014-1 Trust |
|
|
191,757 |
|
|
|
161,076 |
|
|
|
30,682 |
|
|
|
— |
|
|
|
9,596 |
|
|
September 2044 |
|
2015-1 Trust |
|
|
312,829 |
|
|
|
285,457 |
|
|
|
27,372 |
|
|
|
15,569 |
|
|
|
15,657 |
|
|
July 2045 |
|
2016-1 Trust |
|
|
358,601 |
|
|
|
319,809 |
|
|
|
38,792 |
|
|
|
17,931 |
|
|
|
17,931 |
|
|
April 2046 |
|
2016-2 Trust |
|
|
190,255 |
|
|
|
166,853 |
|
|
|
23,402 |
|
|
|
9,514 |
|
|
|
9,514 |
|
|
October 2046 |
|
2017-1 Trust |
|
|
223,064 |
|
|
|
211,910 |
|
|
|
11,154 |
|
|
|
11,154 |
|
|
|
11,154 |
|
|
April 2047 |
|
2017-2 Trust |
|
|
258,528 |
|
|
|
245,601 |
|
|
|
12,927 |
|
|
|
8,293 |
|
|
|
10,631 |
|
|
October 2047 |
|
2018-1 Trust |
|
|
186,124 |
|
|
|
176,816 |
|
|
|
9,308 |
|
|
|
6,884 |
|
|
|
8,256 |
|
|
April 2048 |
|
2018-2 Trust |
|
|
324,198 |
|
|
|
307,988 |
|
|
|
16,210 |
|
|
|
12,853 |
|
|
|
15,893 |
|
|
October 2048 |
|
2019-1 Trust |
|
|
247,979 |
|
|
|
235,580 |
|
|
|
12,399 |
|
|
|
11,767 |
|
|
|
— |
|
|
March 2049 |
|
2019-2 Trust |
|
|
217,921 |
|
|
|
207,020 |
|
|
|
10,901 |
|
|
|
10,491 |
|
|
|
— |
|
|
July 2049 |
|
2019-3 Trust |
|
|
162,546 |
|
|
|
154,419 |
|
|
|
8,127 |
|
|
|
7,913 |
|
|
|
— |
|
|
October 2049 |
|
Total |
|
$ |
2,748,700 |
|
|
$ |
2,533,571 |
|
|
$ |
215,130 |
|
|
$ |
112,367 |
|
|
$ |
112,488 |
|
|
|
The following table summarizes outstanding bond balances for each securitization as of December 31, 2019 and 2018 (in thousands).
|
|
|
2019 |
|
|
2018 |
|
||
|
2011-1 Trust |
|
$ |
— |
|
|
$ |
3,593 |
|
|
2014-1 Trust |
|
|
31,139 |
|
|
|
36,751 |
|
|
2015-1 Trust |
|
|
50,631 |
|
|
|
91,246 |
|
|
2016-1 Trust |
|
|
86,901 |
|
|
|
164,715 |
|
|
2016-2 Trust |
|
|
63,983 |
|
|
|
114,143 |
|
|
2017-1 Trust |
|
|
113,540 |
|
|
|
147,326 |
|
|
2017-2 Trust |
|
|
163,295 |
|
|
|
205,388 |
|
|
2018-1 Trust |
|
|
134,700 |
|
|
|
159,116 |
|
|
2018-2 Trust |
|
|
247,580 |
|
|
|
298,556 |
|
|
2019-1 Trust |
|
|
214,709 |
|
|
|
— |
|
|
2019-2 Trust |
|
|
200,345 |
|
|
|
— |
|
|
2019-3 Trust |
|
|
150,725 |
|
|
|
— |
|
F-22
The securities and certificates were issued at a discount to par, which is recorded as a contra liability to the securities issued. The discount is amortized as an adjustment of yield over the stated term of the securities adjusted for prepayments. In 2018, the Company sold some retained securities at a premium, resulting in a net premium for the 2016-2 Trust. As of December 31, 2019 and 2018, unamortized discounts or premiums associated with the Trusts are as follows in (thousands):
|
|
|
2019 |
|
|
2018 |
|
||
|
2011-1 Trust |
|
$ |
— |
|
|
$ |
198 |
|
|
2014-1 Trust |
|
|
243 |
|
|
|
512 |
|
|
2015-1 Trust |
|
|
72 |
|
|
|
95 |
|
|
2016-1 Trust |
|
|
487 |
|
|
|
679 |
|
|
2016-2 Trust |
|
|
(148 |
) |
|
|
(209 |
) |
|
2017-1 Trust |
|
|
1,662 |
|
|
|
1,917 |
|
|
2017-2 Trust |
|
|
26 |
|
|
|
38 |
|
|
2018-1 Trust |
|
|
31 |
|
|
|
44 |
|
|
2018-2 Trust |
|
|
32 |
|
|
|
45 |
|
|
2019-1 Trust |
|
|
36 |
|
|
|
— |
|
|
2019-2 Trust |
|
|
19 |
|
|
|
— |
|
|
2019-3 Trust |
|
|
14 |
|
|
|
— |
|
Professional and other capitalized issuance costs associated with the securitizations are recorded as a contra liability to the securities issued. As of December 31, 2019 and 2018, capitalized issuance costs associated with the Trusts are as follows (in thousands):
|
|
|
2019 |
|
|
2018 |
|
||
|
2011-1 Trust |
|
$ |
— |
|
|
$ |
51 |
|
|
2014-1 Trust |
|
|
43 |
|
|
|
116 |
|
|
2015-1 Trust |
|
|
392 |
|
|
|
551 |
|
|
2016-1 Trust |
|
|
401 |
|
|
|
2,090 |
|
|
2016-2 Trust |
|
|
522 |
|
|
|
1,487 |
|
|
2017-1 Trust |
|
|
1,147 |
|
|
|
2,074 |
|
|
2017-2 Trust |
|
|
2,133 |
|
|
|
2,924 |
|
|
2018-1 Trust |
|
|
1,597 |
|
|
|
2,224 |
|
|
2018-2 Trust |
|
|
2,779 |
|
|
|
3,877 |
|
|
2019-1 Trust |
|
|
2,619 |
|
|
|
— |
|
|
2019-2 Trust |
|
|
2,633 |
|
|
|
— |
|
|
2019-3 Trust |
|
|
2,179 |
|
|
|
— |
|
As of December 31, 2019 and 2018, the weighted average rate on the securities and certificates for the Trusts are as follows:
|
|
|
2019 |
|
|
2018 |
|
||
|
2011-1 Trust |
|
|
— |
% |
|
|
6.19 |
% |
|
2014-1 Trust |
|
|
8.33 |
|
|
|
7.09 |
|
|
2015-1 Trust |
|
|
6.37 |
|
|
|
6.63 |
|
|
2016-1 Trust |
|
|
6.75 |
|
|
|
5.48 |
|
|
2016-2 Trust |
|
|
5.59 |
|
|
|
4.67 |
|
|
2017-1 Trust |
|
|
4.56 |
|
|
|
4.35 |
|
|
2017-2 Trust |
|
|
3.50 |
|
|
|
3.56 |
|
|
2018-1 Trust |
|
|
3.95 |
|
|
|
3.99 |
|
|
2018-2 Trust |
|
|
4.44 |
|
|
|
4.40 |
|
|
2019-1 Trust |
|
|
4.00 |
|
|
|
— |
|
|
2019-2 Trust |
|
|
3.44 |
|
|
|
— |
|
|
2019-3 Trust |
|
|
3.27 |
|
|
|
— |
|
F-23
The secured financing and warehouse facilities were utilized to finance the origination and purchase of commercial real estate mortgage loans. Warehouse facilities are designated to fund mortgage loans that are purchased and originated within specified underwriting guidelines. These lines of credit fund less than 100% of the principal balance of the mortgage loans originated and purchased, requiring the use of working capital to fund the remaining portion.
|
(a) |
Secured Financing, Net (Corporate Debt) |
On December 18, 2014, the Company entered into a five-year, $100.0 million corporate debt agreement with the owners of the Class C preferred units, pursuant to which the Company issued at par senior secured notes, the 2014 Senior Secured Notes, which matured on December 16, 2019. The notes bear interest at either 10% paid in cash or 11% paid in kind on June 15 and December 15 of each year. All principal and paid-in-kind interest were due at maturity. On August 29, 2019, the Company entered into a five-year $153.0 million corporate debt agreement with Owl Rock Capital Corporation, the “2019 Term Loans”. The 2019 Term Loans under this agreement bear interest at a rate equal to one-month LIBOR (with a LIBOR floor that is generally 1.0%) plus 7.50% and mature in August 2024. A portion of the net proceeds from the 2019 Term Loans was used to redeem the 2014 Senior Secured Notes for an aggregate amount of approximately $130.2 million, equal to the principal and accrued interest.
As of December 31, 2019, the balance of the 2019 Term Loans was $153.0 million. The balance in the consolidated Statements of Financial Condition is net of debt issuance costs of $7.4 million. The 2019 Term Loans are secured by substantially all assets of the Company not otherwise pledged under a securitization or warehouse facility and contain certain reporting and financial covenants effective December 31, 2019. Should the Company fail to adhere to those covenants or otherwise default under the notes, the lenders have the right to demand immediate repayment that may require the Company to sell the collateral at less than the carrying amounts. As of December 31, 2019, the Company was in compliance with these covenants.
|
(b) |
Warehouse Repurchase and Revolving Loan Facilities, Net |
The Barclays Repurchase Agreement was originally entered into on May 29, 2015 by and between VCC and Barclays Bank PLC and currently has an extended maturity date of August 3, 2020. The agreement is a short-term borrowing facility, collateralized by a pool of performing loans, with an initial maximum capacity of $250.0 million, and bears interest at one-month LIBOR plus a margin that ranges from 2.75% to 2.875%. All borrower payments on loans financed under the warehouse repurchase facility are first used to pay interest on the facility. All amounts in excess are returned to VCC. As of December 31, 2019 and 2018, the effective interest rates were 5.25% and 4.67%, respectively. The maximum capacity increased from $250.0 million to $300.0 million effective March 11, 2020.
The Citibank Repurchase Agreement was originally entered into on May 17, 2013 by and between VCC and Citibank, N.A. and has a current extended maturity date of August 3, 2020. The Agreement is a short-term borrowing facility, collateralized by a pool of mainly performing loans, with a maximum capacity of $200.0 million, and bears interest at one-month LIBOR plus 3.00%. All borrower payments on loans financed under the warehouse repurchase facility are first used to pay interest on the facility. All amounts in excess are returned to VCC. As of December 31, 2019 and 2018, the effective interest rates were 5.25% and 4.54%, respectively.
On September 12, 2018, the Company entered into a three-year secured revolving loan facility agreement with Pacific Western Bank. During the borrowing period, the Company can take loan advances from time to time subject to availability. Each loan advance bears interest at the lesser of the one-month LIBOR Rate plus 3.5% per annum and the maximum rate, which is the highest lawful and non-usurious rate of interest applicable to the loan. The maximum loan amount under this facility is $50 million.
On December 26, 2019, the Company entered into a $3.0 million loan agreement with Hershiser Capital Finance, the “HCF loan”. The HCF loan is secured by five real properties acquired by the Company through foreclosure or by deed-in lieu of foreclosure. The HCF loan bears a fixed interest rate of 9.5%, and matures the earlier of (i) January 1, 2021, and (ii) the date on which the unpaid principal balance of this loan becomes due and payable by acceleration or otherwise pursuant to the Loan Documents or the exercise by Lender of any right or remedy under any Loan Document. The maturity date of the HCF loans is subject to extension up to July 1, 2021.
F-24
Certain of the Company’s loans are pledged as security under the warehouse repurchase facilities and the revolving loan facility, which contain covenants. Should the Company fail to adhere to those covenants or otherwise default under the facilities, the lenders have the right to terminate the facilities and demand immediate repayment that may require the Company to sell the collateral at less than the carrying amounts. As of December 31, 2019 and 2018, the Company was in compliance with these covenants.
The following table summarizes the maximum borrowing capacity and current gross balances outstanding for the Company’s warehouse facilities and loan agreements as of December 31, 2019 and 2018 (in thousands):
|
|
|
2019 |
|
|
2018 |
|
||||||||||
|
|
|
Year end balance (1) |
|
|
Maximum borrowing capacity |
|
|
Year end balance (1) |
|
|
Maximum borrowing capacity |
|
||||
|
Barclays repurchase agreement |
|
$ |
226,212 |
|
|
$ |
250,000 |
|
|
$ |
94,659 |
|
|
$ |
250,000 |
|
|
Citibank repurchase agreement |
|
|
190,977 |
|
|
|
200,000 |
|
|
|
121,701 |
|
|
|
200,000.00 |
|
|
Pacific Western credit agreement |
|
|
2,499 |
|
|
|
50,000 |
|
|
|
365 |
|
|
|
50,000.00 |
|
|
Hershiser Capital Finance loan agreement |
|
|
3,000 |
|
|
|
3,000 |
|
|
|
— |
|
|
|
— |
|
|
(1) |
Warehouse repurchase facilities amounts in the consolidated Statements of Financial Condition are net of debt issuance costs amounting to $1.1 million and $0.8 million as of December 31, 2019 and 2018. |
The following table provides an overview of the activity and effective interest rate for the years ended December 31, 2019 and 2018 (dollars in thousands):
|
|
|
2019 |
|
|
2018 |
|
||
|
Warehouse repurchase facilities: |
|
|
|
|
|
|
|
|
|
Average outstanding balance |
|
$ |
240,608 |
|
|
$ |
177,081 |
|
|
Highest outstanding balance at any month-end |
|
|
422,688 |
|
|
|
319,630 |
|
|
Effective interest rate (1) |
|
|
5.64 |
% |
|
|
5.20 |
% |
|
(1) |
Represents interest expense divided by average gross outstanding balance and includes average rate (5.26%) and debt issue cost amortization (.38%) and average rate (4.61%) and debt issue cost amortization (0.59%) as of December 31, 2019 and 2018, respectively. |
The following table provides a summary of interest expense that includes debt issuance cost amortization, interest, amortization of discount, and deal cost amortization for the years ended December 31, 2019 and 2018 (in thousands):
|
|
|
2019 |
|
|
2018 |
|
||
|
Warehouse repurchase facilities |
|
$ |
13,583 |
|
|
$ |
9,213 |
|
|
Securitizations |
|
|
70,320 |
|
|
|
53,384 |
|
|
Interest expense — portfolio related |
|
|
83,903 |
|
|
|
62,597 |
|
|
Interest expense — corporate debt |
|
|
14,618 |
|
|
|
13,322 |
|
|
Total interest expense |
|
$ |
98,521 |
|
|
$ |
75,919 |
|
The Company files tax returns as prescribed by the tax laws of the jurisdictions in which it operates. In the normal course of business, the Company is subject to examination by federal, state, and local jurisdictions, where applicable. As of December 31, 2019, the tax years that remain subject to examination by the major tax jurisdictions under the statute of limitations are from the year 2015 forward (with limited exceptions). There are currently no examinations being conducted of the Company by the Internal Revenue Service or any other taxing authority.
F-25
Prior to January 1, 2018, the Company was treated as a partnership and was generally not subject to income taxes. The Company elected to be treated as a corporation, for tax purposes, effective January 1, 2018. As a result, the Company calculated its deferred tax balance as of January 1, 2018 and, per U.S. GAAP, recognized a deferred tax liability of $5.5 million with a corresponding increase to income tax expense in January 2018, the period in which the change was made. Deferred tax liability as of January 1, 2018 was previously reported at $2.6 million and had been revised to $5.5 million. The Company recorded approximately $7.8 million and $6.0 million of deferred tax assets for the years ended December 31, 2019 and 2018, respectively, resulting in a deferred tax assets of approximately $8.3 million and $0.5 million as of December 31, 2019 and 2018, respectively. Deferred tax assets as of December 31, 2018 was previously reported at $3.0 million and has been revised to $0.5 million.
The following table details the Company’s income tax expense (benefit) (in thousands):
|
|
|
December 31, |
|
|||||
|
|
2019 |
|
|
2018 (1) |
|
|||
|
Current income tax expense: |
|
|
|
|
|
|
|
|
|
Federal |
|
$ |
9,552 |
|
|
$ |
7,588 |
|
|
State |
|
|
6,317 |
|
|
|
4,547 |
|
|
Total current income tax expense |
|
$ |
15,869 |
|
|
$ |
12,135 |
|
|
Deferred income tax benefit: |
|
|
|
|
|
|
|
|
|
Federal |
|
$ |
(5,150 |
) |
|
$ |
(162 |
) |
|
State |
|
|
(2,613 |
) |
|
|
(355 |
) |
|
Total deferred income tax benefit |
|
$ |
(7,763 |
) |
|
$ |
(517 |
) |
|
|
|
|
|
|
|
|
|
|
|
Total income tax expense |
|
$ |
8,106 |
|
|
$ |
11,618 |
|
|
|
(1) |
Total income tax expense was previously reported as $8.7 million and has been revised to $11.6 million. |
The Company’s provision for deferred income taxes is primarily due to the difference between the U.S. income tax and U.S. GAAP treatment with respect to its REMIC securities. For tax purposes, the issuances are considered taxable sales; whereas, for U.S. GAAP purposes, the REMIC issuances are considered financings.
The following table contains a reconciliation of the Company’s provision for income taxes at statutory rates to the provision for income taxes at the effective tax rate as of December 31, 2019 and 2018:
|
|
|
December 31, |
|
|
|||||
|
|
2019 |
|
|
2018 (1) |
|
|
|||
|
Federal income tax provision at statutory rate |
|
|
21.0 |
|
% |
|
21.0 |
|
% |
|
State income taxes, net of federal tax benefit |
|
|
12.0 |
|
|
|
10.7 |
|
|
|
Income tax liability from establishing beginning deferred tax liability |
|
|
0.0 |
|
|
|
28.5 |
|
|
|
Permanent items |
|
|
0.2 |
|
|
|
0.2 |
|
|
|
Federal true-ups |
|
|
-0.9 |
|
|
|
— |
|
|
|
Tax Credits |
|
|
-0.4 |
|
|
|
— |
|
|
|
Effective tax rate |
|
|
31.9 |
|
% |
|
60.4 |
|
% |
|
|
(1) |
Effective tax rate was previously reported as 45.0% and has been revised to 60.4%. |
F-26
The tax effects of temporary differences that give rise to deferred tax assets and deferred tax liabilities as of December 31, 2019 and 2018 are presented below (in thousands):
|
|
|
December 31, |
|
|||||
|
|
|
2019 |
|
|
2018 (1) |
|
||
|
Deferred Tax Assets: |
|
|
|
|
|
|
|
|
|
REMIC book-tax basis difference |
|
$ |
14,908 |
|
|
$ |
7,635 |
|
|
Unrealized gain/loss cumulative adjustment |
|
|
2,610 |
|
|
|
735 |
|
|
Provision for loan loss |
|
|
725 |
|
|
|
517 |
|
|
Accrued vacation |
|
|
196 |
|
|
|
138 |
|
|
Deferred rent expense |
|
|
— |
|
|
|
63 |
|
|
Intangibles |
|
|
13 |
|
|
|
15 |
|
|
Lease liability |
|
|
2,044 |
|
|
|
— |
|
|
Gross deferred tax assets |
|
|
20,496 |
|
|
|
9,103 |
|
|
Deferred Tax Liabilities: |
|
|
|
|
|
|
|
|
|
Deferred origination costs |
|
|
(8,688 |
) |
|
|
(6,834 |
) |
|
Fixed assets |
|
|
(1,138 |
) |
|
|
(1,172 |
) |
|
Purchase pool market discount |
|
|
(600 |
) |
|
|
(496 |
) |
|
Deferred state tax |
|
|
200 |
|
|
|
(74 |
) |
|
REO |
|
|
(45 |
) |
|
|
(10 |
) |
|
Right-of-use assets |
|
|
(1,945 |
) |
|
|
— |
|
|
Gross deferred tax liabilities |
|
|
(12,216 |
) |
|
|
(8,586 |
) |
|
Total net deferred tax asset |
|
$ |
8,280 |
|
|
$ |
517 |
|
The Company had no valuation allowance as of December 31, 2019 and 2018. Based on the Company’s estimates of taxable income over the years in which the items giving rise to the deferred tax assets are deductible, management believes it is more likely than not the Company will realize the benefits of these deductible differences.
The Company and its subsidiaries file income tax returns in the U.S. federal jurisdiction, as well as the majority of states. The Company is no longer subject to U.S. tax examinations for years before 2016, and is no longer subject to state tax examinations for years before 2015.
The Company periodically reviews its income tax positions based on tax laws and regulations and financial reporting considerations, and records adjustments as appropriate. This review takes into consideration the status of current taxing authorities' examinations of the Company's tax returns, recent positions taken by the taxing authorities on similar transactions, if any, and the overall tax environment.
The Company had gross unrecognized tax benefits in the amounts of $3.6 million and $0 recorded as of December 31, 2019 and 2018, respectively. If recognized, the unrecognized tax benefit would reduce the 2019 annual effective tax rate by 7.7%. Interest and penalties on unrecognized tax benefits is reported by the Company as a component of tax expense. As of December 31, 2019 and 2018, the accrued interest and penalties related to unrecognized tax benefits is $1.0 million and $0, respectively.
There are no positions for which it is reasonably possible that the total amounts of unrecognized tax benefits will significantly increase or decrease within 12 months of the reporting date.
F-27
Detailed below is a reconciliation of the Company's gross unrecognized tax benefits for the years ended December 31, 2019 and 2018, respectively:
|
|
|
December 31, |
|
|||||
|
|
|
2019 |
|
|
2018 |
|
||
|
Beginning balance |
|
$ |
- |
|
|
$ |
- |
|
|
Changes for tax positions of current year |
|
|
1,855 |
|
|
|
- |
|
|
Changes for tax positions of prior year |
|
|
1,704 |
|
|
|
- |
|
|
Ending balance |
|
$ |
3,559 |
|
|
$ |
- |
|
Note 15 — Class C Preferred Units
Class C preferred units were issued on December 18, 2014 by the Company bearing a liquidation preference return equal to seven percent (7%) per annum of the Class C base amount of $20 million plus cumulative quarterly returns paid in kind. The Class C return accrues and is payable in arrears in kind quarterly on the last day of each fiscal quarter of each fiscal year and on any date on which a distribution is paid. Each Class C member has the right to convert their Class C preferred units into Class A units without the payment of additional consideration. Prior to December 19, 2016, the Class C preferred units were included in equity. As a result of the issuance of a put option in December 2016, the Company reassessed the revised characteristics of the Class C preferred units and determined the units were more akin to mezzanine equity and reclassified preferred C balances from equity to Class C preferred units on the consolidated statements of financial condition. In connection with the 2019 Term Loans, the Company repurchased all outstanding Class C preferred units for an aggregate purchase price equal to the Class C liquidation preference of approximately $27.7 million on August 29, 2019.
Note 16 — Members’ Equity
VF has the authority to issue four types of membership units, Class A, Class B, Class C, and Class D units. The Class A units represent ownership interests in VF. Class B units are profit interest units, which represent a right to share, with the Class A units, in the distribution of profits earned by VF. The Class C and Class D units are preferred units, which have the right to convert to Class A units in VF. The outstanding Class A, Class B and Class D units and equity balance are as follows (in thousands):
|
|
|
2019 |
|
|
2018 (1) |
|
||
|
Class A units issued and outstanding |
|
|
97,514 |
|
|
|
97,514 |
|
|
Class A equity balance |
|
$ |
92,650 |
|
|
$ |
76,606 |
|
|
Class B units issued and outstanding |
|
|
16,072 |
|
|
|
16,072 |
|
|
Class B equity balance |
|
$ |
— |
|
|
$ |
— |
|
|
Class D units issued and outstanding |
|
|
60,194 |
|
|
|
60,194 |
|
|
Class D equity balance |
|
$ |
60,194 |
|
|
$ |
60,194 |
|
|
|
(1) |
Class A equity balance was previously reported at $79.5 million and has been revised to $77.0 million. |
See note (15) on Class C preferred units.
Class A units are issued when capital contributions are made to the Company in the form of cash. Class B units have been issued as part of the Velocity Financial, LLC 2012 Equity Incentive Plan (formerly, Velocity Commercial Capital, LLC 2007 Equity Incentive Plan) (the Plan) and are subordinate to the Class A units for purposes of distribution preferences. The Class B units are not entitled to receive profit distributions until all Class A, C, and D unit holders have received the stated value of their equity. Therefore, the value of the Class B units as of December 31, 2019 and 2018 was zero.
As of December 31, 2019 and 2018, the majority owner owned approximately 95 million Class A units representing an ownership interest of approximately 97.4% of the Class A units. Representatives of the majority owner held five of nine seats on the Company’s board of managers. All Class A units were converted to common stock upon completion of the Company’s IPO on January 22, 2020.
F-28
Class B units vest over a three-year period. Under the Plan, approximately 16.1 million Class B units were authorized for grant. As of December 31, 2019 and 2018, there were 16.1 million units issued and outstanding. The following table summarizes the activity in Class B units as of December 31, 2019 and 2018 and the years then ended (in thousands):
|
|
|
2019 |
|
|
2018 |
|
||
|
Beginning balance |
|
|
16,072 |
|
|
|
16,072 |
|
|
Awards granted |
|
|
— |
|
|
|
— |
|
|
Awards canceled |
|
|
— |
|
|
|
— |
|
|
Ending balance |
|
|
16,072 |
|
|
|
16,072 |
|
|
Vested units |
|
|
13,406 |
|
|
|
10,741 |
|
Class B units are last in the waterfall for distributions and profit sharing upon liquidation. As the value of the Class B units awarded is zero, no share-based compensation expenses have been recognized in the consolidated statements of income for the years ended December 31, 2019 and 2018. All Class B units were converted at zero value upon completion of the Company’s IPO on January 22, 2020.
The Company issued 60 million Class D preferred units at one dollar per share on December 19, 2016. On March 6, 2017, the Company issued an aggregate of 193,989 Class D preferred units at one dollar per unit to two investors. The Class D preferred units earn a return equal to sixteen percent (16%) per annum of the Class D Base Amount (purchase price amount plus cumulative quarterly returns paid in kind) with respect to such member’s Class D preferred units until December 19, 2019 and, from and after such date, an amount equal to fifteen percent (15%) per annum of the Class D Base Amount. The Class D return accrues and is payable in arrears in kind quarterly on the last day of each fiscal quarter of each fiscal year and on any date on which a distribution is paid. For the years ended December 31, 2019 and 2018, the Class D returns paid in kind were $14.1 million and $12.0 million, respectively. Each Class D member has the right to convert their Class D preferred units into Class A units without the payment of additional consideration. The Company also has the right to require Class D members to convert all of each Class D member’s preferred units into Class A units in connection with, and upon consummation of, an IPO. As of December 31, 2019 and 2018, each Class D preferred unit is convertible into a number of Class A units at a conversion price of $0.876971 per Class D preferred unit. Certain corporate matters and business decisions require the consent of the Class D unit holders. As of December 31, 2019 and 2018, representatives of Class D members held two of nine seats on the Company’s board of managers. The Class D Units liquidation preference amount was $96.9 million and $82.8 million as of December 31, 2019 and 2018, respectively. All Class D units were converted to common stock upon completion of the Company’s IPO on January 22, 2020.
Note 17 — Concentration of Risk
The Company originates and purchases loans secured by a broad spectrum of commercial property throughout the United States. As of December 31, 2019 and 2018, geographic and property type concentrations of loans, by unpaid principal balance, were as follows:
|
|
|
2019 |
|
|
2018 |
|
|
||
|
Geographic concentration: |
|
|
|
|
|
|
|
|
|
|
New York |
|
|
22.4 |
|
% |
|
25.0 |
|
% |
|
California |
|
|
22.6 |
|
|
|
22.2 |
|
|
|
Florida |
|
|
11.7 |
|
|
|
10.6 |
|
|
|
New Jersey |
|
|
8.1 |
|
|
|
8.5 |
|
|
|
Other states (individually less than 5.0%) |
|
|
35.2 |
|
|
|
33.7 |
|
|
|
|
|
|
100.0 |
|
% |
|
100.0 |
|
% |
F-29
|
|
|
2019 |
|
|
2018 |
|
|
||
|
Property type concentration: |
|
|
|
|
|
|
|
|
|
|
Investor 1-4 |
|
|
52.2 |
|
% |
|
49.7 |
|
% |
|
Mixed use |
|
|
12.2 |
|
|
|
12.5 |
|
|
|
Multifamily |
|
|
9.6 |
|
|
|
7.1 |
|
|
|
Retail |
|
|
8.7 |
|
|
|
9.2 |
|
|
|
Office |
|
|
5.7 |
|
|
|
5.6 |
|
|
|
Warehouse |
|
|
— |
|
|
|
5.1 |
|
|
|
Other (individually less than 5.0%) |
|
|
11.6 |
|
|
|
10.8 |
|
|
|
|
|
|
100.0 |
|
% |
|
100.0 |
|
% |
As of December 31, 2019 and 2018, the Company held $13.1 million and $7.2 million, respectively, of real estate owned, net, with geographic concentrations as follows:
|
|
|
2019 |
|
|
2018 |
|
|
||
|
Geographic concentration: |
|
|
|
|
|
|
|
|
|
|
Maryland |
|
|
30.7 |
|
% |
|
53.0 |
|
% |
|
Connecticut |
|
|
25.3 |
|
|
|
— |
|
|
|
Arizona |
|
|
16.7 |
|
|
|
— |
|
|
|
New York |
|
|
5.2 |
|
|
|
— |
|
|
|
California |
|
|
— |
|
|
|
21.8 |
|
|
|
New Jersey |
|
|
5.1 |
|
|
|
— |
|
|
|
Georgia |
|
|
— |
|
|
|
8.8 |
|
|
|
Other states (individually less than 5.0%) |
|
|
17.0 |
|
|
|
16.4 |
|
|
|
|
|
|
100.0 |
|
% |
|
100.0 |
|
% |
Note 18 — Commitments and Contingencies
|
(a) |
Repurchase Liability |
When the Company sells loans, it is required to make normal and customary representations and warranties about the loans to the purchaser. The loan sale agreements generally require the Company to repurchase loans if the Company breaches a representation or warranty given to the loan purchaser. In addition, the Company may be required to repurchase loans as a result of borrower fraud or if a payment default occurs on a loan shortly after its sale.
The Company records a repurchase liability relating to representations and warranties and early payment defaults. The method used to estimate the liability for repurchase is a function of the representations and warranties given and considers a combination of factors, including, but not limited to, estimated future defaults and loan repurchase rates and the potential severity of loss in the event of defaults. The Company establishes a liability at the time loans are sold and continually update the estimated repurchase liability. The level of the repurchase liability for representations and warranties and early payment default requires considerable management judgment.
The Company regularly evaluates the adequacy of repurchase reserves based on trends in repurchase, actual loss experience, estimated future loss exposure and other relevant factors including economic conditions. During the years ended December 31, 2019 and 2018, the Company repurchased $12.9 million and $3.9 million of loans and reversed approximately $407 thousand and $145 thousand of accrued interest income and gains recognized upon sale, respectively. The Company believes its reserve balance of $76 thousand and $68 thousand as of December 31, 2019 and 2018 was sufficient to cover future loss exposure associated with repurchase contingencies.
F-30
The Company is a party to various legal proceedings in the normal course of business. The Company, after consultation with legal counsel, believes the disposition of all pending litigation will not have a material effect on the Company’s consolidated financial condition or results of operations.
Note 19 — Retirement Plan
The Company maintains a qualified 401(k) retirement plan in accordance with the Internal Revenue Service code. Employees meeting certain eligibility requirements as detailed in the plan document may participate by deferring eligible compensation into the plan. The plan allows for discretionary employer matching contribution. For the years ended December 31, 2019, 2018 and 2017, the Company expensed $366 thousand, $367 thousand and $121 thousand, respectively.
Note 20 — Other Operating Expenses
The following table presents the components of other operating expenses for the years ended December 31, 2018, 2017 and 2016 (in thousands):
|
|
|
2019 |
|
|
2018 |
|
|
2017 |
|
|||
|
Travel, marketing and business development |
|
$ |
1,307 |
|
|
$ |
1,052 |
|
|
$ |
899 |
|
|
Data processing and telecommunications |
|
|
2,094 |
|
|
|
1,704 |
|
|
|
854 |
|
|
Office expenses |
|
|
1,891 |
|
|
|
1,896 |
|
|
|
1,559 |
|
|
Insurance, taxes, and licenses |
|
|
470 |
|
|
|
376 |
|
|
|
397 |
|
|
Other |
|
|
219 |
|
|
|
285 |
|
|
|
237 |
|
|
Total other operating expenses |
|
$ |
5,981 |
|
|
$ |
5,313 |
|
|
$ |
3,946 |
|
Note 21 — Related Party Transactions
In the ordinary course of business, the Company sells held for sale loans to various financial institutions. From time to time, the Company sells held for sale loans to an affiliate of a Class D preferred unit holder.
In 2014, we entered into a five-year, $100.0 million corporate debt agreement with the owners of our Class C preferred units, pursuant to which we issued at par senior secured notes that mature on December 16, 2019. The senior secured notes bear interest, at our election, at either 10% annually paid in cash or 11% annually paid in kind. As of December 31, 2018, including paid-in- kind interests, the senior secured notes balance was $127.6 million, and is presented within secured financing, net on the consolidated Statements of Financial Condition. On August 29, 2019, the Company entered into a five-year $153.0 million corporate debt agreement, the 2019 Term Loans, with Owl Rock Capital Corporation, an independent party. A portion of the net proceeds from the 2019 Term Loans was used to redeem the 2014 Senior Secured Notes for an aggregate amount of approximately $130.2 million, equal to the principal and accrued interest.
F-31
Note 22 — Fair Value Measurements
|
(a) |
Fair Value Determination |
ASC Topic 820, “Fair Value Measurement,” defines fair value, establishes a framework for measuring fair value including a three-level valuation hierarchy, and expands disclosures about fair value measurements. Fair value is defined as the exchange price that would be received to sell an asset or paid to transfer a liability in an orderly transaction between market participants at the measurement date reflecting assumptions that a market participant would use when pricing an asset or liability. The hierarchy uses three levels of inputs to measure the fair value of assets and liabilities as follows:
|
|
• |
Level 1 - Valuation is based on quoted prices for identical instruments traded in active markets. |
|
|
• |
Level 2 - Valuation is based on quoted prices for similar instruments in active markets; quoted prices for identical or similar instruments in markets that are not active; and model-derived valuations whose inputs are observable and can be corroborated by market data. |
|
|
• |
Level 3 - Valuation is based on significant unobservable inputs for determining the fair value of assets or liabilities. These significant unobservable inputs reflect assumptions that market participants may use in pricing the assets or liabilities. |
Given the nature of some of the Company’s assets and liabilities, clearly determinable market-based valuation inputs are often not available; therefore, these assets and liabilities are valued using internal estimates. As subjectivity exists with respect to the valuation estimates used, the fair values disclosed may not equal prices that can ultimately be realized if the assets are sold or the liabilities are settled with third parties.
Below is a description of the valuation methods for the assets and liabilities recorded at fair value on either a recurring or nonrecurring basis and for estimating fair value of financial instruments not recorded at fair value for disclosure purposes. While management believes the valuation methods are appropriate and consistent with other market participants, the use of different methodologies or assumptions to determine the fair value of certain financial instruments could result in a different estimate of fair value at the measurement date.
|
(b) |
Cash and Cash Equivalents and Restricted Cash |
Cash and restricted cash are recorded at historical cost. The carrying amount is a reasonable estimate of fair value as these instruments have short-term maturities and interest rates that approximate market, a Level 1 measurement.
|
(c) |
Loans Held for Investment |
Loans held for investment are recorded at their outstanding principal balance, net of purchase discounts, deferred loan origination fees/costs, and allowance for loan losses.
The Company determined the fair value estimate of loans held for investment using a cash flow model incorporating the latest securitization execution prices as a proxy, a Level 3 measurement. The significant unobservable inputs used in the fair value measurement of the Company’s mortgage loans held for investment are interest rates, prepayment speeds, loss severity, and default rates. Significant changes in any of those inputs could result in a significant change to the loans’ fair value measurement.
|
(d) |
Impaired Loans |
Nonaccrual loans held for investment are considered impaired and are measured and recorded at fair value on a nonrecurring basis. Impaired loans are reviewed individually for the amount of impairment, if any. To the extent a loan is collateral dependent, the Company measures such impairment based on the estimated fair value of the underlying collateral. The fair value of each loan’s collateral is generally based on appraisals or broker price opinions obtained, less estimated costs to sell, a Level 3 measurement.
F-32
Loans held for sale are carried at the lower of cost or fair value, with fair value adjustments recorded on a nonrecurring basis. The Company uses a discounted cash flow model to estimate the fair value of loans held for sale, a Level 3 measurement.
|
(f) |
Interest-Only Strips |
The Company retains an interest-only strip on certain sales of held for sale loans. The interest-only strips are classified as trading securities under FASB ASC Topic 320, Investments-Debt Securities. The interest-only strips are measured based on their estimated fair values using a discounted cash flow model, a Level 3 measurement. Changes in fair value are reflected in income as they occur.
|
(g) |
Loans Held for Investment, at Fair Value |
The Company has elected to account for certain purchased distressed loans held for investment, at fair value (the FVO Loans) using FASB ASC Topic 825, Financial Instruments (ASC 825). The FVO loans are measured based on their estimated fair values. Management identified all of these loans to be accounted for at estimated fair value at the instrument level. Changes in fair value are reflected in income as they occur.
The Company uses a modified discounted cash flow model to estimate the fair value at instrument level, a Level 3 measurement. The significant unobservable inputs used in the fair value measurement of the Company’s mortgage loans held for investment, at fair value are discount rate, property values, prepayment speeds, loss severity, and default rates. Significant changes in any of those inputs in isolation could result in a significant change to the loans’ fair value measurement.
|
(h) |
Real Estate Owned, Net (REO) |
Real estate owned, net is initially recorded at the property’s estimated fair value, based on appraisals or broker price opinions obtained, less estimated costs to sell, at the acquisition date, a Level 3 measurement. From time to time, nonrecurring fair value adjustments are made to real estate owned, net based on the current updated appraised value of the property, or management’s judgment and estimation of value based on recent market trends or negotiated sales prices with potential buyers.
|
(i) |
Secured Financing, Net (Corporate Debt) |
The Company determined the fair values estimate of the secured financing using the estimated cash flows discounted at an appropriate market rate, a Level 3 measurement.
|
(j) |
Warehouse Repurchase Facilities, Net |
Warehouse repurchase facilities are recorded at historical cost. The carrying amount is a reasonable estimate of fair value as these instruments have short-term maturities of one-year or less and interest rates that approximate market plus a spread, a Level 2 measurement.
|
(k) |
Securitizations, Net |
The fair value estimate of securities issued is determined by using estimated cash flows discounted at an appropriate market rate, a Level 3 measurement.
|
(l) |
Accrued Interest Receivable and Accrued Interest Payable |
The carrying amounts of accrued interest receivable and accrued interest payable approximate fair value due to the short-term nature of these instruments, a Level 1 measurement.
The Company does not have any off-balance sheet financial instruments.
F-33
The following tables present information on assets measured and recorded at fair value as of December 31, 2019 and 2018, by level, in the fair value hierarchy (in thousands):
|
|
|
Fair value measurements using |
|
|
Total at |
|
||||||||||
|
December 31, 2019 |
|
Level 1 |
|
|
Level 2 |
|
|
Level 3 |
|
|
fair value |
|
||||
|
Recurring fair value measurements: |
|
|
|
|
|
|
|
|
|
|
|
|
|
|
|
|
|
Loans held for investment, at fair value |
|
$ |
— |
|
|
$ |
— |
|
|
$ |
2,960 |
|
|
$ |
2,960 |
|
|
Interest-only strips |
|
|
— |
|
|
|
— |
|
|
|
894 |
|
|
|
894 |
|
|
Total recurring fair value measurements |
|
|
— |
|
|
|
— |
|
|
|
3,854 |
|
|
|
3,854 |
|
|
Nonrecurring fair value measurements: |
|
|
|
|
|
|
|
|
|
|
|
|
|
|
|
|
|
Loans held for sale, net |
|
|
— |
|
|
|
— |
|
|
|
214,467 |
|
|
|
214,467 |
|
|
Real estate owned, net |
|
|
— |
|
|
|
— |
|
|
|
13,068 |
|
|
|
13,068 |
|
|
Impaired loans requiring specific allowance, net |
|
|
— |
|
|
|
— |
|
|
|
11,373 |
|
|
|
11,373 |
|
|
Total nonrecurring fair value measurements |
|
|
— |
|
|
|
— |
|
|
|
238,908 |
|
|
|
238,908 |
|
|
Total assets |
|
$ |
— |
|
|
$ |
— |
|
|
$ |
242,762 |
|
|
$ |
242,762 |
|
|
|
|
Fair value measurements using |
|
|
Total at |
|
||||||||||
|
December 31, 2018 |
|
Level 1 |
|
|
Level 2 |
|
|
Level 3 |
|
|
fair value |
|
||||
|
Recurring fair value measurements: |
|
|
|
|
|
|
|
|
|
|
|
|
|
|
|
|
|
Loans held for investment, at fair value |
|
$ |
— |
|
|
$ |
— |
|
|
$ |
3,463 |
|
|
$ |
3,463 |
|
|
Interest-only strips |
|
|
— |
|
|
|
— |
|
|
|
812 |
|
|
|
812 |
|
|
Total recurring fair value measurements |
|
|
— |
|
|
|
— |
|
|
|
4,275 |
|
|
|
4,275 |
|
|
Nonrecurring fair value measurements: |
|
|
|
|
|
|
|
|
|
|
|
|
|
|
|
|
|
Loans held for sale, net |
|
|
— |
|
|
|
— |
|
|
|
78,446 |
|
|
|
78,446 |
|
|
Real estate owned, net |
|
|
— |
|
|
|
— |
|
|
|
7,167 |
|
|
|
7,167 |
|
|
Impaired loans requiring specific allowance, net |
|
|
— |
|
|
|
— |
|
|
|
5,647 |
|
|
|
5,647 |
|
|
Total nonrecurring fair value measurements |
|
|
— |
|
|
|
— |
|
|
|
91,260 |
|
|
|
91,260 |
|
|
Total assets |
|
$ |
— |
|
|
$ |
— |
|
|
$ |
95,535 |
|
|
$ |
95,535 |
|
The following table presents losses recognized on assets measured on a nonrecurring basis for the years indicated (in thousands):
|
Gain (loss) on assets measured on a nonrecurring basis |
|
2019 |
|
|
2018 |
|
|
2017 |
|
|||
|
Loans held for sale, net |
|
$ |
(224 |
) |
|
$ |
(174 |
) |
|
$ |
(102 |
) |
|
Real estate held for sale, net |
|
|
(1,631 |
) |
|
|
(888 |
) |
|
|
(211 |
) |
|
Impaired loans requiring specific allowance, net |
|
|
(277 |
) |
|
|
99 |
|
|
|
18 |
|
|
Total net loss |
|
$ |
(2,132 |
) |
|
$ |
(963 |
) |
|
$ |
(295 |
) |
F-34
The following tables present the primary valuation techniques and unobservable inputs related to Level 3 assets as of December 31, 2019 and 2018 (dollars in thousands):
|
|
|
December 31, 2019 |
|
|||||||||||||
|
Asset category |
|
Fair value |
|
|
Primary valuation technique |
|
Unobservable input |
|
Range |
|
|
Weighted average |
|
|||
|
Collateral dependent impaired loans requiring specific allowance, net |
|
$ |
11,373 |
|
|
Market comparables |
|
Selling costs |
|
8.0% |
|
|
8.0% |
|
||
|
Real estate owned, net |
|
|
13,068 |
|
|
Market comparables |
|
Selling costs |
|
8.0% |
|
|
8.0% |
|
||
|
Loans held for investment, at fair value |
|
|
2,960 |
|
|
Discounted cash flow |
|
Discount rate |
|
10.5% |
|
|
10.5% |
|
||
|
|
|
|
|
|
|
|
|
Collateral value (% of UPB) |
|
18.0% to 94.0% |
|
|
87.0% |
|
||
|
|
|
|
|
|
|
|
|
Timing of resolution/payoff (months) |
|
5 to 218 |
|
|
|
65.0 |
|
|
|
|
|
|
|
|
|
|
|
Prepayment rate |
|
15.0% |
|
|
15.0% |
|
||
|
|
|
|
|
|
|
|
|
Default rate |
|
1.0% |
|
|
1.0% |
|
||
|
|
|
|
|
|
|
|
|
Loss severity rate |
|
10.0% |
|
|
10.0% |
|
||
|
Loans held for sale |
|
|
— |
|
|
Discounted cash flow |
|
Discount rate |
|
12.0% to 15.0% |
|
|
14.7% |
|
||
|
|
|
|
|
|
|
|
|
Timing of resolution/payoff (months) |
|
0 to 12 |
|
|
|
7.0 |
|
|
|
|
|
|
|
|
|
|
|
|
|
|
|
|
|
|
|
|
|
Interest-only strips |
|
|
894 |
|
|
Discounted cash flow |
|
Discount rate |
|
15% |
|
|
15% |
|
||
|
|
|
|
|
|
|
|
|
Timing of resolution/payoff (months) |
|
0 to 7.0 |
|
|
|
2.1 |
|
|
F-35
|
|
|
December 31, 2018 |
|
|||||||||||||
|
Asset category |
|
Fair value |
|
|
Primary valuation technique |
|
Unobservable input |
|
Range |
|
|
Weighted average |
|
|||
|
Collateral dependent impaired loans requiring specific allowance, net |
|
$ |
5,647 |
|
|
Market comparables |
|
Selling costs |
|
8% |
|
|
8% |
|
||
|
Real estate owned, net |
|
|
7,167 |
|
|
Market |
|
|
|
|
|
|
|
|
|
|
|
|
|
|
|
|
|
comparables |
|
Selling costs |
|
8% |
|
|
8% |
|
||
|
Loans held for investment, at fair value |
|
|
3,463 |
|
|
Discounted |
|
|
|
|
|
|
|
|
|
|
|
|
|
|
|
|
|
cash flow |
|
Discount rate |
|
10.5% |
|
|
10.5% |
|
||
|
|
|
|
|
|
|
|
|
Collateral value (% of |
|
|
|
|
|
|
|
|
|
|
|
|
|
|
|
|
|
UPB) |
|
-40% to 100% |
|
|
86% |
|
||
|
|
|
|
|
|
|
|
|
Timing of resolution/payoff (months) |
|
|
|
|
|
|
|
|
|
|
|
|
|
|
|
|
|
|
|
1 to 230 |
|
|
64.2 |
|
||
|
|
|
|
|
|
|
|
|
Prepayment rate |
|
20% |
|
|
20% |
|
||
|
|
|
|
|
|
|
|
|
Default rate |
|
1% |
|
|
1% |
|
||
|
|
|
|
|
|
|
|
|
Loss severity rate |
|
10% |
|
|
10% |
|
||
|
Interest-only strips |
|
|
812 |
|
|
Discounted cash flow |
|
Discount rate |
|
15% |
|
|
15% |
|
||
|
|
|
|
|
|
|
|
|
Timing of resolution/payoff (months) |
|
|
|
|
|
|
|
|
|
|
|
|
|
|
|
|
|
|
|
1 to 12 |
|
|
8.4 |
|
||
The following is a rollforward of loans that are measured at estimated fair value on a recurring basis for the years indicated (in thousands):
|
|
|
December 31, |
|
|||||||||
|
|
|
2019 |
|
|
2018 |
|
|
2017 |
|
|||
|
Beginning balance |
|
$ |
3,463 |
|
|
$ |
4,632 |
|
|
$ |
7,278 |
|
|
Loans liquidated |
|
|
(421 |
) |
|
|
(895 |
) |
|
|
(2,506 |
) |
|
Principal paydowns |
|
|
(73 |
) |
|
|
(515 |
) |
|
|
(179 |
) |
|
Total unrealized (loss) gain included in net income |
|
|
(9 |
) |
|
|
241 |
|
|
|
39 |
|
|
Ending balance |
|
$ |
2,960 |
|
|
$ |
3,463 |
|
|
$ |
4,632 |
|
The following is a rollforward of interest-only strips that are measured at estimated fair value on a recurring basis for the years indicated (in thousands):
|
|
|
December 31, |
|
|||||||||
|
|
|
2019 |
|
|
2018 |
|
|
2017 |
|
|||
|
Beginning balance |
|
$ |
812 |
|
|
$ |
369 |
|
|
$ |
— |
|
|
Interest-only strip additions |
|
|
2,495 |
|
|
|
1,314 |
|
|
|
499 |
|
|
Interest-only strip write-offs |
|
|
(2,202 |
) |
|
|
(97 |
) |
|
|
(25 |
) |
|
Total unrealized loss included in net income |
|
|
(211 |
) |
|
|
(774 |
) |
|
|
(105 |
) |
|
Ending balance |
|
$ |
894 |
|
|
$ |
812 |
|
|
$ |
369 |
|
F-36
The Company estimates the fair value of certain financial instruments on a quarterly basis. These instruments are recorded at fair value through the use of a valuation allowance only if they are impaired. As described above, these adjustments to fair value usually result from the application of lower of cost or fair value accounting or write-downs of individual assets. As of December 31, 2019 and 2018, the only financial assets measured at fair value were certain impaired loans held for investment, loans held for sale, interest-only strips, REO and FVO loans, which were measured using unobservable inputs, including appraisals and broker price opinions on the values of the underlying collateral. Impaired loans were carried at approximately $11.4 million and $5.6 million as of December 31, 2019 and 2018, net of specific allowance for loan losses of approximately $0.9 million and $0.6 million, respectively.
A financial instrument is cash, evidence of an ownership interest in an entity, or a contract that creates a contractual obligation or right to deliver or receive cash or another financial instrument from a second entity on potentially favorable terms. The methods and assumptions used in estimating the fair values of the Company’s financial instruments are described above.
The following tables present carrying amounts and estimated fair values of certain financial instruments as of the dates indicated (in thousands):
|
|
|
December 31, 2019 |
|
|||||||||||||||||
|
|
|
Carrying |
|
|
|
|
|
|
|
|
|
|
|
|
|
|
Estimated |
|
||
|
Asset category |
|
Value |
|
|
Level 1 |
|
|
Level 2 |
|
|
Level 3 |
|
|
Fair Value |
|
|||||
|
Assets: |
|
|
|
|||||||||||||||||
|
Cash |
|
$ |
21,465 |
|
|
$ |
21,465 |
|
|
$ |
— |
|
|
$ |
— |
|
|
$ |
21,465 |
|
|
Restricted cash |
|
|
6,087 |
|
|
|
6,087 |
|
|
|
— |
|
|
|
— |
|
|
|
6,087 |
|
|
Loans held for sale, net |
|
|
214,467 |
|
|
|
— |
|
|
|
— |
|
|
|
222,260 |
|
|
|
222,260 |
|
|
Loans held for investment, net |
|
|
1,863,360 |
|
|
|
— |
|
|
|
— |
|
|
|
1,913,481 |
|
|
|
1,913,481 |
|
|
Loans held for investment, at fair value |
|
|
2,960 |
|
|
|
— |
|
|
|
— |
|
|
|
2,960 |
|
|
|
2,960 |
|
|
Accrued interest receivable |
|
|
13,295 |
|
|
|
13,295 |
|
|
|
— |
|
|
|
— |
|
|
|
13,295 |
|
|
Real estate owned, net |
|
|
13,068 |
|
|
|
— |
|
|
|
— |
|
|
|
13,068 |
|
|
|
13,068 |
|
|
Interest-only strips |
|
894 |
|
|
|
— |
|
|
|
— |
|
|
894 |
|
|
894 |
|
|||
|
|
|
|
|
|
|
|
|
|
|
|
|
|
|
|
|
|
|
|
|
|
|
Liabilities: |
|
|
|
|
|
|
|
|
|
|
|
|
|
|
|
|
|
|
|
|
|
Secured financing, net |
|
$ |
145,599 |
|
|
$ |
— |
|
|
$ |
— |
|
|
$ |
153,000 |
|
|
$ |
153,000 |
|
|
Warehouse repurchase facilities, net |
|
|
421,548 |
|
|
|
— |
|
|
|
422,687 |
|
|
|
— |
|
|
|
422,687 |
|
|
Securitizations, net |
|
|
1,438,629 |
|
|
|
— |
|
|
|
— |
|
|
|
1,486,990 |
|
|
|
1,486,990 |
|
|
Accrued interest payable |
|
|
7,190 |
|
|
|
7,190 |
|
|
|
— |
|
|
|
— |
|
|
|
7,190 |
|
|
|
|
December 31, 2018 |
|
|||||||||||||||||
|
|
|
Carrying |
|
|
|
|
|
|
|
|
|
|
|
|
|
|
Estimated |
|
||
|
Asset category |
|
Value |
|
|
Level 1 |
|
|
Level 2 |
|
|
Level 3 |
|
|
Fair Value |
|
|||||
|
Assets: |
|
|
|
|||||||||||||||||
|
Cash |
|
$ |
15,008 |
|
|
$ |
15,008 |
|
|
$ |
— |
|
|
$ |
— |
|
|
$ |
15,008 |
|
|
Restricted cash |
|
|
1,669 |
|
|
|
1,669 |
|
|
|
— |
|
|
|
— |
|
|
|
1,669 |
|
|
Loans held for sale, net |
|
|
78,446 |
|
|
|
— |
|
|
|
— |
|
|
|
79,335 |
|
|
|
79,335 |
|
|
Loans held for investment, net |
|
|
1,567,408 |
|
|
|
— |
|
|
|
— |
|
|
|
1,609,860 |
|
|
|
1,609,860 |
|
|
Loans held for investment, at fair value |
|
|
3,463 |
|
|
|
— |
|
|
|
— |
|
|
|
3,463 |
|
|
|
3,463 |
|
|
Accrued interest receivable |
|
|
10,096 |
|
|
|
10,096 |
|
|
|
— |
|
|
|
— |
|
|
|
10,096 |
|
|
|
|
|
|
|
|
|
|
|
|
|
|
|
|
|
|
|
|
|
|
|
|
Liabilities: |
|
|
|
|
|
|
|
|
|
|
|
|
|
|
|
|
|
|
|
|
|
Secured financing, net |
|
$ |
127,040 |
|
|
$ |
— |
|
|
$ |
— |
|
|
$ |
122,631 |
|
|
$ |
122,631 |
|
|
Warehouse repurchase facilities, net |
|
|
215,931 |
|
|
|
— |
|
|
|
215,931 |
|
|
|
— |
|
|
|
215,931 |
|
|
Securitizations, net |
|
|
1,202,202 |
|
|
|
— |
|
|
|
— |
|
|
|
1,222,677 |
|
|
|
1,222,677 |
|
|
Accrued interest payable |
|
|
5,651 |
|
|
|
5,651 |
|
|
|
— |
|
|
|
— |
|
|
|
5,651 |
|
F-37
Note 23 — Select Quarterly Financial Data (Unaudited)
The following tables set forth our unaudited quarterly results for the periods indicated:
|
|
|
Three Months Ended |
|
|||||||||||||||||||||||||||||
|
|
|
December 31, 2019 |
|
|
September 30, 2019 |
|
|
June 30, 2019 |
|
|
March 31, 2019 |
|
|
December 31, 2018 |
|
|
September 30, 2018 |
|
|
June 30, 2018 |
|
|
March 31, 2018 |
|
||||||||
|
|
|
(in thousands) |
|
|||||||||||||||||||||||||||||
|
Interest income |
|
$ |
44,124 |
|
|
$ |
40,379 |
|
|
$ |
36,884 |
|
|
$ |
36,143 |
|
|
$ |
33,560 |
|
|
$ |
32,207 |
|
|
$ |
30,297 |
|
|
$ |
28,659 |
|
|
Interest expense - portfolio related |
|
|
22,689 |
|
|
|
21,827 |
|
|
|
20,324 |
|
|
|
19,062 |
|
|
|
17,807 |
|
|
|
16,428 |
|
|
|
14,671 |
|
|
|
13,692 |
|
|
Net interest income - portfolio related |
|
|
21,435 |
|
|
|
18,552 |
|
|
|
16,560 |
|
|
|
17,081 |
|
|
|
15,753 |
|
|
|
15,779 |
|
|
|
15,626 |
|
|
|
14,967 |
|
|
Interest expense - corporate debt |
|
|
4,070 |
|
|
|
3,842 |
|
|
|
3,353 |
|
|
|
3,353 |
|
|
|
3,337 |
|
|
|
3,328 |
|
|
|
3,328 |
|
|
|
3,328 |
|
|
Net interest income |
|
|
17,365 |
|
|
|
14,710 |
|
|
|
13,207 |
|
|
|
13,728 |
|
|
|
12,416 |
|
|
|
12,451 |
|
|
|
12,298 |
|
|
|
11,639 |
|
|
Provision for (reversal of) loan losses |
|
|
242 |
|
|
|
338 |
|
|
|
212 |
|
|
|
348 |
|
|
|
221 |
|
|
|
213 |
|
|
|
(269 |
) |
|
|
36 |
|
|
Net interest income after provision for loan losses |
|
|
17,123 |
|
|
|
14,372 |
|
|
|
12,995 |
|
|
|
13,380 |
|
|
|
12,195 |
|
|
|
12,238 |
|
|
|
12,567 |
|
|
|
11,603 |
|
|
Other operating income (expense) |
|
|
833 |
|
|
|
(212 |
) |
|
|
308 |
|
|
|
1,721 |
|
|
|
90 |
|
|
|
1,174 |
|
|
|
815 |
|
|
|
728 |
|
|
Operating expenses |
|
|
9,814 |
|
|
|
8,484 |
|
|
|
8,324 |
|
|
|
8,500 |
|
|
|
8,871 |
|
|
|
8,566 |
|
|
|
7,409 |
|
|
|
7,315 |
|
|
Income before income taxes |
|
|
8,142 |
|
|
|
5,676 |
|
|
|
4,979 |
|
|
|
6,601 |
|
|
|
3,414 |
|
|
|
4,846 |
|
|
|
5,973 |
|
|
|
5,016 |
|
|
Income tax expense |
|
|
2,960 |
|
|
|
1,796 |
|
|
|
1,444 |
|
|
|
1,906 |
|
|
|
1,475 |
|
|
|
1,528 |
|
|
|
1,653 |
|
|
|
6,962 |
|
|
Net income |
|
$ |
5,182 |
|
|
$ |
3,880 |
|
|
$ |
3,535 |
|
|
$ |
4,695 |
|
|
$ |
1,939 |
|
|
$ |
3,318 |
|
|
$ |
4,320 |
|
|
$ |
(1,946 |
) |
Note 24 — Subsequent Events
Conversion and Initial Public Offering
On January 16, 2020, Velocity Financial, LLC converted from a Delaware limited liability company to a Delaware corporation and changed its name to Velocity Financial, Inc. The Conversion was accounted for in accordance with ASC 805-50 –Business Combinations, as a transaction between entities under common control. All assets and liabilities of Velocity Financial, LLC were contributed to Velocity Financial, Inc. at their carrying value. The Conversion had no impact on the Company’s provision for income taxes or its deferred tax assets and liabilities. Upon completion of the Conversion, Velocity Financial, LLC’s Class A equity units of 97,513,533 and Class D equity units of 60,193,989 were converted to 11,749,994 shares of Velocity Financial, Inc. common stock. On January 22, 2020, the Company completed its initial public offering of 7,250,000 shares of common stock at a price to the public of $13.00 per share. On January 28, 2020, the Company completed the sale of an additional 1,087,500 shares of our common stock, representing the full exercise of the underwriters’ option to purchase additional shares, at a public offering price of $13.00 per share. The Company’s stock trades on The New York Stock Exchange under the symbol “VEL”. An aggregate of $75.7 million of proceeds from the IPO was used to paydown $75.0 million in principal amount on the 2019 Term Loans plus $0.7 million in accrued and unpaid interest and prepayment premium.
Securitization
The Company completed the securitization of $261.9 million of investor real estate loans on February 10, 2020 which is accounted for as secured borrowings.
COVID-19
As a result of the spread of the COVID-19 coronavirus, economic uncertainties have arisen which are likely to negatively impact the Company’s financial condition, results of operations and cash flows. The extent of the impact of COVID-19 on the Company’s operational and financial performance will depend on certain developments, including the duration and spread of the outbreak and impact on its customers, employees and vendors, all of which are uncertain and cannot be predicted. The extent to which COVID-19 may impact the Company’s financial condition or results of operations cannot be reasonably estimated at this time.
F-38
April 2020 Preferred Stock and Warrants
On April 5, 2020, the Company issued and sold in a private placement 45,000 newly issued shares of Series A Convertible Preferred Stock, par value $0.01 per share (the “Preferred”), at a price per share of $1,000, plus warrants (the “Warrants”) to purchase an aggregate of 3,013,125 shares of the Company’s common stock to funds affiliated with Snow Phipps and a fund affiliated with Pacific Investment Management Company LLC (TOBI). This offering resulted in gross proceeds to the Company of $45.0 million, before expenses payable by the Company of approximately $1.0 million. The Company intends to use the net proceeds from this private placement to pay down its existing warehouse repurchase facilities and for general corporate purposes. In connection with these transactions, the Company entered into a securities purchase agreement with Snow Phipps and TOBI granting TOBI the right to nominate an additional director to the Company’s board of directors for so long as TOBI and its permitted transferees meet certain ownership thresholds.
The Preferred Stock ranks senior to the Company’s common stock with respect to the payment of dividends and distribution of assets upon liquidation, dissolution and winding up. It is entitled to receive any dividends or distributions paid in respect of the common stock on an as-converted basis and has no stated maturity and will remain outstanding indefinitely unless converted into common stock or repurchased by the Company. Holders of the Preferred Stock will be entitled to vote, together with the holders of common stock, on an as-converted basis, subject to limitations of the rules of the New York Stock Exchange, on all matters submitted to a vote of the holders of common stock, and as a separate class as required by law. The holders of the Preferred Stock will also have the right to elect two directors to the board of directors of the Company if the Company defaults under its obligation to repurchase Preferred Stock.
The Preferred Stock has a liquidation preference equal to the greater of (i) $2,000 per share from April 7, 2020 through October 7, 2022, which amount increases ratably to $3,000 per share from October 8, 2022 through November 28, 2024 and to $3,000 per share from and after November 28, 2024 and (ii) the amount such holder would have received if the Preferred Stock had converted into common stock immediately prior to such liquidation.
At any time following receipt of the requisite approval by the holders of the Company’s common stock, the Preferred Stock is convertible at the option of the holder into the number of shares of common stock equal to then applicable conversion rate plus cash in lieu of fractional shares, if any. The initial conversion price is $3.85 per share of common stock and is subject to customary antidilution adjustments. In addition, the Company has the right to cause the Preferred Stock to convert beginning October 7, 2021 if the Company’s common stock meets certain weighted average price targets.
Beginning on October 7, 2022, if permitted by the terms of the Company’s material indebtedness, and in no event later than November 28, 2024, holders of the Preferred Stock have the option to cause the Company to repurchase all or a portion of such holder’s shares of Preferred Stock, for an amount in cash equal to such share’s liquidation preference. If the Company defaults on its repurchase obligation, the holders of the Preferred Stock have the right (until the repurchase price has been paid in full, in cash, or such the Preferred Stock has been converted) to force a sale of the Company and the holders of the Preferred Stock will have the right to elect two directors of the Company’s Board until such default is cured. The Company is also required to redeem the Preferred Stock upon a change of control (as defined in the certificate of designation governing the Preferred Stock).
The Warrants are exercisable at the warrantholder’s option at any time and from time to time, in whole or in part, until April 7, 2025 at an exercise price of $2.96 per share of common stock, with respect to 2,008,750 of the Warrants, and at an exercise price of $4.94 per share of common stock, with respect to 1,004,375 of the Warrants. The exercise price and the number of shares of common stock issuable upon exercise of the Warrants are subject to customary antidilution adjustments and certain issuances of common stock (or securities convertible into or exercisable for common stock) at a price (or having a conversion or exercise price) that is less than the then current exercise price. The Company is not required to effect an exercise of Warrants, if after giving effect to the issuance of common stock upon exercise of such Warrants such warrantholder together with its affiliates would beneficially own 49% or more of the Company’s outstanding common stock.
F-39
Amendments to Warehouse Repurchase Facilities
On April 6, 2020, VCC entered into amendments to the Barclays Repurchase Agreement and the Citibank Repurchase Agreement with the lenders under such agreements. Pursuant to the terms of the amendments, (i) the Company must maintain unrestricted cash and cash equivalents of at least $7.5 million, (ii) VCC must make aggregate payments of $20.0 million to reduce VCC’s obligations under the warehouse repurchase agreements at Closing, and (iii) VCC must ensure that payments of at least $3.0 million per month are made to each lender, from the cash flow of the underlying financed loans and/or corporate cash each month from April 6 through August 3, 2020, in reduction of its obligations thereunder. In addition, the interest rate under each warehouse repurchase facility was increased by 25 basis points.
The Company has evaluated events that have occurred subsequent to December 31, 2019 and has concluded there are no other subsequent events that would require recognition in the accompanying consolidated financial statements.
F-40
Pursuant to the requirements of Section 13 or 15(d) of the Securities Exchange Act of 1934, the registrant has duly caused this report to be signed on its behalf by the undersigned, thereunto duly authorized.
|
|
VELOCITY FINANCIAL, INC. |
|
|
|
|
|
|
|
|
|
|
Date: April 7, 2020 |
By: |
/s/ Christopher D. Farrar |
|
|
Name: |
Christopher D. Farrar |
|
|
Title: |
Chief Executive Officer |
KNOW ALL BY THESE PRESENTS, that each person whose signature appears below hereby constitutes and appoints Christopher D. Farrar and Mark R. Szczepaniak and each of them, his or her true and lawful agent, proxy and attorney-in-fact, with full power of substitution and resubstitution, for him or her and in his or her name, place and stead, in any and all capacities, to sign any and all amendments to this Annual Report on Form 10-K, and to file the same, with all exhibits thereto, and other documents in connection therewith, with the Securities and Exchange Commission, granting unto said attorneys-in-fact and agents, and each of them, full power and authority to do and perform each and every act and thing requisite and necessary to be done in connection therewith, as fully to all intents and purposes as he or she might or could do in person, hereby ratifying and confirming all that said attorneys-in-fact and agents, or any of them, or their or his substitutes, may lawfully do or cause to be done by virtue thereof.
Pursuant to the requirements of the Securities Exchange Act of 1934, this report has been signed below by the following persons on behalf of the registrant and in the capacities and on the dates indicated.
|
Signature |
|
Title |
|
|
|
|
|
/s/ Christopher D. Farrar |
|
Chief Executive Officer and Director |
|
Christopher D. Farrar |
|
(Principal Executive Officer) |
|
|
|
|
|
/s/ Mark R. Szczepaniak |
|
Chief Financial Officer |
|
Mark R. Szczepaniak |
|
(Principal Financial Officer) |
|
|
|
|
|
/s/ Christopher J. Oltmann |
|
Chief Accounting Officer |
|
Christopher J. Oltmann |
|
(Principal Accounting Officer) |
|
|
|
|
|
/s/ Alan H. Mantel |
|
Chairman of the Board of Directors |
|
Alan H. Mantel |
|
|
|
|
|
|
|
/s/ Daniel J. Ballen |
|
Director |
|
Daniel J. Ballen |
|
|
|
|
|
|
|
/s/ John P. Pitstick |
|
Director |
|
John P. Pitstick |
|
|
|
|
|
|
|
/s/ John A. Pless |
|
Director |
|
John A. Pless |
|
|
|
|
|
|
|
/s/ Joy L. Schaefer |
|
Director |
|
Joy L. Schaefer |
|
|
98