Attached files
| file | filename |
|---|---|
| EX-99.2 - EX-99.2 - Quorum Health Corp | d913653dex992.htm |
| EX-99.1 - EX-99.1 - Quorum Health Corp | d913653dex991.htm |
| EX-10.2 - EX-10.2 - Quorum Health Corp | d913653dex102.htm |
| EX-10.1 - EX-10.1 - Quorum Health Corp | d913653dex101.htm |
| 8-K - FORM 8-K - Quorum Health Corp | d913653d8k.htm |
Exhibit 99.3
Pr oject Quincy MNPI Packet April 6, 2020
These materials have been prepared for the creditors (the “Creditors”) to Quorum Health Corporation (the “Company”) to whom such materials are directly addressed and delivered and may not be used of relied upon for any purpose other than as specifically contemplated by a written agreement. These materials are based on information provided by or on behalf of the Company and/or other potential transaction participants, from public sources or otherwise reviewed by us. We assume no responsibility for independent investigation or verification of such information (including, without limitation, data from third party suppliers) and have relied on such information being complete and accurate in all material respects. To the extent such information includes estimates and forecasts of future financial performance prepared by or reviewed with the management of the Company and/or other potential transaction participants or obtained from public sources, we have assumed that such estimates and forecasts have been reasonably prepared on bases reflecting the best currently available estimates and judgments of such management (or, with respect to estimates and forecasts obtained from public sources, represent reasonable estimates). No representation or warranty, express or implied, is made as to the accuracy or completeness of such information and nothing contained herein is, or shall be relied upon as, a representation, whether as to the past, the present or the future. These materials were designed for use by specific persons familiar with the business and affairs of the Company and are being furnished. These materials are not intended to provide the sole basis for evaluating, and should not be considered a recommendation with respect to, any transaction or other matter. These materials do not constitute an offer or solicitation to sell or purchase any securities and are not a commitment by us (or any affiliates) to provide or arrange any financing for any transaction or to purchase any security in connection therewith. We assume no obligation to update or otherwise revise these materials. These materials may not reflect information known to other professionals in other business areas. We do not provide legal, tax or accounting advice. Accordingly, any statements contained herein as to tax matters were neither written nor intended by us to be used and cannot be used by any taxpayer for the purpose of avoiding tax penalties that may be imposed on such taxpayer. Each person should seek legal, accounting and tax advice based on his, her or its particular circumstances from independent advisors’ regarding the impact of the transactions of matters described herein.
Cautionary Note Regarding Forward-Looking Statements The Company cautions that statements within these materials contain forward-looking statements within the meaning of Section 27A of the Securities Act and Section 21E of the Exchange Act. All statements, other than statements of historical facts, included in this filing that address activities, events or developments that the Company expects, believes, targets or anticipates will or may occur in the future are forward-looking statements. The Company’s actual results may differ materially from those anticipated in these forward-looking statements as a result of certain risks and other factors, which could include the following: risks and uncertainties relating to the Chapter 11 Cases, including but not limited to, the Company’s ability to obtain Bankruptcy Court approval with respect to motions in the Chapter 11 Cases; the effects of the Chapter 11 Cases on the Company and on the interests of various constituents; the length of time the Company will operate under the Chapter 11 Cases; the potential adverse effects of the Chapter 11 Cases on the Company’s liquidity or results of operations and increased legal and other professional costs necessary to execute the Company’s financial restructuring; the conditions to which the Company’s debtor-in-possession financing is subject and the risk that these conditions may not be satisfied for various reasons, including for reasons outside of the Company’s control; the Company’s trading price and the volatility of the Company’s common stock and the effects of the Chapter 11 Cases on the Company’s continued listing on the New York Stock Exchange; and the effects and the length of the 2019 novel coronavirus (COVID-19) pandemic as well as other risk factors set forth in the Company’s Annual Report on Form 10-K, Quarterly Reports on Form 10-Q and Current Reports on Form 8-K (including any amendments to those reports) filed with the Securities and Exchange Commission. The Company therefore cautions readers against relying on these forward-looking statements. All forward-looking statements attributable to the Company or persons acting on the Company’s behalf are expressly qualified in their entirety by the foregoing cautionary statements. All such statements speak only as of the date made, and, except as required by law, the Company undertakes no obligation to update or revise publicly any forward-looking statements, whether as a result of new information, future events or otherwise.
1. Fourth Quarter 2019 Results
Fourth Quarter Summary Fourth quarter same-facility net revenues were $387.5 million and Same-facility Adjusted EBITDA was $35.0 million. Q4 results were negatively impacted by a $13.2 million increase in bad debt expense compared to Q4 2018, which offset increases in both rate and acuity. Same facility adjusted admissions declined 1.6% year-over-year while net revenue per adjusted admission increased 0.5%. The decline in adjusted admissions is primarily driven by service line closures in 2019. Q4 results include an estimated $11 million unfavorable impact from aging patient accounts receivable dating to before the transition to R1 RCM on October 1, 2019, as well as a decline in self-pay patient payments. Year-to-date, the estimated impact from deteriorating revenue cycle management is approximately $25 million.
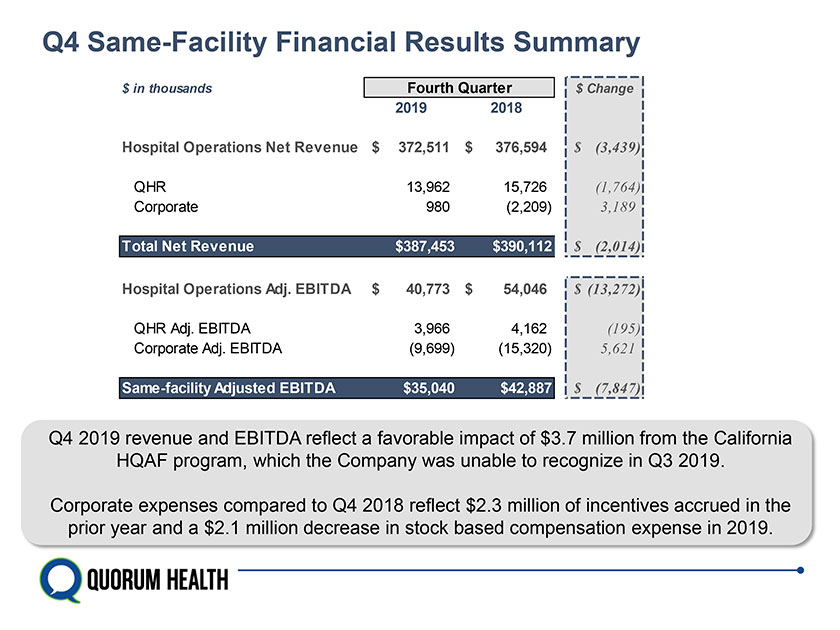
Q4 Same-Facility Financial Results Summary $ in thousands Fourth Quarter $ Change 2019 2018 Hospital Operations Net Revenue $ 372,511 $ 376,594 $ (3,439) QHR 13,962 15,726 (1,764) Corporate 980 (2,209) 3,189 Total Net Revenue $387,453 $390,112 $ (2,014) Hospital Operations Adj. EBITDA $ 40,773 $ 54,046 $ (13,272) QHR Adj. EBITDA 3,966 4,162 (195) Corporate Adj. EBITDA (9,699) (15,320) 5,621 Same-facility Adjusted EBITDA $35,040 $42,887 $ (7,847) Q4 2019 revenue and EBITDA reflect a favorable impact of $3.7 million from the California HQAF program, which the Company was unable to recognize in Q3 2019. Corporate expenses compared to Q4 2018 reflect $2.3 million of incentives accrued in the prior year and a $2.1 million decrease in stock based compensation expense in 2019.
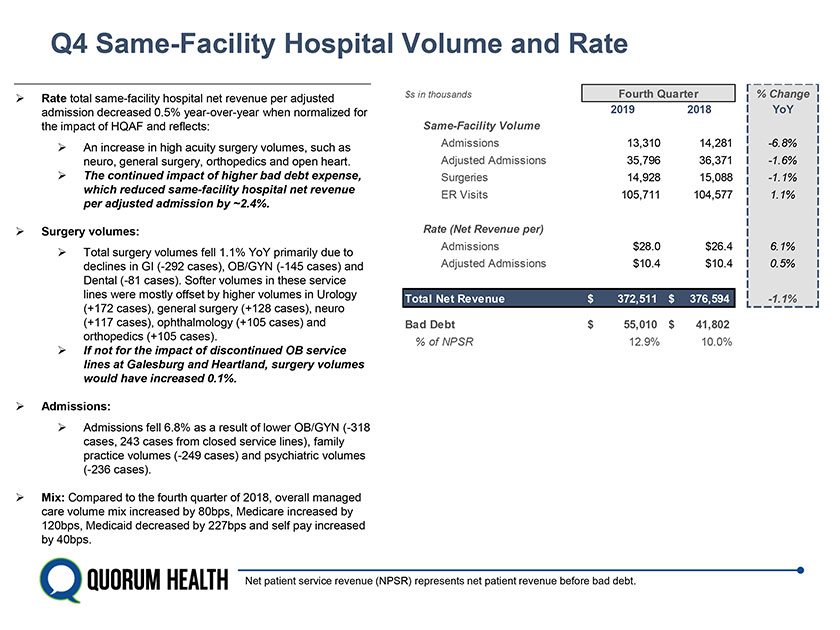
Q4 Same-Facility Hospital Volume and Rate Rate total same-facility hospital net revenue per adjusted admission decreased 0.5% year-over-year when normalized for the impact of HQAF and reflects: An increase in high acuity surgery volumes, such as neuro, general surgery, orthopedics and open heart. The continued impact of higher bad debt expense, which reduced same-facility hospital net revenue per adjusted admission by ~2.4%. Surgery volumes: Total surgery volumes fell 1.1% YoY primarily due to declines in GI (-292 cases), OB/GYN (-145 cases) and Dental (-81 cases). Softer volumes in these service lines were mostly offset by higher volumes in Urology (+172 cases), general surgery (+128 cases), neuro (+117 cases), ophthalmology (+105 cases) and orthopedics (+105 cases). If not for the impact of discontinued OB service lines at Galesburg and Heartland, surgery volumes would have increased 0.1%. Admissions: Admissions fell 6.8% as a result of lower OB/GYN (-318 cases, 243 cases from closed service lines), family practice volumes (-249 cases) and psychiatric volumes (-236 cases). Mix: Compared to the fourth quarter of 2018, overall managed care volume mix increased by 80bps, Medicare increased by 120bps, Medicaid decreased by 227bps and self pay increased by 40bps. $s in thousands Fourth Quarter % Change 2019 2018 YoY Same-Facility Volume Admissions 13,310 14,281 -6.8% Adjusted Admissions 35,796 36,371 -1.6% Surgeries 14,928 15,088 -1.1% ER Visits 105,711 104,577 1.1% Rate (Net Revenue per) Admissions $28.0 $26.4 6.1% Adjusted Admissions $10.4 $10.4 0.5% Total Net Revenue $ 372,511 $ 376,594 -1.1% Bad Debt $ 55,010 $ 41,802 % of NPSR 12.9% 10.0% Net patient service revenue (NPSR) represents net patient revenue before bad debt.
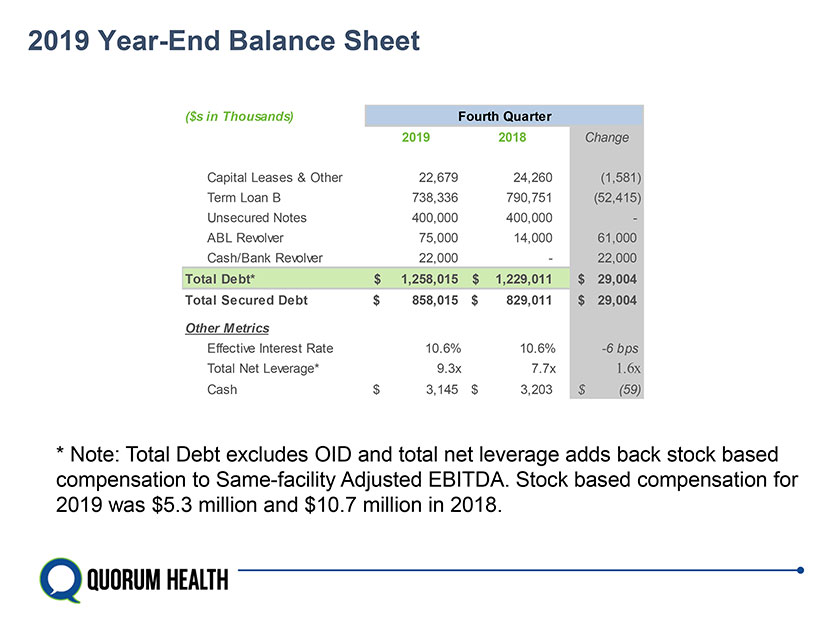
2019 Year-End Balance Sheet ($s in Thousands) Fourth Quarter 2019 2018 Change Capital Leases & Other 22,679 24,260 (1,581) Term Loan B 738,336 790,751 (52,415) Unsecured Notes 400,000 400,000 - ABL Revolver 75,000 14,000 61,000 Cash/Bank Revolver 22,000 - 22,000 Total Debt* $ 1,258,015 $ 1,229,011 $ 29,004 Total Secured Debt $ 858,015 $ 829,011 $ 29,004 Other Metrics Effective Interest Rate 10.6% 10.6% -6 bps Total Net Leverage* 9.3x 7.7x 1.6x Cash $ 3,145 $ 3,203 $ (59) * Note: Total Debt excludes OID and total net leverage adds back stock based compensation to Same-facility Adjusted EBITDA. Stock based compensation for 2019 was $5.3 million and $10.7 million in 2018.

2. January 2020 Results
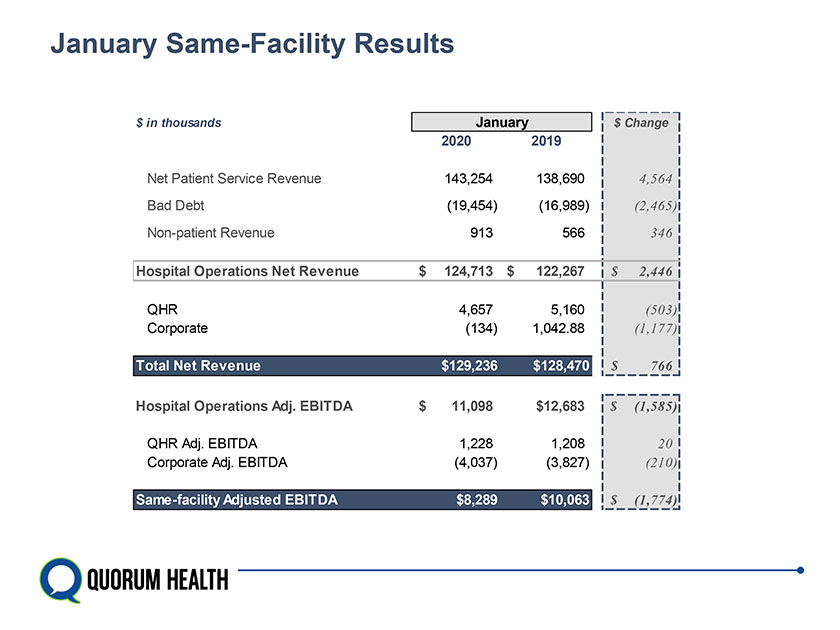
January Same-Facility Results $ in thousands January $ Change 2020 2019 Net Patient Service Revenue 143,254 138,690 4,564 Bad Debt (19,454) (16,989) (2,465) Non-patient Revenue 913 566 346 Hospital Operations Net Revenue $ 124,713 $ 122,267 $ 2,446 QHR 4,657 5,160 (503) Corporate (134) 1,042.88 (1,177) Total Net Revenue $129,236 $128,470 $ 766 Hospital Operations Adj. EBITDA $ 11,098 $12,683 $ (1,585) QHR Adj. EBITDA 1,228 1,208 20 Corporate Adj. EBITDA (4,037) (3,827) (210) Same-facility Adjusted EBITDA $8,289 $10,063 $ (1,774)
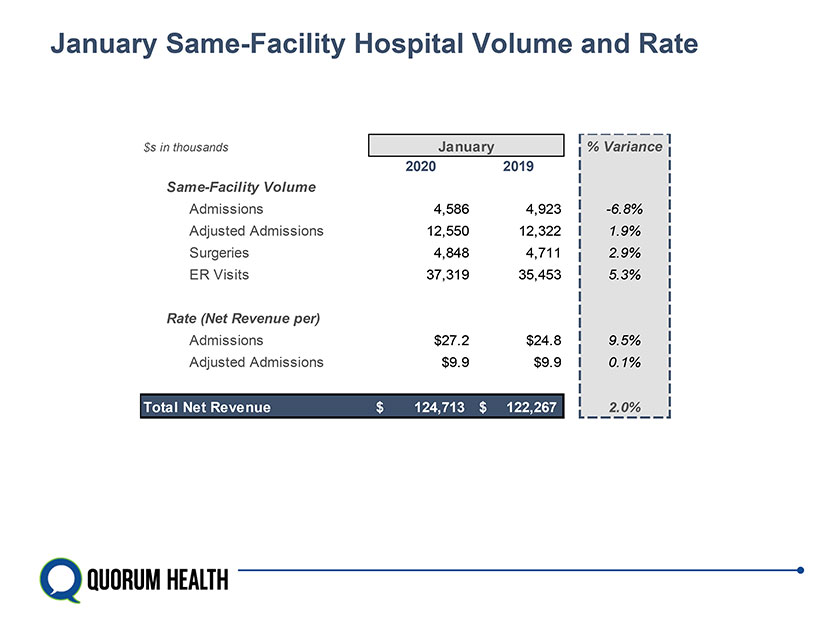
January Same-Facility Hospital Volume and Rate $s in thousands January % Variance 2020 2019 Same-Facility Volume Admissions 4,586 4,923 -6.8% Adjusted Admissions 12,550 12,322 1.9% Surgeries 4,848 4,711 2.9% ER Visits 37,319 35,453 5.3% Rate (Net Revenue per) Admissions $27.2 $24.8 9.5% Adjusted Admissions $9.9 $9.9 0.1% Total Net Revenue $ 124,713 $ 122,267 2.0%
3. February 2020 Results
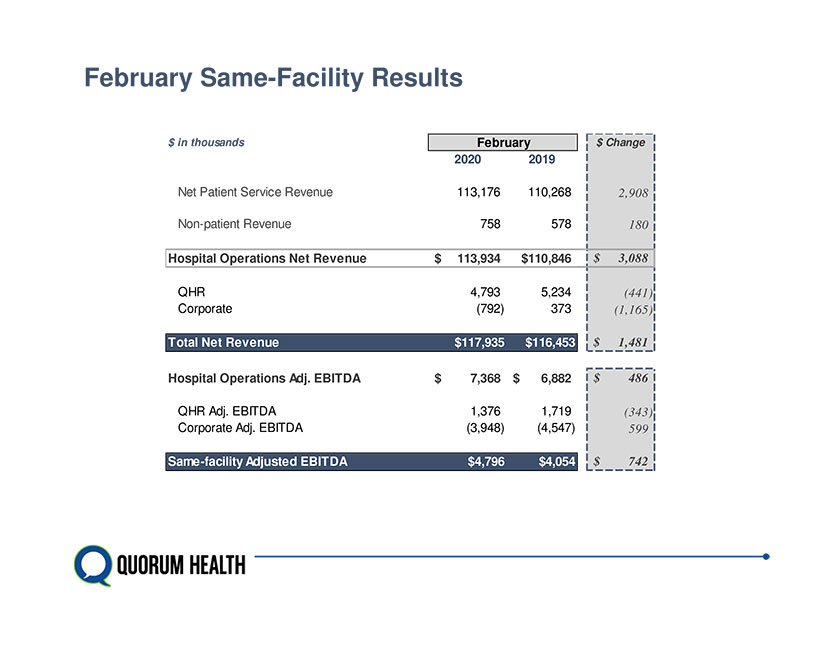
February Same-Facility Results $ in thousands February $ Change 2020 2019 Net Patient Service Revenue 113,176 110,268 2,908 Non-patient Revenue 758 578 180 Hospital Operations Net Revenue $ 113,934 $110,846 $ 3,088 QHR 4,793 5,234 (441) Corporate (792) 373 (1,165) Total Net Revenue $117,935 $116,453 $ 1,481 Hospital Operations Adj. EBITDA $ 7,368 $ 6,882 $ 486 QHR Adj. EBITDA 1,376 1,719 (343) Corporate Adj. EBITDA (3,948) (4,547) 599 Same-facility Adjusted EBITDA $4,796 $4,054 $ 742
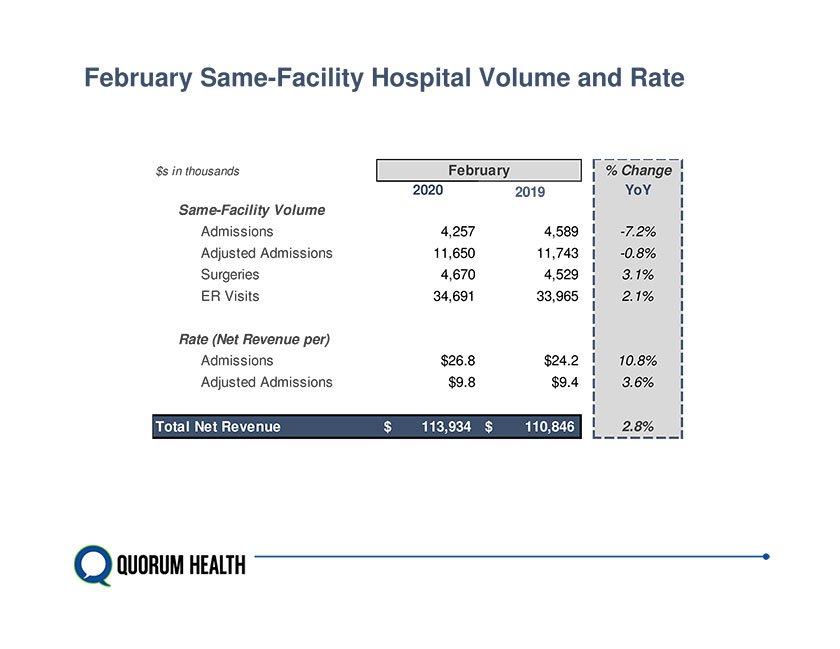
February Same-Facility Hospital Volume and Rate $s in thousands February % Change 2020 2019 YoY Same-Facility Volume Admissions 4,257 4,589 -7.2% Adjusted Admissions 11,650 11,743 -0.8% Surgeries 4,670 4,529 3.1% ER Visits 34,691 33,965 2.1% Rate (Net Revenue per) Admissions $26.8 $24.2 10.8% Adjusted Admissions $9.8 $9.4 3.6% Total Net Revenue $ 113,934 $ 110,846 2.8%

4. COVID-19 Discussion Materials
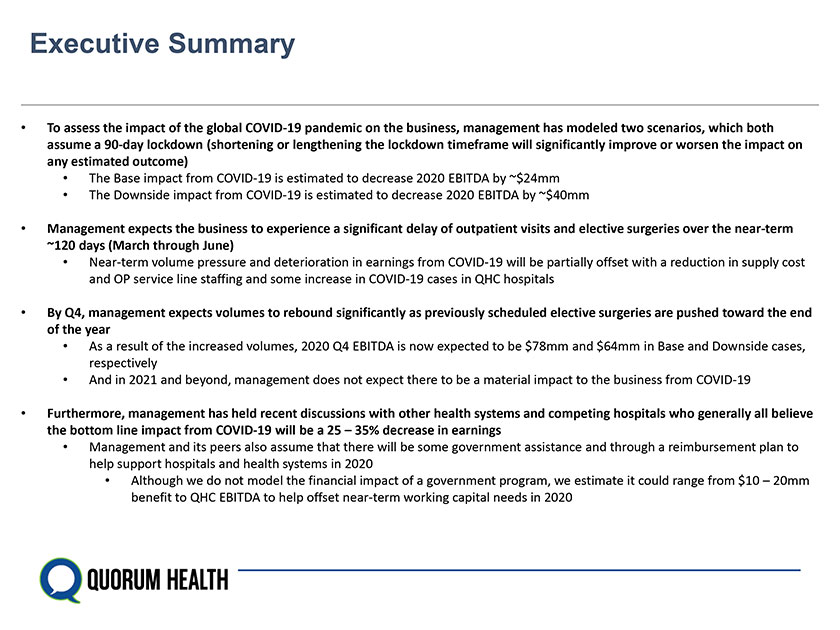
Executive Summary To assess the impact of the global COVID-19 pandemic on the business, management has modeled two scenarios, which both assume a 90-day lockdown (shortening or lengthening the lockdown timeframe will significantly improve or worsen the impact on any estimated outcome) The Base impact from COVID-19 is estimated to decrease 2020 EBITDA by ~$24mm The Downside impact from COVID-19 is estimated to decrease 2020 EBITDA by ~$40mm Management expects the business to experience a significant delay of outpatient visits and elective surgeries over the near-term ~120 days (March through June) Near-term volume pressure and deterioration in earnings from COVID-19 will be partially offset with a reduction in supply cost and OP service line staffing and some increase in COVID-19 cases in QHC hospitals By Q4, management expects volumes to rebound significantly as previously scheduled elective surgeries are pushed toward the end of the year As a result of the increased volumes, 2020 Q4 EBITDA is now expected to be $78mm and $64mm in Base and Downside cases, respectively And in 2021 and beyond, management does not expect there to be a material impact to the business from COVID-19 Furthermore, management has held recent discussions with other health systems and competing hospitals who generally all believe the bottom line impact from COVID-19 will be a 25 – 35% decrease in earnings Management and its peers also assume that there will be some government assistance and through a reimbursement plan to help support hospitals and health systems in 2020 Although we do not model the financial impact of a government program, we estimate it could range from $10 – 20mm benefit to QHC EBITDA to help offset near-term working capital needs in 2020
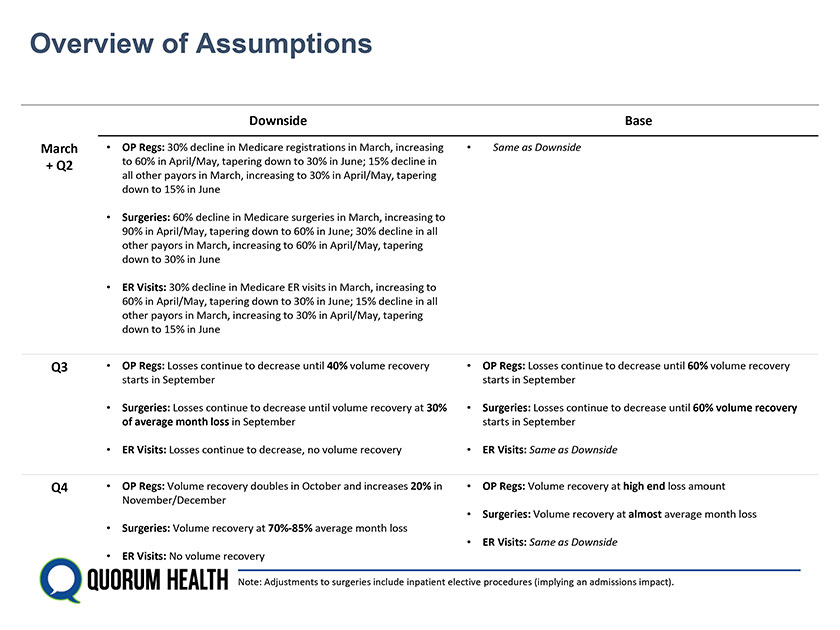
Overview of Assumptions Downside Base March OP Regs: 30% decline in Medicare registrations in March, increasing Same as Downside + Q2 to 60% in April/May, tapering down to 30% in June; 15% decline in all other payors in March, increasing to 30% in April/May, tapering down to 15% in June Surgeries: 60% decline in Medicare surgeries in March, increasing to 90% in April/May, tapering down to 60% in June; 30% decline in all other payors in March, increasing to 60% in April/May, tapering down to 30% in June ER Visits: 30% decline in Medicare ER visits in March, increasing to 60% in April/May, tapering down to 30% in June; 15% decline in all other payors in March, increasing to 30% in April/May, tapering down to 15% in June Q3 OP Regs: Losses continue to decrease until 40% volume recovery OP Regs: Losses continue to decrease until 60% volume recovery starts in September starts in September Surgeries: Losses continue to decrease until volume recovery at 30% Surgeries: Losses continue to decrease until 60% volume recovery of average month loss in September starts in September ER Visits: Losses continue to decrease, no volume recovery ER Visits: Same as Downside Q4 OP Regs: Volume recovery doubles in October and increases 20% in OP Regs: Volume recovery at high end loss amount November/December Surgeries: Volume recovery at almost average month loss Surgeries: Volume recovery at 70%-85% average month loss ER Visits: Same as Downside ER Visits: No volume recovery Note: Adjustments to surgeries include inpatient elective procedures (implying an admissions impact).
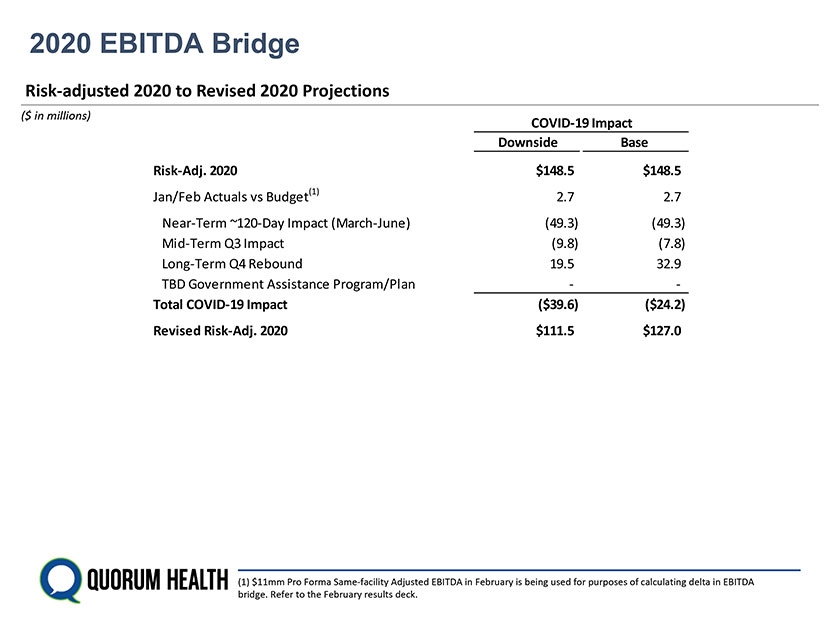
2020 EBITDA Bridge Risk-adjusted 2020 to Revised 2020 Projections ($ in millions) COVID-19 Impact Downside Base Risk-Adj. 2020 $148.5 $148.5 Jan/Feb Actuals vs Budget(1) 2.7 2.7 Near-Term ~120-Day Impact (March-June) (49.3) (49.3) Mid-Term Q3 Impact (9.8) (7.8) Long-Term Q4 Rebound 19.5 32.9 TBD Government Assistance Program/Plan - - Total COVID-19 Impact ($39.6) ($24.2) Revised Risk-Adj. 2020 $111.5 $127.0 (1) $11mm Pro Forma Same-facility Adjusted EBITDA in February is being used for purposes of calculating delta in EBITDA bridge. Refer to the February results deck.
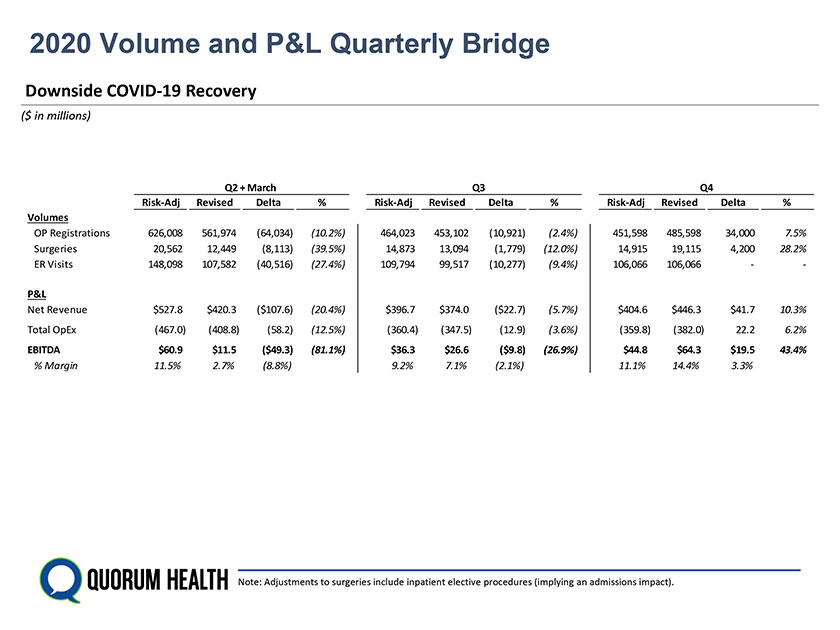
2020 Volume and P&L Quarterly Bridge Downside COVID-19 Recovery ($ in millions) Q2 + March Q3 Q4 Risk-Adj Revised Delta % Risk-Adj Revised Delta % Risk-Adj Revised Delta % Volumes OP Registrations 626,008 561,974 (64,034) (10.2%) 464,023 453,102 (10,921) (2.4%) 451,598 485,598 34,000 7.5% Surgeries 20,562 12,449 (8,113) (39.5%) 14,873 13,094 (1,779) (12.0%) 14,915 19,115 4,200 28.2% ER Visits 148,098 107,582 (40,516) (27.4%) 109,794 99,517 (10,277) (9.4%) 106,066 106,066 - - P&L Net Revenue $527.8 $420.3 ($107.6) (20.4%) $396.7 $374.0 ($22.7) (5.7%) $404.6 $446.3 $ 41.7 10.3% Total OpEx (467.0) (408.8) (58.2) (12.5%) (360.4) (347.5) (12.9) (3.6%) (359.8) (382.0) 22.2 6.2% EBITDA $60.9 $11.5 ($49.3) (81.1%) $36.3 $26.6 ($9.8) (26.9%) $44.8 $64.3 $ 19.5 43.4% % Margin 11.5% 2.7% (8.8%) 9.2% 7.1% (2.1%) 11.1% 14.4% 3.3% Note: Adjustments to surgeries include inpatient elective procedures (implying an admissions impact).
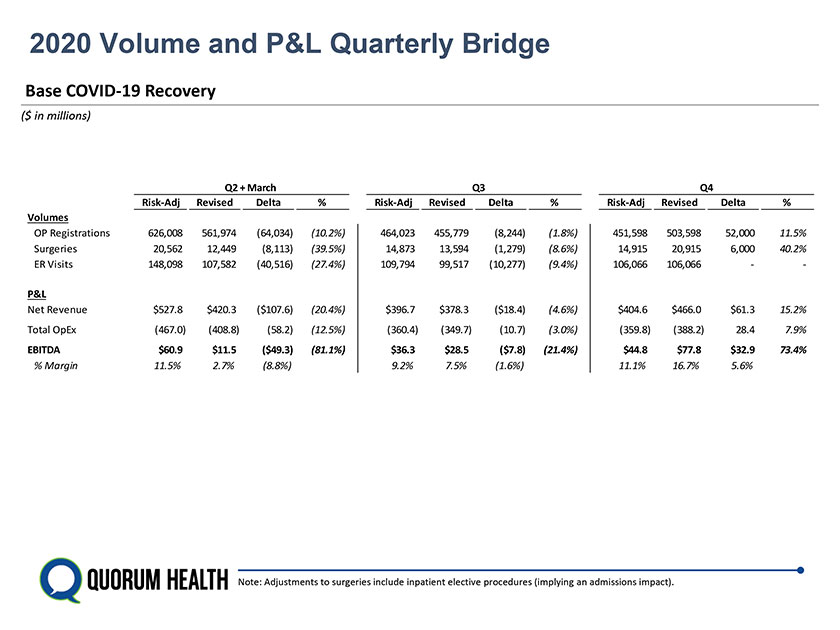
2020 Volume and P&L Quarterly Bridge Base COVID-19 Recovery ($ in millions) Q2 + March Q3 Q4 Risk-Adj Revised Delta % Risk-Adj Revised Delta % Risk-Adj Revised Delta % Volumes OP Registrations 626,008 561,974 (64,034) (10.2%) 464,023 455,779 (8,244) (1.8%) 451,598 503,598 52,000 11.5% Surgeries 20,562 12,449 (8,113) (39.5%) 14,873 13,594 (1,279) (8.6%) 14,915 20,915 6,000 40.2% ER Visits 148,098 107,582 (40,516) (27.4%) 109,794 99,517 (10,277) (9.4%) 106,066 106,066 - - P&L Net Revenue $527.8 $420.3 ($107.6) (20.4%) $396.7 $378.3 ($18.4) (4.6%) $404.6 $466.0 $ 61.3 15.2% Total OpEx (467.0) (408.8) (58.2) (12.5%) (360.4) (349.7) (10.7) (3.0%) (359.8) (388.2) 28.4 7.9% EBITDA $60.9 $11.5 ($49.3) (81.1%) $36.3 $28.5 ($7.8) (21.4%) $44.8 $77.8 $ 32.9 73.4% % Margin 11.5% 2.7% (8.8%) 9.2% 7.5% (1.6%) 11.1% 16.7% 5.6% Note: Adjustments to surgeries include inpatient elective procedures (implying an admissions impact).