Attached files
| file | filename |
|---|---|
| 8-K - 8-K - FIRST INTERSTATE BANCSYSTEM INC | fibk-20200318x8k.htm |

Investor Presentation March 2020

Safe Harbor This presentation contains “forward-looking statements” within the meaning of Section 27A of the Securities Act of 1933, as amended, and Section 21E of the Securities Exchange Act of 1934, as amended, that involve inherent risks and uncertainties. Any statements about our plans, objectives, expectations, strategies, beliefs, or future performance or events constitute forward-looking statements. Such statements are identified by words or phrases such as “believes,” “expects,” “anticipates,” “plans,” “trends,” “objectives,” “continues” or similar expressions, or future or conditional verbs such as “will,” “would,” “should,” “could,” “might,” “may” or similar expressions. Forward-looking statements involve known and unknown risks, uncertainties, assumptions, estimates and other important factors that could cause actual results to differ materially from any results, performance or events expressed or implied by such forward-looking statements. The following factors, among others, may cause actual results to differ materially from current expectations in the forward-looking statements, including those set forth in this presentation: political, legal, regulatory, and general economic or business conditions, either nationally or regionally; geopolitical uncertainties throughout the world; weather-related, disease, viruses, wide-spread health emergencies, pandemics, and other adverse climate or other conditions that may impact our business and our customers’ business; changes in the interest rate environment or interest rate changes made by the Board of Governors of the Federal Reserve; credit performance of our loan portfolio; adequacy of the allowance for loan losses and access to low-cost funding sources; our ability to achieve the projected cost savings from our recent acquisitions and do so in the time expected; operating costs, customer loss and business disruption following the acquisitions may be greater than expected; the unavailability of LIBOR; impairment of goodwill; dependence on the Company’s management team and ability to attract and retain qualified employees; governmental regulation and changes in regulatory, tax and accounting rules and interpretations; stringent capital requirements; future FDIC insurance premium increases; CFPB restrictions on our ability to originate and sell mortgage loans; cyber-security risks, including items such as “denial of service,” “hacking” and “identity theft”; unfavorable resolution to litigation and regulatory proceedings; liquidity risks and technological innovations; inability to grow organically or through acquisitions; impairment of collateral underlying our loans; environmental remediation and other costs associated with repossessed properties; ineffective internal operational controls; competition; meeting market demand with current and new products; reliance on external vendors; soundness of other financial institutions; failure of technology and failure to effectively implement technology-driven products and services; risks associated with introducing and implementing new lines of business, products or services; failure to execute on strategic or operational plans, including the ability to complete mergers and acquisitions or fully achieve expected costs savings or revenue growth associated with mergers and acquisitions; deposit attrition, customer loss and/or revenue loss following completed acquisitions; anti-takeover provisions; changes in dividend policy and the inability of our bank subsidiary to pay dividends; the uninsured nature of any investment in Class A or Class B common stock; decline in market price and volatility of Class A and Class B common stock; voting control of Class B common stock stockholders; controlled company status; dilution as a result of future equity issuances; and subordination of common stock to Company debt. These factors are not necessarily all of the factors that could cause our actual results, performance or achievements to differ materially from those expressed in or implied by any of our forward-looking statements. Other unknown or unpredictable factors also could harm our results. All forward-looking statements attributable to us or persons acting on our behalf are expressly qualified in their entirety by the cautionary statements set forth above and included in the Company’s periodic reports filed with the SEC under the caption “Risk Factors.” Interested parties are urged to read in their entirety such risk factors prior to making any investment decision with respect to the Company. Forward- looking statements speak only as of the date they are made and we do not undertake or assume any obligation to update publicly any of these statements to reflect actual results, new information or future events, changes in assumptions or changes in other factors affecting forward-looking statements, except to the extent required by applicable laws. If we update one or more forward-looking statements, no inference should be drawn that we will make additional updates with respect to those or other forward-looking statements. Page 2
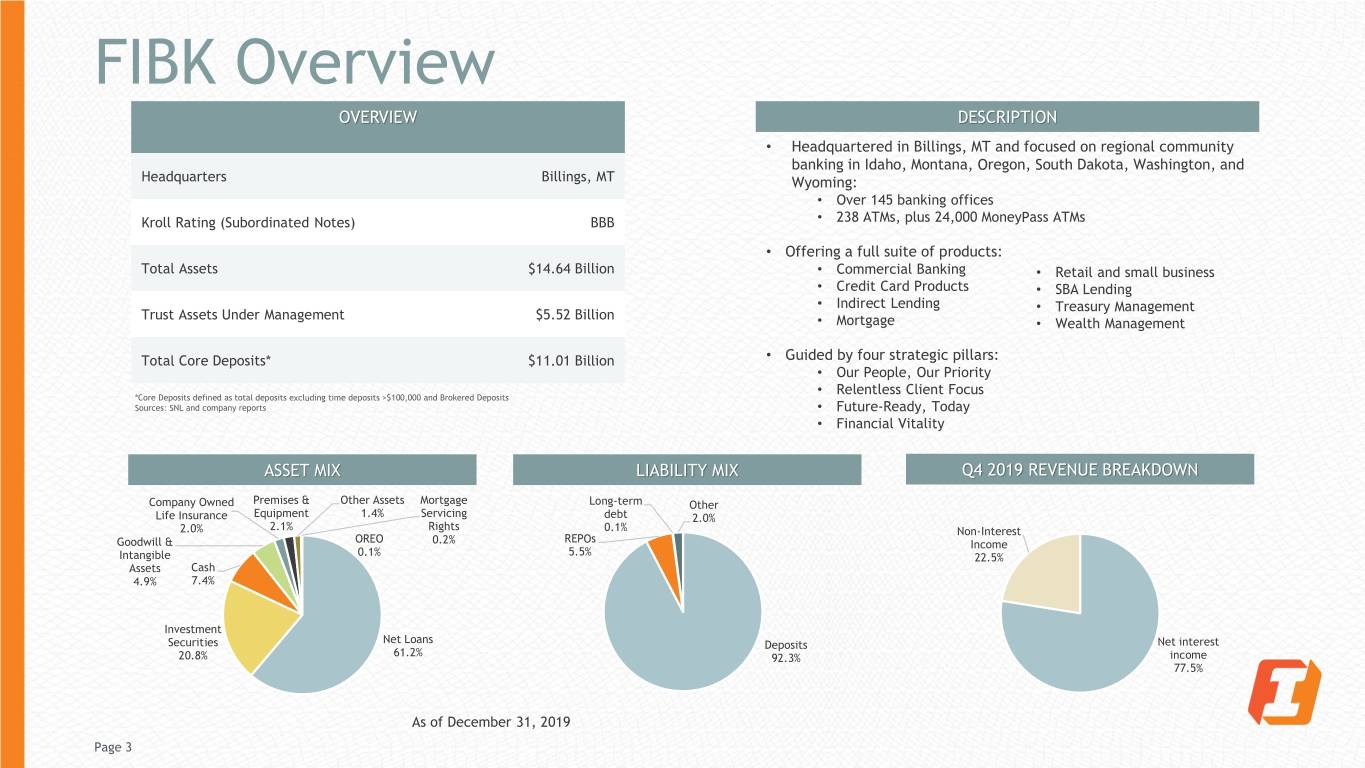
FIBK Overview OVERVIEW DESCRIPTION • Headquartered in Billings, MT and focused on regional community banking in Idaho, Montana, Oregon, South Dakota, Washington, and Headquarters Billings, MT Wyoming: • Over 145 banking offices Kroll Rating (Subordinated Notes) BBB • 238 ATMs, plus 24,000 MoneyPass ATMs • Offering a full suite of products: Total Assets $14.64 Billion • Commercial Banking • Retail and small business • Credit Card Products • SBA Lending • Indirect Lending • Treasury Management Trust Assets Under Management $5.52 Billion • Mortgage • Wealth Management Total Core Deposits* $11.01 Billion • Guided by four strategic pillars: • Our People, Our Priority • Relentless Client Focus *Core Deposits defined as total deposits excluding time deposits >$100,000 and Brokered Deposits Sources: SNL and company reports • Future-Ready, Today • Financial Vitality ASSET MIX LIABILITY MIX Q4 2019 REVENUE BREAKDOWN Company Owned Premises & Other Assets Mortgage Long-term Other Life Insurance Equipment 1.4% Servicing debt 2.0% 2.0% 2.1% Rights 0.1% Non-Interest REPOs Goodwill & OREO 0.2% Income 5.5% Intangible 0.1% 22.5% Assets Cash 4.9% 7.4% Investment Securities Net Loans Deposits Net interest 20.8% 61.2% 92.3% income 77.5% As of December 31, 2019 Page 3

Investment Highlights • Experienced Management Team • Long Track Record of Profitability • Strong Core Deposit Funding • Conservative Credit Strategy which Limits Exposure to Large Losses • Diversified Client Base Tempers Economic Volatility • Substantial Insider Ownership Aligns Management With Stakeholders Page 4

Executive Leadership Team Industry Years at Name Title Age Experience FIBK Kevin P. Riley President and Chief Executive Officer 60 30+ Years 7 Years James R. Scott* Chair of the Board 70 50+ Years 48 Years Marcy D. Mutch Chief Financial Officer 60 30+ Years 13 Years Renee L. Newman Chief Strategy Officer 50 25+ Years 3 Years Jodi D. Hubbell Chief Operating Officer 54 30+ Years 3 Years Phillip G. Gaglia Chief Risk Officer 55 30+ Years 30 Years Russell A. Lee Chief Banking Officer 64 40+ Years 2 Years Kade G. Peterson Chief Information Officer 54 30+ Years 2 Years *James Scott will be stepping down as Chair of the Board in accordance with normal transition procedures and he will remain a director; David Jahnke, the current Vice Chair, will become the new Chair of the Board Page 5

Building the First Interstate Franchise 2018 Inland Northwest Bank, filling in April 2019 footprint in the PNW $826.8 million 20 Branches Idaho Independent Bank $725 million 11 Branches 2016 Community 1st Bank Flathead Bank of Bigfork $130 million 3 Branches $225 million 7 Branches FIBK IIBK 2017 CMYF Bank of the Cascades $3.2 Billion 46 branches 2014 Mountain West Financial Corp. 2015 Absarokee Bancorporation, Inc. 1968 Mr. Homer Scott establishes First Interstate Bank with the purchase of the Bank of Commerce in Sheridan, Wyoming 1916 First Interstate Bank is Established Page 6
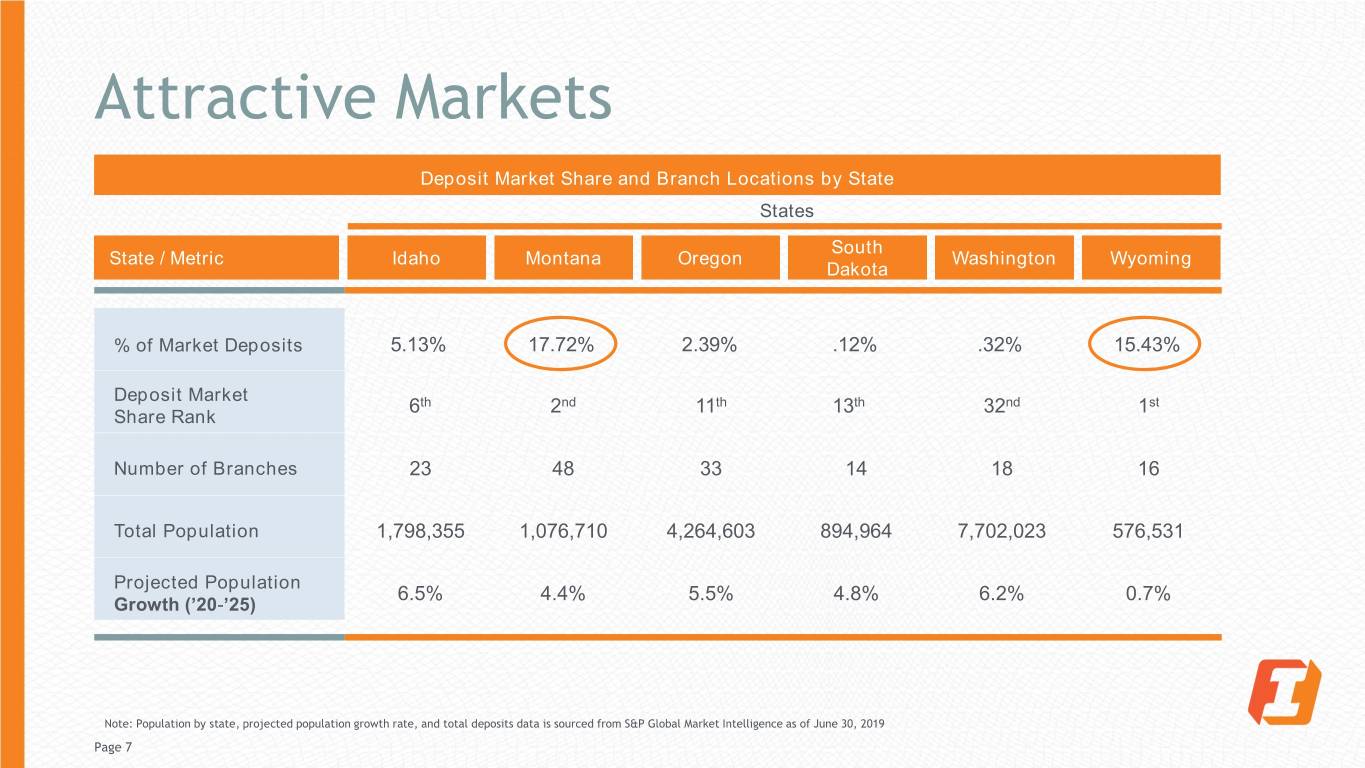
Attractive Markets Deposit Market Share and Branch Locations by State States South State / Metric Idaho Montana Oregon Washington Wyoming Dakota % of Market Deposits 5.13% 17.72% 2.39% .12% .32% 15.43% Deposit Market 6th 2nd 11th 13th 32nd 1st Share Rank Number of Branches 23 48 33 14 18 16 Total Population 1,798,355 1,076,710 4,264,603 894,964 7,702,023 576,531 Projected Population 6.5% 4.4% 5.5% 4.8% 6.2% 0.7% Growth (’20-’25) Note: Population by state, projected population growth rate, and total deposits data is sourced from S&P Global Market Intelligence as of June 30, 2019 Page 7

Attractive Markets: Stable Employment MONTANA WYOMING SOUTH DAKOTA WASHINGTON 3.4% 3.7% 3.2% 4.3% (RANKED 23RD) (RANKED 35TH) (RANKED 19TH) (RANKED 43RD) OREGON 3.7% (RANKED 34TH) IDAHO 2.9% (RANKED 12TH) Best 5 States 1 South Carolina 2.3% 2 Utah 2.3% 3 Vermont 2.3% 4 North Dakota 2.4% 5 Colorado 2.5% Worst 5 States 50 Alaska 6.1% 49 Mississippi 5.7% 48 West Virginia 5% 47 Louisiana 4.9% 46 New Mexico 4.7% 0.0% to 2.5% 2.5% to 3.0% 3.0% to 4.0% (U.S. Avg = 3.5%) Source: Bureau of Labour Statistics 4.0% to 7.0% Data as of: 12/31/2019 7.0% or more Page 8

Historical Financial Performance Summary Results Gross Loans ($000) Total Deposits ($000) vs. Loan/Deposits (%) Total Revenue ($000) $10,680,70 $11,663,500 $9,031,600 $644,900 $8,503,700 0 $9,934,871 $575,800 $7,614,355 $491,596 $7,376,110 $416,261 $5,478,544 74.27% 76.64% 79.62% 77.43% 2016Y 2017Y 2018Y 2019Y 2016Y 2017Y 2018Y 2019Y 2016Y 2017Y 2018Y 2019Y Net Interest Income ($000) vs. NIM (%) NonInt. Inc. ($000) vs. NonInt / Op. Revenue(%) Nonint. Expense ($000) vs. Effic. Ratio (%) $495,000 $149,800 $432,500 $137,967 $143,400 64.77% $395,900 $132,016 $360,900 $349,843 3.99% 61.88% $323,900 3.88% 61.31% $279,765 $261,000 31.72% 3.64% 28.07% 59.65% 3.57% 24.90% 23.23% 2016Y 2017Y 2018Y 2019Y 2016Y 2017Y 2018Y 2019Y 2016Y 2017Y 2018Y 2019Y Page 9
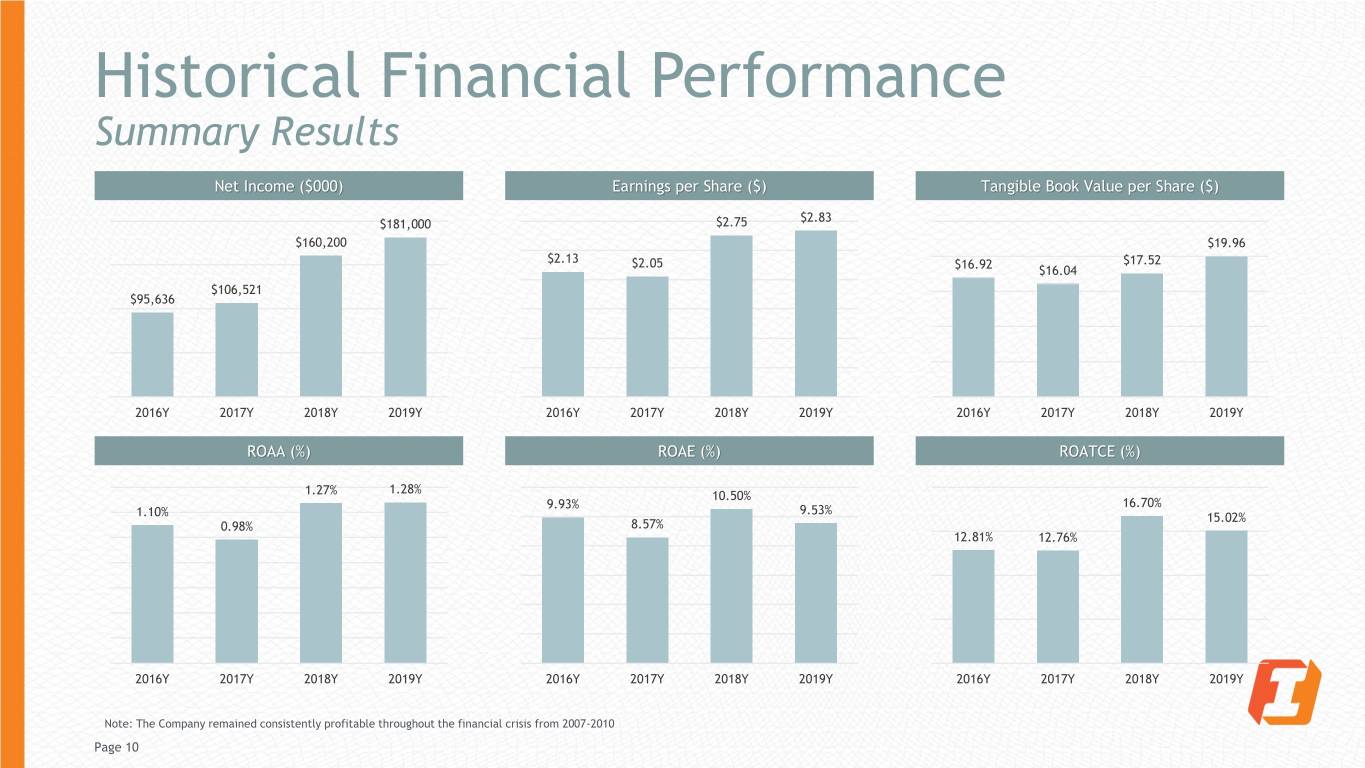
Historical Financial Performance Summary Results Net Income ($000) Earnings per Share ($) Tangible Book Value per Share ($) $2.83 $181,000 $2.75 $160,200 $19.96 $2.13 $2.05 $17.52 $16.92 $16.04 $106,521 $95,636 2016Y 2017Y 2018Y 2019Y 2016Y 2017Y 2018Y 2019Y 2016Y 2017Y 2018Y 2019Y ROAA (%) ROAE (%) ROATCE (%) 1.28% 1.27% 10.50% 16.70% 9.93% 9.53% 1.10% 15.02% 0.98% 8.57% 12.81% 12.76% 2016Y 2017Y 2018Y 2019Y 2016Y 2017Y 2018Y 2019Y 2016Y 2017Y 2018Y 2019Y Note: The Company remained consistently profitable throughout the financial crisis from 2007-2010 Page 10

Historical Financial Performance Summary Results NPAs / Assets (%) Texas Ratio (%) NPLs ($000) vs. NCOs / Avg. Loans (%) 10.36% $76,600 0.96% $72,500 8.45% $58,100 0.68% 6.39% $48,600 0.55% 0.23% 0.39% 4.15% 0.20% 0.16% 0.10% 2016Y 2017Y 2018Y 2019Y 2016Y 2017Y 2018Y 2019Y 2016Y 2017Y 2018Y 2019Y Tang. Common Equity / Tang. Assets (%) Tier 1 Leverage Ratio (%) Total RBC Ratio (%) 9.35% 8.60% 8.39% 10.11% 10.13% 15.13% 7.75% 9.47% 14.10% 12.99% 8.86% 12.76% 2016Y 2017Y 2018Y 2019Y 2016Y 2017Y 2018Y 2019Y 2016Y 2017Y 2018Y 2019Y Page 11
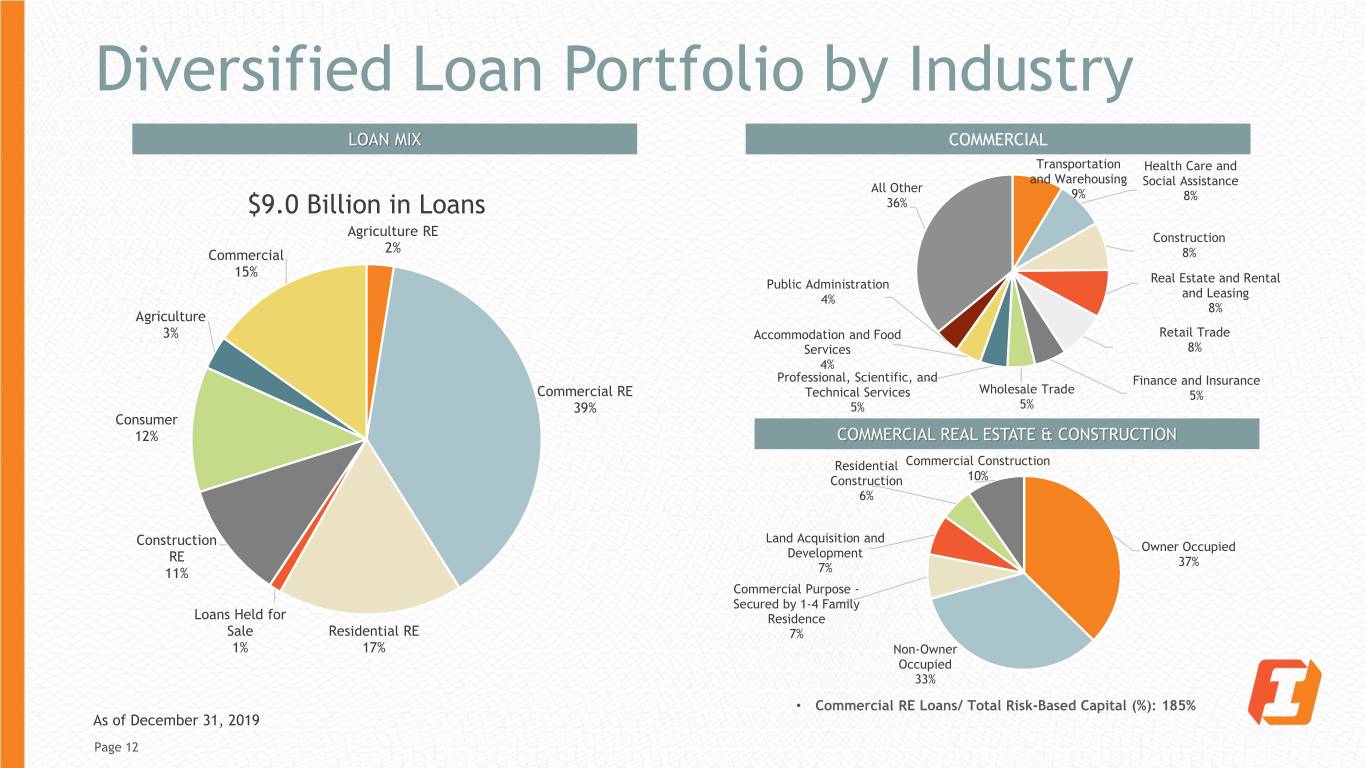
Diversified Loan Portfolio by Industry LOAN MIX COMMERCIAL Transportation Health Care and and Warehousing Social Assistance All Other 9% 8% $9.0 Billion in Loans 36% Agriculture RE Construction 2% Commercial 8% 15% Public Administration Real Estate and Rental 4% and Leasing 8% Agriculture 3% Accommodation and Food Retail Trade Services 8% 4% Professional, Scientific, and Finance and Insurance Commercial RE Technical Services Wholesale Trade 5% 39% 5% 5% Consumer 12% COMMERCIAL REAL ESTATE & CONSTRUCTION Residential Commercial Construction Construction 10% 6% Land Acquisition and Construction Owner Occupied Development RE 37% 11% 7% Commercial Purpose - Secured by 1-4 Family Loans Held for Residence Sale Residential RE 7% 1% 17% Non-Owner Occupied 33% • Commercial RE Loans/ Total Risk-Based Capital (%): 185% As of December 31, 2019 Page 12

Oil and Gas: Industry Exposure o $47 million in direct exposure (0.5% of total loan portfolio) o $18 million in unfunded commitments o $14 million in criticized loans category o 2.2% Allowance for Loan Loss Allocation Net Principal Month NAICS Code Description Unfunded Commitment Balance 211111 Crude Petroleum and Natural Gas Extraction $17,354,922 $8,295,454 $25,650,375 213112 Support Activities for Oil and Gas Operations $27,269,114 $7,108,994 $34,378,108 Dec 2019 213111 Drilling Oil and Gas Wells $1,841,316 $1,619,233 $3,460,548 221210 Natural Gas Distribution $603,385 $470,000 $1,073,385 211112 Natural Gas Liquid Extraction $114,221 $32,157 $146,378 Oil & Gas Total $47,182,958 $17,525,837 $64,708,795 Page 13 As of December 31, 2019

Mall and Retail Trade: Portfolio Exposure • $52.1 million direct exposure to Malls1 (0.6% of total loan portfolio) • None in criticized loan categories • $47.7 million direct exposure to Retail Trade 2 (0.5% of total loan portfolio) • $3.4 million in criticized loan categories NAICS NET PRINCIPAL MONTH DESCRIPTION UNFUNDED COMMITTMENT CODE BALANCE Shopping Malls $52,061,489 $7,983,647 $60,045,136 451110 Sporting Goods Stores $26,894,562 $5,227,494 $32,122,056 452990 All Other General Merchandise Stores $10,158,411 $106,437 $10,264,848 Dec 448310 Jewelry Stores $4,626,611 $1,801,894 $6,428,505 2019 448190 Other Clothing Stores $1,534,719 $628,500 $2,163,219 448140 Family Clothing Stores $981,025 $125,011 $1,106,035 451140 Musical Instrument and Supplies Stores $956,692 $2,112 $958,805 All Other Retail Trade $2,575,130 $205,899 $2,781,029 Mall and Retail Trade Total $99,788,639 $16,080,994 $115,869,633 1 These credits are not coded uniquely on the system as most are identified as Lessors of Non-Residential Real Estate. The portfolios were identified by the word "Mall" or "Shopping" in the Customer Name and by the Credit Officers review. 2 These credits were identified utilizing the NAICS codes 448 – Clothing Stores, 451 – Sporting Goods and 452 – General Merchandise. Page 14 As of December 31, 2019

Strong Deposit Base $11.66 Billion in Deposits CDs > $100k Time Other 6% 7% Demand Non-Interest Bearing 29% Savings 31% Demand Interest Bearing 27% MRQ Cost of Deposits: 33 basis points Page 15 As of December 31, 2019
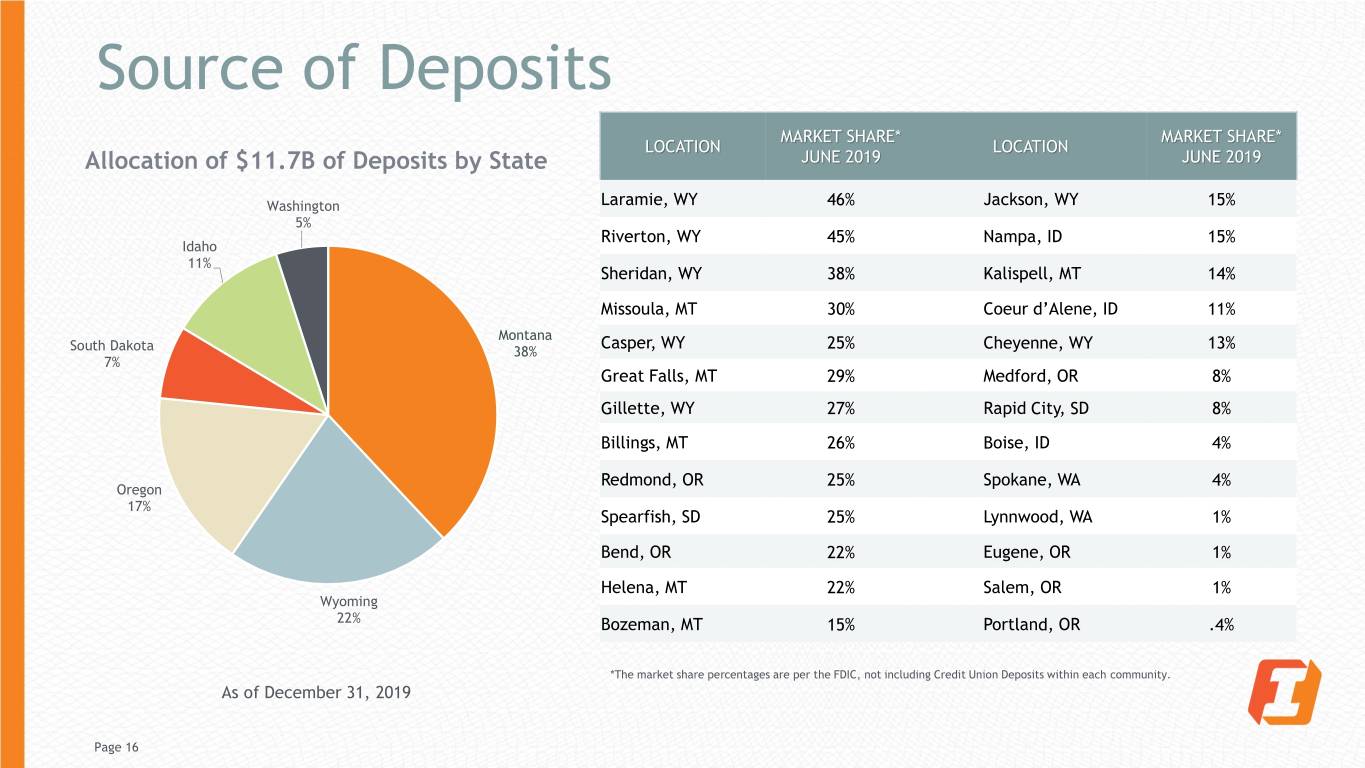
Source of Deposits MARKET SHARE* MARKET SHARE* LOCATION LOCATION Allocation of $11.7B of Deposits by State JUNE 2019 JUNE 2019 Washington Laramie, WY 46% Jackson, WY 15% 5% Riverton, WY 45% Nampa, ID 15% Idaho 11% Sheridan, WY 38% Kalispell, MT 14% Missoula, MT 30% Coeur d’Alene, ID 11% Montana Casper, WY 25% Cheyenne, WY 13% South Dakota 38% 7% Great Falls, MT 29% Medford, OR 8% Gillette, WY 27% Rapid City, SD 8% Billings, MT 26% Boise, ID 4% Redmond, OR 25% Spokane, WA 4% Oregon 17% Spearfish, SD 25% Lynnwood, WA 1% Bend, OR 22% Eugene, OR 1% Helena, MT 22% Salem, OR 1% Wyoming 22% Bozeman, MT 15% Portland, OR .4% *The market share percentages are per the FDIC, not including Credit Union Deposits within each community. As of December 31, 2019 Page 16

Deposit Pricing Strategy Cumulative deposit beta in the declining interest rate environment of 47% BETA SUMMARY BETA Last 25bps Rate Cut 48% Cuts Last 50bps Rate Cuts 51% Last 75bps Rate Cuts 47% Last 25bps Rate Cut 42% Last 50bps Rate Cuts 31% Last 75bps Rate Cuts 30% Hikes Last 100bps Rate Cuts 26% Last 125bps Rate Cuts 21% Last 150bps Rate Cuts 19% Last 175bps Rate Cuts 19% As of December 31, 2019 Page 17
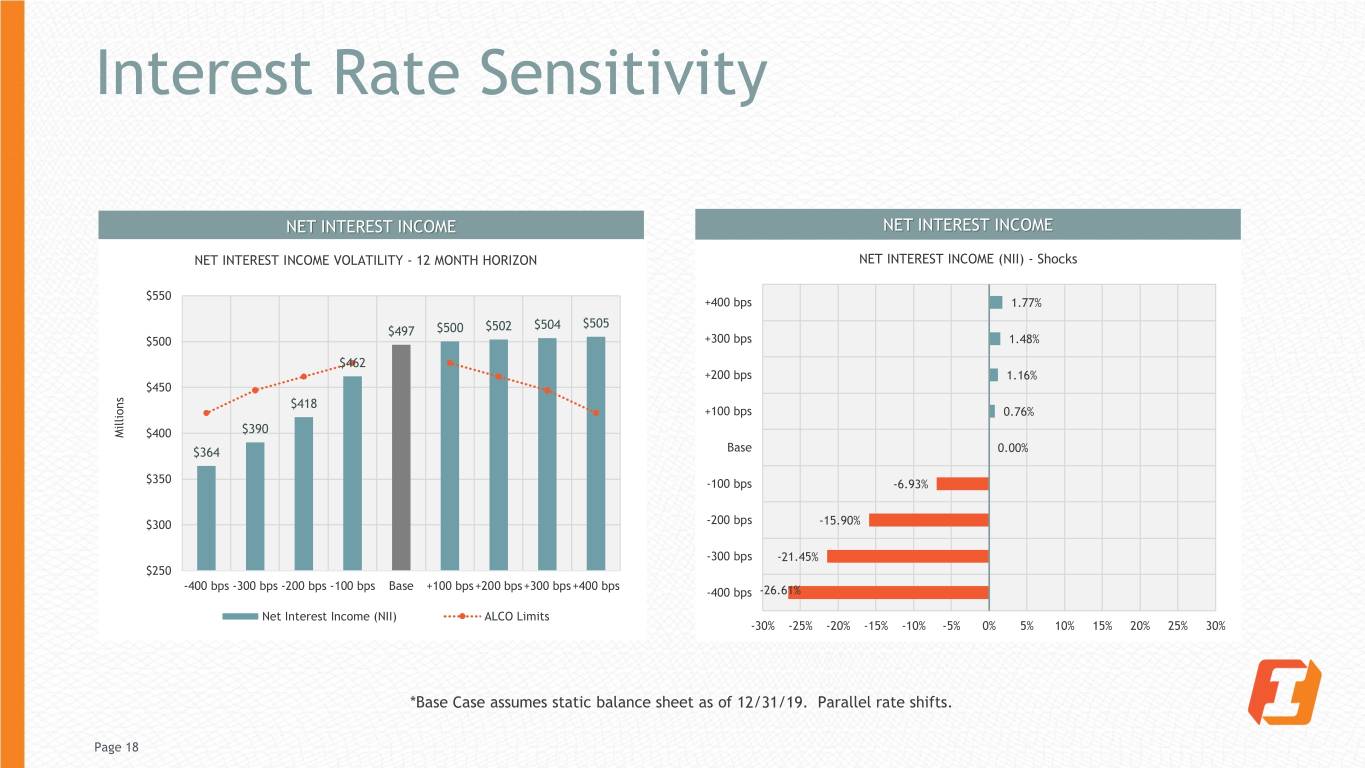
Interest Rate Sensitivity NET INTEREST INCOME NET INTEREST INCOME NET INTEREST INCOME VOLATILITY - 12 MONTH HORIZON NET INTEREST INCOME (NII) - Shocks $550 +400 bps 1.77% $504 $505 $497 $500 $502 $500 +300 bps 1.48% $462 +200 bps 1.16% $450 $418 +100 bps 0.76% $390 Millions $400 $364 Base 0.00% $350 -100 bps -6.93% $300 -200 bps -15.90% -300 bps -21.45% $250 -400 bps -300 bps -200 bps -100 bps Base +100 bps+200 bps+300 bps+400 bps -400 bps -26.61% Net Interest Income (NII) ALCO Limits -30% -25% -20% -15% -10% -5% 0% 5% 10% 15% 20% 25% 30% *Base Case assumes static balance sheet as of 12/31/19. Parallel rate shifts. Page 18
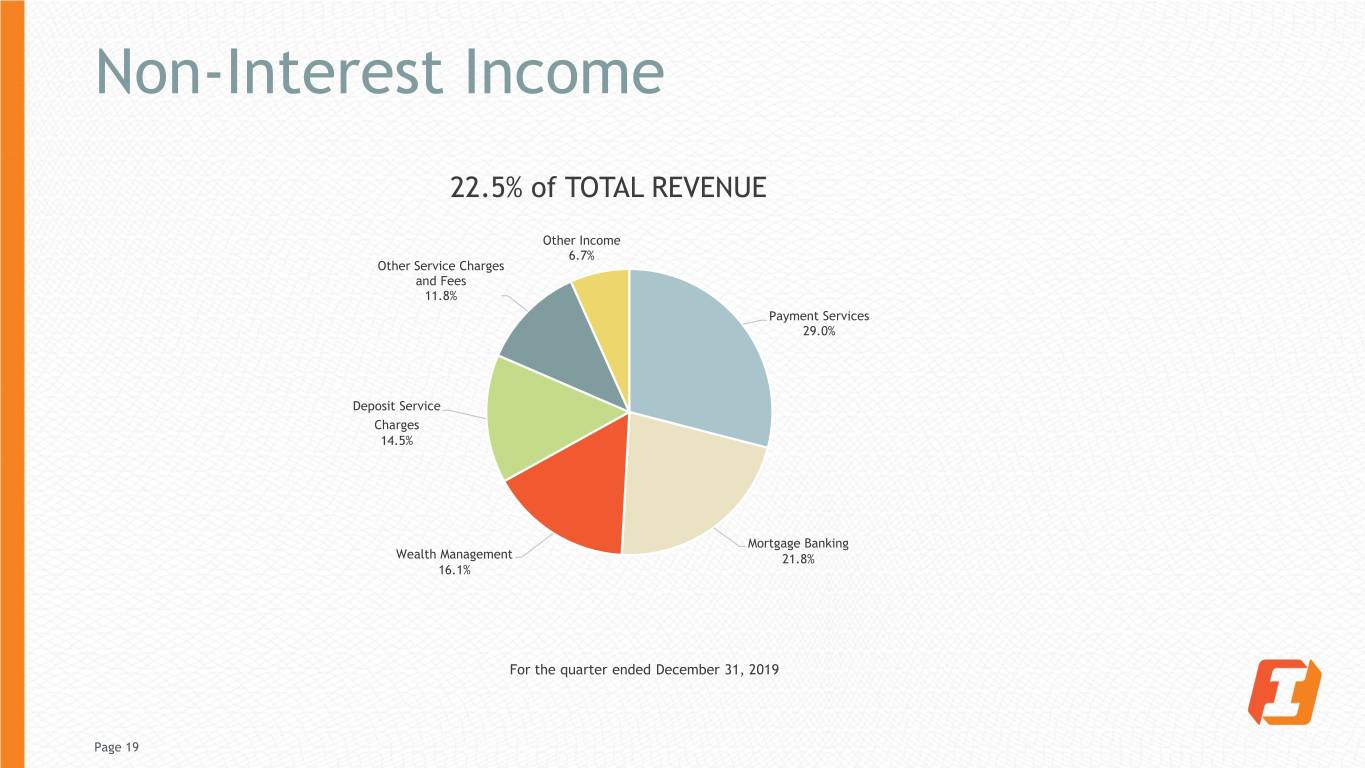
Non-Interest Income 22.5% of TOTAL REVENUE Other Income 6.7% Other Service Charges and Fees 11.8% Payment Services 29.0% Deposit Service Charges 14.5% Mortgage Banking Wealth Management 21.8% 16.1% For the quarter ended December 31, 2019 Page 19

Investment Portfolio PORTFOLIO COMPOSITION ($2.8B) QUARTERLY NEW PURCHASES: YIELDS 3.50% 3.02% Fixed MBS 38% 2.77% 3.00% 2.38% 2.31% 2.50% CMO 28% 2.00% Treasury / Agency 13% 1.50% 1.00% CMBS 4% 0.50% 0.00% Municipal 4% Q1-19 Q2-19 Q3-19 Q4-19 Corporate 5% QUARTERLY NEW PURCHASES: DURATION A/L 6.00 CD 2% 5.77 5.80 5.47 5.60 SBA 2% 5.38 5.40 5.20 Private Label 2% 4.99 5.00 CMO Floating 1% 4.80 4.60 Floating MBS 2% 4.40 Q1-19 Q2-19 Q3-19 Q4-19 0% 5% 10% 15% 20% 25% 30% 35% 40% As of December 31, 2019 Page 20

Liquidity • To meet short term liquidity needs, FIBK maintains a targeted cash and securities position and has borrowing capacity through a number of wholesale sources including the FHLB and the Federal Reserve Bank • FIBK has the following sources of liquidity at the Holding Company level: • $147.1 million of cash as of December 31, 2019 • $50 million line of credit with a utilization balance of $0 • As of December 31, 2019, First Interstate Bank could pay approximately $72.8 million of additional dividends to FIBK As of December 31, 2019 Page 21

Appendix Page 22

Non-GAAP Reconciliation (Dollars in millions, except per share date) As of December 31, 2016 2017 2018 2019 Total common stockholders' equity (GAAP) $982.6 $1,427.6 $1,693.9 $2,013.9 Less goodwill and other intangible assets (excluding MSRs) $222.5 $521.8 $631.6 $711.7 Tangible Common Equity (Non-GAAP) $760.1 $905.8 $1,062.3 $1,302.2 Total Assets (GAAP) $9,063.9 $12,213.3 $13,300.2 $14,644.2 Less goodwill and other intangible assets (excluding MSRs) $222.5 $521.8 $631.6 $711.7 Tangible Assets (Non-GAAP) $8,841.4 $11,691.5 $12,668.6 $13,932.5 Average Balances: Total common stockholders' equity (GAAP) $963.5 $1,243.7 $1,525.8 $1,899.0 Less goodwill and other intangible assets (excluding MSRs) $216.7 $408.9 $566.6 $694.1 Average tangible common stockholders' equity (Non-GAAP) $746.8 $834.8 $959.2 $1,204.9 Common shares outstanding 44,926,176 56,465,559 60,623,247 65,246,339 Net income available to common shareholders $95.7 $106.5 $160.2 $181.0 Book value per common share (GAAP) $21.87 $25.28 $27.94 $30.87 Tangible book value per common share (Non-GAAP) $16.92 $16.04 $17.52 $19.96 Tangible common equity to tangible assets (Non-GAAP) 8.60% 7.75% 8.39% 9.35% Return on average common tangible equity (Non-GAAP) 12.81% 12.76% 16.70% 15.02% Non-performing assets $82.8 $79.5 $68.7 $51.4 90+ days past due $3.8 $3.1 $3.8 $5.7 Tangible equity $760.1 $905.8 $1062.3 $1302.2 Loan loss reserves $76.2 $72.1 $73.0 $73.0 Texas ratio (Non-GAAP) 10.36% 8.45% 6.39% 4.15% As of December 31, 2019 Page 23
