Attached files
| file | filename |
|---|---|
| EX-32.2 - EXHIBIT 32.2 - Audax Credit BDC Inc. | tm2012562d1_ex32-2.htm |
| EX-32.1 - EXHIBIT 32.1 - Audax Credit BDC Inc. | tm2012562d1_ex32-1.htm |
| EX-31.2 - EXHIBIT 31.2 - Audax Credit BDC Inc. | tm2012562d1_ex31-2.htm |
| EX-31.1 - EXHIBIT 31.1 - Audax Credit BDC Inc. | tm2012562d1_ex31-1.htm |
| EX-4.2 - EXHIBIT 4.2 - Audax Credit BDC Inc. | tm2012562d1_ex4-2.htm |
UNITED STATES
SECURITIES AND EXCHANGE COMMISSION
WASHINGTON, D.C. 20549
FORM 10-K
(Mark One)
| x | ANNUAL REPORT PURSUANT TO SECTION 13 OR 15(d) OF THE SECURITIES EXCHANGE ACT OF 1934 |
For the fiscal year ended December 31, 2019
OR
| ¨ | TRANSITION REPORT PURSUANT TO SECTION 13 OR 15(d) OF THE SECURITIES EXCHANGE ACT OF 1934 |
For the transition period from to
Commission file number: 814-01154
AUDAX CREDIT BDC INC.
(Exact name of registrant as specified in its charter)
| DELAWARE | 47-3039124 |
|
(State or other jurisdiction of incorporation or organization) |
(I.R.S. Employer Identification No.) |
| 101 HUNTINGTON AVENUE | |
| BOSTON, MASSACHUSETTS | 02199 |
| (Address of principal executive office) | (Zip Code) |
(617) 859-1500
(Registrant’s telephone number, including area code)
Securities registered pursuant to Section 12(b) of the Act:
None
Securities registered pursuant to Section 12(g) of the Act:
Common Stock, par value $0.001 per share
(Title of class)
Indicate by check mark if the registrant is a well-known seasoned issuer, as defined in Rule 405 of the Securities Act. Yes ¨ No x
Indicate by check mark if the registrant is not required to file reports pursuant to Section 13 or Section 15(d) of the Act. Yes ¨ No x
Indicate by check mark whether the registrant (1) has filed all reports required to be filed by Section 13 or 15(d) of the Securities Exchange Act of 1934 during the preceding 12 months (or for such shorter period that the registrant was required to file such reports), and (2) has been subject to such filing requirements for the past 90 days. Yes x No ¨
Indicate by check mark whether the registrant has submitted electronically every Interactive Data File required to be submitted pursuant to Rule 405 of Regulation S-T during the preceding 12 months (or for such shorter period that the registrant was required to submit such files). Yes ¨ No ¨
Indicate by check mark whether the registrant is a large accelerated filer, an accelerated filer, a non-accelerated filer, a smaller reporting company, or an emerging growth company. See the definitions of “large accelerated filer,” “accelerated filer,” “smaller reporting company,” and “emerging growth company” in Rule 12 b-2 of the Exchange Act.
| Large accelerated filer | ¨ | Accelerated filer | ¨ |
| Non-accelerated filer | x | Smaller reporting company | ¨ |
Emerging growth company |
x |
If an emerging growth company, indicate by check mark if the registrant has elected not to use the extended transition period for complying with any new or revised financial accounting standards provided pursuant to Section 13(a) of the Exchange Act. ¨
Indicate by check mark whether the registrant is a shell company (as defined in Rule 12b-2 of the Exchange Act). Yes ¨ No x
As of December 31, 2019, there was no established public market for the registrant’s common stock. The registrant had 36,698,229 shares of common stock, par value $0.001 per share, issued and outstanding as of March 17, 2020.
Portions of the registrant’s Proxy Statement for its 2020 Annual Meeting of Stockholders to be filed not later than 120 days after the end of the fiscal year covered by this annual report on Form 10-K are incorporated by reference into Part III of this annual report on Form 10-K.
AUDAX CREDIT BDC INC.
TABLE OF CONTENTS
In this annual report on Form 10-K, except where the context suggests otherwise, the terms “we,” “us,” “our” and the “Company” refer to Audax Credit BDC Inc. We refer to Audax Management Company (NY), LLC, our investment adviser, as our “Adviser,” and Audax Management Company, LLC, our administrator, as our “Administrator.” The term “stockholders” refers to holders of our common stock, $.001 par value per share, or the Common Stock. The term “Shares” refers to the shares of Common Stock.
Overview
Audax Credit BDC Inc. is a Delaware corporation that was formed in January 2015. We are an externally managed, closed-end, non-diversified management investment company that has elected to be treated as a business development company, or BDC, under the Investment Company Act of 1940, as amended, or the 1940 Act. In addition, we have elected to be treated for federal income tax purposes as a regulated investment company, or RIC, under Subchapter M of the Internal Revenue Code of 1986, as amended, or the Code.
Our investment objective is to generate current income and, to a lesser extent, long-term capital appreciation. We intend to meet our investment objective by investing primarily in senior secured debt of privately owned U.S. middle-market companies. For purposes of this annual report, we define “middle market companies” to be companies that, in general, generate less than $500 million in annual revenue or less than $75 million of annual earnings before interest, taxes, depreciation and amortization, or EBITDA. We intend to invest at least 80% of our net assets plus the amount of any borrowings in “credit instruments,” which we define as any fixed income instruments.
Although we have no present intention of doing so, we may decide to incur indebtedness for the purpose of funding investments and for general corporate purposes, which we refer to as “leverage.” If we do incur leverage in the near term, we anticipate that it will be used in limited circumstances and on a short-term basis for purposes such as funding distributions. As a BDC, we are limited in our use of leverage under the 1940 Act. Specifically, as a BDC, and absent specific authorization by our Board of Directors or stockholders, we are only allowed to borrow amounts such that our asset coverage meets the requirements of the 1940 Act, currently at least 200% after such borrowing. In determining whether to use leverage, we will analyze the maturity, covenants and interest rate structure of the proposed borrowings, as well as the risks of such borrowings within the context of our investment outlook and the impact of leverage on our investment portfolio. The amount of any leverage that we will employ as a BDC will be subject to oversight by our Board of Directors.
We generate revenue in the form of interest on the debt securities that we hold in our portfolio companies. The senior debt we invest in generally has stated terms of three to ten years. Our senior debt investments generally bear interest at a floating rate. Interest on debt securities is generally payable quarterly or semiannually. In some cases, some of our investments may provide for deferred interest payments or payment-in-kind, or PIK, interest. The principal amount of the debt securities and any accrued but unpaid interest generally will become due at the maturity date. In addition, we may generate revenue in the form of commitment and other fees in connection with transactions, although we do not expect to do so. Original issue discount, or OID, as well as market discount and premium are accreted and amortized in determining our interest income. We record any prepayment premiums on loans and debt securities as income.
Available Information
Our address is 101 Huntington Avenue, Boston, MA 02199. Our phone number is (617) 859-1500, and our internet address is www.audaxcreditbdc.com.
2
Key Elements of Investment Strategy
We have implemented the following investment strategy:
| · | invest primarily in first lien senior secured loans and selectively in second lien loans to privately owned U.S. middle-market companies to take advantage of what we perceive to be higher pricing, more attractive structures and lower volatility than other fixed income investments, including larger, broadly syndicated loans (which we define for purposes of this annual report to be, in general, loans to companies generating substantially more than $75 million of annual EBITDA); |
| · | utilize our Adviser’s investment team’s experience in middle-market debt investing; the senior team members average 30 years of middle-market debt investing through all phases of the credit cycle; |
| · | benefit from the broad deal sourcing capabilities and due diligence insights of the platform developed by our Adviser and its affiliates, which we refer to, collectively, as Audax Group, as well as Audax Group’s primary research model and expertise in investing at each level of the capital structure of portfolio companies; |
| · | perform thorough credit analyses on investment opportunities with a focus on principal preservation and downside protection; |
| · | build a diversified portfolio of investments by company and industry; and |
| · | rigorously monitor company and portfolio performance. |
The Company lends directly to borrowers and generally structures its investments to include fixed repayment schedules and extensive contractual rights and remedies. We generally focus on cash-pay instruments that pay interest on a monthly or quarterly basis, typically with maturities of between five and seven years. Such first lien senior secured loans typically do not include equity co-investments, warrants or PIK payment terms. However, to the extent we invest in securities ranking more junior in a borrower’s capital structure, which is not a focus of our portfolio, such investments may include some or all of these attributes. Any equity co-investments, warrants or PIK instruments we hold may involve certain risks that are not applicable to the types of securities in which we typically invest. These risks include the possibility of being unsecured with respect to our claim on such investments if the portfolio company were to go bankrupt or being paid less upon such bankruptcy than we otherwise would have had such investment been in the form of a senior loan.
Like bank loans, most loans in which we invest are not rated by any rating agency. If they were rated, they would be rated as below investment grade quality. Loans rated below investment grade quality, which are often referred to as “junk” loans, are generally regarded as having predominantly speculative characteristics and may carry a greater risk with respect to a borrower’s capacity to pay interest and repay principal. Therefore, our investments may result in an above average amount of risk of volatility or loss of principal. To the extent we make investments with a deferred interest feature such as market discount, debt instruments with PIK interest and OID securities, the higher interest rates on these investments may reflect the payment deferral and an increased credit risk associated with such instruments.
We generally focus on investment opportunities that have demonstrated stability in their revenues and EBITDA. We also generally make investments that demonstrate a historical as well as projected ability to generate cash flow sufficient to service the contemplated leverage. Targeted investments typically rely upon multiple sources of cash flow and do not depend upon a single product, customer, geography, regulation, or technology.
3
We typically require a pledge of all of the tangible and intangible assets of borrowers as collateral to secure our loans. As a result, we and other lenders in such first lien senior secured loans have a first priority secured claim with respect to all tangible and intangible assets of such borrowers, including the proceeds of any sale of assets, should the borrower default on its obligations under such first lien senior secured loans. Any such claim ranks senior or effectively senior in the capital structure of our borrowers, ahead of all junior, subordinated and/or unsecured creditors, with respect to all tangible and intangible assets of such borrowers pledged as collateral to secure our loans.
Generally, our loans are priced primarily with a floating interest rate, with interest rates calculated on the basis of a fixed interest rate spread over a specified base rate. While the London Interbank Offered Rate, or LIBOR, is the most commonly used base rate, we also offer the prime rate as an option for borrowers. Our loan pricing is influenced by several factors, including the industry of the borrower, the degree of leverage of our loan and of the borrower’s overall capital structure, the equity contribution of the sponsor, if any, in the borrower’s capital, and general market conditions. We typically also include in our loan terms a yield enhancement device commonly referred to as a “LIBOR Floor.” This feature, which first appeared in the debt markets in 2008, sets a minimum rate to be used as the LIBOR or prime rate component of the loan’s interest rate calculation. As of December 31, 2019, LIBOR Floors in our loan agreements ranged from 0.00% to 1.00% per annum, as compared to the one-month and three-month LIBOR of 1.91% and 1.76%, respectively, on such date.
An additional component of return on the loans we typically purchase is an upfront or closing fee. This yield enhancement could also come in the form of a discount to the purchase price when we purchase loans in the secondary market. When in discount form, this component is a form of deferred income that we realize over time or upon final repayment of the loan. Such OID or closing fees serve to enhance the return on our investments. As of December 31, 2019, market rates for fees or OID enhanced the annual rate of return on a loan over its stated interest rate by 1.00%.
We believe our proven deal sourcing capabilities, combined with our focus on prudent lending practices, enables us to identify investments with the potential for attractive current returns and downside protection. Our focus on the middle-market should create opportunities for us to invest in companies with more conservative capital structures and higher historic recovery rates than those generally found in larger, broadly syndicated transactions.
Middle-Market Senior Loan Opportunities
Several factors drive the appeal of middle-market senior loan investment opportunities:
Borrowers are proven companies with limited access to capital. The U.S. middle-market companies in which we typically invest are seasoned companies with attractive credit profiles, including a demonstrated history of positive earnings and free cash flow. For these borrowers, however, their relatively smaller size often means they have difficulty accessing the high yield bond market or other public capital markets.
Attractive annualized returns. Because U.S. middle-market companies typically have fewer options to raise capital, we believe we can earn higher yields on loans to such companies as compared to loans to larger companies in the broadly syndicated loan market. Accordingly, we typically expect our middle-market loans to offer higher interest rate spreads, lower leverage levels, and higher historic recovery rates than broadly syndicated loans.
More favorable terms than broadly syndicated loans. We believe the market dynamics described above enable us to negotiate more conservative loan structures, with lower leverage, than comparable broadly syndicated loans.
Floating rate instruments. Middle-market loans are typically priced at a spread above LIBOR, with minimal interest rate duration. We believe floating rate instruments provide our stockholders with a level of protection against any increase in the general level of interest rates. In addition, LIBOR Floors offer protection in a low interest rate environment.
4
Low correlation with public fixed income and equities. Based on the historical performance of middle-market loan indices, we expect that our portfolio will have a relatively low correlation with the returns of public fixed income and public equities indexes.
Favorable position in capital structure with downside protection. First lien senior secured loans of the type we typically invest in have a favorable position at the top of the borrower’s capital structure. In addition, such loans are typically secured by a first priority lien on the assets of the borrowers. These factors should increase our recovery in the event of a loan default.
We believe the returns we can generate from current yield, fees, and/or OID on senior secured loans in the current credit market environment are attractive on a risk-adjusted basis and a historical basis. We also believe the changing dynamics of the lending environment over the past several years have made lending to U.S. middle-market companies an increasingly attractive investment opportunity. A multi-year trend of consolidation in the U.S. banking sector has resulted in fewer traditional lenders focused on lending to middle-market companies. As the banking industry has consolidated, banks have grown larger, and we believe the remaining banks have focused their lending activities on larger, broadly syndicated transactions to achieve the revenue and operating requirements required by their scale.
Compounding the impact of bank consolidation for U.S. middle-market borrowers, several large independent specialty finance lenders have been acquired or have exited the business. Furthermore, we believe that banks have come to depend more on the activities of private equity groups to generate leveraged loan activity. As the number and size of private equity funds has grown, the size of leveraged buyout transactions and related financing arrangements have increased commensurately. This has contributed, in turn, to pressure on banks to seek ever-larger transactions to generate fees and increase demand for other banking services.
We believe the focus of many senior loan investment strategies and of high yield managers with bank loan allocations is to acquire easily accessible broadly syndicated loans. Below we outline the key distinctions between middle-market loans and broadly syndicated loans.
Middle-market loans generally earn a premium over broadly syndicated loans. From January 2000 through December 2019, the loan spread premium of middle-market loans over broadly syndicated loans ranged between -5 basis points and 209 basis points. Over that same period, the average spread of middle-market loans was 98 basis points higher than the average spread of broadly syndicated loans. As of December 31, 2019, the interest rate spread gap was near historically wide levels, with middle-market loans earning on average 184 basis points more than broadly syndicated loans during the twelve months ended December 31, 2019.
Middle-market loans generally benefit from lower leverage. Since the beginning of 1998 through the end of 2019, the difference in the ratio of total debt to EBITDA for middle-market and broadly syndicated loans generally ranged between 0.1x and 0.9x. On average, the total debt to EBITDA ratio for middle-market loans was 0.6x lower than broadly syndicated loans during that 22-year period.
Middle-market loans have had higher recovery rates than broadly syndicated loans and bonds. Between 1987 and 2009, defaulted middle-market loans had an average recovery rate of 86%, compared to 81% for broadly syndicated loans and 64% for senior secured bonds. The largest portion of the high yield debt market, senior subordinated notes, had a 29% recovery rate during the same period. We believe these higher recovery rates resulted from conservative capital structures and loan documentation typically used for middle-market loans.
Competition
Our primary competitors in providing financing to middle-market companies include public and private funds, other BDCs, commercial and investment banks, commercial finance companies and, to the extent they provide an alternative form of financing, private equity, mezzanine and hedge funds, as well as issuers of collateral loan obligations and other structured loan funds. Many of our competitors are substantially larger and have considerably greater financial, technical and marketing resources than we do. For example, some competitors have a lower cost of funds and access to funding sources that are not available to us. Our competitors have incurred, or may in the future incur, leverage to finance their debt investments at levels or on terms more favorable than those available to us. In addition, some of our competitors have higher risk tolerances or different risk assessments than we do, which allows them to consider a wider variety of investments and establish more relationships than us. Furthermore, many of our potential competitors are not subject to the regulatory restrictions that the 1940 Act imposes and the Code imposes on us. We cannot assure you that the competitive pressures we face will not have a material adverse effect on our business, financial condition and results of operations. Also, as a result of this competition, we may not be able to take advantage of attractive investment opportunities from time to time, and we can offer no assurance that we will be able to identify and make investments that are consistent with our investment objective.
5
Among other factors, the returns on investments available in the marketplace are a function of the supply of investment opportunities and the amount of capital investing in such opportunities. Strong competition for investments could result in fewer investment opportunities for us, as our competitors may establish investment vehicles that target the same or similar investments that we typically purchase. Moreover, identifying attractive investment opportunities is difficult and involves a high degree of uncertainty.
Audax Management Company (NY), LLC
In its investment process, our Adviser utilizes a business model in which credit analysis is the priority throughout all processes, including deal sourcing, underwriting, and portfolio management. We utilize our Adviser’s seasoned team and operating platform to identify compelling investment opportunities for us. We then evaluate these opportunities through an investment approach that emphasizes strong fundamental credit analysis and rigorous portfolio monitoring. We are disciplined in selecting investments and focusing on opportunities that we perceive offer favorable risk/reward characteristics.
Our Adviser seeks to diversify our portfolio by company type, asset type, investment size and industry.
The principals of our Adviser responsible for its senior debt advisory activities have worked together at Audax Group and previously at General Electric Capital Corporation for more than 20 years, during which time they have focused on investing in senior debt issued by private middle-market companies and have invested in excess of $13.5 billion through multiple cycles. We believe that we benefit from our Adviser’s experience in originating investments for us and, (to the extent permitted by the 1940 Act and the exemptive relief that we and the Adviser have been granted from the U.S. Securities and Exchange Commission, or the SEC), co-investment opportunities.
From its inception in 2007 through the end of December 31, 2019, the senior debt business of our Adviser, or Audax Senior Debt, invested $16.2 billion of capital primarily in senior secured debt investments with selective investments in mezzanine debt and equity.
Competitive Strengths
Experienced Team and Extensive Sourcing Network. We believe that Audax Senior Debt has a competitive advantage over its middle-market investing peers given the breadth of the Audax Group platform. As part of Audax Group, Audax Senior Debt benefits from the industry-specific knowledge, extensive middle-market business relationships and established deal sourcing capabilities across the firm. In the aggregate, Audax Senior Debt, as well as the mezzanine debt and private equity businesses of Audax Group, together hold investments in over 313 middle-market companies across a wide variety of industries as of December 31, 2019.
Specifically, we believe Audax Senior Debt and the Audax Group platform provide advantages in sourcing transactions, accessing proprietary due diligence (subject to applicable confidentiality obligations), and leveraging the lengthy investing experience of the senior members of the Audax Group investment team.
| · | Sourcing—Audax Group’s mezzanine and private equity teams often get an early look at prospective middle-market merger and acquisition, or M&A, transactions in the early stages of a sale process. Given this early insight into middle-market sale transactions, our Adviser can often evaluate investment opportunities before many of its competitors. Since most of these M&A transactions have a senior debt component, we believe the Adviser’s investment team often becomes aware of senior debt lending opportunities well before other firms. |
| · | Due diligence— As of December 31, 2019, Audax Group held over [272] portfolio companies across three investment businesses. Audax Senior Debt typically has direct, proprietary access to the relevant management teams, which can provide industry insights and primary research capabilities. This helps the Adviser make more informed investment decisions. |
| · | Investing experience—As of December 31, 2019, the Co-CEOs and 40 Managing Directors of Audax Group’s debt and equity investing businesses had an average of 21 years of experience. They have successfully invested through numerous economic cycles. |
6
The Adviser’s sourcing processes and robust deal flow have enabled Audax Senior Debt to be selective and apply rigorous credit analysis on the investment opportunities it reviews. From Audax Senior Debt’s inception in December 2007 through December 31, 2019, the Audax Group platform sourced 6,663 senior debt investment opportunities and ultimately invested $16.2 billion in 658 investments (10% of opportunities sourced).
Audax Senior Debt has invested in loans with lower leverage and higher spreads. Audax Senior Debt has been able to exploit opportunities in the market for middle-market senior loans by sourcing and underwriting investments with lower leverage and higher spreads than other middle-market transactions. From inception in 2007 through December 31, 2019, investment vehicles managed by Audax Senior Debt invested in new issue loans that had an average first lien debt multiple, which compares the principal amount of the Company’s loan and any other outstanding first-lien debt of the borrower to the borrower’s EBITDA, of 4.34x and an average interest rate spread of 4.86%, which is the difference between the interest rate on the Company’s loan and the interest rate on the comparable risk-free instrument, typically the three-month LIBOR. We believe both of these measures compare favorably to broadly syndicated and other middle-market loans that have come to market during the same period.
Audax Group Platform. In addition to a large, seasoned team of investment professionals, our Adviser and its affiliates employ specialized professionals with expertise in transaction sourcing, capital markets, legal issues, and tax planning. We believe the Audax Group platform’s size, collective knowledge base, and shared experience provide a competitive advantage in middle-market lending.
Investment Process
We believe our Adviser has a disciplined and repeatable process for executing, monitoring, structuring and exiting investments. We believe the primary driver of stable, consistent returns in a senior loan portfolio is the preservation of invested capital. To accomplish this objective, our Adviser utilizes a business model where credit analysis is the priority throughout all stages of the investment process, including deal sourcing, underwriting, and portfolio management. We evaluate each investment opportunity by analyzing each borrower’s industry dynamics, quality and sustainability of earnings, management team, and capital structure.
Our Adviser focuses on credit evaluation throughout the investment process.
Initial Screening Process. Once a potential transaction is sourced, it undergoes an initial screen to determine the suitability of the investment. This assessment includes a review of the borrower’s industry and its relative position within that industry, as well as transaction-specific items such as the proposed capital structure, deal size, and expected pricing. If the results of this initial screen are positive, the next step is to proceed with detailed transaction due diligence analysis.
Transaction Underwriting. When analyzing a possible transaction, our Adviser identifies and evaluates numerous investment criteria. While these criteria are likely to be different for each investment, in general the analysis includes an in-depth review of the borrower’s industry and the underlying dynamics within that industry. The Adviser reviews numerous borrower-specific criteria such as the quality and depth of the management team, products, and end markets. Our Adviser undertakes an extensive financial analysis, including a review of historical results and projected performance. The Adviser’s investment team also scrutinizes the specific characteristics of each investment, including transaction structure, investment collateral, overall transaction economics, and the maturity of the contemplated facilities.
Portfolio Management. The Adviser reviews investment performance on a regular basis to evaluate whether each investment is delivering the expected results. For each investment, portfolio monitoring processes measure the borrower’s current and projected financial performance versus historical performance, with emphasis on financial results since the funding of the investment. As part of the Adviser’s financial performance evaluation, it monitors, among other items, the borrower’s historical, current and projected covenant compliance. Additionally, the Adviser maintains communication with other lenders, borrowers, and sponsors, and manages any requested amendments or waivers.
7
Industry Dynamics. The Adviser evaluates criteria such as market size, participants, and barriers to entry, as well as the competitive position of the potential borrower. We invest in established businesses with leading market positions that the Adviser believes are defensible against potential new entrants and that demonstrate strong potential for organic growth. Attributes of targeted investments may include low-cost manufacturing, product expertise, proprietary technology or distribution capability, and strong customer relationships.
Quality and Sustainability of Earnings. We focus on investment opportunities that have demonstrated stability in their revenues and EBITDA. We make investments in companies that demonstrate a historical as well as projected ability to generate cash flow sufficient to service the contemplated leverage. Targeted investments typically rely upon multiple sources of cash flow and do not depend upon a single product, customer, geography, regulation, or technology.
Company Management. We invest in companies where senior management teams have demonstrated operating experience. Borrowers’ management teams are expected to play a key role in growing their businesses, to have a firm grasp on the competitive dynamics and business trends affecting their industries, to have demonstrated an ability to manage costs, and to have a well-defined vision and strategy for their company’s future success.
Capital Structure. Appropriate capitalization is a critical factor in a company’s ability to weather economic, industry, or company-specific downturns. Therefore, we seek to invest in transactions that are prudently leveraged relative to a company’s current and projected cash flow generating capability and underlying asset and enterprise value. Our Adviser’s due diligence focuses on industry dynamics and a company’s future cash needs. Key metrics that the Adviser generally reviews when analyzing capitalization include:
| · | leverage ratios with respect to senior debt and total debt; |
| · | interest expense coverage ratios, which measure the ability of the company to pay interest on its debt obligations; and |
| · | fixed charge coverage ratios, which measure the ability of the company to service annual financial obligations, including interest expense, loan principal payments, and capital expenditures. |
8
Investments
We seek to create a portfolio that is primarily composed of first lien senior secured loans and select second lien loans by making investments generally in the range of $1.0 million to $4.0 million in privately owned, U.S.-based middle-market companies. Set forth below is a list of our ten largest investments as of December 31, 2019 and 2018, as well as the top ten industries in which we were invested as of December 31, 2019 and 2018, in each case calculated as a percentage of our total investments at fair value as of such dates.
| December 31, 2019 | ||||||||
| Portfolio Company | Fair Value | Percentage of Total Investments | ||||||
| CIBT 2017 | $ | 5,370,023 | 1.62 | % | ||||
| Radiology Partners 2018 | 5,211,317 | 1.58 | ||||||
| Pathway Partners 2019 | 4,943,770 | 1.49 | ||||||
| MedRisk 2018 | 4,550,000 | 1.38 | ||||||
| Specialty Care | 4,184,597 | 1.26 | ||||||
| Veritext | 4,166,951 | 1.26 | ||||||
| CoAdvantage 2019 | 3,970,050 | 1.20 | ||||||
| CPI International 2019 | 3,970,000 | 1.20 | ||||||
| Qlik Technologies | 3,950,150 | 1.19 | ||||||
| RevSpring | 3,950,100 | 1.19 | ||||||
| $ | 44,266,959 | 13.37 | % | |||||
| December 31, 2018 | ||||||||
| Portfolio Company | Fair Value | Percentage of Total Investments | ||||||
| Radiology Partners | $ | 4,019,924 | 1.52 | % | ||||
| Odyssey Logistics & Technology | 3,947,706 | 1.49 | ||||||
| Young Innovations | 3,921,880 | 1.48 | ||||||
| CoAdvantage | 3,915,500 | 1.48 | ||||||
| Beaver-Visitec | 3,914,043 | 1.48 | ||||||
| RevSpring | 3,491,250 | 1.32 | ||||||
| Plaskolite | 3,482,500 | 1.32 | ||||||
| Mavis | 3,468,978 | 1.31 | ||||||
| Navicure | 3,457,575 | 1.31 | ||||||
| Syncsort | 3,452,017 | 1.30 | ||||||
| $ | 37,071,373 | 14.01 | % | |||||
9
| December 31, 2019 | ||||||||
| Industry | Fair Value | Percentage of Total Investments | ||||||
| Healthcare & Pharmaceuticals | $ | 76,108,451 | 23.00 | % | ||||
| High Tech Industries | 58,327,844 | 17.63 | ||||||
| Services: Business | 44,376,771 | 13.41 | ||||||
| Chemicals, Plastics & Rubber | 28,747,162 | 8.69 | ||||||
| Services: Consumer | 25,757,966 | 7.78 | ||||||
| Aerospace & Defense | 12,911,355 | 3.90 | ||||||
| Banking, Finance, Insurance & Real Estate | 10,766,682 | 3.25 | ||||||
| Consumer Goods: Non-durable | 8,472,022 | 2.56 | ||||||
| Containers, Packaging & Glass | 7,941,602 | 2.40 | ||||||
| Capital Equipment | 7,720,891 | 2.33 | ||||||
| $ | 281,130,746 | 84.95 | % | |||||
| December 31, 2018 | ||||||||
| Industry | Fair Value | Percentage of Total Investments | ||||||
| Healthcare & Pharmaceuticals | $ | 47,520,070 | 17.95 | % | ||||
| High Tech Industries | 45,031,546 | 17.01 | ||||||
| Services: Business | 36,858,954 | 13.93 | ||||||
| Chemicals, Plastics & Rubber | 27,716,784 | 10.47 | ||||||
| Services: Consumer | 15,942,194 | 6.02 | ||||||
| Banking, Finance, Insurance & Real Estate | 12,125,388 | 4.58 | ||||||
| Transportation: Cargo | 9,133,648 | 3.45 | ||||||
| Wholesale | 8,518,879 | 3.22 | ||||||
| Consumer Goods: Non-durable | 7,914,631 | 2.99 | ||||||
| Capital Equipment | 7,256,899 | 2.74 | ||||||
| $ | 218,018,993 | 82.36 | % | |||||
Investment Committee
The purpose of our Adviser’s investment committee, or the Investment Committee, is to evaluate and approve all investments by our Adviser. The Investment Committee includes Michael McGonigle, Kevin Magid, Geoffrey Rehnert and Marc Wolpow. The Investment Committee review process is intended to bring the diverse experience and perspectives of the committee members to the analysis and consideration of every investment. We believe this process provides consistency to our Adviser’s investment philosophy and policies. The Investment Committee also determines appropriate investment size and mandates ongoing monitoring requirements. No member of the Investment Committee serves as the lead portfolio manager, and its members are equally responsible for the management of the Company’s portfolio.
10
In addition to reviewing investments, the Investment Committee meetings serve as a forum to discuss credit views and outlooks. Potential transactions and deal flow are also reviewed on a regular basis. Members of the Investment Committee are encouraged to share information and views on credits with the committee early in their analysis. This process improves the quality of the analysis and enables the deal team members to work more efficiently.
Investment Committee Compensation
The compensation of the members of the Investment Committee paid by our Adviser includes an annual base salary, in certain cases an annual bonus based on an assessment of short-term and long-term performance, and a portion of the incentive fees, including the Incentive Fee (if any), to be paid to our Adviser, determined on the same basis as the annual bonus. In addition, certain of our Investment Committee members that are not on our Board of Directors have equity interests in our Adviser and Administrator, and may receive distributions of profits in respect of those interests.
Operating and Regulatory Structure
We have elected to be treated as a BDC under the 1940 Act. As a BDC, we are generally prohibited from acquiring assets other than qualifying assets unless, after giving effect to any acquisition, at least 70% of our total assets are qualifying assets. Qualifying assets generally include securities of eligible portfolio companies, cash, cash equivalents, U.S. government securities and high-quality debt instruments maturing in one year or less from the time of investment. Under the rules of the 1940 Act, “eligible portfolio companies” include (i) private U.S. operating companies, (ii) public U.S. operating companies whose securities are not listed on a national securities exchange (e.g., the New York Stock Exchange) or registered under the Securities Exchange Act of 1934, as amended, or the Exchange Act, and (iii) public U.S. operating companies having a market capitalization of less than $250 million. Public U.S. operating companies whose securities are quoted on the over-the-counter bulletin board and through OTC Markets Group Inc. are not listed on a national securities exchange and therefore are eligible portfolio companies.
We have elected to be treated as a RIC under Subchapter M of the Code. As a RIC, we generally are not subject to corporate-level U.S. federal income taxes on any ordinary income or capital gains that we distribute as dividends to our stockholders. To qualify and maintain our qualification as a RIC, we must, among other things, meet certain source-of-income, distribution and asset diversification requirements. We intend to timely distribute to our stockholders substantially all of our taxable income each taxable year, except that we may retain all or a portion of our net capital gains for reinvestment and, depending upon the level of taxable income earned in a taxable year, we may choose to carry forward all or a portion of our taxable income for distribution in the following taxable year and incur any applicable U.S. federal excise tax.
Risk Management
Broad Diversification. We have diversified and intend to continue to diversify our transactions by company, asset type, investment size, industry and geography within the United States. Once we have fully invested the proceeds from any offering of the Shares, we expect that each individual investment will not exceed approximately five percent of our total assets and that the size of our individual investments will vary proportionately with the size of our capital base. Furthermore, we must meet certain diversification tests in order to qualify as a RIC for U.S. federal income tax purposes. See “Item 1. Business — Material U.S. Federal Income Tax Considerations.”
Rigorous Due Diligence. As noted above, our Adviser’s systematic underwriting process involves exhaustive in-house due diligence, applicable third-party consulting reports and multiple stages of investment approval, with a goal of risk mitigation during and after transaction execution.
Administrator
We have entered into an administration agreement, or the Administration Agreement, with Audax Management Company, LLC, who serves as our Administrator and provides us with office space, office services and equipment. The responsibilities of our Administrator include overseeing our financial records, preparing reports to our investors and, as applicable, reports filed with the SEC. Our Administrator also generally monitors the payment of our expenses and the performance of administrative and professional services rendered to us by others. Our Administrator is reimbursed for certain administrative expenses it incurs on our behalf, and has entered into a fee waiver agreement with us pursuant to which the Administrator may waive, in whole or in part, its entitlement to receive reimbursements from us. The Adviser is a wholly-owned subsidiary of our Administrator.
11
License Agreement
We have entered into a license agreement with an affiliate of the Adviser under which such affiliate has granted us a non-exclusive, royalty-free license to use the name “Audax” for specified purposes in our business. Under this agreement, we have a right to use the “Audax” name, subject to certain conditions, for so long as our Adviser or one of its affiliates remains our investment adviser. Other than with respect to this limited license, we have no legal right to the “Audax” name.
Investment Advisory Agreement
We have entered into the Investment Advisory Agreement with our Adviser. Pursuant to the Investment Advisory Agreement with our Adviser, we pay our Adviser a fee for investment advisory and management services consisting of two components — a base management fee and an Incentive Fee. Our Adviser may, from time-to-time, grant waivers on our obligations, including waivers of the base management fee and/or Incentive Fee, under the Investment Advisory Agreement. We also entered into a management fee waiver agreement with our Adviser on July 8, 2015, or the Waiver Agreement, which we or the Adviser may terminate upon 60 days’ prior written notice.
Base Management Fee
The base management fee is calculated at an annual rate of 1.00% of the value of our gross assets. Pursuant to the Waiver Agreement, the Adviser has agreed to waive the right to receive the base management fee to the extent necessary so that the base management fee payable under the Investment Advisory Agreement equals, and is calculated in the same manner as if, the base management fee otherwise payable by the Company were calculated at an annual rate equal to 0.65% (instead of an annual rate of 1.00%).
Incentive Fee
The Incentive Fee has two parts: The first part is calculated and payable quarterly in arrears based on our pre-incentive fee net investment income for the immediately preceding calendar quarter. For this purpose, pre-incentive fee net investment income means interest income, dividend income and any other income (including any other fees (other than fees for providing managerial assistance), such as commitment, origination, structuring, diligence and consulting fees or other fees that we receive from portfolio companies) accrued during the calendar quarter, minus our operating expenses accrued for the quarter (including the base management fee, expenses payable under the Administration Agreement, and any interest expense on any credit facilities or outstanding debt and dividends paid on any issued and outstanding preferred stock, but excluding the Incentive Fee).
Incentive Fee on Pre-Incentive Fee Net Investment Income
We determine pre-incentive fee net investment income in accordance with U.S. Generally Accepted Accounting Principles, or GAAP, including, in the case of investments with a deferred interest feature, such as OID, debt instruments with PIK, interest and zero coupon securities, accrued income that we have not yet received in cash. Pre-incentive fee net investment income does not include any realized capital gains, computed net of all realized capital losses or unrealized capital appreciation or depreciation. Pre-incentive fee net investment income, expressed as a rate of return on the value of our net assets at the end of the immediately preceding calendar quarter, is compared to a hurdle of 1.0% per quarter (4.0% annualized). We determine our average gross assets during each fiscal quarter and calculate the base management fee payable with respect to such amount at the end of each fiscal quarter. As a result, a portion of our net investment income is included in our gross assets for the period between the date on which such income is earned and the date on which such income is distributed. Therefore, our net investment income used to calculate part of the Incentive Fee is also included in the amount of our gross assets used to calculate the 1.0% annual base management fee. We pay our Adviser an Incentive Fee with respect to our pre-incentive fee net investment income in each calendar quarter as follows:
12
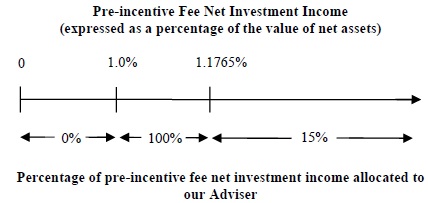
| · | no amount is paid on the income-portion of the Incentive Fee in any calendar quarter in which our pre-incentive fee net investment income does not exceed the hurdle of 1.0% (4.0% annualized); |
| · | 100.0% of our pre-incentive fee net investment income with respect to that portion of such pre-incentive fee net investment income, if any, that exceeds the hurdle rate but is less than 1.1765 % in any calendar quarter (4.706% annualized). We refer to this portion of our pre-incentive fee net investment income (which exceeds the hurdle rate but is less than 1.1765%) as the “catch-up” provision. The catch-up is meant to provide our Adviser with 15.0% of the pre-incentive fee net investment income as if a hurdle rate did not apply if this net investment income exceeds 1.1765% in any calendar quarter (4.706% annualized); and |
| · | 15.0% of the amount of our pre-incentive fee net investment income, if any, that exceeds 1.1765% in any calendar quarter (4.706% annualized) is payable to our Adviser. |
The following is a graphical representation of the calculation of the income-related portion of the Incentive Fee on a quarterly basis:
These calculations are pro-rated for any period of less than three months and adjusted for any Share issuances or repurchases during the relevant quarter. You should be aware that a rise in the general level of interest rates can be expected to lead to higher interest rates applicable to our debt investments. Accordingly, an increase in interest rates would make it easier for us to meet or exceed the hurdle rate and may result in a substantial increase of the amount of Incentive Fees payable to our Adviser with respect to pre-incentive fee net investment income.
Pursuant to the Waiver Agreement, the Adviser has agreed to waive its right to receive the Incentive Fee on pre-incentive fee net investment income to the extent necessary so that such Incentive Fee equals, and is calculated in the same manner as, the corresponding Incentive Fee on pre-incentive fee net investment income, if such Incentive Fee (i) were calculated based upon the Adviser receiving 10% (instead of 15%) of the applicable pre-incentive fee net investment income and (ii) did not include any “catch-up” feature in favor of the Adviser.
Incentive Fee on Capital Gains
The second part of the Incentive Fee is determined and payable in arrears as of the end of each calendar year (or upon termination of the Investment Advisory Agreement, as of the termination date), and equals 15% of our realized capital gains, if any, on a cumulative basis from June 16, 2015, the date of effectiveness of our registration statement on Form 10 (file no. 000-55426), or the Registration Statement, through the end of each calendar year, computed net of all realized capital losses and unrealized capital depreciation on a cumulative basis, less the aggregate amount of any previously paid capital gain Incentive Fees with respect to each of the investments in our portfolio. However, the Incentive Fee determined as of December 31, 2015 was calculated for a period of shorter than 12 calendar months (commencing on the date of effectiveness of the Registration Statement through December 31, 2015) to take into account any realized capital gains computed net of all realized capital losses and unrealized capital depreciation from the date of effectiveness of the Registration Statement.
13
Pursuant to the Waiver Agreement, the Adviser has agreed to waive the right to receive the Incentive Fee on capital gains to the extent necessary so that such portion of the Incentive Fee equals, and is calculated in the same manner as, the corresponding Incentive Fee on capital gains, if such portion of the Incentive Fee were calculated based upon the Adviser receiving 10% (instead of 15%).
In addition, pursuant to the Waiver Agreement, the Adviser has agreed to waive the right to receive both components of the Incentive Fee to the extent necessary so that it does not receive Incentive Fees which are attributable to income and gains of the Company that exceed an annualized rate of 12% in any calendar quarter.
The sum of the incentive fee on pre-incentive fee net investment income and incentive fee on capital gains is the Incentive Fee.
Examples of Quarterly Incentive Fee Calculation
Example 1: Income Related Portion of Incentive Fee (*):
Alternative 1
Assumptions
Investment income (including interest, dividends, fees, etc.) = 1.0%
Hurdle rate(1) = 1.0%
Management fee(2) = 0.25%
Other expenses (legal, accounting, custodian, transfer agent, etc.)(3) = 0.15%
Pre-incentive fee net investment income
(investment income – (management fee + other expenses)) = 0.60%
Pre-incentive net investment income does not exceed hurdle rate, therefore there is no incentive fee.
Alternative 2
Assumptions
Investment income (including interest, dividends, fees, etc.) = 1.5%
Hurdle rate(1) = 1.0%
Management fee(2) = 0.25%
Other expenses (legal, accounting, custodian, transfer agent, etc.)(3) = 0.15%
Pre-incentive fee net investment income
(investment income – (management fee + other expenses)) = 1.1%, which exceeds the hurdle rate
Incentive fee = 15% × pre-incentive fee net investment income, subject to the “catch-up”(4)
= 100% x (1.10%- 1.0%)
= 0.10%
Alternative 3
Assumptions
Investment income (including interest, dividends, fees, etc.) = 2.0%
Hurdle rate(1) = 1.0%
Management fee(2) = 0.25%
Other expenses (legal, accounting, custodian, transfer agent, etc.)(3) = 0.15%
Pre-incentive fee net investment income
(investment income – (management fee + other expenses)) = 1.60%
Incentive fee = 15% × pre-incentive fee net investment income, subject to “catch-up”(4)
= 100% × “catch-up” + (15% × (pre-incentive fee net investment income –1.1765%))
14
Catch-up = 1.1765% – 1.0% = 0.1765%
Incentive fee = (100% × 0.1765%) + (15% × (1.60% –1.1765%))
= 0.1765% + (15% × 0.4235%)
= 0.1765% + 0.063525%
= 0.24%
| (*) | The hypothetical amount of pre-incentive fee net investment income shown is based on a percentage of total net assets. |
| (1) | Represents 4.0% annualized hurdle rate. |
| (2) | Represents 1% annualized management fee. |
| (3) | Excludes organizational and offering expenses. |
| (4) | The “catch-up” provision is intended to provide our Adviser with an Incentive Fee of approximately 15.0% on all of our pre-incentive fee net investment income as if a hurdle rate did not apply when our net investment income exceeds 1.1765% in any calendar quarter (4.706% annualized). |
Example 2: Capital Gains Portion of Incentive Fee:
Alternative 1
Assumptions
| · | Year 1: $20 million investment made in Company A (“Investment A”), and $30 million investment made in Company B (“Investment B”) | |
| · | Year 2: Investment A sold for $50 million and fair market value (“FMV”) of Investment B determined to be $32 million | |
| · | Year 3: FMV of Investment B determined to be $25 million | |
| · | Year 4: Investment B sold for $31 million |
The capital gains portion of the Incentive Fee, if any, would be:
| · | Year 1: None |
| · | Year 2: $4.5 million capital gains incentive fee |
$30 million realized capital gains on sale of Investment A multiplied by 15%
| · | Year 3: None |
$3.75 million cumulative fee (15% multiplied by $25 million ($30 million cumulative capital gains less $5 million cumulative capital depreciation)) less $4.5 million (previous capital gains fee paid in Year 2)
| · | Year 4: $150,000 capital gains incentive fee |
$4.65 million cumulative fee ($31 million cumulative realized capital gains multiplied by 15%) less $4.5 million (previous capital gains fee paid in Year 2)
Alternative 2
Assumptions
| · | Year 1: $20 million investment made in Company A (“Investment A”), $30 million investment made in Company B (“Investment B”) and $25 million investment made in Company C (“Investment C”) | |
| · | Year 2: Investment A sold for $50 million, FMV of Investment B determined to be $25 million and FMV of Investment C determined to be $25 million | |
| · | Year 3: FMV of Investment B determined to be $27 million and Investment C sold for $30 million | |
| · | Year 4: FMV of Investment B determined to be $35 million | |
| · | Year 5: Investment B sold for $20 million |
15
The capital gains portion of the Incentive Fee, if any, would be:
| · | Year 1: None |
| · | Year 2: $3.75 million capital gains incentive fee |
15% multiplied by $25 million ($30 million realized capital gains on sale of Investment A less $5 million unrealized capital depreciation on Investment B)
| · | Year 3: $1,050,000 capital gains incentive fee |
$4.8 million cumulative fee (15% multiplied by $32 million ($35 million cumulative realized capital gains less $3 million unrealized capital depreciation)) less $3.75 million (previous capital gains fee paid in Year 2)
| · | Year 4: None |
| · | Year 5: None |
$3.75 million cumulative fee (15% multiplied by $25 million ($35 million cumulative realized capital gains less $10 million realized capital losses)) less $4.8 million (previous cumulative capital gains fee paid in Year 2 and Year 3)
Valuation of Investments
We conduct the valuation of our investments, pursuant to which our net asset value is determined, at all times consistent with GAAP and the 1940 Act. Our Board of Directors, with the assistance of our Audit Committee, determines the fair value of our investments, for investments with a public market and for investments with no readily available public market, on at least a quarterly basis, in accordance with the terms of Topic 820 of the Financial Accounting Standards Board’s Accounting Standards Codification, “Fair Value Measurement and Disclosures,” or ASC 820. Our valuation procedures are set forth in more detail below.
ASC 820 defines fair value as “the price that would be received to sell an asset or paid to transfer a liability in an orderly transaction between market participants at the measurement date.” Fair value is a market-based measurement, not an entity-specific measurement. For some assets and liabilities, observable market transactions or market information might be available. For other assets and liabilities, observable market transactions and market information might not be available. However, the objective of a fair value measurement in both cases is the same – to estimate the price when an orderly transaction to sell the asset or transfer the liability would take place between market participants at the measurement date under current market conditions (that is, an exit price at the measurement date from the perspective of a market participant that holds the asset or owes the liability).
ASC 820 establishes a hierarchal disclosure framework which ranks the observability of inputs used in measuring financial instruments at fair value. The observability of inputs is impacted by a number of factors, including the type of financial instruments and their specific characteristics. Financial instruments with readily available quoted prices, or for which fair value can be measured from quoted prices in active markets, generally will have a higher degree of market price observability and a lesser degree of judgment applied in determining fair value.
The three-level hierarchy for fair value measurement is defined as follows:
Level 1 — Inputs to the valuation methodology are quoted prices available in active markets for identical financial instruments as of the measurement date. The types of financial instruments in this category include unrestricted securities, including equities and derivatives, listed in active markets. We do not adjust the quoted price for these instruments, even in situations where we hold a large position, and a sale could reasonably be expected to impact the quoted price.
Level 2 — Inputs to the valuation methodology are quoted prices in markets that are not active or for which all significant inputs are either directly or indirectly observable as of the measurement date. The types of financial instruments in this category include less liquid and restricted securities listed in active markets, securities traded in markets that are not active, government and agency securities, and certain over-the-counter derivatives where the fair value is based on observable inputs.
Level 3 — Inputs to the valuation methodology are unobservable and significant to the overall fair value measurement, and include situations where there is little, if any, market activity for the investment. The inputs into the determination of fair value require significant management judgment or estimation. The types of financial instruments in this category include investments in privately held entities, non-investment grade residual interests in securitizations, collateralized loan obligations, and certain over-the-counter derivatives where the fair value is based on unobservable inputs.
16
In certain cases, the inputs used to measure fair value may fall into different levels of the fair value hierarchy. In such cases, the determination of which category within the fair value hierarchy is appropriate for any given financial instrument is based on the lowest level of input that is significant to the fair value measurement. Assessment of the significance of a particular input to the fair value measurement in its entirety requires judgment and considers factors specific to the financial instrument.
Pursuant to the framework set forth above, we value securities traded in active markets on the measurement date by multiplying the exchange closing price of such traded securities/instruments by the quantity of shares or amount of the instrument held. We may also obtain quotes with respect to certain of our investments from pricing services, brokers or dealers’ quotes, or counterparty marks in order to value liquid assets that are not traded in active markets.
Pricing services aggregate, evaluate and report pricing from a variety of sources including observed trades of identical or similar securities, broker or dealer quotes, model-based valuations and internal fundamental analysis and research. When doing so, we determine whether the quote obtained is sufficient according to GAAP to determine the fair value of the security. If determined adequate, we use the quote obtained.
Securities that are illiquid or for which the pricing source does not provide a valuation or methodology or provides a valuation or methodology that, in the judgment of our Board of Directors, does not represent fair value, are each valued as of the measurement date using all techniques appropriate under the circumstances and for which sufficient data are available. These valuation techniques vary by investment but include comparable public market valuations, comparable precedent transaction valuations and discounted cash flow analyses. The process used to determine the applicable value is as follows: (i) each portfolio company or investment is initially valued by the investment professionals of the Adviser responsible for the portfolio investment using a standardized template designed to approximate fair market value based on observable market inputs and updated credit statistics and unobservable inputs; (ii) preliminary valuation conclusions are documented and discussed with our senior management and members of our Adviser’s valuation team; (iii) our Audit Committee reviews the assessments of the Adviser and provides our Board of Directors with recommendations with respect to the fair value of the investments in our portfolio; and (iv) our Board of Directors discusses the valuation recommendations of our Audit Committee and determines the fair value of the investments in our portfolio in good faith based on the input of the Adviser and in accordance with our valuation policy.
Our Audit Committee’s recommendation of fair value is generally based on its assessment of the following factors, as relevant:
| · | the nature and realizable value of any collateral; |
| · | call features, put features and other relevant terms of debt; |
| · | the portfolio company’s ability to make payments; |
| · | the portfolio company’s actual and expected earnings and discounted cash flow; |
| · | prevailing interest rates for like securities and expected volatility in future interest rates; |
| · | the markets in which the portfolio company does business and recent economic and/or market events; and |
| · | comparisons to publicly traded securities. |
17
Investment performance data utilized are the most recently available as of the measurement date, which in many cases may reflect up to a one quarter lag in information.
Securities for which market quotations are not readily available or for which a pricing source is not sufficient may include the following:
| · | private placements and restricted securities that do not have an active trading market; |
| · | securities whose trading has been suspended or for which market quotes are no longer available; |
| · | debt securities that have recently gone into default and for which there is no current market; |
| · | securities whose prices are stale; and |
| · | securities affected by significant events. |
Our Board of Directors is responsible for the determination, in good faith, of the fair value of our portfolio investments.
Determination of fair value involves subjective judgments and estimates. Accordingly, the notes to our financial statements express the uncertainty with respect to the possible effect of such valuations, and any change in such valuations, on our financial statements.
Security transactions are recorded on the trade date (the date the order to buy or sell is executed or, in the case of privately issued securities, the closing date, which is when all terms of the transactions have been defined). Realized gains and losses on investments are determined based on the identified cost method.
Refer to Note 3 — Investments in the notes to our accompanying financial statements included elsewhere in this annual report for additional information regarding fair value measurements and our application of ASC 820.
Advisory and Administrative Services
We do not currently have any employees. Our day-to-day investment operations are managed by our Adviser, and our Administrator provides services necessary to conduct our business. No compensation is paid directly by us to any interested director or executive officer of the Company. We pay our Adviser our allocable portion of overhead and other expenses incurred by our Administrator in performing its obligations under the Administration Agreement, including rent and our allocable portion of the cost of our Chief Financial Officer and Chief Compliance Officer and their respective staffs. Messrs. Magid and McGonigle, as Managing Directors, have general oversight responsibility for Audax Senior Debt. Mr. McGonigle joined Audax Group in 2007 and manages the activities of Audax Senior Debt. He has over 29 years of experience in sourcing, underwriting, and managing the type of loans and other securities purchased by Audax Senior Debt. Mr. McGonigle leads a team of ten seasoned debt investment professionals. In addition, the Audax Senior Debt team is supported by experienced finance, accounting, legal, operations and investor relations professionals as a part of the Audax Group platform and the Administrator’s proposed services to the Company. Our Adviser may hire additional investment professionals in the future.
18
Material U.S. Federal Income Tax Considerations
The following discussion is a general summary of the material U.S. federal income tax considerations applicable to us and to an investment in our Shares. This summary does not purport to be a complete description of the income tax considerations applicable to such an investment. For example, we have not described tax consequences that may be relevant to certain types of holders subject to special treatment under U.S. federal income tax laws, including stockholders subject to the alternative minimum tax, or AMT, tax-exempt organizations, insurance companies, dealers in securities, a trader in securities that elects to use a mark-to-market method of accounting for its securities holdings, pension plans and trusts, financial institutions, U.S. expatriates, U.S. persons with a functional currency other than the U.S. dollar, “controlled foreign corporations,” “passive foreign investment companies,” or corporations that accumulate earnings to avoid U.S. federal income tax. This summary assumes that investors hold our Common Stock as capital assets (within the meaning of the Code). The discussion is based upon the Code, U.S. Department of the Treasury, or Treasury, regulations, and administrative and judicial interpretations, each as of the date of this annual report and all of which are subject to change, possibly retroactively, which could affect the continuing validity of this discussion. This summary does not discuss any aspects of U.S. estate or gift tax or foreign, state or local tax. It does not discuss the special treatment under U.S. federal income tax laws that could result if we invested in tax-exempt securities or certain other investment assets.
For purposes of this discussion, a “U.S. stockholder” generally is a beneficial owner of Shares who is for U.S. federal income tax purposes:
| · | an individual who is a citizen or resident of the United States; |
| · | a corporation or other entity treated as a corporation, for U.S. federal income tax purposes, created or organized in or under the laws of the United States, any state thereof, or the District of Columbia; |
| · | a trust if a court within the United States can exercise primary supervision over its administration and one or more U.S. persons have the authority to control all of its substantial decisions (or a trust that has made a valid election to be treated as a U.S. person); or |
| · | an estate, the income of which is subject to U.S. federal income taxation regardless of its source. |
For purposes of this discussion, a “Non-U.S. stockholder” generally is a beneficial owner of the Shares who is not a U.S. stockholder.
If a partnership (including an entity treated as a partnership for U.S. federal income tax purposes) holds the Shares, the tax treatment of a partner in the partnership will generally depend upon the status of the partner and the activities of the partnership. A prospective stockholder that is a partner of a partnership holding the Shares should consult its tax advisers with respect to the partnership’s purchase, ownership and disposition of the Shares.
Tax matters are complicated and the tax consequences to an investor of an investment in the Shares will depend on the facts of its particular situation. Moreover, prospective investors should recognize that the present U.S. federal tax treatment of an investment in the Shares may be modified by legislative, judicial or administrative action at any time, and that any such action may have retroactive effect, and such modifications could adversely affect the tax consequences of investing in our Common Stock. We encourage investors to consult their tax advisers regarding the specific consequences of such an investment, including tax reporting requirements, the applicability of U.S. federal, state, local and foreign tax laws, eligibility for the benefits of any applicable tax treaty and the effect of any possible changes in the tax laws.
Election to be Taxed as a RIC
We have elected to be treated as a RIC under Subchapter M of the Code. As a RIC, we generally will not be subject to corporate-level U.S. federal income taxes on any ordinary income or capital gains that we distribute as dividends to our stockholders. To qualify and maintain our qualification as a RIC, we must, among other things, meet certain source-of-income and asset diversification requirements (as described below). In addition, in order to obtain RIC tax treatment, we must distribute dividends to our stockholders, in respect of each taxable year, generally of an amount at least equal to 90% of our “investment company taxable income,” which is generally defined as the sum of our net ordinary taxable income plus the excess of realized net short-term capital gains over realized net long-term capital losses, determined without regard to any deduction for dividends paid, or the Annual Distribution Requirement.
19
Taxation as a Regulated Investment Company
If we:
| · | qualify as a RIC; and |
| · | satisfy the Annual Distribution Requirement, |
then we will not be subject to U.S. federal income tax on the portion of our taxable income (including capital gains) we distribute (or are deemed to distribute) as dividends to stockholders. We are subject to U.S. federal income tax at regular corporate rates on any income or capital gains not distributed (or deemed distributed) to our stockholders.
As a RIC, we are subject to a 4% nondeductible U.S. federal excise tax on certain undistributed income and gains if we fail to distribute dividends in a timely manner to stockholders in respect of each calendar year of an amount at least equal to the sum of (1) 98% of our net ordinary income (taking into account certain deferrals and elections) for the calendar year, (2) 98.2% of the excess of our capital gains over capital losses, or capital gain net income (adjusted for certain net ordinary losses), for the one-year period ending October 31 of that calendar year and (3) any net ordinary income or capital gain net income recognized, but not distributed, in preceding years, or the Excise Tax Avoidance Requirement. For this purpose, however, any net ordinary income or capital gain net income retained by us and on which we incurred corporate income tax for the taxable year ending in that calendar year will be considered to have been distributed by calendar year end (or earlier if estimated taxes are paid). We intend to make sufficient distributions each year to satisfy the Excise Tax Avoidance Requirement.
We may incur in the future such excise tax on all or a portion of our income and capital gains. While we intend to distribute income and capital gains to minimize exposure to the 4% excise tax, we may not be able to, or may choose not to, distribute amounts sufficient to avoid the imposition of the tax entirely. In that event, we generally will be liable for the excise tax only on the amount by which we do not meet the Excise Tax Avoidance Requirement.
In order to qualify as a RIC for U.S. federal income tax purposes, we must:
| · | continue to qualify as a BDC under the 1940 Act at all times during each taxable year; |
| · | derive in each taxable year at least 90% of our gross income from dividends, interest, payments with respect to loans of certain securities, gains from the sale of stock or other securities or foreign currencies, net income from certain “qualified publicly traded partnerships,” or other income derived with respect to our business of investing in such stock or other securities, or foreign currencies, or the 90% Income Test; and |
| · | diversify our holdings so that at the end of each quarter of the taxable year: |
| o | at least 50% of the value of our assets consists of cash, cash equivalents, U.S. government securities, securities of other RICs, and other securities if such other securities of any one issuer do not represent more than 5% of the value of our assets or more than 10% of the outstanding voting securities of the issuer; and |
| o | no more than 25% of the value of our assets is invested in the securities, other than U.S. government securities or securities of other RICs, of one issuer, of two or more issuers that are controlled, as determined under applicable Code rules, by us and that are engaged in the same or similar or related trades or businesses, or of certain “qualified publicly traded partnerships,” or the Diversification Tests. |
Some of the income that we might otherwise earn, such as certain fees earned with respect to our investments, income recognized in a work-out or restructuring of a portfolio investment, or income recognized from an equity investment in an operating partnership, may not be qualifying income under the 90% Income Test. To manage the risk that such income might disqualify us as a RIC for failure to satisfy the 90% Income Test, one or more subsidiary entities treated as U.S. corporations for U.S. federal income tax purposes may be employed to earn such income and (if applicable) hold the related asset. Such subsidiary entities generally will be required to incur U.S. federal income tax as well as may be required to pay state or local tax on their earnings, which ultimately will reduce the yield to our stockholders on such fees and income.
20
We may in the future decide to pay a portion of our dividends in our stock. A distribution payable in stock or cash at the election of shareholders is treated as a dividend so long as certain requirements are satisfied. If the total distribution to shareholders electing to receive cash would exceed the total amount of cash to be distributed, each shareholder electing to receive the distribution in cash will be considered to have received a proportionate share of the cash to be distributed. Taxable stockholders receiving such distributions are required to include the full amount of the distribution (including the portion payable in stock) as ordinary income (or as long-term capital gain to the extent such distribution is properly reported as a capital gain dividend) to the extent of our current and accumulated earnings and profits for U.S. federal income tax purposes. As a result, a U.S. stockholder may be required to incur tax with respect to such distributions in excess of any cash received. If a U.S. stockholder sells the stock it receives as a distribution in order to pay this tax, the sales proceeds may be less than the amount included in income with respect to the distribution.
For U.S. federal income tax purposes, we may be required to recognize taxable income in circumstances in which we do not currently receive cash in respect of such income. For example, if we hold debt instruments that are treated under applicable tax rules as having OID (which may arise if we receive warrants in connection with the origination of a loan or possibly in other circumstances), we must include in income each taxable year a portion of the OID that accrues over the life of the instrument, regardless of whether cash in respect of such income is received by us in the same taxable year. We may also have to include in income other amounts that we have not yet received in cash, such as contractual PIK interest (which represents contractual interest added to the loan balance and due at the end of the loan term) and deferred loan origination fees that are paid after origination of the loan or are paid in non-cash compensation such as warrants or stock. Because any OID or other amounts accrued is included in our investment company taxable income for the taxable year of accrual, we may be required to make a distribution to our stockholders in order to satisfy the Annual Distribution Requirement, even though we will not have received any corresponding cash amount. Further, we may elect to amortize market discount and include such amounts in our taxable income in the current taxable year, instead of upon disposition, as an election not to do so could limit our ability to deduct interest expense for tax purposes.
We are authorized to borrow funds and to sell assets in order to satisfy distribution requirements. However, under the 1940 Act (and possibly certain debt covenants), we are not permitted to make distributions to our stockholders while our debt obligations and other senior securities are outstanding unless certain “asset coverage” tests are met. See “Item 1. Business — Regulation as a Business Development Company — Senior Securities.” Moreover, our ability to dispose of assets to meet our distribution requirements may be limited by (1) the illiquid nature of our portfolio and/or (2) other requirements relating to our qualification as a RIC, including the Diversification Tests. If we dispose of assets in order to meet the Annual Distribution Requirement or the Excise Tax Avoidance Requirement, we may make such dispositions at times that, from an investment standpoint, are not advantageous. If we are prohibited from making distributions or are unable to raise additional debt or equity capital or sell assets to make distributions, we may not be able to make sufficient distributions to satisfy the Annual Distribution Requirement, and therefore would not be able to maintain our ability to be subject to tax as a RIC.
A portfolio company in which we invest may face financial difficulties that require us to work-out, modify or otherwise restructure our investment in the portfolio company. Any such transaction could, depending upon the specific terms of the transaction, result in unusable capital losses and future non-cash income. Any such transaction could also result in our receiving assets that give rise to non-qualifying income for purposes of the 90% Income Test or otherwise would not count toward satisfying the Diversification Tests.
A RIC is limited in its ability to claim expenses as deductions in excess of its investment company taxable income. If our expenses in a given taxable year exceed gross taxable income, we would incur a net operating loss for that taxable year. However, a RIC is not permitted to carry forward net operating losses and use such losses to offset investment company taxable income generated in subsequent taxable years. In addition, such expenses can be used only to offset investment company taxable income, not net capital gain. Due to these limits on the deductibility of expenses, we may for U.S. federal income tax purposes have aggregate taxable income for several taxable years that we distribute and that is taxable to our stockholders even if such income is greater than the aggregate net income we actually earned during those taxable years. Such distributions may be made from our cash assets or by premature sale, exchange, or other disposition of our investments, if necessary. We may realize gains or losses from such sales, exchanges, or other disposition of our investments. In the event we realize net capital gains (which are generally our realized net long-term capital gains in excess of realized net short-term capital losses) from such transactions, you may receive a larger capital gain distribution than you would have received in the absence of such transactions.
21
Investment income received from sources within foreign countries, or capital gains earned by investing in securities of foreign issuers, may be subject to foreign income taxes withheld at the source. In this regard, withholding tax rates in countries with which the United States does not have a tax treaty are often as high as 35% or more. The United States has entered into tax treaties with many foreign countries that may entitle us to a reduced rate of tax or exemption from tax on this related income and gains. The effective rate of foreign tax cannot be determined at this time since the amount of our assets to be invested within various countries is not now known. We do not anticipate being eligible for the special election that allows a RIC to treat foreign income taxes paid by such RIC as paid by its stockholders.
If we acquire interests treated as equity securities in certain foreign corporations for U.S. federal income tax purposes that earn at least 75% of their annual gross income from passive sources (such as interest, dividends, rents, royalties or capital gain) or hold at least 50% of their total assets in investments producing such passive income (“passive foreign investment companies” or “PFICs”), we could be subject to U.S. federal income tax and additional interest charges on “excess distributions” received from such corporations or gain from the sale of stock in such corporations, even if all income or gain actually earned by us is timely distributed to our stockholders. We would not be able to pass through to our stockholders any credit or deduction for such a tax. Certain elections may, if available, ameliorate these adverse tax consequences, but any such election may require us to recognize taxable income or gain without the concurrent receipt of cash, and such income will nevertheless be subject to the Annual Distribution Requirement as well as will be taken into account for purposes of determining whether we satisfy the Excise Tax Avoidance Requirement.
Our functional currency, for U.S. federal tax purposes, is the U.S. dollar. Under Section 988 of the Code, gains and losses realized by us attributable to fluctuations in exchange rates between the time we accrue income, expenses, or other liabilities denominated in a foreign currency and the time we actually collect such income or pay such expenses or liabilities generally will be characterized as ordinary gains and losses. Similarly, gains and losses realized by us upon the sale, exchange, or other disposition of debt instruments denominated in a foreign currency, foreign currency forward contracts, and other financial transactions denominated in a foreign currency, to the extent attributable to fluctuations in exchange rates between their acquisition and disposition dates, generally will be characterized as ordinary gains and losses. In each case, such gains and losses may affect the amount, timing and character of distributions to our stockholders. Any such transactions that are not directly related to our investment in securities (possibly including speculative currency positions or currency derivatives not used for hedging purposes) could, under future Treasury regulations, produce income not among the types of “qualifying income” for purposes of the 90% Income Test.
Certain of our investment practices may be subject to special and complex U.S. federal income tax provisions that may, among other things: (i) disallow, suspend or otherwise limit the allowance of certain losses or deductions; (ii) convert lower taxed long-term capital gain into higher taxed short-term capital gain or ordinary income; (iii) convert an ordinary loss or a deduction into a capital loss (the deductibility of which is more limited); (iv) cause us to recognize income or gain without a corresponding receipt of cash; (v) adversely affect the time as to when a purchase or sale of securities is deemed to occur; (vi) adversely alter the characterization of certain complex financial transactions; and (vii) produce income that will not be qualifying income for purposes of the 90% Income Test. We intend to monitor our transactions and may make certain tax elections in order to mitigate the potential adverse effect of these provisions.
Gain or loss realized by us from the sale or exchange of warrants acquired by us as well as any loss attributable to the lapse of such warrants generally will be treated as capital gain or loss. The treatment of such gain or loss as long-term or short-term capital gain or loss will depend on how long we held a particular warrant. Upon the exercise of a warrant acquired by us, our tax basis in the stock purchased under the warrant will equal the sum of the amount paid for the warrant plus the strike price paid on the exercise of the warrant.
22
If we fail to satisfy the 90% Income Test or any Diversification Tests in any taxable year, we may be eligible to avail ourselves of certain relief provisions under the Code if the failures are due to reasonable cause and not willful neglect, and if a penalty tax is incurred with respect to each failure in satisfaction of the applicable requirements. Additionally, relief is provided for certain de minimis failures of the Diversification Tests where we correct a failure within a specified period. If the applicable relief provisions are not available or cannot be met, all of our income will be subject to U.S. federal corporate-level income tax as described below. We cannot provide assurance that we would qualify for any such relief should we fail either the 90% Income Test or any Diversification Test.
If we fail to satisfy the Annual Distribution Requirement or otherwise fail to qualify as a RIC in any taxable year, and are not eligible for relief as described above, we will be subject to tax in that taxable year on all of our taxable income, regardless of whether we make any distributions to our stockholders. In that case, all of our taxable income will be subject to U.S. federal corporate-level income tax, reducing the amount available to be distributed to our stockholders. In contrast, assuming we qualify as a RIC, our U.S. federal corporate-level income tax should be substantially reduced or eliminated. To qualify again to be subject to tax as a RIC in a subsequent taxable year, we would be required to distribute to our stockholders our accumulated earnings and profits attributable to our non-RIC taxable years. In addition, if we failed to qualify as a RIC for a period of greater than two consecutive taxable years, then, in order to qualify as a RIC in a subsequent taxable year, we would be required to either elect to recognize and incur tax on any net built-in gain (i.e., the excess of aggregate gain, including items of income, over aggregate loss that would have been realized if we had been liquidated) in our assets held at the end of the taxable year in which we choose to requalify as a RIC or, alternatively, be subject to taxation on such built-in gain recognized for a period of five taxable years following the taxable year in which we choose to requalify as a RIC.
The remainder of this discussion assumes that we qualify as a RIC and have satisfied the Annual Distribution Requirement.
Taxation of U.S. Stockholders
Distributions by us generally are taxable to U.S. stockholders as ordinary income or capital gains. Distributions of our investment company taxable income are taxable as ordinary dividend income to U.S. stockholders to the extent of our current or accumulated earnings and profits, whether paid in cash or reinvested in additional Common Stock. To the extent such distributions paid by us to non-corporate stockholders (including individuals) are attributable to dividends from U.S. corporations and certain qualified foreign corporations and if certain holding period and other requirements are met, such distributions, or Qualifying Dividends, may be eligible for a maximum tax rate of either 15% or 20%, depending on whether the stockholder’s income exceeds certain threshold amounts, and if other applicable requirements are met, such distributions generally will be eligible for the corporate dividends received deduction to the extent such dividends have been consist of income from qualifying sources. In this regard, it is anticipated that distributions paid by us will generally not be attributable to dividends and, therefore, generally will not qualify for the maximum rate applicable to Qualifying Dividends or the dividends received deduction available to corporations under the Code. Distributions of our net capital gains that are properly reported by us as “capital gain dividends” generally would be characterized as long-term capital gains. Capital gain dividends are currently subject to a maximum U.S. federal income tax rate of 20%, in the case of individuals, trusts or estates, regardless of the U.S. stockholder’s holding period for his, her or its Common Stock and regardless of whether paid in cash or reinvested in additional Common Stock. Distributions in excess of our earnings and profits first will reduce a U.S. stockholder’s adjusted tax basis in such stockholder’s Common Stock and, after the adjusted basis is reduced to zero, will constitute capital gains to such U.S. stockholder.
Under the dividend reinvestment plan, our stockholders who have not “opted out” of our dividend reinvestment plan will have their cash distributions automatically reinvested in additional Shares, rather than receiving the cash distributions. Any distributions reinvested under the plan will nevertheless remain taxable to U.S. stockholders. A U.S. stockholder will have an adjusted basis in the additional Shares purchased through the plan equal to the cash that would have been received if the stockholder had received the distribution in cash, unless we issue new Shares that are trading at or above net asset value, in which case, the stockholder’s basis in the new Shares will generally be equal to their fair market value. The additional Shares will have a new holding period commencing on the day following the day on which the Shares are credited to the U.S. stockholder’s account.
23
Although we currently intend to distribute any net capital gains at least annually, we may in the future decide to retain some or all of our net capital gains but report the retained amount as a “deemed distribution.” In that case, among other consequences, we will pay tax on the retained amount, each U.S. stockholder will be required to include such stockholder’s share of the deemed distribution in income as if it had been distributed to the U.S. stockholder, and the U.S. stockholder will be entitled to claim a credit equal to such stockholder’s allocable share of the tax paid on the deemed distribution by us. The amount of the deemed distribution net of such tax will be added to the U.S. stockholder’s tax basis for its Shares. Since we expect to pay tax on any retained net capital gains at our regular corporate tax rate, and since that rate is generally in excess of the maximum rate currently payable by individuals on long-term capital gains, the amount of tax that individual stockholders will be treated as having paid and for which they will receive a credit will exceed the tax they owe on the retained net capital gains. Such excess generally may be claimed as a credit against the U.S. stockholder’s other U.S. federal income tax obligations or may be refunded to the extent it exceeds a stockholder’s liability for U.S. federal income tax. A stockholder that is not subject to U.S. federal income tax or otherwise required to file a U.S. federal income tax return would be required to file a U.S. federal income tax return on the appropriate form in order to claim a refund for the taxes we paid. In order to utilize the deemed distribution approach, we must provide written notice to our stockholders prior to the expiration of 60 days after the close of the relevant taxable year. We cannot treat any distributions derived from our investment company taxable income as a “deemed distribution.”
For purposes of determining (1) whether the Annual Distribution Requirement is satisfied for any taxable year and (2) the amount of capital gain dividends paid for that taxable year, we may, under certain circumstances, elect to treat a dividend that is paid during the following taxable year as if it had been paid during the taxable year in question. If we make such an election, the U.S. stockholder will still be treated as receiving the dividend in the taxable year in which the distribution is made. However, any dividend declared by us in October, November or December of any calendar year, payable to stockholders of record on a specified date in such a month and actually paid during January of the following calendar year, will be treated as if it had been received by our U.S. stockholders on December 31 of the calendar year in which the dividend was declared.
If an investor purchases the Shares shortly before the record date of a distribution, the price of the Shares will include the value of the distribution and the investor will be subject to tax on the distribution even though economically it may represent a return of the investor’s investment.
A stockholder generally will recognize taxable gain or loss if the stockholder sells or otherwise disposes of the stockholder’s Shares. The amount of gain or loss will be measured by the difference between such stockholder’s adjusted tax basis in the Common Stock sold and the amount of the proceeds received in exchange. Any gain arising from such sale or disposition generally will be treated as long-term capital gain or loss if the stockholder has held the Shares for more than one year. Otherwise, it will be classified as short-term capital gain or loss. However, any capital loss arising from the sale or disposition of the Shares held for six months or less will be treated as long-term capital loss to the extent of the amount of capital gain dividends received or undistributed capital gain deemed received, with respect to such Shares. In addition, all or a portion of any loss recognized upon a disposition of the Shares may be disallowed if other Shares are purchased (whether through reinvestment of distributions or otherwise) within 30 days before or after the disposition. In such a case, the basis of the Common Stock acquired will be increased to reflect the disallowed loss.
In general, individual and other non-corporate U.S. stockholders currently are subject to a maximum federal income tax rate of either 15% or 20%, depending on whether the stockholder’s income exceeds certain threshold amounts, on their net capital gain (i.e., the excess of realized net long-term capital gains over realized net short-term capital losses), including any long-term capital gain derived from an investment in the Shares. Such rate is lower than the maximum rate on ordinary income currently payable by individuals. An additional 3.8% Medicare tax is imposed on certain net investment income (including ordinary dividends and capital gain distributions received from us and net gains from redemptions or other taxable dispositions of our Common Stock) of U.S. individuals, estates and trusts to the extent that such person’s “modified adjusted gross income” (in the case of an individual) or “adjusted gross income” (in the case of an estate or trust) exceeds certain threshold amounts. Corporate U.S. stockholders currently are subject to U.S. federal income tax on net capital gain at the maximum 21% rate also applied to ordinary income. Non-corporate stockholders incurring net capital losses for a taxable year (i.e., capital losses in excess of capital gains) generally may currently deduct up to $3,000 of such losses against their ordinary income each taxable year; any net capital losses of a non-corporate stockholder in excess of $3,000 generally may be carried forward and used in subsequent taxable years as provided in the Code. Corporate stockholders generally may not deduct any net capital losses for a taxable year, but may carry back such losses for three taxable years or carry forward such losses for five taxable years.
24
For any period that we are not considered to be a “publicly offered regulated investment company” within the meaning of Section 67 of the Code, a non-corporate stockholder’s pro rata portion of our affected expenses, including our management fees, will be treated as an additional dividend to the stockholder and will be deductible by such stockholder only to the extent permitted under the limitations described below. For non-corporate stockholders, including individuals, trusts, and estates, significant limitations generally apply to the deductibility of certain expenses of a non-publicly offered RIC, including advisory fees. In particular, these expenses, referred to as miscellaneous itemized deductions, will be deductible only to individuals to the extent they exceed 2% of such a stockholder’s adjusted gross income after 2025 and will not be deductible at all before then, are not deductible for AMT purposes and are subject to the overall limitation on itemized deductions under Section 68 of the Code. A publicly offered regulated investment company is a RIC whose shares are either (i) continuously offered pursuant to a public offering within the meaning of Section 4 of the Securities Act of 1933, as amended, or the Securities Act, (ii) regularly traded on an established securities market or (iii) held by at least 500 persons at all times during the taxable year. We anticipate that we will not qualify as a publicly offered RIC for the foreseeable future.
We (or if a U.S. stockholder holds Shares through an intermediary, such intermediary) will send to each of our U.S. stockholders, as promptly as possible after the end of each calendar year, a notice detailing, on a per Share and per distribution basis, the amounts includible in such U.S. stockholder’s taxable income for such year as ordinary income and as long-term capital gain. In addition, the U.S. federal tax status of each year’s distributions generally will be reported to the IRS (including the amount of dividends, if any, eligible for the preferential maximum rate). Dividends paid by us generally will not be eligible for the dividends-received deduction or the preferential tax rate applicable to Qualifying Dividends because our income generally will not consist of dividends. Distributions may also be subject to additional state, local and foreign taxes depending on a U.S. stockholder’s particular situation. In addition, the Code requires reporting of adjusted cost basis information for covered securities, which generally include shares of a RIC acquired after January 1, 2012, to the IRS and to taxpayers. Stockholders should contact their financial intermediaries with respect to reporting of cost basis and available elections for their accounts.
Under applicable Treasury regulations, if a U.S. stockholder recognizes a loss with respect to our Common Stock of $2 million or more for a non- corporate U.S. stockholder or $10 million or more for a corporate U.S. stockholder in any single taxable year (or a greater loss over a combination of years), the U.S. stockholder must file with the IRS a disclosure statement on Form 8886. Direct U.S. stockholders of portfolio securities are in many cases excepted from this reporting requirement, but under current guidance, U.S. stockholders of a RIC are not excepted. Future guidance may extend the current exception from this reporting requirement to U.S. stockholders of most or all RICs. The fact that a loss is reportable under these regulations does not affect the legal determination of whether the taxpayer’s treatment of the loss is proper. Significant monetary penalties apply to a failure to comply with this reporting requirement. States may also have a similar reporting requirement. U.S. stockholders should consult their own tax advisers to determine the applicability of these Treasury regulations in light of their individual circumstances.
We may be required to withhold federal income tax, or backup withholding, currently at a rate of 24%, from all distributions to any U.S. stockholder (1) who fails to furnish us with a correct taxpayer identification number or a certificate that such stockholder is exempt from backup withholding or (2) with respect to whom the IRS notifies us that such stockholder has failed to properly report certain interest and dividend income to the IRS and to respond to notices to that effect. An individual’s taxpayer identification number generally is his or her social security number. Backup withholding is not an additional tax. Any amount withheld under backup withholding is allowed as a credit against the U.S. stockholder’s federal income tax liability, so long as proper information is provided to the IRS.
25
Taxation of Tax-Exempt U.S. Stockholders
A U.S. stockholder that is a tax-exempt organization for U.S. federal income tax purposes and therefore generally exempt from U.S. federal income taxation may nevertheless be subject to taxation to the extent that it is considered to derive unrelated business taxable income, or UBTI. The direct conduct by a tax-exempt U.S. stockholder of the activities that we have conducted and are eligible to conduct could give rise to UBTI. However, if a BDC is classified as a corporation for U.S. federal income tax purposes, its business activities generally will not be attributed to its stockholders for purposes of determining the treatment of any amounts earned from the BDC for U.S. federal income tax purposes. Therefore, a tax-exempt U.S. stockholder should not be subject to U.S. taxation solely as a result of the holder’s ownership of the Shares and receipt of dividends that we pay. Moreover, under current law, if we incur indebtedness, such indebtedness will not be attributed to portfolio investors in our stock. Therefore, a tax-exempt U.S. stockholder should not be treated as earning income from “debt-financed property” and dividends we pay should not be treated as “unrelated debt-financed income” solely as a result of indebtedness that we incur. Proposals periodically are made to change the treatment of “blocker” investment vehicles interposed between tax-exempt investors and non-qualifying investments. In the event that any such proposals were to be adopted and applied to BDCs, the treatment of dividends payable to tax-exempt U.S. stockholders could be adversely affected.
Taxation of Non-U.S. Stockholders
Whether an investment in the Shares is appropriate for a Non-U.S. stockholder will depend upon that person’s particular circumstances. Non-U.S. stockholders should consult their tax advisers before investing in our Common Stock.
Distributions of our “investment company taxable income” to Non-U.S. stockholders generally will be subject to withholding of U.S. federal tax at a 30% rate (or lower rate provided by an applicable treaty) to the extent of our current and accumulated earnings and profits unless an applicable exception applies. If the distributions are effectively connected with a U.S. trade or business of the Non-U.S. stockholder, we will not be required to withhold U.S. federal tax if the Non-U.S. stockholder complies with applicable certification and disclosure requirements, although the distributions will be subject to U.S. federal income tax at the rates applicable to U.S. persons. Special certification requirements apply to a Non-U.S. stockholder that is a foreign partnership or a foreign trust, and such entities are urged to consult their tax advisers.
However, certain properly reported distributions are generally exempt from withholding of U.S. federal income tax where they are paid in respect of our (i) “qualified net interest income” (generally, our U.S.-source interest income, other than certain contingent interest and interest from obligations of a corporation or partnership in which we or the Non-U.S. stockholder are at least a 10% shareholder, reduced by expenses that are allocable to such income) or (ii) “qualified short-term capital gains” (generally, the excess of our net short-term capital gain, other than short-term capital gains recognized on the disposition of U.S. real property interests, over our long-term capital loss for such taxable year), and certain other requirements were satisfied. No assurance can be given as to whether any of our distributions will be eligible for this exemption from withholding of U.S. federal income tax or, if eligible, will be reported as such by us. In the case of Shares held through an intermediary, the intermediary may withhold U.S. federal income tax even if we report the payment as a distribution derived from qualified net interest income or qualified short-term capital gain. Moreover, depending on the circumstances, we may report all, some or none of our potentially eligible distributions as derived from such qualified net interest income or as qualified short-term capital gains, or treat such distributions, in whole or in part, as ineligible for this exemption from withholding.
Actual or deemed distributions of our net capital gains to a stockholder that is a Non-U.S. stockholder, and gains realized by a Non-U.S. stockholder upon the sale or redemption of our Common Stock, will not be subject to U.S. federal income tax unless the distributions or gains, as the case may be, are effectively connected with a U.S. trade or business of the Non-U.S. stockholder (and, if an income tax treaty applies, are attributable to a permanent establishment maintained by the Non-U.S. stockholder in the United States) or, in the case of an individual, the Non-U.S. stockholder was present in the United States for 183 days or more during the taxable year and certain other conditions are met.
If we distribute our net capital gains in the form of deemed rather than actual distributions, a stockholder that is a Non-U.S. stockholder will be entitled to a U.S. federal income tax credit or tax refund equal to the stockholder’s allocable share of the corporate-level tax we pay on the capital gains deemed to have been distributed; however, in order to obtain the refund, the Non-U.S. stockholder must obtain a U.S. taxpayer identification number and file a U.S. federal income tax return even if the Non-U.S. stockholder would not otherwise be required to obtain a U.S. taxpayer identification number or file a U.S. federal income tax return.
For a corporate Non-U.S. stockholder, distributions (both actual and deemed), and gains realized upon the sale or redemption of our Common Stock that are effectively connected to a U.S. trade or business may, under certain circumstances, be subject to an additional “branch profits tax” at a 30% rate (or at a lower rate if provided for by an applicable treaty).
26
Under the dividend reinvestment plan, our stockholders who have not “opted out” of our dividend reinvestment plan will have their cash distributions automatically reinvested in additional Shares, rather than receiving the cash distributions. If the distribution is a distribution of our investment company taxable income, is not properly reported by us as derived from qualified short-term capital gains or qualified net interest income (as discussed above), and it is not effectively connected with a U.S. trade or business of a Non-U.S. stockholder (or, if a treaty applies, is not attributable to a permanent establishment), the amount distributed (to the extent of our current and accumulated earnings and profits) will be subject to U.S. federal withholding tax at a 30% rate (or lower rate provided by an applicable treaty) and only the net after-tax amount will be reinvested in the Shares. If the distribution is effectively connected with a U.S. trade or business of a Non-U.S. stockholder, generally the full amount of the distribution will be reinvested in the plan and will nevertheless be subject to U.S. federal income tax at the ordinary income rates applicable to U.S. persons. A Non-U.S. stockholder will have an adjusted basis in the additional Shares purchased through the plan equal to the cash that would have been received if the stockholder had received the distribution in cash, unless we issue new Shares that are trading at or above net asset value, in which case, the stockholder’s basis in the new Shares will generally be equal to their fair market value. The additional Shares will have a new holding period commencing on the day following the day on which the Shares are credited to the Non-U.S. stockholder’s account.
A Non-U.S. stockholder who is a non-resident alien individual, and who is otherwise subject to withholding of U.S. federal tax, may be subject to information reporting and backup withholding of U.S. federal income tax on dividends unless the Non-U.S. stockholder provides us or the dividend paying agent with a U.S. nonresident withholding tax certificate (e.g. an IRS Form W-8BEN, IRS Form W-8BEN-E or an acceptable substitute form) or an acceptable substitute form.
We are required to withhold U.S. tax (at a 30% rate) on payments of taxable dividends to certain non-U.S. entities that fail to comply (or be deemed compliant) with extensive new reporting and withholding requirements designed to inform the Treasury of U.S.-owned foreign investment accounts. Stockholders may be requested to provide additional information to us to enable us to determine whether withholding is required.
An investment in the Shares by a non-U.S. person may also be subject to U.S. federal estate tax. Non-U.S. persons should consult their own tax advisers with respect to the U.S. federal income tax and withholding tax, and state, local and foreign tax consequences of an investment in the Shares.
Change in Taxable Year
For the period from inception through July 7, 2015, we were subject to tax as a corporation. As a corporation, no provision for U.S. federal, state and local taxes was accrued and included in the accompanying statement of operations for our fiscal periods ended December 31, 2019, 2018, and 2017. Based upon our election to be subject to tax as a RIC as of our initial RIC taxable year ended December 31, 2015, as well as our intended maintenance of such election in future taxable years, no provision for U.S. federal, state and local taxes was accrued and included in the accompanying statement of operations for our fiscal periods ended December 31, 2019, 2018, and 2017.
Regulation as a Business Development Company
General
A BDC is a specialized investment vehicle that elects to be regulated under the 1940 Act as an investment company, but is generally subject to less onerous requirements than other registered investment companies under a regime designed to encourage lending to U.S.-based small and mid-sized businesses. Unlike many similar types of investment vehicles that are restricted to being private entities, the stock of a BDC is permitted to trade in the public equity markets (although there are no current plans to list the Shares to allow for such trading). BDCs are also eligible to elect to be treated as a RIC under Subchapter M of the Code. A RIC typically does not incur significant entity-level income taxes, because it is generally entitled to deduct distributions made to its stockholders.
27
Advantages of a BDC Compared to Other Institutional Investment Vehicles
The advantages of the BDC structure derive from two characteristics:
First, a BDC is permitted to become a publicly traded company. This can provide a BDC with access to an additional source of capital and offers investors the potential to monetize their investment through the sale of shares in an active public stock market. Most BDCs trade on either the New York Stock Exchange or the Nasdaq Stock Market. However, we do not intend to list the Shares on any national securities exchange.
In contrast, many investment vehicles utilized by institutional investors are required to be “private” vehicles. Investors in such vehicles can transfer their interests only under strict rules designed to ensure that “private” status is maintained. This may have the effect of limiting the liquidity of those interests and result in a discount when they trade in the secondary market. Typically, these investment vehicles are designed for a medium- term (ten year) life, and the timing of return of capital from these vehicles typically depends upon the investment activity of the vehicle.
On the other hand, in a BDC, once a public market develops and lock-ups pursuant to any subscription agreements in respect of the shares expires, an investor is free to sell shares and control the timing of any capital return. The timing and pricing of any initial public offering of our Common Stock, or an IPO, and subsequent trading price of the Shares will depend on market conditions and our Adviser’s investment performance. Prior to an IPO, the Shares will be subject to certain transfer restrictions. Following an IPO, investors may be restricted from selling or disposing of their Shares by applicable securities laws, contractually by a lock-up agreement with the underwriters of the IPO and contractually through restrictions contained in the subscription agreement in respect of the Shares.
Second, as a BDC, we have elected to be treated as a RIC under the Code. A RIC typically does not incur significant entity-level income taxes, because it is entitled to deduct distributions made to its stockholders treated as dividends for U.S. federal income tax purposes in computing its income subject to entity-level taxation. As a result, a BDC that has elected to be a RIC does not incur any U.S. federal income tax so long as the BDC continuously maintains its registration in accordance with the 1940 Act, at least 90% of the BDC’s gross income each taxable year consists of certain types of qualifying investment income, the BDC satisfies certain asset composition requirements at the close of each quarter of its taxable year, and if the BDC distributes all of its taxable income (including net realized capital gains, if any) to its stockholders on a current basis. The rules applicable to our qualification as a RIC for tax purposes are complex and involve significant practical and technical issues. If we fail to qualify as a RIC for U.S. federal income tax purposes or are unable to maintain our qualification for any reason, then we would become subject to regular corporate income tax, which would have a material adverse effect on the amount of after-tax income available for distribution to our stockholders. See “Item 1. Business — Material U.S. Federal Income Tax Considerations.”
Distributions by a BDC generally are treated as dividends for U.S. tax purposes, and generally are subject to U.S. income or withholding tax unless the stockholder receiving the dividend qualifies for an exemption from U.S. tax, or the distribution is subject to one of the special look-through rules. Distributions paid out of U.S. derived interest income or short term capital gains may qualify for an exemption from U.S. withholding tax. Distributions paid out of net capital gains can qualify for a reduced rate of taxation in the hands of an individual U.S. stockholder and an exemption from U.S. tax in the hands of a non-U.S. stockholder. Additionally, certain U.S. resident persons eligible to claim exemptions from U.S. federal income tax provided by the Code (such as certain U.S. qualified plans and charitable organizations) that own shares in a BDC generally are not required to take account of indebtedness incurred at the level of the BDC in determining whether dividends received from a BDC constitute “unrelated debt-financed income.” Finally, a non-U.S. investor in a BDC generally does not need to take account of activities conducted by the BDC in determining whether such non-U.S. investor is engaged in the conduct of a business in the United States. See “Item 1. Business — Material U.S. Federal Income Tax Considerations.”
The 1940 Act contains prohibitions and restrictions relating to transactions between BDCs and their affiliates (including any investment advisers or investment sub-advisers), principal underwriters and affiliates of those affiliates or underwriters and requires that a majority of the directors of a BDC be persons other than “interested persons,” as that term is defined in the 1940 Act. In addition, the 1940 Act provides that a BDC may not change the nature of its business so as to cease to be, or to withdraw its election as, a BDC unless approved by a majority of its outstanding voting securities as defined by the 1940 Act.
28
Qualifying Assets
Under the 1940 Act, a BDC may not acquire any asset other than assets of the type listed in Section 55(a) of the 1940 Act, which are referred to as qualifying assets, unless, at the time the acquisition is made, qualifying assets represent at least 70% of the BDC’s total assets. The principal categories of qualifying assets relevant to our proposed business are the following:
(1) Securities purchased in transactions not involving any public offering from the issuer of such securities, which issuer (subject to certain limited exceptions) is an eligible portfolio company, or from any person who is, or has been during the preceding 13 months, an affiliated person of an eligible portfolio company, or from any other person, subject to such rules as may be prescribed by the SEC. An eligible portfolio company is defined in the 1940 Act as any issuer which:
(a) is organized under the laws of, and has its principal place of business in, the United States;
(b) is not an investment company (other than a small business investment company wholly owned by the BDC) or a company that would be an investment company but for certain exclusions under the 1940 Act; and
(c) satisfies either of the following:
(i) does not have any class of securities listed on a national securities exchange or has any class of securities listed on a national securities exchange subject to a $250 million market capitalization maximum; or
(ii) is controlled by a BDC or a group of companies including a BDC, the BDC actually exercises a controlling influence over the management or policies of the eligible portfolio company, and, as a result, the BDC has an affiliated person who is a director of the eligible portfolio company.
(2) Securities of any eligible portfolio company which we control.
(3) Securities purchased in a private transaction from a U.S. issuer that is not an investment company or from an affiliated person of the issuer, or in transactions incident thereto, if the issuer is in bankruptcy and subject to reorganization or if the issuer, immediately prior to the purchase of its securities, was unable to meet its obligations as they came due without material assistance other than conventional lending or financing arrangements.
(4) Securities of an eligible portfolio company purchased from any person in a private transaction if there is no ready market for such securities and we already own 60% of the outstanding equity of the eligible portfolio company.
(5) Securities received in exchange for or distributed on or with respect to securities described in (1) through (4) above, or pursuant to the exercise of warrants or rights relating to such securities.
(6) Cash, cash equivalents, U.S. government securities or high-quality debt securities maturing in one year or less from the time of investment.
29
Managerial Assistance to Portfolio Companies
In addition, a BDC must have been organized and have its principal place of business in the United States and must be operated for the purpose of making investments in the types of securities described in (1), (2) or (3) above. However, in order to count portfolio securities as qualifying assets for the purpose of the 70% test, the BDC must either control the issuer of the securities or must offer to make available to the issuer of the securities significant managerial assistance. However, when a BDC purchases securities in conjunction with one or more other persons acting together, one of the other persons in the group may make available such managerial assistance. Making available managerial assistance means, among other things, any arrangement whereby the BDC, through its directors, officers or employees, offers to provide, and, if accepted, does so provide, significant guidance and counsel concerning the management, operations or business objectives and policies of a portfolio company.
Temporary Investments
Pending investment in other types of “qualifying assets,” as described above, our investments may consist of cash, cash equivalents, U.S. government securities or high-quality debt securities maturing in one year or less from the time of investment, which we refer to, collectively, as temporary investments, so that 70% of our assets are qualifying assets.
Senior Securities
While there is no present intention to do so, we are permitted, under specified conditions, to issue multiple classes of indebtedness and one class of stock senior to the Shares if our asset coverage complies with the requirements of the 1940 Act. Under the 1940 Act, and absent specific authorization by our Board of Directors or stockholders, a BDC generally is required to maintain asset coverage of 200% for senior securities representing indebtedness (such as borrowings from banks or other financial institutions) or stock (such as preferred stock). The Small Business Credit Availability Act, which was signed into law on March 23, 2018, or the SBCAA, provides that a BDC’s required asset coverage under the 1940 Act may be reduced from 200% to 150%. This reduction in asset coverage would permit a BDC to double the amount of leverage it may utilize, subject to certain approval, timing and reporting requirements, including either stockholder approval or approval of a majority of the directors who are not “interested persons” (as defined in the 1940 Act) of the BDC and who have no financial interest in the arrangement. As defined in the 1940 Act, asset coverage of 150% means that for every $100 of net assets a BDC holds, it may raise up to $200 from borrowing and issuing senior securities. In addition, while any senior securities remain outstanding, we must make provisions to prohibit any distribution to our stockholders or the repurchase of such securities or shares unless we meet the applicable asset coverage ratios at the time of the distribution or repurchase. We may also borrow amounts up to 5% of the value of our total assets for temporary or emergency purposes without regard to asset coverage. Regulations governing our operations as a BDC will affect our ability to raise, and the method of raising, additional capital, which may expose us to risks.
Code of Ethics
We and our Adviser have adopted a joint code of ethics pursuant to Rule 17j-1 under the 1940 Act that establishes procedures for personal investments and restricts certain personal securities transactions. Personnel subject to the joint code may invest in securities for their personal investment accounts, including securities that may be purchased or held by us, so long as such investments are made in accordance with the code’s requirements.
Proxy Voting Policies and Procedures
We have delegated our proxy voting responsibility to our Adviser. A summary of the proxy voting policies and procedures of our Adviser, or the Proxy Voting Policies and Procedures, are set forth below. These policies and procedures will be reviewed periodically by our Adviser and, subsequent to our election to be regulated as a BDC, our non-interested directors, and, accordingly, are subject to change. For purposes of these Proxy Voting Policies and Procedures described below, “we” “our” and “us” refers to our Adviser.
30
An investment adviser registered under the Investment Advisers Act of 1940, as amended, or the Advisers Act, has a fiduciary duty to act solely in the best interests of its clients. As part of this duty, we recognize that we must vote client securities in a timely manner free of conflicts of interest and in the best interests of our clients.
These policies and procedures for voting proxies for our investment advisory clients are intended to comply with Section 206 of, and Rule 206(4)-6 under, the Advisers Act.
We vote proxies relating to our portfolio securities in what we believe to be the best interest of our clients’ stockholders by seeking to maximize the economic value of each such client’s holdings. In doing so, we take into account the relevant client’s investment horizon, the contractual obligations under the applicable advisory agreements or comparable documents, and all other relevant facts and circumstances at the time of the vote. It is our general policy to vote or give consent on all matters presented to security holders in any vote; provided, however, that we reserve the right to abstain on any particular vote or otherwise withhold our vote or consent on any matter if, in the judgment of our general counsel or our relevant investment professional, the costs associated with such vote outweigh the benefits to the relevant clients or if the circumstances make such an abstention or withholding otherwise advisable and in the best interests of the relevant clients.
Our proxy voting decisions are made by the senior officers who are responsible for monitoring each of our clients’ investments. To ensure that our vote is not the product of a conflict of interest, we require that: (1) anyone involved in the decision making process disclose to our chief compliance officer any potential conflict that he or she is aware of and any contact that he or she has had with any interested party regarding a proxy vote; and (2) employees involved in the decision making process or vote administration are prohibited from revealing how we voted on a proposal in order to reduce any attempted influence from interested parties.
You may obtain information about how we voted proxies by making a written request for proxy voting information to: Audax Management Company (NY), LLC, 101 Huntington Avenue, Boston, MA 02199, Attention: General Counsel.
31
Privacy Principles
We are committed to maintaining the privacy of our investors and to safeguarding their non-public personal information. The following information is provided to help you understand what personal information we collect, how we protect that information and why, in certain cases, we may share information with select other parties.
We do not disclose any non-public personal information about our stockholders or a former stockholder to anyone, except as permitted by law or as is necessary in order to service stockholder accounts (for example, to a transfer agent or third party administrator).
We restrict access to non-public personal information about our stockholders to employees of our Adviser and its affiliates with a legitimate business need for the information. We maintain physical, electronic and procedural safeguards designed to protect the non-public personal information of our stockholders.
Other
We are prohibited under the 1940 Act from knowingly participating in certain transactions with our affiliates, including the Adviser, without the prior approval of our independent directors and, in some cases, prior approval by the SEC.
On November 7, 2018, we and the Adviser and other affiliates received exemptive relief from the SEC to permit greater flexibility to negotiate the terms of co-investments because we believe that it will be advantageous for us to co-invest with accounts sponsored or managed by the Adviser and its affiliates where such investment is consistent with our investment objectives, positions, policies, strategies and restrictions, as well as regulatory requirements and other pertinent factors. We may also co-invest alongside other accounts sponsored or managed by our Adviser and its affiliates as otherwise permissible under SEC staff guidance and interpretations, applicable regulations and the allocation policy of the Adviser. We believe that co-investment by us and accounts sponsored or managed by the Adviser may afford us additional investment opportunities.
Under the terms of our exemptive relief, a “required majority” (as defined in Section 57(o) of the 1940 Act) of our independent directors is required to make certain conclusions in connection with a co-investment transaction, including that (1) the terms of the proposed transaction are reasonable and fair to us and our stockholders and do not involve overreaching of us or our stockholders on the part of any person concerned and (2) the transaction is consistent with the interests of our stockholders and is consistent with our investment strategies and policies.
We are subject to periodic examination by the SEC for compliance with the 1940 Act.
We are required to provide and maintain a bond issued by a reputable fidelity insurance company to protect us against larceny and embezzlement. Furthermore, as a BDC, we are prohibited from protecting any director or officer against any liability to us or our stockholders arising from willful misfeasance, bad faith, gross negligence or reckless disregard of the duties involved in the conduct of such person’s office.
We and our Adviser are each required to adopt and implement written policies and procedures reasonably designed to prevent violation of the federal securities laws, review these policies and procedures annually for their adequacy and the effectiveness of their implementation, and designate a chief compliance officer to be responsible for administering the policies and procedures.
32
Investing in the Shares involves a number of significant risks. In addition to the other information contained in this annual report, you should consider carefully the following information before making an investment in the Shares. The risks below are not the only risks we face. Additional risks and uncertainties not presently known to us or not presently deemed material by us could also impair our operations and performance. If any of the following events occur, our business, financial condition and results of operations could be materially and adversely affected. In such case, the net asset value of the Shares could decline, and you may lose all or part of your investment.
Risks Related to our Investments
Investing in the Shares involves a high degree of risk.
The investments we make in accordance with our investment objective may involve a higher amount of volatility and risk of loss of principal than alternative investment options and, therefore, an investment in the Shares may not be suitable for someone with lower risk tolerance.
Our investments in portfolio companies may be risky, and we could lose all or part of our investment.
We invest primarily in senior secured debt instruments, including “one-stop” or “unitranche” senior secured loans, of privately owned U.S. companies with approximately $10 to $75 million of annual EBITDA, with a focus on transactions sourced through the network of our Adviser. We intend to invest at least 80% of our net assets, plus the amount of any borrowings, in credit instruments.
When we invest in senior secured debt, we generally take a security interest in the available assets of these portfolio companies, including equity interests in their subsidiaries. There is a risk that the collateral securing our investments may decrease in value over time or lose its entire value, may be difficult to sell in a timely manner, may be difficult to appraise and may fluctuate in value based upon the success of the business and market conditions, including as a result of the inability of the portfolio company to raise additional capital. Also, in some circumstances, our security interest could be subordinated to claims of other creditors. In addition, any deterioration in a portfolio company’s financial condition and prospects, including any inability on its part to raise additional capital, may result in the deterioration in the value of the related collateral. Consequently, the fact that debt is secured does not guarantee that we will receive principal and interest payments according to the investment terms or at all, or that we will be able to collect on the investment should we be forced to enforce our remedies.
We typically lend directly to borrowers, and structure our investments to include fixed repayment schedules and extensive contractual rights and remedies. We do not expect to invest in structured products and investments and intend to focus on cash-pay instruments that pay interest on a monthly or quarterly basis, typically with maturities of between five and seven years. Such first lien senior secured loans typically do not include equity co-investments, warrants or PIK payment terms. However, to the extent we invest in securities ranking more junior in a borrower’s capital structure, which we do not expect to be a focus of our portfolio, such investments may include some or all of these attributes. Any equity co-investments, warrants or PIK instruments we hold may involve certain risks that are not applicable to the types of securities in which we typically invest. These risks include the possibility of being unsecured with respect to our claim on such investments if the portfolio company were to go bankrupt or being paid less upon such bankruptcy than we otherwise would have had such investment been in the form of a senior loan.
Most loans in which we invest are not rated by any rating agency. If they were rated, they would be rated as below investment grade quality. Loans rated below investment grade quality, which are often referred to as “junk” loans, are generally regarded as having predominantly speculative characteristics and may carry a greater risk with respect to a borrower’s capacity to pay interest and repay principal. Therefore, our investments may result in an above average amount of risk and volatility or loss of principal. To the extent we make investments with a deferred interest feature such as market discount, debt instruments with PIK interest and OID securities, the higher interest rates on these investments may reflect the payment deferral and an increased credit risk associated with such instruments.
33
We are a non-diversified investment company within the meaning of the 1940 Act, and therefore we are not limited with respect to the proportion of our assets that may be invested in securities of a single issuer.
We are classified as a non-diversified investment company within the meaning of the 1940 Act, which means that we are not limited by the 1940 Act with respect to the proportion of our assets that we may invest in securities of a single issuer. To the extent that we assume large positions in the securities of a small number of issuers, our net asset value may fluctuate to a greater extent than that of a diversified investment company as a result of changes in the financial condition or the market’s assessment of the issuer. We may also be more susceptible to any single economic or regulatory occurrence than a diversified investment company. Beyond our asset diversification requirements as a RIC under the Code, we do not have fixed guidelines for diversification, and our investments could be concentrated in relatively few portfolio companies. Although we are classified as a non-diversified investment company within the meaning of the 1940 Act, we maintain the flexibility to operate as a diversified investment company and have done so for an extended period of time. To the extent that we operate as a non-diversified investment company in the future, we may be subject to greater risk.
We generally do not control the business operations of our portfolio companies and management of our portfolio companies could make decisions adverse to our interests as debt investors.
We do not control or expect to control any of our portfolio companies, even though it is possible that we could have board representation or board observation rights. As a result, we are subject to the risk that a portfolio company in which we invest may make business decisions with which we disagree, and the management of such company, as representatives of the holders of their common equity, may take risks or otherwise act in ways that do not serve our interests as debt investors. As a result, a portfolio company may make decisions that could decrease the value of our portfolio holdings.
Economic recessions or downturns could impair our portfolio companies and harm our operating results.
Many of our portfolio companies are susceptible to economic or industry centric slowdowns or recessions and may be unable to repay our debt investments during these periods. Therefore, our non-performing assets are likely to increase and the value of our portfolio is likely to decrease during these periods. Adverse economic conditions may also decrease the value of any collateral securing investments in senior secured debt. Economic slowdowns or recessions may further decrease the value of our collateral and result in losses of value in our portfolio and a material decrease in our revenues, net income, assets and net worth. Unfavorable economic conditions also could increase our funding costs, limit our access to the capital markets or result in a decision by our lenders not to extend credit to us on terms we deem acceptable. These events could prevent us from increasing investments and materially harm our operating results.
A portfolio company’s failure to satisfy financial or operating covenants imposed by us or other lenders could lead to defaults and, potentially, termination of its loans and foreclosure on its secured assets, which could trigger cross-defaults under other agreements and jeopardize such portfolio company’s ability to meet its obligations under debt securities that we hold. We may incur expenses to the extent necessary to seek recovery upon default or to negotiate new terms with a defaulting portfolio company. In addition, if one of our portfolio companies were to go bankrupt, even if we had structured our interest as senior debt, depending on the facts and circumstances, including the extent to which we actually provided managerial assistance to that portfolio company, a bankruptcy court might re-characterize our debt holding and subordinate all or a portion of our claim to that of other creditors.
34
A covenant breach by a portfolio company may harm our operating results.
A portfolio company’s failure to satisfy financial or operating covenants imposed by us or other lenders could lead to defaults and, potentially, termination of its debt and foreclosure on its secured assets, which could trigger cross-defaults under other agreements and jeopardize a portfolio company’s ability to meet its obligations under the debt securities that we hold. We may incur expenses to the extent necessary to seek recovery upon default or to negotiate new terms with a defaulting portfolio company.
Global markets could enter a period of severe disruption and instability due to catastrophic events, such as terrorist attacks, acts of war, natural disasters, and outbreaks of epidemic, pandemic or contagious diseases, which could impair our portfolio companies’ financial positions and operating results and affect the industries in which we invest and, in turn, harm our operating results
The U.S. and global markets have, from time to time, experienced periods of disruption due to events such as terrorist attacks; acts of war; natural disasters, such as earthquakes, tsunamis, fires, floods or hurricanes; and outbreaks of epidemic, pandemic or contagious diseases. Such events have created, and continue to create, economic and political uncertainties and have contributed to recent global economic instability. In particular, outbreaks of epidemic, pandemic or contagious diseases may cause serious harm to our business, operating results and financial condition. Historically, disease pandemics such as the Ebola virus, Middle East Respiratory Syndrome, Severe Acute Respiratory Syndrome or the H1N1 virus, have diverted resources and priorities towards the treatment of such diseases. In December 2019, a strain of novel coronavirus causing respiratory illness emerged in the city of Wuhan in the Hubei province of China (the “Wuhan Coronavirus”). We are closely monitoring the developments in China and continually assessing the potential impact on our business and the business of our portfolio companies, including the effects described below. However, the full impact of this outbreak is unknown as of the date of this report.
Any prolonged disruptions in the business of our portfolio companies, including a disruption in their supply chains may adversely affect their ability to obtain the necessary raw materials or components to make their products or cause a decline in the demand for their products or services, leading to a negative impact on their operating results. In addition, such events may lead to restrictions on travel to and from the affected areas, making it more difficult for our portfolio companies to conduct their businesses. As a result of pandemic outbreaks, including the Wuhan Coronavirus, businesses can be shut down, supply chains can be interrupted, slowed, or rendered inoperable, and individuals can become ill, quarantined, or otherwise unable to work and/or travel due to health reasons or governmental restrictions. Governmental mandates may require forced shutdowns of our portfolio companies’ facilities for extended or indefinite periods. In addition, these widespread outbreaks of illness, particularly in China, North America, Europe, or other locations significant to the operations of our portfolio companies, could adversely affect their workforce, resulting in serious health issues and absenteeism, and may cause serious harm to our results of operations, business, or prospects.
Furthermore, future terrorist activities, military or security operations, natural disasters, disease outbreaks, pandemics or other similar events could further weaken the domestic/global economies and create additional uncertainties, which may negatively impact our portfolio companies. During these periods of disruption, general economic conditions may deteriorate with material and adverse consequences for the broader financial and credit markets, and the availability of debt and equity capital for the market as a whole, and financial services firms in particular. Such economic adversity could impair our portfolio companies’ financial positions and operating results and affect the industries in which we invest, which could, in turn, harm our operating results. These conditions may reoccur for a prolonged period of time or materially worsen in the future.
35
Changes to U.S. tariff and import/export regulations may affect our portfolio companies, and may negatively impact our business, results of operations or financial conditions.
The current U.S. administration has signified potential significant changes to U.S. trade policies, treaties and tariffs, creating uncertainty about the future relationship between the United States and other countries. These developments, or the perception that any of them could occur, may have a material adverse effect on global economic conditions and the stability of global financial markets, and may significantly reduce global trade. Any of these factors could dampen economic activity and limit our portfolio companies’ access to suppliers or customers, resulting in a material adverse effect on their business, financial condition and results of operations, which in turn would negatively impact us.
An investment strategy focused primarily on privately held companies presents certain challenges, including the lack of available information about these companies.
We generally invest primarily in privately owned U.S. companies. Investments in privately owned companies pose certain incremental risks as compared to investments in public companies. For example, such private companies:
| · | have reduced access to the capital markets, resulting in diminished capital resources and ability to withstand financial distress; |
| · | may have limited financial resources and may be unable to meet their obligations under the debt securities that we hold, which may be accompanied by a deterioration in the value of any collateral and a reduction in the likelihood of us realizing on any guarantees we may have obtained in connection with our investment; |
| · | may have shorter operating histories, narrower product lines and smaller market shares than larger businesses, which tend to render them more vulnerable to competitors’ actions and changing market conditions, as well as general economic downturns; |
| · | are more likely to depend on the management talents and efforts of a small group of persons; therefore, the death, disability, resignation or termination of one or more of these persons could have a material adverse impact on our portfolio company and, in turn, on us; and |
| · | may have less predictable operating results, may from time to time be parties to litigation, may be engaged in volatile businesses with products subject to a substantial risk of obsolescence and may require substantial additional capital to support their operations, finance expansion or maintain their competitive position. |
Finally, little public information generally exists about privately owned companies and these companies may not have third-party debt ratings or audited financial statements. We must therefore rely on the ability of our Adviser to obtain adequate information through due diligence to evaluate the creditworthiness and potential returns from investing in these companies. Additionally, these companies and their financial information are not generally subject to the Sarbanes-Oxley Act of 2002, as amended, or the Sarbanes-Oxley Act, and other rules that govern public companies. If we are unable to uncover all material information about these companies, we may not make a fully informed investment decision, and we may lose money on our investments.
36
Our portfolio securities may be thinly traded and, as a result, the lack of liquidity in our investments may adversely affect our business.
Investments in privately owned companies tend to be less liquid. The securities of privately owned companies are not publicly traded or actively traded on the secondary market and are, instead, traded on a privately negotiated over-the-counter secondary market for institutional investors. These privately negotiated over-the-counter secondary markets may be inactive during an economic downturn or a credit crisis. In addition, the securities in these companies are subject to legal and other restrictions on resale or are otherwise less liquid than publicly traded securities. Also, if there is no readily available market for these investments, we carry these investments at fair value as determined by our Adviser. As a result, if we are required to liquidate all or a portion of our portfolio quickly, we may realize significantly less than the value at which we had previously recorded these investments. We may also face other restrictions on our ability to liquidate an investment in a portfolio company to the extent that we, our Adviser or any of respective affiliates have material nonpublic information regarding such portfolio company or where the sale would be an impermissible joint transaction. The reduced liquidity of our investments may make it difficult for us to dispose of them at a favorable price, and, as a result, we may suffer losses.
We may hold the debt securities of leveraged companies that may, due to the significant volatility of such companies, enter into bankruptcy proceedings.
Leveraged companies may experience bankruptcy or similar financial distress. The bankruptcy process has a number of significant inherent risks. Many events in a bankruptcy proceeding are the product of contested matters and adversary proceedings and are beyond the control of creditors. A bankruptcy filing by an issuer may adversely and permanently affect the issuer. If such bankruptcy proceeding is converted to a liquidation, our value may not equal the liquidation value that was believed to exist at the time of your investment. The duration of a bankruptcy proceeding is also difficult to predict, and a creditor’s return on investment can be adversely affected by delays until the plan of reorganization or liquidation ultimately becomes effective. The administrative costs of a bankruptcy proceeding are frequently high and would be paid out of the debtor’s estate prior to any return to creditors. Because the standards for classification of claims under bankruptcy law are vague, our influence with respect to the class of securities or other obligations we own may be lost by increases in the number and amount of claims in the same class or by different classification and treatment. In the early stages of the bankruptcy process, it is often difficult to estimate the extent of, or even to identify, contingent claims that might be made. In addition, certain claims that have priority by law (for example, claims for taxes) may be substantial and may impair the recovery of other creditors.
The financial projections of our portfolio companies could prove inaccurate.
We generally evaluate the capital structure of portfolio companies on the basis of financial projections prepared by the management of such portfolio companies. These projected operating results will normally be based primarily on judgments of the management of the portfolio companies. In all cases, projections are only estimates of future results that are based upon assumptions made at the time that the projections are developed. General economic conditions, which are not predictable with accuracy, along with other factors may cause actual performance to fall short of the financial projections that were used to establish a given portfolio company’s capital structure. Because of the leverage that is typically employed by our portfolio companies, this could cause a substantial decrease in the value of our investment in the portfolio company. The inaccuracy of financial projections could thus cause our performance to fall short of our expectations.
Price declines in the corporate leveraged loan market may adversely affect the fair value of our portfolio, reducing our net asset value through increased net unrealized depreciation.
Prior to the onset of the financial crisis that began in 2007, securitized investment vehicles, hedge funds and other highly leveraged non-bank financial institutions comprised the majority of the market for purchasing and holding senior, unitranche and subordinated debt. As the trading price of the loans underlying these portfolios began to deteriorate beginning in the first quarter of 2007, we believe that many institutions were forced to raise cash by selling their interests in performing assets in order to satisfy margin requirements or the equivalent of margin requirements imposed by their lenders. This resulted in a cycle of forced deleveraging through price declines, compulsory sales and further price declines, with falling underlying credit values, widespread redemption requests and other constraints resulting from the credit crisis generating further selling pressure.
Conditions in the medium- and large-sized U.S. corporate debt market may experience similar or worse disruption or deterioration in the future, which may cause pricing levels to decline or be volatile. As a result, our net asset value could decline through an increase in unrealized depreciation and incurrence of realized losses in connection with the sale of our investments. This, in turn, could have a material adverse impact on our business, financial condition and results of operations.
37
We are exposed to risks associated with changes in interest rates.
The majority of our debt investments are floating rates, based on a spread to LIBOR or the prime rate. General interest rate fluctuations may have a substantial negative impact on our investments, including those with a LIBOR Floor. Any fluctuations in general interest rates would affect the reference rates used in the interest calculation on our investment. Any of these fluctuations individually, or in the aggregate, may have an adverse impact on the overall return of on our investments.
If general interest rates rise, there is a risk that the portfolio companies in which we hold floating rate securities will be unable to pay escalating interest amounts, which could result in a default under their loan documents with us. Rising interest rates could also cause portfolio companies to shift cash from other productive uses to the payment of interest, which may have a material adverse effect on their business and operations and could, over time, lead to increased defaults. In addition, rising interest rates may increase pressure on us to provide fixed rate loans to our portfolio companies, which could adversely affect our net investment income, as increases in our cost of borrowed funds, if any, would not be accompanied by increased interest income from such fixed-rate investments.
To the extent we borrow money to make investments, our net investment income depends, in part, upon the difference between the rate at which we borrow funds and the rate at which we invest those funds. As a result, we can offer no assurance that a significant change in market interest rates or a decrease in the spread between the rate at which we borrow and the rate at which we invest will not have a material adverse effect on our net investment income to the extent we use debt to finance investments. In periods of rising interest rates, our cost of funds would increase, which could reduce our net investment income.
Additionally, in July 2017, the head of the United Kingdom Financial Conduct Authority announced that it will no longer persuade or compel banks to submit rates for the calculation of LIBOR after 2021. . To identify a successor rate for U.S. dollar LIBOR, the Federal Reserve System, in conjunction with the Alternative Reference Rates Committee, a steering committee comprised of large U.S. financial institutions, has identified the Secured Overnight Financing Rate, or SOFR, as its preferred alternative rate for LIBOR. SOFR is a measure of the cost of borrowing cash overnight, collateralized by U.S. Treasury securities, and is based on directly observable U.S. Treasury-backed repurchase transactions. Although SOFR appears to be the preferred replacement rate for U.S. dollar LIBOR, at this time, it is not possible to predict whether SOFR will attain market traction as a LIBOR replacement tool or the effect of any such changes as the establishment of alternative reference rates or other reforms to LIBOR may be enacted in the United States, United Kingdom or elsewhere. As such, the potential effect of SOFR and LIBOR on our net investment income cannot yet be determined.
If LIBOR ceases to exist, we may need to renegotiate the credit agreements extending beyond 2021 with our portfolio companies that utilize LIBOR as a factor in determining the interest rate to replace LIBOR with the new standard that is established. In addition, any further changes or reforms to the determination or supervision of LIBOR may result in a sudden or prolonged increase or decrease in reported LIBOR, which could have an adverse impact on the market value for or value of any LIBOR-linked securities, loans, and other financial obligations or extensions of credit held by or due to us and could have a material adverse effect on our business, financial condition, tax position and results of operations.
38
Our portfolio companies may incur debt that ranks equally with, or senior to, our investments in such companies.
Our portfolio companies may have, or may be permitted to incur, other debt that ranks equally with, or senior to, the debt in which we invest. By their terms, such debt instruments may entitle the holders to receive payment of interest or principal on or before the dates on which we are entitled to receive payments with respect to the debt instruments in which we invest. Also, in the event of the insolvency, liquidation, dissolution, reorganization or bankruptcy of a portfolio company, holders of debt instruments ranking senior to our investment in that portfolio company would typically be entitled to receive payment in full before we receive any distribution. After repaying such senior creditors, such portfolio company may not have any remaining assets to repay its obligation to us. In the case of debt ranking equally with debt instruments in which we invest, we would have to share on an equal basis any distributions with other creditors holding such debt in the event of an insolvency, liquidation, dissolution, reorganization or bankruptcy of a portfolio company.
To the extent we make investments in restructurings and reorganizations they may be subject to greater regulatory and legal risks than other traditional investments in portfolio companies.
We may make investments in restructurings that involve, or otherwise invest in the debt securities of, companies that are experiencing or are expected to experience severe financial difficulties. These severe financial difficulties may never be overcome and may cause such companies to become subject to bankruptcy proceedings. As such, these investments could subject us to certain additional potential liabilities that may exceed the value of our original investment. For instance, under certain circumstances, payments to us and our distributions to stockholders may be reclaimed if any such payment or distribution is later determined to have been a fraudulent conveyance, preferential payment or similar transaction under applicable bankruptcy and insolvency laws. Furthermore, investments in restructurings may be adversely affected by statutes relating to fraudulent conveyances, voidable preferences, lender liability and a court’s discretionary power to disallow, subordinate or disenfranchise particular claims. Under certain circumstances, a lender that has inappropriately exercised control of the management and policies of a debtor may have its claims subordinated or disallowed, or may be found liable for damages suffered by parties as a result of such actions.
There may be circumstances where our debt investments are subordinated to claims of other creditors, or we could be subject to lender liability claims.
If one of our portfolio companies were to go bankrupt, depending on the facts and circumstances, including the extent to which we actually provided managerial assistance to that portfolio company or a representative of us or our Adviser sat on the board of directors of such portfolio company, a bankruptcy court might re-characterize our debt investment and subordinate all or a portion of our claim to that of other creditors. Bankruptcy courts weigh equitable considerations when determining the recovery creditors may receive. As a result, it is difficult to predict with any certainty the situations in which our legal rights may be subordinated to other creditors in a bankruptcy. For example, in situations where a bankruptcy carries a higher degree of political or broader economic significance, our recovery may be adversely affected.
In addition, lenders in certain cases can be subject to lender liability claims for actions taken by them when they become too involved in the borrower’s business or exercise control over a borrower. It is possible that we could become subject to a lender’s liability claim, including as a result of actions taken if we render significant managerial assistance to, or exercise control or influence over the board of directors of, the borrower.
39
We may not have the funds or ability to make additional investments in our portfolio companies.
After our initial investment in a portfolio company, we may be called upon from time to time to provide additional funds to such company or have the opportunity to increase our investment through the exercise of a warrant or other right to purchase shares. There is no assurance that we will make, or will have sufficient funds to make, follow-on investments. Even if we have sufficient capital to make a desired follow-on investment, we may elect not to make a follow-on investment because we may not want to increase our level of risk, we prefer other opportunities, we are limited in our ability to do so by compliance with BDC requirements, or we desire to maintain our RIC tax status. Our ability to make follow-on investments may also be limited by our Adviser’s allocation policies. Any decisions not to make a follow-on investment or any inability on our part to make such an investment may have a negative impact on a portfolio company in need of such an investment, may result in a missed opportunity for us to increase our participation in a successful operation or may reduce the expected return on the investment.
Prepayments of our debt investments by our portfolio companies could adversely impact our results of operations and reduce our return on equity.
We are subject to the risk that the investments we make in our portfolio companies may be repaid prior to maturity. When this occurs, we will generally reinvest these proceeds in temporary investments, pending their future investment in new portfolio companies. These temporary investments may have substantially lower yields than the debt being prepaid, and we could experience significant delays in reinvesting these amounts. Alternative future investments in new portfolio companies may also be at lower yields than the debt that was repaid and will, in any case, require additional Adviser time. As a result, our results of operations could be materially adversely affected if one or more of our portfolio companies elect to prepay amounts owed to us. Additionally, prepayments, net of prepayment fees, could negatively impact our return on equity.
To the extent OID or PIK constitutes a portion of our income, we will be exposed to risks associated with the deferred receipt of cash representing such income.
Our investments may include instruments issued with OID or PIK provisions. To the extent OID or PIK constitutes a portion of our income, we will be exposed to typical risks associated with such income being required to be included in taxable and accounting income prior to receipt of cash, including:
| · | instruments issued with OID may have unreliable valuations because the accruals require judgments about collectability. |
| · | instruments issued with OID may create heightened credit risks because the inducement to trade higher rates for the deferral of cash payments typically represents, to some extent, speculation on the part of the borrower. |
| · | for accounting purposes, cash distributions to stockholders derived from OID income are not considered to have been made from our paid-in capital, although they may be paid from the proceeds of any offering of the Shares. Thus, although a distribution of OID income comes from the cash invested by the stockholders, the 1940 Act does not require that stockholders be given notice of this fact. |
| · | in the case of PIK “toggle” debt, a PIK election has the simultaneous effects of increasing the assets under management, thereby increasing our base management fee, and increasing our investment income. |
| · | OID creates risk of non-refundable cash payments to our Adviser based on non-cash accruals that may never be realized. |
| · | in addition, in the event we recognize deferred loan interest income in excess of our available capital as a result of our receipt of PIK interest, we may be required to liquidate assets in order to pay a portion of the base management fee. |
40
Risks Relating to the Shares
There is no public market for the Shares, and we do not expect any market for the Shares to develop.
There is no existing trading market for the Shares. We do not expect any market for the Shares to develop in the future or, if developed, such market may not be sustained. In the absence of a trading market or unless we choose to conduct a tender offer, an investor may be unable to liquidate an investment in the Shares.
We may be unable to invest a significant portion of the net proceeds of any offering of the Shares on acceptable terms in an acceptable timeframe.
Delays in investing the net proceeds of any offering of the Shares may impair our performance. We cannot assure you we will be able to identify any investments that meet our investment objective or that any investment that we make will produce a positive return. We may be unable to invest the net proceeds of any offering of the Shares on acceptable terms within the time period that we anticipate or at all, which could harm our financial condition and operating results.
Before investing our cash on hand, we will invest such primarily in cash equivalents, U.S. government securities and other high-quality debt instruments maturing in one year or less from the time of investment. This will produce returns that are significantly lower than the returns that we expect to achieve when our portfolio is fully invested in securities meeting our investment objective. As a result, any distributions that we pay while our portfolio is not fully invested in securities meeting our investment objective may be lower than the distributions that we may be able to pay when our portfolio is fully invested in securities meeting our investment objective.
Risks Relating to Our Business and Structure
We are a relatively new company and have a limited operating history.
We were formed on January 29, 2015 and are the first BDC to be advised by our Adviser. As a result, we are subject to all of the business risks and uncertainties associated with any young business, including the risk that we will not achieve our investment objective. We take time to invest capital in part because extending loans to middle-market borrowers requires substantial due diligence and structuring. We will invest any uninvested cash that we hold in short-term investments, such as cash and cash equivalents, U.S. government securities and high-quality debt instruments maturing in one year or less from the time of investment. As a result, we earn yields substantially lower than the interest income that we receive in respect of loans to middle-market borrowers, and our distributions, if any, may be lower than the distributions that may be paid when our portfolio is fully invested.
Our portfolio may be concentrated in a limited number of portfolio companies and industries, which will subject us to a risk of significant loss if any of these companies defaults on its obligations under any of its debt instruments or if there is a downturn in a particular industry.
Although we do not intend to focus our investments in any specific industries, our portfolio may be concentrated in a limited number of portfolio companies and industries. Beyond the asset diversification requirements associated with our qualification as a RIC under Subchapter M of the Code, we do not have fixed guidelines for diversification; while we do not target any specific industries, our investments may be concentrated in relatively few industries. As a result, the aggregate returns we realize may be significantly adversely affected if a small number of investments perform poorly or if we need to write down the value of any one investment. Additionally, a downturn in any particular industry in which we are invested could also significantly impact the aggregate returns we realize.
41
Because our business model depends to a significant extent upon relationships with corporations, financial institutions and investment firms, the inability of our Adviser to maintain or develop these relationships, or the failure of these relationships to generate investment opportunities, could adversely affect our business.
Our Adviser depends on its relationships with corporations, financial institutions and investment firms, and we rely indirectly to a significant extent upon these relationships to provide us with potential investment opportunities. If our Adviser fails to maintain its existing relationships or develop new relationships or sources of investment opportunities, we may not be able to grow our investment portfolio. In addition, individuals with whom our Adviser has relationships are not obligated to provide us with investment opportunities. Therefore, we can offer no assurance that such relationships will generate investment opportunities for us.
We may face increasing competition for investment opportunities, which could delay deployment of our capital, reduce returns and result in losses.
We compete for investments with other BDCs and investment funds (including registered investment companies, private equity funds and mezzanine funds), as well as traditional financial services companies such as commercial and investment banks and other sources of funding, such as issuers of collateral loan obligations and other structured loan funds. Moreover, alternative investment vehicles, such as hedge funds, have begun to invest in areas in which they have not traditionally invested, including making investments in our target market of privately owned U.S. companies. As a result of these new entrants, competition for investment opportunities in privately owned U.S. companies could intensify. Many of our competitors are substantially larger and have considerably greater financial, technical and marketing resources than we do. For example, some competitors may have a lower cost of capital and access to funding sources that are not available to us. In addition, some of our competitors may have higher risk tolerances or different risk assessments than we have. These characteristics could allow our competitors to consider a wider variety of investments, establish more relationships and offer prospective borrowers better pricing and more flexible structuring than we are able to do.
We may lose investment opportunities if we do not match our competitors’ pricing, terms and structure criteria. If we are forced to match these criteria to make investments, we may not be able to achieve acceptable returns on our investments or lose capital. Any increase in the number and/or the size of our competitors could force us to accept less attractive investment terms or not lend. Furthermore, many of our competitors are not subject to the regulatory restrictions that the 1940 Act imposes on us as a BDC or the source of income, asset diversification and distribution requirements we must satisfy to maintain our RIC status. Such competitive pressures may adversely affect our business, financial condition, results of operations and cash flows. As a result of this competition, we may not be able to take advantage of attractive investment opportunities from time to time. Also we may not be able to identify and make investments that are consistent with our investment objective.
We may not be able to pay you distributions, and our distributions may not grow over time.
Subject to the discretion of our Board of Directors and applicable legal restrictions, we intend to make distributions to our stockholders out of assets legally available for distribution. We cannot assure you that we will achieve investment results that will allow us to make a specified level of cash distributions or to increase our cash distributions in the future. All distributions will be paid at the discretion of our Board of Directors and will depend on our earnings, our net investment income, our financial condition, maintenance of our RIC tax status, compliance with applicable BDC regulations and such other factors as our Board of Directors may deem relevant from time to time.
42
We may need to raise additional capital to grow because we must distribute most of our income.
We may need additional capital to fund growth in our investments. A reduction in the availability of new capital could limit our ability to grow. We must distribute dividends each taxable year of an amount generally at least equal to 90% of our investment company taxable income, determined without regard to any deduction for dividends paid, to our stockholders to maintain our ability to be subject to tax as a RIC. As a result, any such cash earnings may not be available to fund investment originations. We expect to issue equity securities in private offerings. If we fail to obtain funds from such sources or from other sources to fund our investments, it could limit our ability to grow, which may have an adverse effect on the value of our securities. In addition, our ability to borrow or issue additional preferred stock may be restricted if our total assets are less than the required asset coverage ratio under the 1940 Act, currently 200% (or 150% upon receipt of certain approvals and subject to certain disclosure requirements) of total borrowings and preferred stock.
A significant portion of our investment portfolio is recorded at fair value as determined in good faith by our Board of Directors and, as a result, there is uncertainty as to the value of our portfolio investments.
We carry our portfolio investments at market value or, if there is no readily available market value, at fair value. There is no public market or active secondary market for many of the securities of the privately held companies in which we have invested. The majority of our investments are not publicly traded or actively traded on a secondary market but, instead, may be traded on a privately negotiated over-the-counter secondary market for institutional investors. As a result, we value these securities quarterly at fair value as determined in good faith by our Board of Directors.
The determination of fair value, and thus the amount of unrealized losses we may incur in any year, is to a degree subjective. We value these securities quarterly at fair value as determined in good faith by our Board of Directors, which may rely on the services of our Adviser. The types of factors that may be considered in determining the fair values of our investments include the nature and realizable value of any collateral, the portfolio company’s ability to make payments and its earnings, the markets in which the portfolio company does business, comparison to publicly traded companies, discounted cash flow, current market interest rates and other relevant factors. Because such valuations, and particularly valuations of private securities and private companies, are inherently uncertain, they may fluctuate significantly over short periods of time due to changes in market conditions. The determinations of fair value by our Board of Directors may differ materially from the values that would have been used if an active market and market quotations existed for these investments. Our net asset value could be adversely affected if the determinations regarding the fair value of our investments were materially higher than the values that we ultimately realize upon the disposal of such investments.
Our distribution proceeds may exceed our earnings, particularly during the period before we have substantially invested the net proceeds from any offering of the Shares. We have not established any limit on the extent to which we may use proceeds from any offering of the Shares to fund distributions, which may reduce the amount of capital we ultimately invest in assets.
We expect to pay distributions out of assets legally available for distribution. In the event that we encounter delays in locating suitable investment opportunities, we may pay our distributions from the proceeds of any offering of the Shares in anticipation of future cash flow, which may constitute a return of your capital. Distributions from the proceeds of any offering of the Shares also could reduce the amount of capital we ultimately invest in portfolio companies. Accordingly, stockholders who receive the payment of a distribution from us should not assume that such distribution is the result of a net profit earned by us.
Our Adviser may change our operating policies and strategies without prior notice or stockholder approval, the effects of which may be adverse to our stockholders.
Our Adviser has the authority to modify or waive our operating policies, investment criteria and strategies without prior notice and without stockholder approval. We cannot predict the effect any changes to our current operating policies, investment criteria and strategies would have on our business, net asset value, operating results and the value of the Shares. However, the effects might be adverse, which could negatively impact our ability to pay you distributions and cause you to lose all or part of your investment. Moreover, we will have significant flexibility in investing the net proceeds of any offering of the Shares and may use the net proceeds from any offering of the Shares in ways with which investors may not agree.
43
We are subject to risks associated with cybersecurity and cyber incidents which may adversely affect our business by causing a disruption to our operations, a compromise or corruption of our confidential information and/or damage to our business relationships, all of which could negatively impact our business, financial condition and operating results.
Our business relies on secure information technology systems. These systems are subject to potential attacks, including through adverse events that threaten the confidentiality, integrity or availability of our information resources (i.e., cyber incidents). These attacks could involve gaining unauthorized access to our information systems for purposes of misappropriating assets, stealing confidential information, corrupting data or causing operational disruption and result in disrupted operations, misstated or unreliable financial data, liability for stolen assets or information, increased cybersecurity protection and insurance costs, litigation and damage to our business relationships, any of which could have a material adverse effect on our business, financial condition and results of operations. As our reliance on technology has increased, so have the risks posed to our information systems, both internal and those provided by the Adviser and third-party service providers. While we, along with our Adviser, have implemented processes, procedures and internal controls seeking to mitigate cybersecurity risks and cyber intrusions, these measures may be ineffective and do not guarantee that a cyber incident will not occur or that our financial results, operations or confidential information will not be negatively impacted by such an incident.
We may experience fluctuations in our quarterly results.
We could experience fluctuations in our quarterly operating results due to a number of factors, including our ability or inability to make investments in companies that meet our investment criteria, the interest rate payable and default rates on the debt securities we acquire, the level of our expenses, variations in and timing of the recognition of realized and unrealized gains or losses, the degree to which we encounter competition in our markets, and general economic conditions. As a result of these factors, results for any previous period should not be relied upon as indicative of performance in future periods. These occurrences could have a material adverse effect on our results of operations, the value of your investment and our ability to pay distributions.
Price declines and illiquidity in the corporate debt markets may adversely affect the fair value of our portfolio investments, reducing our net asset value through increased net unrealized depreciation.
We carry our investments at market value or, if no market value is ascertainable, at fair value. A decrease in the market values or fair values of our investments is recorded as unrealized depreciation. Declines in prices and liquidity in the corporate debt markets may result in significant net unrealized depreciation in our portfolio, reducing their net asset value. Depending on market conditions, we could incur substantial realized losses and may suffer additional unrealized losses in future periods, which could have a material adverse impact on our business, financial condition and results of operations and our net asset value.
We are subject to risks in using custodians and other agents.
We depend on the services of custodians or other agents to carry out certain securities transactions and administrative services for us. In the event of the insolvency of a custodian, we may not be able to recover equivalent assets in full as we will rank among the custodian’s unsecured creditors in relation to assets which the custodian borrows, lends or otherwise uses. In addition, our cash held with a custodian may not be segregated from the custodian’s own cash, and we therefore may rank as unsecured creditors in relation thereto. The inability to recover assets from the custodian could have a material impact on our performance.
Uncertainty about administration initiatives of the current U.S. President could negatively impact our business, financial condition and results of operations.
44
The Trump administration has called for significant changes to U.S. trade, healthcare, immigration, foreign and government regulatory policy. In this regard, there is significant uncertainty with respect to legislation, regulation and government policy at the federal level, as well as the state and local levels. Recent events have created a climate of heightened uncertainty and introduced new and difficult-to-quantify macroeconomic and political risks with potentially far-reaching implications. There has been a corresponding meaningful increase in the uncertainty surrounding interest rates, inflation, foreign exchange rates, trade volumes and fiscal and monetary policy. To the extent the U.S. Congress or the Trump administration implements changes to U.S. policy, those changes may impact, among other things, the U.S. and global economy, international trade and relations, unemployment, immigration, corporate taxes, healthcare, the U.S. regulatory environment, inflation and other areas. Although we cannot predict the impact, if any, of these changes to our business, they could adversely affect our business, financial condition, operating results and cash flows. Until we know what policy changes are made and how those changes impact our business and the business of our competitors over the long term, we will not know if, overall, we will benefit from them or be negatively affected by them.
Global economic, political and market conditions may adversely affect our business, results of operations and financial condition, including our revenue growth and profitability.
The current worldwide financial market situation, as well as growing social and political tensions in the United States and around the world, may contribute to increased market volatility, may have long-term effects on the United States and worldwide financial markets, and may cause economic uncertainties or deterioration in the United States and worldwide through economic sanctions and otherwise.
As a consequence of the United Kingdom’s vote to withdraw from the European Union, the government of the United Kingdom gave notice of its withdrawal from the European Union, commonly referred to as “Brexit”. The process for the United Kingdom to exit the European Union, and the longer term economic, legal, political, regulatory and social framework to be put in place between the United Kingdom and the European Union remain unclear and may lead to ongoing political and economic uncertainty and periods of exacerbated volatility in both the United Kingdom and in wider European and global markets for some time. Additional risks associated with the outcome of Brexit include macroeconomic risk to the United Kingdom and European economies, impetus for further disintegration of the European Union and related political stresses (including those related to sentiment against cross border capital movements and activities of investors like us), prejudice to financial services business that are conducting business in the European Union and which are based in the United Kingdom, legal uncertainty regarding achievement of compliance with applicable financial and commercial laws and regulations, and the unavailability of timely information as to expected legal, tax and other regimes. Any further exits from the European Union, or the possibility of such exits, would likely cause additional market disruption globally and introduce new legal and regulatory uncertainties. In addition, continuing signs of deteriorating sovereign debt conditions in Europe and an economic slowdown in China create uncertainty that could lead to further disruptions, instability and weakening consumer, corporate and financial confidence. We may in the future have difficulty accessing debt and equity capital markets, and a severe disruption in the global financial markets, deterioration in credit and financing conditions or uncertainty regarding U.S. government spending and deficit levels, Brexit, European sovereign debt, Chinese economic slowdown or other global economic conditions could have a material adverse effect on our business, financial condition and results of operations.
We are subject to risks related to corporate social responsibility.
There is increased public scrutiny related to environmental, social and governance (“ESG”) activities of public companies. We risk damage to our brand and reputation if we do not act responsibly in a number of key areas, including diversity and inclusion, environmental stewardship, support for local communities, corporate governance and transparency and considering ESG factors in our investment processes. Adverse incidents with respect to ESG activities could impact the value of our brand, the cost of our operations and relationships with investors, all of which could negatively affect our business and results of operations. Additionally, new regulatory initiatives related to ESG could adversely affect our business.
45
Risks Related to our Adviser and its Affiliates
Our Adviser and its affiliates, including our officers and some of our directors, could face conflicts of interest caused by compensation arrangements with us, which could result in actions that are not in the best interests of our stockholders.
Many of our portfolio investments are and are expected to be made in the form of securities that are not publicly traded. As a result, our Board of Directors determines the fair value of these securities in good faith. In connection with that determination, our Adviser may provide our Board of Directors with valuations based upon the most recent portfolio company financial statements available and projected financial results of each portfolio company. In addition, certain of our Investment Committee members that are not on our Board of Directors have an indirect pecuniary interest in our Adviser. The participation of our Adviser in our valuation process, and the indirect pecuniary interest in our Adviser of certain of our Investment Committee members, could result in a conflict of interest because the base management fee is based, in part, on our gross assets, and our incentive fees are based, in part, on unrealized depreciation.
The part of the management and incentive fees payable to our Adviser that relates to our net investment income is computed and paid on income that may include interest income that has been accrued for GAAP (without any adjustments) but not yet received in cash, such as OID, debt instruments with PIK interest, interest and zero coupon securities. This fee structure may be considered to involve a conflict of interest for our Adviser to the extent that it may encourage our Adviser to favor debt financings that provide for deferred interest, rather than current cash payments of interest. Our Adviser may have an incentive to invest in deferred interest securities in circumstances where it would not have done so but for the opportunity to continue to earn the fees even when the issuers of the deferred interest securities would not be able to make actual cash payments to us on such securities. This risk could be increased because our Adviser is not obligated to reimburse us for any fees received even if we subsequently incur losses or never receive in cash the deferred income that was previously accrued.
The Investment Advisory Agreement and the Administration Agreement were not negotiated on an arm’s length basis and may not be as favorable to us as if they had been negotiated with an unaffiliated third party.
Because the sole stockholder of the Company at the time of the negotiations was an affiliate of our Adviser and our Administrator, the Investment Advisory Agreement and the Administration Agreement were negotiated between related parties. Consequently, while the terms of each were subject to approval by our Board of Directors, including a majority of independent directors, such terms, including the advisory fees payable under the Investment Advisory Agreement may not be as favorable to us as if they had been negotiated with an unaffiliated third party.
Our Adviser’s liability is limited under the Investment Advisory Agreement, and we are required to indemnify our Adviser against certain liabilities, which may lead our Adviser to act in a riskier manner on our behalf than it would when acting for its own account.
Our Adviser does not assume any responsibility to us other than to render the services described in the Investment Advisory Agreement, and it will not be responsible for any action of our Board of Directors in declining to follow our Adviser’s advice or recommendations.
The time and resources that individuals associated with our Adviser devote to us may be diverted, and we may face additional competition due to the fact that our Adviser is not prohibited from raising money for or managing other entities that make the same types of investments that we target.
Our Adviser is not prohibited from raising money for and managing future investment entities that make the same types of investments as those we target. As a result, the time and resources that our Adviser devotes to us may be diverted. During times of intense activity in other programs, our Adviser may devote less time and resources to our business than is necessary or appropriate. In addition, we will compete with such other entities for the same investors and investment opportunities. We may co-invest with such investment entities only to the extent permitted by the 1940 Act, the rules and regulations under the 1940 Act and the exemptive relief under the 1940 Act that we, the Adviser and other affiliates received from the SEC. However, even with such exemptive relief, we are unable to participate in certain transactions originated by our Adviser or its affiliates. Affiliates of our Adviser, whose primary business includes the origination of investments, engage in investment advisory businesses with accounts that compete with us. Affiliates of our Adviser have no obligation to make their originated investment opportunities available to us.
46
We may be obligated to pay our Adviser incentive compensation even if we incur a loss.
Our Adviser is entitled to incentive compensation for each calendar quarter in an amount equal to a percentage of the excess of our pre-incentive fee net investment income for that quarter (before deducting incentive compensation) above a performance threshold for that quarter. Our pre-incentive fee net investment income for incentive compensation purposes excludes realized and unrealized capital losses and depreciation that we may incur in the calendar quarter, even if such capital losses or depreciation result in a net loss on our statement of operations for that quarter. Thus, we may be required to pay incentive compensation for a calendar quarter even if there is a decline in the value of our portfolio or we incur a net loss for that quarter, subject to the deferral provisions. See “Item 1. Business — Investment Advisory Agreement.”
We may make investments that could give rise to a conflict of interest.
We do not invest in, or hold securities of, companies that are controlled by our affiliates’ other clients. However, our affiliates’ other clients may invest in, and gain control over, one of our portfolio companies. If our affiliates’ other client or clients gain control over one of our portfolio companies, this may create conflicts of interest and subject us to certain restrictions under the 1940 Act. As a result of these conflicts and restrictions, our Adviser may be unable to implement our investment strategies as effectively as they could have in the absence of such conflicts or restrictions. For example, as a result of a conflict or restriction, our Adviser may be unable to engage in certain transactions that they would otherwise pursue. In order to avoid these conflicts and restrictions, our Adviser may choose to exit these investments prematurely and, as a result, we may forego positive returns associated with such investments. In addition, to the extent that another client holds a different class of securities than us as a result of such transactions, our interests may not be aligned. Our ability to enter into transactions with our affiliates may be restricted.
As a BDC, we are prohibited under the 1940 Act from participating in transactions with certain of our affiliates without the prior approval of a majority of the independent directors and, in some cases, the SEC. Any person that owns, directly or indirectly, 5% or more of our outstanding voting securities is our affiliate for purposes of the 1940 Act, and we are generally prohibited from buying or selling any securities from or to such affiliate, absent the prior approval of our Board of Directors. The 1940 Act also prohibits certain “joint” transactions with certain of our affiliates, which in certain circumstances could include investments in the same portfolio company (whether at the same or different times to the extent the transaction involves jointness), without prior approval of our Board of Directors and, in some cases, the SEC. If a person acquires more than 25% of our voting securities, we will be prohibited from buying or selling any security from or to such person or certain of that person’s affiliates, or entering into prohibited joint transactions with such persons, absent the prior approval of the SEC. Similar restrictions limit our ability to transact business with our officers or directors or their affiliates. The SEC has interpreted the BDC regulations governing transactions with affiliates to prohibit certain “joint transactions” involving entities that share a common investment adviser or have investment advisers under common control. As a result of these restrictions, we may be prohibited from buying or selling any security from or to any portfolio company that is controlled by a fund managed by our Adviser or its respective affiliates except under certain circumstances or with the prior approval of the SEC, which may limit the scope of investment opportunities that would otherwise be available to us.
We may, however, invest alongside our Adviser’s and/or its affiliates’ other clients, in certain circumstances where doing so is consistent with applicable law and SEC staff interpretations, guidance and exemptive relief orders. However, we can offer no assurance that investment opportunities will be allocated to us fairly or equitably in the short-term or over time or that there may not be inadvertent errors in our application of our Adviser’s allocation policy.
We, the Adviser, and other affiliates have received exemptive relief that permits greater flexibility to negotiate the terms of co-investments if our Board of Directors determines that it would be advantageous for us to co-invest with other accounts sponsored or managed by our Adviser or its affiliates in a manner consistent with our investment objective, positions, policies, strategies and restrictions, as well as regulatory requirements and other relevant factors. We cannot assure you, however, that we will continue to develop opportunities that comply with such limitations.
47
In situations where co-investment with our affiliates’ other clients is not permitted under the 1940 Act and related rules, existing or future staff guidance or the terms and conditions of exemptive relief granted to our Adviser and its affiliates by the SEC, our Adviser will need to decide which client or clients will proceed with the investment. Generally, we will not be entitled to make a co-investment in these circumstances and, to the extent that another client elects to proceed with the investment, we will not be permitted to participate. Moreover, except in certain circumstances, we will be unable to invest in any issuer in which an affiliates’ other client holds a controlling interest. These restrictions may limit the scope of investment opportunities that would otherwise be available to us.
Our ability to achieve our investment objective depends on our Adviser’s ability to manage and support our investment process. If our Adviser were to lose its key professional(s), our ability to achieve our investment objective could be significantly harmed.
We have no internal management capacity or employees other than our appointed executive officers and depend upon the investment expertise, skill and network of business contacts of our Adviser to achieve our investment objective. Our Adviser evaluates, negotiates, structures, executes, monitors and services our investments. Our future success will depend to a significant extent on the continued service and coordination of our Adviser’s senior investment professionals. The departure of a significant number of our Adviser’s senior investment professionals could have a material adverse effect on our ability to achieve our investment objective.
Our ability to achieve our investment objective also depends on our Adviser’s ability to identify, analyze, invest in, finance and monitor companies that meet our investment criteria. Our Adviser’s capabilities in structuring the investment process, providing competent, attentive and efficient services to us and facilitating access to financing on acceptable terms depend on the involvement of investment professionals in an adequate number and of adequate sophistication to handle the flow of transactions. To achieve our investment objective, our Adviser will need to retain, hire, train, supervise and manage new investment professionals to participate in our investment selection and monitoring process. Our Adviser may not be able to find qualified investment professionals in a timely manner or at all. Any failure to do so could have a material adverse effect on our business, financial condition and results of operations.
Risks Related to our Election to be Regulated as a BDC and Subject to Tax as a RIC
We are regulated as a BDC, and we have elected to be treated as a RIC under the Code. Accordingly, you should carefully consider the risks below.
We are subject to corporate-level income tax if we are unable to qualify as a RIC under Subchapter M of the Code or to satisfy RIC distribution requirements.
In order for us to qualify for and maintain RIC tax treatment under the Code, we must maintain our election with the SEC to be treated as a BDC under the 1940 Act as well as meet the Annual Distribution Requirement, the 90% Income Test and the Diversification Tests. See “Item 1. Business — Material U.S. Federal Income Tax Considerations.”
The Annual Distribution Requirement is satisfied if we distribute dividends to our stockholders each taxable year of an amount generally at least equal to 90% of our investment company taxable income, determined without regard to the deduction for any dividends paid. We are subject to tax on any retained investment company taxable income and/or net capital gains. We must also satisfy an additional annual distribution requirement in respect of each calendar year in order to avoid a 4% excise tax on the amount of any under-distribution. Although we do not intend to use debt financing in the near term, we are subject to an asset coverage ratio requirement under the 1940 Act and may in the future become subject to restrictions from making distributions necessary to satisfy the distribution requirements. If we are unable to obtain cash from other sources, we could fail to qualify for RIC tax treatment, or could be required to retain a portion of our income or gains, and thus become subject to corporate-level income tax.
48
The 90% Income Test is satisfied if we earn at least 90% of our gross income each taxable year from dividends, interest, gains from the sale of stock or securities, or qualifying sources.
The Diversification Tests is satisfied if we meet certain asset composition requirements at the end of each quarter of our taxable year. To satisfy this requirement, at least 50% of the value of our assets must consist of cash, cash equivalents, U.S. government securities, securities of other RICs, and other acceptable securities; and no more than 25% of the value of our assets can be invested in the securities, other than U.S. government securities or securities of other RICs, of one issuer, of two or more issuers that are controlled, as determined under applicable Code rules, by us and that are engaged in the same or similar or related trades or businesses or of certain “qualified publicly traded partnerships.” Failure to meet these requirements may result in our having to dispose of certain investments quickly in order to prevent the loss of RIC status. Because most of our investments are in private companies, and therefore are relatively illiquid, any such dispositions could be made at disadvantageous prices and could result in substantial losses.
If we fail to qualify for or maintain RIC tax treatment for any reason and are subject to corporate income tax, the resulting corporate taxes could substantially reduce our net assets, the amount of income available for distribution, and the amount of our distributions.
Our distribution proceeds may exceed our earnings, particularly during the period before we have substantially invested the net proceeds from any offering of the Shares. We have not established any limit on the extent to which we may use proceeds from any offering of the Shares to fund distributions, which may reduce the amount of capital we ultimately invest in assets.
We expect to pay distributions out of assets legally available for distribution. In the event that we encounter delays in locating suitable investment opportunities, we may pay our distributions from the proceeds of any offering of the Shares in anticipation of future cash flow, which may constitute a return of your capital. Distributions from the proceeds of any offering of the Shares also could reduce the amount of capital we ultimately invest in portfolio companies. Accordingly, stockholders who receive the payment of a distribution from us should not assume that such distribution is the result of a net profit earned by us.
We may choose to pay distributions in the form of the Shares, in which case our investors may be required to pay federal income taxes in cash in excess of the cash distributions they receive.
We may distribute taxable dividends that are payable in cash or the Shares at the election of each investor. Under certain applicable provisions of the Code and the Treasury regulations, distributions payable in cash or the Shares at the election of investors are treated as taxable dividends. If we decide to make any distributions consistent with these rulings that are payable in part in the Shares, taxable investors receiving such dividends will be required to include the full amount of the dividend (whether received in cash, the Shares, or a combination of cash and the Shares) as ordinary income (or as long-term capital gain to the extent such distribution is properly reported as a capital gain dividend) to the extent of our current and accumulated earnings and profits for U.S. federal income tax purposes. As a result, a U.S. investor may be required to pay tax with respect to such dividends in excess of any cash received. If a U.S. investor sells the Shares it receives as a dividend in order to pay this tax, the sales proceeds may be less than the amount included in income with respect to the dividend, depending on the market price of the Shares at the time of the sale. Furthermore, with respect to non-U.S. stockholders, we may be required to withhold U.S. tax with respect to such dividends, including in respect of all or a portion of such dividend that is payable in the Shares. In addition, if a significant number of our stockholders determine to sell the Shares in order to pay taxes owed on dividends, it may put downward pressure on the trading price of the Shares.
49
If we do not qualify as a “publicly offered regulated investment company,” as defined in the Code, certain investors will be taxed as though they received a distribution of some of our expenses.
A “publicly offered regulated investment company” is a RIC whose shares are either (1) continuously offered pursuant to a public offering, (2) regularly traded on an established securities market or (3) held by at least 500 persons at all times during the taxable year. We do not expect to qualify as a publicly offered RIC for any period. As a result, a non-corporate U.S. stockholder’s allocable portion of our affected expenses will be treated as an additional deemed distribution to the stockholder and will be deductible by such stockholder only to the extent permitted under the limitations described below. For non-corporate U.S. stockholders, including individuals, trusts and estates, significant limitations generally apply to the deductibility of certain expenses of a non-publicly offered RIC. In particular, for taxable years beginning after 2025, these expenses, referred to as miscellaneous itemized deductions, are deductible to a U.S. individual only to the extent they exceed 2% of such a stockholder’s adjusted gross income, are not deductible for AMT purposes and are subject to the overall limitation on itemized deductions under Section 68 of the Code. For taxable years beginning after 2017 and prior to 2026, miscellaneous itemized deductions are disallowed in their entirety.
We may have difficulty paying our required distributions if we recognize income before or without receiving cash representing such income.
For U.S. federal income tax purposes, we may be required to recognize taxable income in circumstances in which we do not receive a corresponding payment in cash. For example, if we hold debt obligations that are treated under applicable tax rules as having OID, such as debt instruments with PIK interest or, in certain cases, increasing interest rates or debt instruments that were issued with warrants, we must include in income a portion of the OID that accrues over the life of each debt obligation in determining our taxable income, regardless of whether cash representing such income is received by us in the same taxable year. We may also have to include in income other amounts that we have not yet received in cash, such as deferred loan origination fees that are paid after origination of the loan or are paid in non-cash compensation such as warrants or stock. Furthermore, we may invest in non-U.S. corporations (or other non-U.S. entities treated as corporations for U.S. federal income tax purposes) that could be treated under the Code and Treasury regulations as “passive foreign investment companies” and/or “controlled foreign corporations.” The rules relating to investment in these types of non-U.S. entities are designed to ensure that U.S. taxpayers are either, in effect, taxed currently (or on an accelerated basis with respect to corporate level events) or taxed at increased tax rates at distribution or disposition. In certain circumstances this could require us to recognize income where we do not receive a corresponding payment in cash. Further, we may elect to amortize market discount and include such amount currently in our taxable income, instead of upon disposition, as an election not to do so would limit our ability to deduct interest expense for tax purposes.
Because any OID or other amounts accrued will be included in our investment company taxable income for the year of the accrual, we may be required to make a distribution to our stockholders in order to satisfy the Annual Distribution Requirement, even if we will not have received any corresponding cash amount. As a result, we may have difficulty meeting the Annual Distribution Requirement necessary to obtain and maintain RIC tax treatment under the Code. We may have to sell some of our investments at times and/or at prices we would not consider advantageous, raise additional equity capital, make a partial share distribution, or forgo new investment opportunities for this purpose. If we are not able to obtain cash from other sources, and choose not to make a qualifying share distribution, we may fail to qualify for RIC tax treatment and thus become subject to corporate-level income tax.
The requirement that we, as a BDC, invest a sufficient portion of our assets in qualifying assets could preclude us from investing in accordance with our current business strategy; conversely, any failure on our part to invest a sufficient portion of our assets in qualifying assets could cause us to lose our status as a BDC.
As a BDC, the 1940 Act prohibits us from acquiring any assets other than certain “qualifying assets,” as defined in the 1940 Act, unless, at the time of and after giving effect to such acquisition, at least 70% of our total assets are qualifying assets. Therefore, we may be precluded from investing in what we believe are attractive investments if such investments are not qualifying assets. Conversely, if we fail to invest a sufficient portion of our assets in qualifying assets, we could lose our status as a BDC, which would have a material adverse effect on our business, financial condition, and result of operations. Similarly, these rules could prevent us from making additional investments in existing portfolio companies, which could result in the dilution of our position.
50
Failure to maintain our status as a BDC would reduce our operating flexibility.
If we do not remain a BDC, we could be subject to regulation as a registered closed-end investment company under the 1940 Act, which would subject us to substantially more regulatory restrictions and correspondingly decrease our operating flexibility.
Any failure to comply with the requirements imposed on BDCs by the 1940 Act could cause the SEC to bring an enforcement action against us and/or expose us to claims of private litigants. In addition, upon approval of a majority of our stockholders, we may elect to withdraw our status as a BDC. If we decide to withdraw our election, or if we otherwise fail to qualify, or maintain our qualification, as a BDC, we may be subject to substantially greater regulation under the 1940 Act as a closed-end investment company. Compliance with such regulations would significantly decrease our operating flexibility, and could significantly increase our costs of doing business.
Changes in laws or regulations governing our operations may adversely affect our business or cause us to alter our business strategy.
We and our portfolio companies are subject to regulation at the local, state and federal level. New legislation may be enacted or new interpretations, rulings or regulations could be adopted, including those governing the types of investments we are permitted to make or that impose limits on our ability to pledge a significant amount of our assets to secure loans or that restrict the operations of a portfolio company, any of which could harm us and our stockholders and the value of our investments, potentially with retroactive effect. For example, certain provisions of the Dodd Frank Act, which influences many aspects of the financial services industry, have been amended or repealed and the Code has been substantially amended and reformed. Any amendment or repeal of legislation, or changes in regulations or regulatory interpretations thereof, could create uncertainty in the near term, which could have a material adverse impact on our business, financial condition and results of operations. In addition, on March 20, 2019, the SEC proposed a series of rule and form amendments pursuant to the SBCAA. However, in the absence of final rules, the revisions required under the SBCAA became self-implementing on March 24, 2019. In the continued absence of transition guidance and through the effectiveness of the final rules, the appropriate mechanisms for implementing offering reform may remain in flux.
In addition, any changes to the laws and regulations governing our operations relating to permitted investments may cause us to change our investment strategy in order to avail ourselves to new or different opportunities. Such changes could differ materially from the strategies and plans set forth in this annual report and may shift our investment focus from the areas of expertise of our Adviser. Thus, any such changes, if they occur, could have a material adverse effect on our results of operations and the value of your investment.
The SBCAA allows us to incur additional leverage and would require us to offer liquidity to our stockholders.
Under the 1940 Act, a BDC generally is required to maintain asset coverage of 200% for senior securities representing indebtedness (such as borrowings from banks or other financial institutions) or stock (such as preferred stock). The SBCAA, which was signed into law on March 23, 2018, provides that a BDC’s required asset coverage under the 1940 Act may be reduced from 200% (equivalent of $1 of debt outstanding for each $1 equity) to 150% (equivalent to $2 of debt outstanding for each $1 of equity). This reduction in asset coverage would permit a BDC to double the amount of leverage it may utilize, subject to certain approval, timing and reporting requirements, including either stockholder approval or approval of a majority of the directors who are not “interested persons” (as defined in the 1940 Act) of the BDC and who have no financial interest in the arrangement. As a result, if we were to seek and receive the relevant approval, and we complied with the applicable disclosure requirements, we would be able to incur additional leverage, which may increase the risk of investing in us. In addition, since our base management fee is payable based upon our average adjusted gross assets, which includes any borrowings for investment purposes, our base management fee expenses may increase if we incur additional leverage.
We have not commenced any tender offers, and we do not currently intend to conduct any tender offers. As a non-traded BDC, however, if we receive the relevant approval to increase our authorized leverage, we will be required to offer our stockholders the opportunity to sell their shares of common stock over the next year following the calendar quarter in which the approval was obtained. The timing and method for such offers has not been determined at this time.
51
The impact of recent financial reform legislation on us is uncertain.
In light of current conditions in the U.S. and global financial markets and the U.S. and global economy, legislators, the presidential administration and regulators have increased their focus on the regulation of the financial services industry. The Dodd-Frank Wall Street Reform and Consumer Protection Act, or the Dodd-Frank Act, institutes a wide range of reforms that will have an impact on financial institutions. However, the current presidential administration has announced its intention to repeal, amend or replace certain portions of the Dodd-Frank Act and the regulations implemented thereunder. Given the uncertainty associated with the manner in which and whether the provisions of the Dodd-Frank Act might be implemented, repealed, amended or replaced, the full impact such requirements will have on our business, results of operations or financial condition is unclear. While we cannot predict what effect any changes in the laws or regulations or their interpretations would have on us as a result of recent financial reform legislation, these changes could be materially adverse to us and our stockholders. Accordingly, we are continuing to evaluate the effect the Dodd-Frank Act or implementing its regulations or any repeal or revision thereto will have on our business, financial condition and results of operations.
Efforts to comply with the Sarbanes-Oxley Act involve significant expenditures.
We are subject to the Sarbanes-Oxley Act and the related rules and regulations promulgated by the SEC. These requirements may place a strain on our systems and resources. The Exchange Act requires that we file annual, quarterly and current reports with respect to our business and financial condition. The Sarbanes-Oxley Act requires that we maintain effective disclosure controls and procedures and internal controls over financial reporting, which are discussed below. In order to maintain and improve the effectiveness of our disclosure controls and procedures and internal controls, significant resources and management oversight are required. We have implemented, and expect to continue to implement, procedures, processes, policies and practices for the purpose of addressing the standards and requirements applicable to public companies. As a result, we expect to incur significant additional expenses, which may negatively impact our financial performance and our ability to make distributions. This process also will result in a diversion of our management’s time and attention. We do not know when our evaluation, testing and remediation actions will be completed or its impact on our operations. In addition, we may be unable to ensure that the process is effective or that our internal controls over financial reporting are or will be effective.
The systems and resources necessary to comply with public company reporting requirements will increase further once we cease to be a “non-accelerated filer” under Rule 12b-2 of the Exchange Act or an “emerging growth company” under the Jumpstart Our Business Startups Act, as amended, or the JOBS Act. As long as we remain a non-accelerated filer or an emerging growth company, we intend to take advantage of certain exemptions from various reporting requirements that are applicable to other public companies, including not being required to comply with the auditor attestation requirements of Section 404 of the Sarbanes-Oxley Act. We will remain a non-accelerated filer until we have a public float, as such term is used in Rule 12b-2 of the Exchange Act, of $75 million or more. We will remain an emerging growth company for up to five years following an IPO, although if our public float exceeds $700 million as of any June 30 before that time, we would cease to be an emerging growth company as of the following December 31.
We are obligated to maintain proper and effective internal controls over financial reporting in accordance with Section 404 of the Sarbanes-Oxley Act, and failure to achieve and maintain effective internal controls over financial reporting in accordance with Section 404 of the Sarbanes-Oxley Act could have a material adverse effect on our business and the value of the Shares.
We are obligated to maintain proper and effective internal controls over financial reporting, including the internal control evaluation and certification requirements of Section 404 of the Sarbanes-Oxley Act and related rules and regulations of the SEC. However, we will not be required to comply with all of the requirements under Section 404 of the Sarbanes-Oxley Act until the later of the date we are no longer a non-accelerated filer or the date we are no longer an emerging growth company under the JOBS Act. Accordingly, our internal controls over financial reporting may not currently meet all of the standards contemplated by Section 404 of the Sarbanes-Oxley Act that we will eventually be required to meet. Specifically, we are required to conduct annual management assessments of the effectiveness of our internal controls over financial reporting, however our independent registered public accounting firm will not be required to formally attest to the effectiveness of our internal control over financial reporting until the later of the date we are no longer a non-accelerated filer or the date we are no longer an emerging growth company under the JOBS Act.
52
If we are not able to implement the complete requirements of Section 404 of the Sarbanes-Oxley Act in a timely manner or with adequate compliance, our operations, financial reporting or financial results could be adversely affected. Matters impacting our internal controls may cause us to be unable to report our financial information on a timely basis and thereby subject us to adverse regulatory consequences, including sanctions by the SEC or violations of applicable stock exchange listing rules, and result in a breach of the covenants under the agreements governing any of our financing arrangements. There could also be a negative reaction in the financial markets due to a loss of investor confidence in us and the reliability of our financial statements. Confidence in the reliability of our financial statements could also suffer if we or our independent registered public accounting firm were to report a material weakness in our internal controls over financial reporting. This could materially adversely affect us and lead to a decline in the market price of the Shares, to the extent we have completed an IPO.
Stockholders may be subject to filing requirements under the Exchange Act as a result of an investment in us.
Because the Shares are registered under the Exchange Act, ownership information for any person who beneficially owns 5% or more of the Shares has to be disclosed in a Schedule 13D or other filings with the SEC. Beneficial ownership for these purposes is determined in accordance with the rules of the SEC, and includes having voting or investment power over the securities. In some circumstances, investors who choose to reinvest their dividends may see their percentage stake in us increased to more than 5%, thus triggering this filing requirement. Although we provide in our quarterly statements the amount of outstanding Shares and the amount of the investor’s Shares, the responsibility for determining the filing obligation and preparing the filing remains with the investor. In addition, owners of 10% or more of the Shares are subject to reporting obligations under Section 16(a) of the Exchange Act.
Stockholders may be subject to the short-swing profits rules under the Exchange Act as a result of an investment in us.
Persons with the right to appoint a director or who hold more than 10% of a class of the Shares may be subject to Section 16(b) of the Exchange Act, which recaptures for the benefit of the issuer profits from the purchase and sale of registered stock within a six-month period.
Our Board of Directors may change our investment objective, operating policies and strategies without prior notice or stockholder approval.
Our Board of Directors has the authority to change our investment objective and modify or waive certain of our operating policies and strategies without prior notice (except as required by the 1940 Act) and without stockholder approval. However, absent stockholder approval, we may not change the nature of our business so as to cease to be a BDC and we may not withdraw our election as a BDC. We cannot predict the effect any changes to our current operating policies or strategies would have on our business, operating results and value of our Common Stock. Nevertheless, the effects may adversely affect our business and impact our ability to make distributions.
53
A stockholder’s interest in us could be diluted if we issue additional Shares, which could reduce the overall value of an investment in us.
Our Board of Directors may, in its sole discretion, conduct one or more additional private offerings of the Shares. Investors do not have preemptive rights to any Shares we issue in the future. Any such additional offering may have a dilutive effect on existing stockholders. To the extent we issue additional Shares at or below net asset value, after an investor purchases the Shares, an investor’s percentage ownership interest in us will be diluted. If we were to sell the Shares below the then current net asset value per Share in any such additional offering, there would be an immediate dilution to our net asset value per Share. In addition, depending upon the terms and pricing of any additional offerings and the value of our investments, an investor may also experience dilution in the net asset and fair value of his, her or its Shares.
As a BDC, we generally are prohibited from issuing or selling the Shares at a price below net asset value per Share, which may be a disadvantage as compared with certain public companies. In any such case, the price at which our securities are to be issued and sold may not be less than a price that, in the determination of the Board of Directors, closely approximates the fair value of such securities (less any distributing commission or discount). If we raise additional funds by issuing Common Stock, or senior securities convertible into or exchangeable for our Common Stock, then the percentage ownership of our stockholders at that time will decrease, and you will experience dilution. We may sell the Shares, or warrants, options, or rights to acquire such Shares at a price below the then current net asset value of such Shares if (1) our Board of Directors and independent directors determine that such sale is in our best interests and the best interests of our stockholders, and (2) our stockholders, including a majority of those stockholders who are not affiliated with us, approve such sale.
Provisions of the General Corporation Law of the State of Delaware and our certificate of incorporation and bylaws could deter takeover attempts and have an adverse effect on the price of our Common Stock.
The General Corporation Law of the State of Delaware, or the DGCL, our certificate of incorporation, and bylaws contain provisions that may discourage, delay or make more difficult a change in control of us or the removal of our directors. These measures may delay, defer or prevent a transaction or a change in control that might otherwise be in the best interests of our stockholders and could have the effect of depriving stockholders of an opportunity to sell their shares at a premium over prevailing market prices.
54
Our Adviser is able to resign upon 60 days’ notice, and we may not be able to find a suitable replacement within that time, resulting in a disruption in our operations that could adversely affect our financial condition, business and results of operations.
Our Adviser has the right, under the Investment Advisory Agreement, to resign at any time upon 60 days written notice, whether we have found a replacement or not. If our Adviser resigns, we may not be able to find a new investment adviser or hire internal management with similar expertise and ability to provide the same or equivalent services on acceptable terms within 60 days, or at all. If we are unable to do so quickly, our operations are likely to experience a disruption, our financial condition, business and results of operations as well as our ability to pay distributions are likely to be adversely affected and the value of our Common Stock may decline. In addition, the coordination of our internal management and investment activities is likely to suffer if we are unable to identify and reach an agreement with a single institution or group of executives having the expertise possessed by our Adviser and its affiliates. Even if we are able to retain comparable management, whether internal or external, the integration of such management and their lack of familiarity with our investment objective may result in additional costs and time delays that may adversely affect our financial condition, business and results of operations.
Our Administrator is able to resign from its role as Administrator under the Administration Agreement, and a suitable replacement may not be found, resulting in disruptions that could adversely affect our business, results of operations and financial condition.
Our Administrator has the right to resign under the Administration Agreement upon 60 days’ written notice, whether a replacement has been found or not. If our Administrator resigns, it may be difficult to find a new administrator or hire internal management with similar expertise and ability to provide the same or equivalent services on acceptable terms, or at all. If a replacement is not found quickly, our business, results of operations and financial condition are likely to be adversely affected and the value of our Common Stock may decline. Even if a comparable service provider or individuals to perform such services are retained, whether internal or external, their integration into our business and lack of familiarity with our investment objective may result in additional costs and time delays that may materially adversely affect our business, results of operations and financial condition.
We, our Adviser or its affiliates may be subject to litigation or regulatory proceedings the results of which could have a material adverse effect on our financial condition or results of operations.
From time to time we, our Adviser or its affiliates may be involved in various legal proceedings, lawsuits and claims incidental to the conduct of their respective businesses. We, our Adviser and its affiliates are also subject to extensive regulation, which may result in regulatory proceedings. In addition, our executive management team, directors and members of our Adviser’s management may, in the ordinary course of business, be named as defendants in litigation arising from our investments in such portfolio companies. To the extent we, our executive management team or directors, or members of our Adviser’s management team face adverse outcomes in any such proceedings, our financial condition or results of operations could be materially adversely affected.
The net asset value of the Shares may fluctuate significantly.
The net asset value and liquidity, if any, of the market for the Shares may be significantly affected by numerous factors, some of which are beyond our control and may not be directly related to our operating performance. These factors include:
| · | changes in earnings or variations in operating results; |
| · | changes in the value of our portfolio of investments; |
| · | changes in accounting guidelines governing valuation of our investments; |
| · | changes in regulatory policies or tax guidelines, particularly with respect to RICs and/or BDCs; |
| · | loss of RIC and/or BDC status; |
| · | any shortfall in revenue or net income or any increase in losses from levels expected by investors; |
| · | departure of either of our Adviser or certain of its key personnel; |
| · | general economic trends and other external factors; and |
| · | the potential loss of a major funding source. |
55
ITEM 1B. UNRESOLVED STAFF COMMENTS
None.
Our headquarters are located at 101 Huntington Avenue, Boston, Massachusetts 02199, and are provided by our Administrator. We reimburse our Administrator for such costs on an allocated basis, in accordance with the terms of our Administration Agreement. We believe that our office facilities are suitable and adequate for our business.
Neither we nor our Adviser or Administrator is currently subject to any material legal proceedings, nor, to our knowledge, is any material legal proceeding threatened against us, or against our Adviser or Administrator.
From time to time, we, our Adviser or Administrator may be a party to certain legal proceedings in the ordinary course of business, including proceedings relating to the enforcement of our rights under contracts with our portfolio companies. While the outcome of these legal proceedings cannot be predicted with certainty, we do not expect that these proceedings will have a material effect upon our financial condition or results of operations.
From time to time we are involved in various legal proceedings, lawsuits and claims incidental to the conduct of our business. Our businesses are also subject to extensive regulation, which may result in regulatory proceedings against us.
ITEM 4. MINE SAFETY DISCLOSURES
Not applicable.
56
ITEM 5. MARKET FOR REGISTRANT’S COMMON EQUITY, RELATED STOCKHOLDER MATTERS AND ISSUER PURCHASES OF EQUITY SECURITIES
Until the completion of an IPO, our outstanding Common Stock will be offered and sold in transactions exempt from registration under the Securities Act under Section 4(a)(2) and Regulation D. See “Item 5. Market for Registrant’s Common Equity, Related Stockholder Matters and Issuer Purchases of Equity Securities — Recent Sales of Unregistered Securities and Purchases of Equity Securities” for more information. There is currently no public market for our Common Stock, nor can we give any assurance that one will develop.
Because our Common Stock is acquired by investors in one or more transactions “not involving a public offering,” they are “restricted securities” and may be required to be held indefinitely. Our Common Stock may not be sold, transferred, assigned, pledged or otherwise disposed of unless (i) our consent is granted, and (ii) the Common Stock is registered under applicable securities laws or specifically exempted from registration (in which case the stockholder may, at our option, be required to provide us with a legal opinion, in form and substance satisfactory to us, that registration is not required). Accordingly, an investor must be willing to bear the economic risk of investment in the Common Stock until we are liquidated. No sale, transfer, assignment, pledge or other disposition, whether voluntary or involuntary, of the Common Stock may be made except by registration of the transfer on our books. Each transferee will be required to execute an instrument agreeing to be bound by these restrictions and the other restrictions imposed on the Common Stock and to execute such other instruments or certifications as are reasonably required by us.
Holders
As of March 17, 2020, we had two stockholders of record.
Distributions
We have elected to be treated as a RIC under Subchapter M of the Code. To qualify and maintain our qualification as a RIC, we must meet certain source-of-income and asset diversification requirements as well as distribute dividends to our stockholders each taxable year of an amount at least equal to 90% of our investment company taxable income. For more information, see “Item 7 — Management’s Discussion and Analysis of Financial Condition and Results of Operation — Distributions to Stockholders — Common Stock Distributions.”
The distributions declared during the year ended December 31, 2019, were derived from $0.51 of net investment income. The distributions declared during the year ended December 31, 2018, were derived from $0.52 of net investment income and $0.01 capital gains.
The fund will notify shareholders of amounts for use in preparing 2019 income tax forms in January 2020. The following information is provided pursuant to provisions of the Code. The Company designates $[xx] as capital gain dividends paid during the fiscal year ended December 31, 2019.
Recent Sales of Unregistered Securities and Purchases of Equity Securities
We have been party to subscription agreements, pursuant to which an investor is required to fund drawdowns to purchase Shares up to the amount of the investor’s capital commitment on an as-needed basis with a minimum of 10 calendar days’ prior notice.
The following table summarizes the sales of the Shares pursuant to a subscription agreement during the year ended December 31, 2019:
| Date of Sale | Shares Sold | Aggregate Offering Price | ||||
| January 11, 2019 | 2,114,165 | $ | 20 million | |||
| April 5, 2019 | 1,565,762 | 15 million | ||||
| July 3, 2019 | 1,588,983 | 15 million | ||||
| October 2, 2019 | 1,570,681 | 15 million | ||||
57
The following table summarizes the sales of the Shares pursuant to a subscription agreement during the year ended December 31, 2018:
| Date of Sale | Shares Sold | Aggregate Offering Price | ||||||
| March 29, 2018 | 1,557,632 | $ | 15 million | |||||
| June 14, 2018 | 1,578,947 | 15 million | ||||||
| September 27, 2018 | 1,037,344 | 10 million | ||||||
| December 28, 2018 | 2,107,482 | 20 million | ||||||
The sales of our Common Stock pursuant to the subscription agreements were exempt from the registration requirements of the Securities Act pursuant to Section 4(a)(2) thereof. We did not engage in general solicitation or advertising with regard to such sales of our Common Stock and did not offer securities to the public in connection with such issuance and sale. The investors who purchased Common Stock were all accredited investors.
58
ITEM 6. SELECTED FINANCIAL DATA
The following selected financial data for the years ended December 31, 2019, 2018 and 2017 were derived from our accompanying audited financial statements and notes to the financial statements, included elsewhere in this annual report. The data should be read in conjunction with our accompanying financial statements, notes to the financial statements and “Management’s Discussion and Analysis of Financial Condition and Results of Operations” included elsewhere in this annual report.
| Year Ended December 31, 2019 | Year Ended December 31, 2018 | Year Ended December 31, 2017 | ||||||||||
| Statement of Operations Data: | ||||||||||||
| Income | ||||||||||||
| Total investment income | $ | 21,029,469 | $ | 15,565,122 | $ | 10,458,491 | ||||||
| Expenses | ||||||||||||
| Net expense | 4,067,186 | 3,007,021 | 2,432,209 | |||||||||
| Net investment income | 16,962,283 | 12,558,101 | 8,026,282 | |||||||||
| Net realized (loss) gain on investments | (672,026 | ) | 449,694 | 696,970 | ||||||||
| Net change in unrealized depreciation on investments | (229,677 | ) | (1,778,021 | ) | (981,966 | ) | ||||||
| Net increase in net assets resulting from operations | $ | 16,060,580 | $ | 11,229,774 | $ | 7,741,286 | ||||||
| Per Share Data: | ||||||||||||
| Net investment income per common share - basic and diluted (a) | $ | 0.52 | $ | 0.52 | $ | 0.44 | ||||||
| Net increase in net assets resulting from operations per common share - basic and diluted (a) | 0.49 | 0.46 | 0.43 | |||||||||
| Distributions declared per common share | 0.51 | 0.52 | 0.47 | |||||||||
| Statement of Assets and Liabilities Data: | ||||||||||||
| Total assets | $ | 339,396,997 | $ | 282,945,853 | $ | 214,489,673 | ||||||
| Total liabilities | 7,997,324 | 15,522,618 | 5,294,097 | |||||||||
| Net assets | 331,399,673 | 267,423,235 | 209,195,576 | |||||||||
| Net asset value per common share | 9.44 | 9.46 | 9.51 | |||||||||
| Common shares outstanding | 35,109,246 | 28,269,649 | 21,988,238 | |||||||||
| Weighted common shares outstanding - basic and diluted | 32,672,328 | 24,340,035 | 18,080,178 | |||||||||
| Other Data: | ||||||||||||
| Number of portfolio investments | 176 | 144 | 102 | |||||||||
| Average investment amount (b) | $ | 1,890,466 | $ | 1,849,169 | $ | 1,805,643 | ||||||
| Percentage of investments at floating rates (b) | 99.38 | % | 100.00 | % | 100.00 | % | ||||||
| (a) | Per share data is based on weighted average common stock outstanding for both basic and diluted. |
| (b) | Based on cost of investments. |
59
ITEM 7. MANAGEMENT’S DISCUSSION AND ANALYSIS OF FINANCIAL CONDITION AND RESULTS OF OPERATIONS
The information contained in this section should be read in conjunction with the financial statements and notes to the financial statements appearing elsewhere in this annual report.
This annual report and other statements contain forward-looking statements that involve substantial risks and uncertainties. Such statements involve known and unknown risks, uncertainties and other factors and undue reliance should not be placed thereon. These forward-looking statements are not historical facts, but rather are based on current expectations, estimates and projections about our company, our current and prospective portfolio investments, our industry, our beliefs and our assumptions. Words such as “anticipates,” “expects,” “intends,” “plans,” “will,” “may,” “continue,” “believes,” “seeks,” “estimates,” “would,” “could,” “should,” “targets,” “projects,” and variations of these words and similar expressions are intended to identify forward-looking statements. These statements are not guarantees of future performance and are subject to risks, uncertainties and other factors, some of which are beyond our control and difficult to predict and could cause actual results to differ materially from those expressed or forecasted in the forward-looking statements, including:
| · | our future operating results; |
| · | our business prospects and the prospects of our portfolio companies; |
| · | the ability of our portfolio companies to achieve their objectives; |
| · | the timing of cash flows, if any, from the operations of our portfolio companies; |
| · | the ability of our Adviser to locate suitable investments for us and to monitor and administer our investments; |
| · | changes in the general economy; |
| · | risk associated with possible disruptions in our operations or the economy generally; |
| · | the effect of investments that we expect to make; |
| · | our contractual arrangements and relationships with third parties; |
| · | actual and potential conflicts of interest with Adviser and its affiliates; |
| · | the dependence of our future success on the general economy and its effect on the industries in which we invest; |
| · | the adequacy of our financing sources and working capital; |
| · | the ability of our Adviser and its affiliates to attract and retain highly talented professionals; |
| · | our ability to qualify and maintain our qualification as a BDC and as a RIC; and |
| · | the risks, uncertainties and other factors we identify under “Item 1A. Risk Factors” and elsewhere in this annual report. |
Although we believe that the assumptions on which these forward-looking statements are based are reasonable, any of those assumptions could prove to be inaccurate, and as a result, the forward-looking statements based on those assumptions also could be inaccurate. In light of these and other uncertainties, the inclusion of a projection or forward-looking statement in this annual report should not be regarded as a representation by us that our plans and objectives will be achieved. These risks and uncertainties include those described or identified in the section of our Registration Statement and this Form 10-K entitled “Item 1A. Risk Factors” and elsewhere in this annual report on Form 10-K. You should not place undue reliance on these forward-looking statements, which apply only as of the date of this annual report. Moreover, we assume no duty and do not undertake to update the forward-looking statements.
60
OVERVIEW
Audax Credit BDC Inc. is a Delaware corporation that was formed on January 29, 2015. We are an externally managed, closed-end, non-diversified management investment company that has elected to be treated as a BDC under the 1940 Act. In addition, we have elected to be treated for U.S. federal income tax purposes as a RIC under Subchapter M of the Code.
Our investment objective is to generate current income and, to a lesser extent, long-term capital appreciation. We intend to meet our investment objective by investing primarily in senior secured debt of privately owned U.S. middle- market companies. We intend to invest at least 80% of our net assets plus the amount of any borrowings in “credit instruments,” which we define as any fixed income instruments.
Although we have no present intention of doing so, we may decide to incur leverage. If we do incur leverage, however, we anticipate that it will be used in limited circumstances and on a short-term basis for purposes such as funding distributions. As a BDC, we are limited in our use of leverage under the 1940 Act. Under the 1940 Act, a BDC generally is required to maintain asset coverage of 200% for senior securities representing indebtedness (such as borrowings from banks or other financial institutions) or stock (such as preferred stock). The SBCAA, which was signed into law on March 23, 2018, provides that a BDC's required asset coverage under the 1940 Act may be reduced from 200% to 150%. This reduction in asset coverage would permit a BDC to double the amount of leverage it may utilize, subject to certain approval, timing and reporting requirements, including either stockholder approval or approval of a majority of the directors who are not “interested persons” (as defined in the 1940 Act) of the BDC and who have no financial interest in the arrangement. In addition, as a non-traded BDC, if we receive the relevant approval to increase our authorized leverage, we will be required to offer our stockholders the opportunity to sell their shares of common stock over the next year following the calendar quarter in which the approval was obtained. In determining whether to use leverage, we will analyze the maturity, covenants and interest rate structure of the proposed borrowings, as well as the risks of such borrowings within the context of our investment outlook and the impact of leverage on our investment portfolio. The amount of any leverage that we will employ as a BDC will be subject to oversight by our Board of Directors.
We generate revenue in the form of interest on the debt securities that we hold in our portfolio companies. The senior debt we invest in generally has stated terms of three to ten years. Our senior debt investments generally bear interest at a floating rate. Interest on debt securities is generally payable quarterly or semiannually. In some cases, some of our investments may provide for deferred interest payments or PIK interest. The principal amount of the debt securities and any accrued but unpaid interest generally will become due at the maturity date. In addition, we may generate revenue in the form of commitment and other fees in connection with transactions, although we do not expect to do so. OID as well as market discount and premium are accreted and amortized in determining our interest income. We record any prepayment premiums on loans and debt securities as income.
PORTFOLIO COMPOSITION AND INVESTMENT ACTIVITY
Portfolio Composition
The fair value of our investments, comprised of syndicated loans and equity, as of December 31, 2019, was approximately $330,874,911 and held in 164 portfolio companies as of December 31, 2019. The fair value of our investments, all of which were syndicated loans as of December 31, 2018, was approximately $264,662,881 and held in 135 portfolio companies as of December 31, 2018.
During the year ended December 31, 2019, we purchased $134,467,139 in investments, and we had $58,594,377 in debt repayments by existing portfolio companies, and $9,096,342 in sales of securities of portfolio companies. During the year ended December 31, 2018, we purchased $166,050,572 in investments, and we had $83,013,696 in debt repayments by existing portfolio companies, and $1,520,433 in sales of securities of portfolio companies. In addition, for the year ended December 31, 2019, we had a change in unrealized depreciation of approximately $229,677 and realized losses of $672,026, and for the year ended December 31, 2018, we had a change in unrealized depreciation of approximately $1,778,021 and realized gains of $449,694.
61
Our investment activity for the years ended December 31, 2019 and 2018, is presented at fair value below:
| Year Ended December 31, 2019 | Year Ended December 31, 2018 | |||||||
| Beginning investment portfolio, at fair value | $ | 264,662,881 | $ | 184,336,177 | ||||
| Investments in new portfolio investments | 112,937,320 | 146,482,757 | ||||||
| Investments in existing portfolio investments | 21,529,819 | 19,567,815 | ||||||
| Principal repayments | (58,594,377 | ) | (83,013,696 | ) | ||||
| Proceeds from investments sold | (9,096,342 | ) | (1,520,433 | ) | ||||
| Change in premiums, discounts and amortization | 337,313 | 138,588 | ||||||
| Net change in unrealized depreciation on investments | (229,677 | ) | (1,778,021 | ) | ||||
| Realized (loss) gain on investments | (672,026 | ) | 449,694 | |||||
| Ending portfolio investment activity, at fair value | $ | 330,874,911 | $ | 264,662,881 | ||||
| Number of portfolio investments | 176 | 144 | ||||||
| Average investment amount, at cost | $ | 1,890,466 | $ | 1,849,169 | ||||
| Percentage of investments at floating rates | 99.38 | % | 100.00 | % | ||||
As of December 31, 2019 and 2018, all of our portfolio consisted of non-controlled/non-affiliated investments.
RECENT DEVELOPMENTS
Subsequent to December 31, 2019 through March 17, 2020, we invested $12,603,912 at cost in 22 different portfolio companies.
On December 26, 2019, the Company delivered a capital drawdown notice to one of its investors relating to the sale of 1,588,983 shares of the Company’s common stock, par value $0.001 per share (the “Common Stock”), for an aggregate offering price of $15 million. The sale closed on January 10, 2020.
The sale of Common Stock was made pursuant to a subscription agreement entered into by the Company and the investor. Under the terms of the subscription agreement, the investor is required to fund drawdowns to purchase shares of Common Stock up to the amount of its capital commitment on an as-needed basis with a minimum of 10 calendar days’ prior notice.
The issuance of the Common Stock is exempt from the registration requirements of the Securities Act pursuant to Section 4(a)(2) thereof. The Company has not engaged in general solicitation or advertising with regard to the issuance and sale of the Common Stock and has not offered securities to the public in connection with such issuance and sale.
RESULTS OF OPERATIONS
Set forth below is a comparison of our results of operations for the years ended December 31, 2019 and 2018. For a comparison of our results of operations for the years ended December 31, 2018 and 2017, see the Company's Form 10-K for the fiscal year ended December 31, 2018, as filed with the SEC on March 18, 2019.
The net increase or decrease in net assets from operations may vary substantially from period to period as a result of various factors, including the recognition of realized gains and/or losses and net change in unrealized appreciation and depreciation.
62
Revenue
Net investment income for the years ended December 31, 2019 and 2018, is presented in the table below:
| Year Ended December 31, 2019 | Year Ended December 31, 2018 | |||||||
| Total interest income from non-controlled/non-affiliated investments | $ | 20,812,478 | $ | 15,332,000 | ||||
| Total other interest income | 145,127 | 141,063 | ||||||
| Total other income | 71,864 | 92,059 | ||||||
| Total investment income | $ | 21,029,469 | $ | 15,565,122 | ||||
Total investment income for the year ended December 31, 2019 increased to $21,029,469 from $15,565,122 for the year ended December 31, 2018, and was primarily driven by our interest income from our increasing investment balance. As of December 31, 2019 and 2018, the size of our debt portfolio was $331,601,425 and $266,280,299 at amortized cost, respectively, with total principal amount of debt outstanding of $333,335,057 and $267,318,344, respectively.
Expenses
Total expenses net of waivers for the years ended December 31, 2019 and 2018, were as follows:
| Year Ended December 31, 2019 | Year Ended December 31, 2018 | |||||||
| Base management fee(a) | $ | 3,243,496 | $ | 2,446,249 | ||||
| Incentive fee(a) | 2,620,312 | 1,938,059 | ||||||
| Administrative fee(a) | 265,000 | 265,000 | ||||||
| Directors' fees | 210,000 | 195,000 | ||||||
| Professional fees | 650,709 | 421,966 | ||||||
| Other expenses | 328,812 | 174,252 | ||||||
| Total expenses | 7,318,329 | 5,440,526 | ||||||
| Base management fee waivers(a) | (1,135,224 | ) | (856,187 | ) | ||||
| Incentive fee waivers(a) | (2,115,919 | ) | (1,577,318 | ) | ||||
| Total expenses, net of waivers | $ | 4,067,186 | $ | 3,007,021 | ||||
(a) Refer to Note 4-Related Party Transactions within the financial statements for a description of the relevant fees.
The increase in base management fees before waivers for the year ended December 31, 2019 in comparison to the year ended December 31, 2018 was driven by our increasing invested balance. For the year ended December 31, 2019 and 2018, we accrued gross base management fees before waivers of $3,243,496 and $2,446,249, respectively. Offsetting those fees, we recognized base management fee waivers of $1,135,224 and $856,187, respectively. For the years ended December 31, 2019 and 2018, we accrued incentive fees related to net investment income before waivers of $2,620,312 and $1,938,059, respectively. Offsetting those fees during the periods were incentive fee waivers of $2,115,919 and $1,577,318, respectively. For the years ended December 31, 2019 and 2018, we did not accrue incentive fees related to capital gains. Additionally, we accrued $265,000 of administrative fees for the years ended December 31, 2019 and 2018. Refer to Note 4 — Related Party Transactions in the notes accompanying our financial statements for more information related to base management fees, incentive fees and waivers.
63
During the years ended December 31, 2019 and 2018, we incurred professional fees of $650,709 and $421,966, respectively, related to audit fees, tax fees, and legal fees. The increase in professional fess was driven by an increase in legal expenses during the year ended December 31, 2019. We also incurred expenses related to fees paid to our independent directors of $210,000 and $195,000 for the years ended December 31, 2019 and 2018, respectively. During the years ended December 31, 2019 and 2018, we incurred other expenses of $328,812 and $174,252, respectively. The increase in other expenses was driven by an increase in the Delaware Franchise Tax in the year ended December 31, 2019.
Realized and Unrealized Gains and Losses
We recognized $672,026 in net realized losses for the year ended December 31, 2019. We recognized $449,694 in net realized gains for the year ended December 31, 2018.
Net change in unrealized depreciation on investments for the years ended December 31, 2019, and 2018, is presented in the table below, was as follows:
| Type | Year Ended December 31, 2019 | Year Ended December 31, 2018 | ||||||
| First Lien Debt | $ | 111,757 | $ | (1,694,993 | ) | |||
| Second Lien Debt | 59,890 | (83,028 | ) | |||||
| Equity and Preferred Shares | (401,324 | ) | - | |||||
| Net change in unrealized | ||||||||
| depreciation on investments | $ | (229,677 | ) | $ | (1,778,021 | ) | ||
FINANCIAL CONDITION, LIQUIDITY AND CAPITAL RESOURCES
Set forth below are our financial condition, liquidity and capital resources for the years ended December 31, 2019 and 2018. For information regarding our liquidity and capital resources for the year ended December 31, 2017, see the Company's Form 10-K for the fiscal year ended December 31, 2018, as filed with the SEC on March 18, 2019.
We generate cash primarily from the net proceeds of any offering of the Shares, from cash flows from interest and fees earned from our investments, and from principal repayments and proceeds from sales of our investments. Our primary use of cash is investments in portfolio companies, payments of our expenses and cash distributions to our stockholders. As of December 31, 2019 and 2018, we had cash of and $5,506,217 and $17,715,145, respectively.
Operating Activities
Net cash used in the operating activities for the year ended December 31, 2019 was $60,124,786. The primary operating activity during this period was investments in portfolio companies. This was partially offset by repayments of bank loans and proceeds from investments sold. Net cash used in the operating activities for the year ended December 31, 2018 was $59,004,299. The primary operating activity during this period was investments in portfolio companies. This was partially offset by repayments of bank loans and proceeds from investments sold.
As of December 31, 2019 and 2018, we had eighteen and ten investments with unfunded commitments of and $3,878,962 and $2,225,517, respectively. We believe that, as of December 31, 2019 and 2018, we had sufficient assets to adequately cover any obligations under our unfunded commitments.
64
The following table summarizes our total portfolio activity during the year ended December 31, 2019 and 2018:
| Year Ended December 31, 2019 | Year Ended December 31, 2018 | |||||||
| Beginning investment portfolio | $ | 264,662,881 | $ | 184,336,177 | ||||
| Investments in new portfolio investments | 112,937,320 | 146,482,757 | ||||||
| Investments in existing portfolio investments | 21,529,819 | 19,567,815 | ||||||
| Principal repayments | (58,594,377 | ) | (83,013,696 | ) | ||||
| Proceeds from sales of investments | (9,096,342 | ) | (1,520,433 | ) | ||||
| Net change in unrealized depreciation on investments | (229,677 | ) | (1,778,021 | ) | ||||
| Net realized (loss) gain on investments | (672,026 | ) | 449,694 | |||||
| Net change in premiums, discounts and amortization | 337,313 | 138,588 | ||||||
| Investment Portfolio, at Fair Value | $ | 330,874,911 | $ | 264,662,881 | ||||
Financing Activities
Net cash provided by our financing activities for the year ended December 31, 2019 was $47,915,858 from issuances of 6,839,591 of Shares to our shareholders, in connection with our capital calls during the period. These capital calls were partially offset by distributions of $17,084,142 or $0.51 per share. Net cash provided by our financing activities for the year ended December 31, 2018 was $46,997,885 from issuances of 6,281,406 of Shares to our shareholders, in connection with our capital calls during the period. These capital calls were partially offset by distributions of $13,002,172 or $0.53 per share.
Equity Activity
On June 23, 2015, an investor made a $140,000,000 capital commitment to the Company. On December 2, 2016, the same investor made an additional capital commitment of $50,000,000. On December 7, 2017, the same investor made an additional capital commitment of $100,000,000. On March 22, 2019, the same investor made an additional capital commitment of $40,000,000. On September 23, 2019, the same investor made an additional capital commitment of $30,000,000. As of December 31, 2019, $25,000,000 of total capital commitments remained unfunded by the Company’s investors.
The number of Shares issued and outstanding as of December 31, 2019 and 2018 were 35,109,246 and 28,269,649, respectively.
The following table summarizes activity in the number of Shares during the years ended December 31, 2019 and 2018:
| Common stock shares in issue | ||||||||
| Year Ended December 31, 2019 | Year Ended December 31, 2018 | |||||||
| Shares in issue, beginning of period | 28,269,649 | 21,988,238 | ||||||
| Common stock issued ($65,000,000 and $60,000,000, respectively ) | 6,839,591 | 6,281,406 | ||||||
| Issuance of common shares in connection with dividend reinvestment plan ($60 and $57, respectively) | 6 | 6 | ||||||
| Shares in issue, end of period | 35,109,246 | 28,269,649 | ||||||
65
Contractual Obligations
The following table summarizes our significant contractual payment obligations as of December 31, 2019:
| Payments Due by Period | ||||||||||||||||||||
| Total | Less Than 1 Year | 1 – 3 Years | 3 – 5 Years | More Than 5 Years | ||||||||||||||||
| Unfunded commitments(1) | $ | 3,878,962 | 3,878,962 | — | — | $ | — | |||||||||||||
| Total contractual obligations | $ | 3,878,962 | 3,878,962 | — | — | $ | — | |||||||||||||
| (1) | Unfunded commitments represent all amounts unfunded as of December 31, 2019. These amounts may or may not be funded to the borrowing party now or in the future. We reflect this amount in the less than one-year category because the entire amount was eligible for funding as of December 31, 2019. |
Distributions to Stockholders – Common Stock Distributions
We have elected to be treated as a RIC for U.S. federal income tax purposes. As a RIC, we generally are not subject to corporate-level U.S. federal income taxes on ordinary income or capital gains that we timely distribute as dividends for U.S. federal income tax purposes to our stockholders. To qualify to be taxed as a RIC and thus avoid corporate-level income tax on the income that we distribute as dividends to our stockholders, we are required to distribute dividends to our stockholders each taxable year generally of an amount at least equal to 90% of our investment company taxable income, determined without regard to the deduction for any dividends paid. To avoid a 4% excise tax on undistributed earnings, we are required to distribute dividends to our stockholders in respect of each calendar year of an amount at least equal to the sum of (i) 98% of our ordinary income (taking into account certain deferrals and elections) for such calendar year, (ii) 98.2% of our capital gain net income, adjusted for certain ordinary losses, for the one-year period ending October 31 of that calendar year and (iii) any income or capital gains recognized, but not distributed, in preceding calendar years and on which we incurred no federal income tax. We intend to make distributions to stockholders on an annual basis of substantially all of our net investment income. Although we intend to make distributions of net realized capital gains, if any, at least annually, out of assets legally available for such distributions, we may in the future decide to retain such capital gains for investment. In addition, the extent and timing of special dividends, if any, will be determined by our Board of Directors and will largely be driven by portfolio specific events and tax considerations.
We may fund our cash distributions from any sources of funds available, including offering proceeds, borrowings, net investment income from operations, capital gains proceeds from the sale of assets, non-capital gains proceeds from the sale of assets, dividends or other distributions paid to us on account of preferred and common equity investments in portfolio companies and fee waivers from our Adviser. Our distributions may exceed our earnings, especially during the period before we have substantially invested the proceeds from an offering. As a result, a portion of the distributions we may represent a return of capital for U.S. federal income tax purposes. Thus the source of a distribution to our stockholders may be the original capital invested by the stockholder rather than our income or gains. In addition, we may be limited in our ability to make distributions due to the asset coverage test for borrowings applicable to us as a BDC under the 1940 Act. During the year ended December 31, 2019, we made two distributions totaling $17,084,202, or $0.51 per Share. During the year ended December 31, 2018, we made two distributions totaling $13,002,172, or $0.52 per Share. The following tables provide the details of each distribution for the year ended December 31, 2019 and 2018.
66
| Period | Declaration Date | Record Date | Payment Date | Distribution per Common Share | ||||||
| Fiscal Year Ended | June 6, 2019 | June 7, 2019 | June 13, 2019 | $ | 0.260 | |||||
| 2019 | December 12, 2019 | December 13, 2019 | December 18, 2019 | $ | 0.250 | |||||
| Period | Declaration Date | Record Date | Payment Date | Distribution per Common Share | ||||||
| Fiscal Year Ended | May 30, 2018 | May 31, 2018 | June 5, 2018 | $ | 0.250 | |||||
| 2018 | December 10, 2018 | December 11, 2018 | December 14, 2018 | $ | 0.272 | |||||
Qualified Interest Income and Qualified Short-Term Capital Gain (for non-U.S. resident shareholders only). Under the American Jobs Creation Act of 2004, the following amounts of ordinary dividends paid during the fiscal year ended December 31, 2019 are considered to be derived from “qualified interest income,” as defined in Section 871(k)(1)(E) of the Code, and therefore are designated as interest-related dividends, as defined in Section 871(k)(1)(C) of the Code. Further, the following amounts of ordinary dividends paid during the fiscal year ended December 31, 2019 are considered to be derived from “qualified short-term capital gain,” as defined in Section 871(k)(2)(D) of the Code, and therefore are designated as qualified short-term gain dividends, as defined by Section 871(k)(2)(C) of the Code.
The determination of the tax attributes of our distributions is made annually at the end of our taxable year, based upon our taxable income for the full taxable year and distributions paid for the full taxable year. Therefore, estimates made on an interim basis may not be representative of the actual tax attributes of distributions for a full year. The actual tax characteristics of distributions to stockholders will reported to stockholders subject to information reporting after the close of each calendar year on Form 1099-DIV.
Related Party Fees
For the year ended December 31, 2019, the Company recorded base management fees of $3,243,496 and waivers to the base management fees of $1,135,224, as set forth within the accompanying statements of operations. For the year ended December 31, 2018, the Company recorded base management fees of $2,446,249 and waivers to the base management fees of $856,187, as set forth within the accompanying statements of operations.
For the year ended December 31, 2019, the Company recorded incentive fees of $2,620,312 and waivers to the incentive fees of $2,115,919, as set forth within the accompanying statements of operations. For the year ended December 31, 2018, the Company recorded incentive fees of $1,938,059 and waivers to the incentive fees of $1,577,318, as set forth within the accompanying statements of operations.
For the years ended December 31, 2019 and 2018, the Company recorded administrative fees of $265,000, as set forth within the accompanying statements of operations.
Fees due to related parties as of December 31, 2019 and 2018 on our accompanying statements of assets and liabilities were as follows:
| December 31, 2019 | December 31, 2018 | |||||||
| Net base management fee due to Adviser | $ | 569,600 | $ | 424,873 | ||||
| Net incentive fee due to Adviser | 118,536 | 111,041 | ||||||
| Total fees due to Adviser, net of waivers | 688,136 | 535,914 | ||||||
| Fee due to Administrator, net of waivers | 66,250 | 66,250 | ||||||
| Total Related Party Fees Due | $ | 754,386 | $ | 602,164 | ||||
| (a) | Expenses paid on behalf of the Company by the Adviser |
Tender Offers
We do not currently intend to list the Shares on any securities exchange, and we do not expect a public market for them to develop in the foreseeable future. Therefore, stockholders should not expect to be able to sell their Shares promptly or at a desired price. To provide our stockholders with limited liquidity, we may, in the absolute discretion of our Board of Directors, conduct an annual tender offer. Our tenders for the Shares, if any, would be conducted on such terms as may be determined by our Board of Directors and in accordance with the requirements of applicable law, including Section 23(c) of the 1940 Act and Regulation M under the Exchange Act. We have not commenced any tender offers, and we do not currently intend to conduct any tender offers.
67
CRITICAL ACCOUNTING POLICIES
This discussion of our operations is based upon our financial statements, which are prepared in accordance with GAAP. The preparation of these financial statements requires our management to make estimates and assumptions that affect the reported amounts of assets, liabilities, revenues and expenses.
Changes in the economic environment, financial markets and any other parameters used in determining such estimates could cause actual results to differ. In addition to the discussion below, we describe our critical accounting policies in the notes to our financial statements.
Valuation of Investments
We conduct the valuation of our investments, pursuant to which our net asset value is determined, at all times consistent with GAAP and the 1940 Act. Our Board of Directors, with the assistance of our Audit Committee, determines the fair value of our investments, for investments with a public market and for investments with no readily available public market, on at least a quarterly basis, in accordance with the terms of ASC 820. Our valuation procedures are set forth in more detail below.
ASC 820 defines fair value as “the price that would be received to sell an asset or paid to transfer a liability in an orderly transaction between market participants at the measurement date.” Fair value is a market-based measurement, not an entity-specific measurement. For some assets and liabilities, observable market transactions or market information might be available. For other assets and liabilities, observable market transactions and market information might not be available. However, the objective of a fair value measurement in both cases is the same – to estimate the price when an orderly transaction to sell the asset or transfer the liability would take place between market participants at the measurement date under current market conditions (that is, an exit price at the measurement date from the perspective of a market participant that holds the asset or owes the liability).
ASC 820 establishes a hierarchal disclosure framework which ranks the observability of inputs used in measuring financial instruments at fair value. The observability of inputs is impacted by a number of factors, including the type of financial instruments and their specific characteristics. Financial instruments with readily available quoted prices, or for which fair value can be measured from quoted prices in active markets, generally will have a higher degree of market price observability and a lesser degree of judgment applied in determining fair value.
The three-level hierarchy for fair value measurement is defined as follows:
Level 1 — Inputs to the valuation methodology are quoted prices available in active markets for identical financial instruments as of the measurement date. The types of financial instruments in this category include unrestricted securities, including equities and derivatives, listed in active markets. We do not adjust the quoted price for these instruments, even in situations where we hold a large position, and a sale could reasonably be expected to impact the quoted price.
Level 2 — Inputs to the valuation methodology are quoted prices in markets that are not active or for which all significant inputs are either directly or indirectly observable as of the measurement date. The types of financial instruments in this category include less liquid and restricted securities listed in active markets, securities traded in markets that are not active, government and agency securities, and certain over-the-counter derivatives where the fair value is based on observable inputs.
Level 3 — Inputs to the valuation methodology are unobservable and significant to the overall fair value measurement, and include situations where there is little, if any, market activity for the investment. The inputs into the determination of fair value require significant management judgment or estimation. The types of financial instruments in this category include investments in privately held entities, non-investment grade residual interests in securitizations, collateralized loan obligations, and certain over-the-counter derivatives where the fair value is based on unobservable inputs.
68
In certain cases, the inputs used to measure fair value may fall into different levels of the fair value hierarchy. In such cases, the determination of which category within the fair value hierarchy is appropriate for any given financial instrument is based on the lowest level of input that is significant to the fair value measurement. Assessment of the significance of a particular input to the fair value measurement in its entirety requires judgment and considers factors specific to the financial instrument.
Pursuant to the framework set forth above, we value securities traded in active markets on the measurement date by multiplying the exchange closing price of such traded securities/instruments by the quantity of shares or amount of the instrument held. We may also obtain quotes with respect to certain of our investments from pricing services, brokers or dealers’ quotes, or counterparty marks in order to value liquid assets that are not traded in active markets.
Pricing services aggregate, evaluate and report pricing from a variety of sources including observed trades of identical or similar securities, broker or dealer quotes, model-based valuations and internal fundamental analysis and research. When doing so, we determine whether the quote obtained is sufficient according to GAAP to determine the fair value of the security. If determined adequate, we use the quote obtained.
Securities that are illiquid or for which the pricing source does not provide a valuation or methodology or provides a valuation or methodology that, in the judgment of our Board of Directors, does not represent fair value, are each valued as of the measurement date using all techniques appropriate under the circumstances and for which sufficient data are available. These valuation techniques vary by investment but include comparable public market valuations, comparable precedent transaction valuations and discounted cash flow analyses. The process used to determine the applicable value is as follows: (i) each portfolio company or investment is initially valued by the investment professionals of the Adviser responsible for the portfolio investment using a standardized template designed to approximate fair market value based on observable market inputs and updated credit statistics and unobservable inputs; (ii) preliminary valuation conclusions are documented and discussed with our senior management and members of our Adviser’s valuation team; (iii) our Audit Committee reviews the assessments of the Adviser and provides our Board of Directors with recommendations with respect to the fair value of the investments in our portfolio; and (iv) our Board of Directors discusses the valuation recommendations of our Audit Committee and determines the fair value of the investments in our portfolio in good faith based on the input of the Adviser and in accordance with our valuation policy.
Our Audit Committee’s recommendation of fair value is generally based on its assessment of the following factors, as relevant:
| · | the nature and realizable value of any collateral; |
| · | call features, put features and other relevant terms of debt; |
| · | the portfolio company’s ability to make payments; |
| · | the portfolio company’s actual and expected earnings and discounted cash flow; |
| · | prevailing interest rates for like securities and expected volatility in future interest rates; |
| · | the markets in which the portfolio company does business and recent economic and/or market events; and |
| · | comparisons to publicly traded securities. |
Investment performance data utilized are the most recently available as of the measurement date, which in many cases may reflect up to a one quarter lag in information.
69
Securities for which market quotations are not readily available or for which a pricing source is not sufficient may include the following:
| · | private placements and restricted securities that do not have an active trading market; |
| · | securities whose trading has been suspended or for which market quotes are no longer available; |
| · | debt securities that have recently gone into default and for which there is no current market; |
| · | securities whose prices are stale; and |
| · | securities affected by significant events. |
Our Board of Directors is responsible for the determination, in good faith, of the fair value of our portfolio investments.
Determination of fair value involves subjective judgments and estimates. Accordingly, the notes to our financial statements express the uncertainty with respect to the possible effect of such valuations, and any change in such valuations, on our financial statements.
Security transactions are recorded on the trade date (the date the order to buy or sell is executed or, in the case of privately issued securities, the closing date, which is when all terms of the transactions have been defined). Realized gains and losses on investments are determined based on the identified cost method.
Refer to Note 3 — Investments in the notes to our accompanying financial statements included elsewhere in this annual report for additional information regarding fair value measurements and our application of ASC 820.
Revenue Recognition
We record interest income on an accrual basis to the extent that we expect to collect such amounts. For loans and debt securities with contractual PIK interest, which represents contractual interest accrued and added to the principal balance, we generally will not accrue PIK interest for accounting purposes if the portfolio company valuation indicates that such PIK interest is not collectible. We do not accrue as a receivable interest on loans and debt securities for accounting purposes if we have reason to doubt our ability to collect such interest. OID, market discounts or premiums are accreted or amortized using the effective interest method as interest income. We record prepayment premiums on loans and debt securities as interest income.
Net Realized Gains or Losses and Net Change in Unrealized Appreciation or Depreciation
We measure net realized gains or losses by the difference between the net proceeds from the repayment or sale and the amortized cost basis of the investment, without regard to unrealized appreciation or depreciation previously recognized, but considering unamortized upfront fees and prepayment penalties. Net change in unrealized appreciation or depreciation reflects the change in portfolio investment values during the reporting period, including any reversal of previously recorded unrealized appreciation or depreciation, when gains or losses are realized.
PIK Interest
We may have investments in our portfolio that contain a PIK interest provision. Any PIK interest will be added to the principal balance of such investments and is recorded as income if the portfolio company valuation indicates that such PIK interest is collectible. In order to maintain our status as a RIC, substantially all of this income must be included in the amounts paid out by us to stockholders in the form of dividends, even if we have not collected any cash.
70
Federal Income Taxes
We have elected to be subject to tax as a RIC under Subchapter M of the Code. As a RIC, we generally will not have to incur any corporate-level U.S. federal income taxes on any ordinary income or capital gains that we distribute as dividends to our stockholders. To qualify and maintain our qualification as a RIC, we must meet certain source-of-income and asset diversification requirements as well as distribute dividends to our stockholders each taxable year of an amount generally at least equal to 90% of our investment company taxable income, determined without regard to any distributions paid.
Depending on the level of taxable income earned in a taxable year, we may choose to retain taxable income in excess of current year distributions into the next taxable year. We would then incur a 4% excise tax on such taxable income, as required. To the extent that we determine that our estimated current year annual taxable income may exceed estimated current year distributions, we will accrue an excise tax, if any, on estimated excess taxable income as taxable income is earned. We did not accrue any excise tax for the fiscal years ended December 31, 2019, 2018, and 2017.
Because U.S. federal income tax regulations differ from GAAP, distributions in accordance with tax regulations may differ from net investment income and realized gains recognized for financial reporting purposes. Differences may be permanent or temporary. Permanent differences are reclassified within capital accounts in the financial statements to reflect their tax character. Permanent differences may also result from differences in classification in certain items, such as the treatment of short-term gains as ordinary income for tax purposes. Temporary differences arise when certain items of income, expense, gain or loss are recognized at some time in the future.
We evaluate tax positions taken or expected to be taken in the course of preparing our financial statements to determine whether the tax positions are “more-likely-than-not” of being sustained by the applicable tax authority. Tax positions not deemed to meet the “more-likely-than-not” threshold are reversed and recorded as a tax benefit or expense in the current fiscal year. All penalties and interest associated with any income taxes accrued are included in income tax expense. Conclusions regarding tax positions are subject to review and may be adjusted at a later date based on factors including, but not limited to, ongoing analyses of tax law, regulations and interpretations thereof. Our accounting policy on income taxes is critical because if we are unable to qualify, or once qualified, maintain our tax status as a RIC, we would be required to record a provision for corporate-level U.S. federal income taxes, as well as any related state or local taxes which may be significant to our financial results.
COMMITMENTS AND CONTINGENCIES
Unfunded commitments to provide funds to portfolio companies are not reflected in our accompanying statements of assets and liabilities. Our unfunded commitments may be significant from time to time. These commitments are subject to the same underwriting and ongoing portfolio maintenance as are the on-balance sheet financial instruments that we hold. Since these commitments may expire without being drawn, the total commitment amount does not necessarily represent future cash requirements. We use cash flow from normal and early principal repayments and proceeds from borrowings and offerings to fund these commitments. As of December 31, 2019, we had eighteen investments with unfunded commitments of $3,878,962. As of December 31, 2018, we had ten investments with unfunded commitments of $2,225,517. We believe that, as of December 31, 2019 and 2018, we had sufficient assets to adequately cover any obligations under our unfunded commitments.
ITEM 7A. QUANTITATIVE AND QUALITATIVE DISCLOSURES ABOUT MARKET RISK
We are subject to financial market risks, including changes in interest rates. As a result, there can be no assurance that a significant change in market interest rates will not have a material adverse effect on our net investment income. As of December 31, 2019, 99.38% of our investments included variable rates or variable rates with a floor.
71
Assuming that the accompanying statement of assets and liabilities as of December 31, 2019 was to remain constant and that we took no actions to alter interest rate sensitivity as of such date, the following table shows the annualized impact of hypothetical base rate changes in interest rates.
| Change in interest rates | Increase (decrease) in investment income | |||
| Down 300 basis points | (3,721,822 | ) | ||
| Down 200 basis points | (3,721,822 | ) | ||
| Down 100 basis points | (2,814,586 | ) | ||
| Up 100 basis points | 3,320,662 | |||
| Up 200 basis points | 6,641,324 | |||
| Up 300 basis points | 9,961,986 | |||
Although we believe that this measure is indicative of our sensitivity to interest rate changes, it does not reflect potential changes in the credit market, credit quality, size and composition of the assets on the Consolidated Statements of Assets and Liabilities and other business developments that could affect our net increase in net assets resulting from operations or net investment income. Accordingly, no assurances can be given that actual results would not differ materially from those shown above.
In addition, any investments we make that are denominated in a foreign currency will be subject to risks associated with changes in currency exchange rates. These risks include the possibility of significant fluctuations in the foreign currency markets, the imposition or modification of foreign exchange controls and potential illiquidity in the secondary market. These risks will vary depending upon the currency or currencies involved.
72
ITEM 8. FINANCIAL STATEMENTS AND SUPPLEMENTARY DATA
Index to Financial Statements
73
Report of Independent Registered Public Accounting Firm
To the Shareholder and Board of Directors of Audax Credit BDC Inc.
Opinion on the Financial Statements
We have audited the accompanying statements of assets and liabilities of Audax Credit BDC Inc. (the “Company”), including the schedules of investments, as of December 31, 2019 and 2018, the related statements of operations, changes in net assets, and cash flows for each of the three years in the period ended December 31, 2019, and the related notes (collectively referred to as the “financial statements”). In our opinion, the financial statements present fairly, in all material respects, the financial position of the Company at December 31, 2019 and 2018, and the results of its operations, changes in its net assets and its cash flows for each of the three years in the period ended December 31, 2019, in conformity with U.S. generally accepted accounting principles.
Basis for Opinion
These financial statements are the responsibility of the Company's management. Our responsibility is to express an opinion on the Company's financial statements based on our audits. We are a public accounting firm registered with the Public Company Accounting Oversight Board (United States) (“PCAOB”) and are required to be independent with respect to the Company in accordance with the U.S. federal securities laws and the applicable rules and regulations of the Securities and Exchange Commission and the PCAOB.
We conducted our audits in accordance with the standards of the PCAOB. Those standards require that we plan and perform the audit to obtain reasonable assurance about whether the financial statements are free of material misstatement, whether due to error or fraud. The Company is not required to have, nor were we engaged to perform, an audit of its internal control over financial reporting. As part of our audits we are required to obtain an understanding of internal control over financial reporting but not for the purpose of expressing an opinion on the effectiveness of the Company's internal control over financial reporting. Accordingly, we express no such opinion.
Our audits included performing procedures to assess the risks of material misstatement of the financial statements, whether due to error or fraud, and performing procedures that respond to those risks. Such procedures included examining, on a test basis, evidence regarding the amounts and disclosures in the financial statements. Our procedures included confirmation of securities owned as of December 31, 2019 and 2018, by correspondence with the custodian and brokers or by other appropriate auditing procedures where replies from brokers were not received. Our audits also included evaluating the accounting principles used and significant estimates made by management, as well as evaluating the overall presentation of the financial statements. We believe that our audits provide a reasonable basis for our opinion.
/s/ Ernst & Young LLP
We have served as the auditor of the Company since 2015.
New York, NY
March 17, 2020
| 74 |
Statements of Assets and Liabilities
December 31, 2019 and December 31, 2018
(Expressed in U.S. Dollars)
| December 31, 2019 | December 31, 2018 | |||||||
| Assets | ||||||||
| Investments, at fair value | ||||||||
| Non-Control/Non-Affiliate investments (Cost of $332,722,006 and $266,280,299, respectively) | $ | 330,874,911 | $ | 264,662,881 | ||||
| Cash and cash equivalents | 5,506,217 | 17,715,145 | ||||||
| Interest receivable | 942,329 | 558,114 | ||||||
| Receivable from investments sold | 1,993,379 | - | ||||||
| Receivable from bank loan repayment | 80,161 | 9,713 | ||||||
| Total assets | $ | 339,396,997 | $ | 282,945,853 | ||||
| Liabilities | ||||||||
| Accrued expenses and other liabilities | $ | 297,938 | $ | 517,621 | ||||
| Fee due to administrator(a) | 66,250 | 66,250 | ||||||
| Fees due to investment advisor, net of waivers(a) | 688,136 | 535,914 | ||||||
| Payable for investments purchased | 6,945,000 | 14,402,833 | ||||||
| Total liabilities | $ | 7,997,324 | $ | 15,522,618 | ||||
| Commitments and contingencies(b) | ||||||||
| Net Assets | ||||||||
| Common stock, $0.001 par value per share, 100,000,000 shares authorized, 35,109,246 and 28,269,649 shares issued and outstanding, respectively | $ | 35,110 | $ | 28,270 | ||||
| Capital in excess of par value | 334,095,408 | 269,246,005 | ||||||
| Total distributable earnings | (2,730,845 | ) | (1,851,040 | ) | ||||
| Total Net Assets | $ | 331,399,673 | $ | 267,423,235 | ||||
| Net Asset Value per Share of Common Stock at End of Period | $ | 9.44 | $ | 9.46 | ||||
| Shares Outstanding | 35,109,246 | 28,269,649 | ||||||
| (a) | Refer to Note 4-Related Party Transactions for additional information. | |
| (b) | Refer to Note 8-Commitments and Contingencies for additional information. |
The accompanying notes are an integral part of these financial statements.
| 75 |
Statements of Operations
For Years Ended December 31, 2019, 2018, and 2017
(Expressed in U.S. Dollars)
| Year Ended | Year Ended | Year Ended | ||||||||||
| December 31, 2019 | December 31, 2018 | December 31, 2017 | ||||||||||
| Investment Income | ||||||||||||
| Interest income | ||||||||||||
| Non-Control/Non-Affiliate | $ | 20,812,478 | $ | 15,332,000 | $ | 10,230,173 | ||||||
| Other | 145,127 | 141,063 | 110,905 | |||||||||
| Total interest income | 20,957,605 | 15,473,063 | 10,341,078 | |||||||||
| Other income | ||||||||||||
| Non-Control/Non-Affiliate | 71,864 | 92,059 | 117,413 | |||||||||
| Total income | 21,029,469 | 15,565,122 | 10,458,491 | |||||||||
| Expenses | ||||||||||||
| Base management fee(a) | $ | 3,243,496 | $ | 2,446,249 | $ | 1,798,651 | ||||||
| Incentive fee(a) | 2,620,312 | 1,938,059 | 1,109,367 | |||||||||
| Administrative fee(a) | 265,000 | 265,000 | 265,000 | |||||||||
| Directors' fees | 210,000 | 195,000 | 195,000 | |||||||||
| Professional fees | 650,709 | 421,966 | 458,855 | |||||||||
| Other expenses | 328,812 | 174,252 | 197,066 | |||||||||
| Expenses before waivers from investment adviser and administrator | 7,318,329 | 5,440,526 | 4,023,939 | |||||||||
| Base management fee waivers(a) | (1,135,224 | ) | (856,187 | ) | (629,527 | ) | ||||||
| Incentive fee waivers(a) | (2,115,919 | ) | (1,577,318 | ) | (962,203 | ) | ||||||
| Total expenses, net of waivers | 4,067,186 | 3,007,021 | 2,432,209 | |||||||||
| Net Investment Income | 16,962,283 | 12,558,101 | 8,026,282 | |||||||||
| Realized and Unrealized (Loss) Gain on Investments | ||||||||||||
| Net realized (loss) gain on investments | (672,026 | ) | 449,694 | 696,970 | ||||||||
| Net change in unrealized depreciation on investments | (229,677 | ) | (1,778,021 | ) | (981,966 | ) | ||||||
| Net realized and unrealized loss on investments | (901,703 | ) | (1,328,327 | ) | (284,996 | ) | ||||||
| Net Increase in Net Assets Resulting from Operations | $ | 16,060,580 | $ | 11,229,774 | $ | 7,741,286 | ||||||
| Basic and Diluted per Share of Common Stock: | ||||||||||||
| Net investment income | $ | 0.52 | $ | 0.52 | $ | 0.44 | ||||||
| Net increase in net assets resulting from operations | $ | 0.49 | $ | 0.46 | $ | 0.43 | ||||||
| Weighted average shares of common stock outstanding basic | ||||||||||||
| diluted | 32,672,328 | 24,340,035 | 18,080,178 | |||||||||
| (a) | Refer to Note 4-Related Party Transactions for additional information |
The accompanying notes are an integral part of these financial statements.
| 76 |
Statements of Changes in Net Assets
For the Years Ended December 31, 2019, 2018, and 2017
(Expressed in U.S. Dollars)
| Year Ended December 31, 2019 | Year Ended December 31, 2018 | Year Ended December 31, 2017 | ||||||||||
| Operations | ||||||||||||
| Net investment income | $ | 16,962,283 | $ | 12,558,101 | $ | 8,026,282 | ||||||
| Net realized (loss) gain on investments | (672,026 | ) | 449,694 | 696,970 | ||||||||
| Net change in unrealized depreciation on investments | (229,677 | ) | (1,778,021 | ) | (981,966 | ) | ||||||
| Net increase in net assets resulting from operations | 16,060,580 | 11,229,774 | 7,741,286 | |||||||||
| Distributions: | ||||||||||||
| Distributions to common stockholders | (16,941,968 | ) | (12,987,835 | ) | (8,723,252 | ) | ||||||
| Return of capital to common stockholders | (142,234 | ) | (14,337 | ) | (192,169 | ) | ||||||
| Total distributions | (17,084,202 | ) | (13,002,172 | ) | (8,915,421 | ) | ||||||
| Capital Share Transactions: | ||||||||||||
| Issuance of common stock | 65,000,000 | 60,000,000 | 40,000,000 | |||||||||
| Reinvestment of common stock | 60 | 57 | 50 | |||||||||
| Net increase in net assets from capital share transactions | 65,000,060 | 60,000,057 | 40,000,050 | |||||||||
| Net Increase in Net Assets | 63,976,438 | 58,227,659 | 38,825,915 | |||||||||
| Net Assets, Beginning of Period | 267,423,235 | 209,195,576 | 170,369,661 | |||||||||
| Net Assets, End of Period | $ | 331,399,673 | $ | 267,423,235 | $ | 209,195,576 | ||||||
| (a) | For the year ended December 31, 2017, the components of distributions to common stockholders were comprised of distributions from net investment income of $8,026,282 and distributions from realized gains of $696,970. |
The accompanying notes are an integral part of these financial statements.
| 77 |
Statements of Cash Flows
For Years Ended December 31, 2019, 2018, and 2017
(Expressed in U.S. Dollars)
Year Ended | Year Ended | Year Ended | ||||||||||
December
31, | December
31, | December
31, | ||||||||||
| Cash flows from operating activities: | ||||||||||||
| Net increase in net assets resulting from operations | $ | 16,060,580 | $ | 11,229,774 | $ | 7,741,286 | ||||||
| Adjustments to reconcile net increase in net assets from operations to net cash used in operating activities: | ||||||||||||
| Net realized loss (gain) on investments | 672,026 | (449,694 | ) | (696,970 | ) | |||||||
| Net change in unrealized depreciation on investments | 229,677 | 1,778,021 | 981,966 | |||||||||
| Accretion of original issue discount interest and payment-in-kind interest | (337,313 | ) | (138,588 | ) | (266,197 | ) | ||||||
| Increase in receivable from investments sold | (1,993,379 | ) | - | - | ||||||||
| Increase in interest receivable | (384,215 | ) | (128,688 | ) | (45,655 | ) | ||||||
| (Increase) decrease in receivable from bank loan repayment | (70,448 | ) | (9,713 | ) | 6,773 | |||||||
| Decrease (increase) in other assets | - | 2,511 | (1,569 | ) | ||||||||
| (Decrease) increase in accrued expenses and other liabilities | (219,683 | ) | 278,800 | 39,646 | ||||||||
| Increase in fee due to administrator(a) | - | - | 44,375 | |||||||||
| Increase in fees due to investment advisor(a) | 152,222 | 4,859 | 90,430 | |||||||||
| (Decrease) increase in payable for investments purchased | (7,457,833 | ) | 9,944,862 | 742,532 | ||||||||
| Investment activity: | ||||||||||||
| Investments purchased | (134,467,139 | ) | (166,050,572 | ) | (131,131,217 | ) | ||||||
| Proceeds from investments sold | 9,096,342 | 1,520,433 | 3,022,500 | |||||||||
| Repayment of bank loans | 58,594,377 | 83,013,696 | 87,502,962 | |||||||||
| Total investment activity | (66,776,420 | ) | (81,516,443 | ) | (40,605,755 | ) | ||||||
| Net cash used in operating activities | (60,124,786 | ) | (59,004,299 | ) | (31,969,138 | ) | ||||||
| Cash flows from financing activities: | ||||||||||||
| Issuance of shares of common stock | 65,000,000 | 60,000,000 | 40,000,000 | |||||||||
| Distributions paid to common stockholders | (17,084,142 | ) | (13,002,115 | ) | (8,915,371 | ) | ||||||
| Net cash provided by financing activities | 47,915,858 | 46,997,885 | 31,084,629 | |||||||||
| Net decrease in cash and cash equivalents | (12,208,928 | ) | (12,006,414 | ) | (884,509 | ) | ||||||
| Cash and cash equivalents: | ||||||||||||
| Cash and cash equivalents, beginning of period | 17,715,145 | 29,721,559 | 30,566,068 | |||||||||
| Cash and cash equivalents, end of period | $ | 5,506,217 | $ | 17,715,145 | $ | 29,681,559 | ||||||
| Supplemental non-cash information | ||||||||||||
| Issuance of common shares in connection with dividend reinvestment plan | $ | 60 | $ | 57 | $ | 50 | ||||||
| Payment-in-kind ("PIK") interest income | $ | 91,960 | $ | - | $ | - |
| (a) | Refer to Note 4-Related Party Transactions for additional information |
The accompanying notes are an integral part of these financial statements.
| 78 |
Schedules of Investments
As of December 31, 2019
(Expressed in U.S. Dollars)
| Portfolio Investments (a) (b) (c) (d) (e) (f) | Par | Cost | Value | |||||||||
| BANK LOANS: NON-CONTROL/NON-AFFILIATE INVESTMENTS - (99.6%)(g)(h): | ||||||||||||
| Healthcare & Pharmaceuticals | ||||||||||||
| Radiology Partners, Senior Secured Term B Loan (First Lien), 6.66% (Libor + 4.75%), maturity 7/9/25(i) | $ | 5,187,469 | $ | 5,149,488 | $ | 5,211,316 | ||||||
| Pathway, Senior Secured Initial Term Loan (First Lien), 6.41% (Libor + 4.50%), maturity 12/20/24 | 4,956,161 | 4,911,269 | 4,943,769 | |||||||||
| Tecomet, Senior Secured 2017 Term Loan (First Lien), 5.16% (Libor + 3.25%), maturity 5/1/24 | 3,959,391 | 3,942,690 | 3,949,491 | |||||||||
| Advarra, Senior Secured Initial Term Loan (First Lien), 6.16% (Libor + 4.25%), maturity 7/9/26(j) | 3,939,427 | 3,899,562 | 3,909,879 | |||||||||
| Young, Senior Secured Initial Term Loan (First Lien), 5.91% (Libor + 4.00%), maturity 11/7/24 | 3,834,156 | 3,823,748 | 3,805,398 | |||||||||
| Specialty Care, Senior Secured Initial Term Loan (First Lien), 5.41% (Libor + 3.50%), maturity 9/1/23 | 3,342,954 | 3,346,536 | 3,334,596 | |||||||||
| Zest Dental, Senior Secured Initial Term Loan (First Lien), 5.41% (Libor + 3.50%), maturity 3/14/25(i) | 3,333,213 | 3,356,177 | 3,199,884 | |||||||||
| Veritext, Senior Secured Initial Term Loan (First Lien), 5.66% (Libor + 3.75%), maturity 8/1/25 | 3,187,891 | 3,173,500 | 3,171,951 | |||||||||
| Confluent Health, Senior Secured Initial Term Loan, 6.91% (Libor + 5.00%), maturity 6/24/26 | 2,985,000 | 2,957,225 | 2,962,613 | |||||||||
| Physicians Endoscopy, Senior Secured Initial Term Loan (First Lien), 6.16% (Libor + 4.25%), maturity 8/18/23 | 2,906,775 | 2,886,868 | 2,874,073 | |||||||||
| PharMedQuest, Senior Secured Initial Term Loan, 7.41% (Libor + 5.50%), maturity 10/31/24 | 2,500,000 | 2,463,488 | 2,481,250 | |||||||||
| Waystar, Senior Secured Term Loan B, 5.91% (Libor + 4.00%), maturity 10/22/26 | 2,500,000 | 2,487,836 | 2,481,250 | |||||||||
| MedRisk, Senior Secured Initial Term Loan (First Lien), 4.66% (Libor + 2.75%), maturity 12/27/24 | 2,450,000 | 2,455,219 | 2,450,000 | |||||||||
| Eating Recovery Center, Senior Secured Initial Term Loan (First Lien), 6.41% (Libor + 4.50%), maturity 9/23/24 | 2,446,014 | 2,426,873 | 2,421,554 | |||||||||
| OB Hospitalist Group, Senior Secured Term Loan (First Lien), 5.91% (Libor + 4.00%), maturity 8/1/24 | 2,316,088 | 2,305,375 | 2,316,088 | |||||||||
| MedRisk, Senior Secured Initial Loan (Second Lien), 8.66% (Libor + 6.75%), maturity 12/29/25 | 2,100,000 | 2,074,832 | 2,100,000 | |||||||||
| Zelis RedCard, Senior Secured Initial Term Loan, 6.66% (Libor + 4.75%), maturity 9/30/26(i) | 2,000,000 | 1,980,688 | 2,014,889 | |||||||||
| Press Ganey, Senior Secured Initial Term Loan (First Lien), 5.41% (Libor + 3.50%), maturity 7/24/26(i) | 1,995,000 | 1,987,841 | 2,011,774 | |||||||||
| Avalign Technologies, Senior Secured Initial Term Loan (First Lien), 6.41% (Libor + 4.50%), maturity 12/22/25 | 1,980,000 | 1,962,728 | 1,957,725 | |||||||||
| CareCentrix, Senior Secured Initial Term Loan, 6.41% (Libor + 4.50%), maturity 4/3/25 | 1,912,500 | 1,904,900 | 1,912,500 | |||||||||
| Premise Health, Senior Secured Initial Term Loan (First Lien), 5.41% (Libor + 3.50%), maturity 7/10/25 | 1,829,786 | 1,838,127 | 1,825,212 | |||||||||
| Alpaca, Senior Secured Term Loan, 6.16% (Libor + 4.25%), maturity 4/19/24(j) | 1,674,127 | 1,650,502 | 1,669,942 | |||||||||
| CPS, Unitranche, 7.16% (Libor + 5.25%), maturity 2/28/25 | 1,492,500 | 1,472,625 | 1,488,769 | |||||||||
| Stepping Stones, Unitranche, 7.41% (Libor + 5.50%), maturity 12/12/24 | 1,484,409 | 1,477,320 | 1,467,709 | |||||||||
| Ensemble, Senior Secured Closing Date Term Loan, 5.66% (Libor + 3.75%), maturity 8/3/26(i) | 997,500 | 992,719 | 1,006,949 | |||||||||
| Veritext, Senior Secured Initial Term Loan (Second Lien), 8.91% (Libor + 7.00%), maturity 7/31/26 | 1,000,000 | 995,613 | 995,000 | |||||||||
| Upstream Rehabilitation, Senior Secured Term Loan, 6.41% (Libor + 4.50%), maturity 11/20/26 | 1,000,000 | 995,045 | 992,500 | |||||||||
| Packaging Coordinators, Senior Secured Initial Term Loan (First Lien), 5.91% (Libor + 4.00%), maturity 6/30/23(i) | 984,694 | 990,391 | 978,540 | |||||||||
| Alcami, Senior Secured Initial Term Loan (First Lien), 6.16% (Libor + 4.25%), maturity 7/14/25 | 987,500 | 983,389 | 972,688 | |||||||||
| Aegis Sciences, Senior Secured Initial Term Loan (2018) (First Lien), 7.41% (Libor + 5.50%), maturity 5/9/25 | 987,500 | 975,453 | 960,344 | |||||||||
| Dermatologists of Central States, Senior Secured Term Loan, 8.41% (Libor + 6.50%), maturity 4/20/22 | 977,310 | 970,785 | 960,207 | |||||||||
| ATI Physical Therapy, Senior Secured Initial Term Loan (First Lien), 5.41% (Libor + 3.50%), maturity 5/10/23(i) | 922,022 | 926,900 | 920,657 | |||||||||
| Specialty Care, Senior Secured Initial Term Loan (Second Lien), 10.16% (Libor + 8.25%), maturity 9/1/24 | 850,000 | 843,325 | 850,000 | |||||||||
| Athena, Senior Secured Term B Loan (First Lien), 6.41% (Libor + 4.50%), maturity 2/11/26(i) | 497,494 | 495,129 | 500,973 | |||||||||
| RMP & MedA/Rx, Senior Secured Term Loan, 6.41% (Libor + 4.50%), maturity 3/2/22 | 441,647 | 440,553 | 441,647 | |||||||||
| Injured Workers Pharmacy, Senior Secured Term Loan (First Lien), 6.66% (Libor + 4.75%), maturity 7/22/20 | 378,724 | 375,038 | 375,883 | |||||||||
| Alpaca, Senior Secured Revolver, 6.16% (Libor + 4.25%), maturity 4/19/24(j) | 134,215 | 130,332 | 133,879 | |||||||||
| Advarra, Senior Secured Initial Revolving Loan (First Lien), 6.16% (Libor + 4.25%), maturity 7/9/26(j) | - | (7,619 | ) | - | ||||||||
| High Tech Industries | ||||||||||||
| Qlik, Senior Secured 2019 Incremental Term Loan, 6.16% (Libor + 4.25%), maturity 4/26/24 | 3,980,000 | 3,954,501 | 3,950,150 | |||||||||
| Barracuda, Senior Secured 2019 Incremental Term Loan (First Lien), 5.16% (Libor + 3.25%), maturity 2/12/25(i) | 3,451,222 | 3,464,246 | 3,477,852 | |||||||||
| Masergy, Senior Secured Initial Loan (Second Lien), 9.41% (Libor + 7.50%), maturity 12/16/24 | 3,428,571 | 3,420,116 | 3,411,429 | |||||||||
| Syncsort, Senior Secured 2018 Refinancing Term Loan (First Lien), 6.41% (Libor + 4.50%), maturity 8/16/24 | 3,421,688 | 3,397,118 | 3,387,471 | |||||||||
| Sparta, Senior Secured New Term Loan (First Lien), 5.41% (Libor + 3.50%), maturity 8/21/24 | 3,421,250 | 3,423,008 | 3,344,272 | |||||||||
| Jaggaer, Senior Secured Initial Term Loan (First Lien), 5.91% (Libor + 4.00%), maturity 8/14/26(i) | 3,154,345 | 3,150,077 | 3,166,174 | |||||||||
| Infogroup, Senior Secured Term Loan (First Lien), 6.91% (Libor + 5.00%), maturity 4/3/23 | 2,919,937 | 2,895,405 | 2,890,738 | |||||||||
| McAfee, Senior Secured Term B USD Loan, 5.66% (Libor + 3.75%), maturity 9/30/24(i) | 2,864,431 | 2,875,358 | 2,883,023 | |||||||||
| eResearch (ERT), Senior Secured Initial Term Loan, 5.66% (Libor + 3.75%), maturity 5/2/23(i) | 2,538,022 | 2,538,022 | 2,538,022 | |||||||||
| ECi Software Solutions, Senior Secured Initial Term Loan, 6.16% (Libor + 4.25%), maturity 9/27/24(i) | 2,463,579 | 2,451,402 | 2,468,662 | |||||||||
| EverCommerce, Senior Secured Initial Term Loan, 7.41% (Libor + 5.50%), maturity 8/23/25 | 2,184,679 | 2,142,420 | 2,179,217 | |||||||||
| Idera, Senior Secured Initial Term Loan (First Lien), 6.41% (Libor + 4.50%), maturity 6/28/24 | 2,146,089 | 2,145,337 | 2,146,089 | |||||||||
| Intermedia , Senior Secured New Term Loan (First Lien), 7.91% (Libor + 6.00%), maturity 7/21/25(i) | 1,980,000 | 1,963,699 | 1,985,107 | |||||||||
| Flexera Software, Senior Secured Initial Term Loan (First Lien), 5.41% (Libor + 3.50%), maturity 2/26/25(i) | 1,965,000 | 1,970,591 | 1,973,626 | |||||||||
| QuickBase, Senior Secured Term Loan (First Lien), 5.91% (Libor + 4.00%), maturity 4/2/26 | 1,990,000 | 1,981,139 | 1,970,100 | |||||||||
| GlobalLogic, Senior Secured Initial Term Loan, 5.16% (Libor + 3.25%), maturity 8/1/25(i) | 1,728,438 | 1,719,948 | 1,728,438 | |||||||||
| Bomgar, Senior Secured Initial Term Loan (First Lien), 5.91% (Libor + 4.00%), maturity 4/18/25 | 1,723,750 | 1,733,891 | 1,702,203 | |||||||||
| Liaison, Senior Secured Initial Term Loan, 6.41% (Libor + 4.50%), maturity 12/20/26(i) | 1,500,000 | 1,496,250 | 1,496,250 | |||||||||
| OEConnection, Senior Secured Initial Term Loan, 5.91% (Libor + 4.00%), maturity 9/25/26 | 1,496,250 | 1,488,267 | 1,485,028 | |||||||||
| Navex Global, Senior Secured Initial Term Loan (First Lien), 5.16% (Libor + 3.25%), maturity 9/5/25(i) | 1,481,250 | 1,467,074 | 1,484,310 | |||||||||
| Compusearch Software Systems, Senior Secured Term Loan C, 6.16% (Libor + 4.25%), maturity 5/8/23 | 1,432,979 | 1,432,391 | 1,425,814 | |||||||||
| Ultimate Software , Senior Secured Initial Term Loan (First Lien), 5.66% (Libor + 3.75%), maturity 5/4/26(i) | 1,080,625 | 1,082,379 | 1,089,829 | |||||||||
| Insurity, Senior Secured Closing Date Term Loan (First Lien), 5.91% (Libor + 4.00%), maturity 7/31/26 | 1,000,000 | 995,219 | 997,500 | |||||||||
| Global Knowledge, Senior Secured Initial Term Loan (Second Lien), 12.16% (Libor + 10.25%), maturity 1/20/22 | 1,000,000 | 995,441 | 988,750 | |||||||||
| LANDesk, Senior Secured Term Loan (First Lien), 6.16% (Libor + 4.25%), maturity 1/20/24(i) | 978,627 | 969,988 | 981,924 | |||||||||
| Corsair, Senior Secured Term Loan (First Lien), 6.16% (Libor + 4.25%), maturity 8/28/24 | 982,444 | 978,622 | 967,707 | |||||||||
| Community Brands, Senior Secured Initial Term Loan (First Lien), 5.91% (Libor + 4.00%), maturity 12/2/22 | 834,254 | 830,477 | 825,912 | |||||||||
| HelpSystems, Senior Secured Initial Term Loan (First Lien), 6.66% (Libor + 4.75%), maturity 11/19/26(i) | 500,000 | 498,750 | 498,750 | |||||||||
| Masergy, Senior Secured 2017 Replacement Term Loan (First Lien), 5.16% (Libor + 3.25%), maturity 12/15/23 | 484,908 | 483,405 | 482,484 | |||||||||
| Endurance Int'l Group, Senior Secured Refinancing Loan (2018), 5.66% (Libor + 3.75%), maturity 2/9/23(i) | 404,507 | 403,788 | 401,013 | |||||||||
The accompanying notes are an integral part of these financial statements.
| 79 |
Audax Credit BDC Inc.
Schedules of Investments (Continued)
As of December 31, 2019
(Expressed in U.S. Dollars)
| Portfolio Investments (a) (b) (c) (d) (e) (f) | Par | Cost | Value | |||||||||
| BANK LOANS: NON-CONTROL/NON-AFFILIATE INVESTMENTS(h) (Continued): | ||||||||||||
| Services: Business | ||||||||||||
| CoAdvantage, Senior Secured Initial Term Loan (First Lien), 6.91% (Libor + 5.00%), maturity 9/23/25 | $ | 3,990,000 | $ | 3,950,952 | $ | 3,970,050 | ||||||
| RevSpring, Senior Secured Initial Term Loan (First Lien), 5.91% (Libor + 4.00%), maturity 10/11/25 | 3,960,000 | 3,955,758 | 3,950,100 | |||||||||
| Aimbridge, Senior Secured Initial Term Loan (2019) (First Lien), 5.66% (Libor + 3.75%), maturity 2/2/26 | 2,982,525 | 2,973,315 | 2,975,069 | |||||||||
| Addison, Senior Secured Initial Term Loan, 6.91% (Libor + 5.00%), maturity 4/15/26 | 2,985,000 | 2,931,090 | 2,962,613 | |||||||||
| Fleetwash, Senior Secured Incremental Term Loan, 6.66% (Libor + 4.75%), maturity 10/1/24 | 2,962,613 | 2,938,051 | 2,947,799 | |||||||||
| Sterling Backcheck, Senior Secured Initial Term Loan (First Lien), 5.41% (Libor + 3.50%), maturity 6/19/24(i) | 2,894,218 | 2,894,218 | 2,883,365 | |||||||||
| Allied Universal, Senior Secured Initial Term Loan, 6.16% (Libor + 4.25%), maturity 7/10/26(i) | 2,613,149 | 2,591,810 | 2,635,788 | |||||||||
| Cast & Crew, Senior Secured Initial Term Loan (First Lien), 5.91% (Libor + 4.00%), maturity 2/9/26(i) | 2,481,250 | 2,484,662 | 2,497,618 | |||||||||
| HireRight, Senior Secured Initial Term Loan (Second Lien), 9.16% (Libor + 7.25%), maturity 7/10/26 | 2,500,000 | 2,479,365 | 2,481,250 | |||||||||
| Newport Group, Senior Secured Initial Term Loan (First Lien), 5.66% (Libor + 3.75%), maturity 9/12/25 | 2,471,231 | 2,458,304 | 2,452,697 | |||||||||
| First Advantage, Senior Secured Term Loan (First Lien), 7.16% (Libor + 5.25%), maturity 6/30/22 | 2,000,000 | 1,996,094 | 1,990,000 | |||||||||
| Vistage, Senior Secured Term B Loan (First Lien), 5.91% (Libor + 4.00%), maturity 2/10/25 | 1,965,000 | 1,961,739 | 1,960,088 | |||||||||
| Service Logic, Senior Secured Initial Term Loan (First Lien), 6.16% (Libor + 4.25%), maturity 12/31/24 | 2,339,998 | 2,333,703 | 2,316,598 | |||||||||
| Eliassen Group, Senior Secured Initial Term B Loan, 6.41% (Libor + 4.50%), maturity 11/5/24 | 1,493,123 | 1,486,683 | 1,489,390 | |||||||||
| OSG Billing Services, Senior Secured Term B Loan (First Lien), 6.41% (Libor + 4.50%), maturity 3/27/24 | 1,474,855 | 1,470,192 | 1,467,481 | |||||||||
| DBi Services, Senior Secured Term B Loan (Second Lien), 8.00% (Libor + 8.00%), maturity 2/2/26 | 1,268,869 | 1,268,869 | 1,268,869 | |||||||||
| Diversified, Senior Secured Initial Term Loan, 6.66% (Libor + 4.75%), maturity 12/23/23 | 992,500 | 986,007 | 990,019 | |||||||||
| WCG, Senior Secured Term Loan, 5.91% (Libor + 4.00%), maturity 1/8/27(i) | 1,000,000 | 990,000 | 990,000 | |||||||||
| Franklin Energy, Senior Secured Term B Loan (First Lien), 5.91% (Libor + 4.00%), maturity 8/14/26 | 997,500 | 995,123 | 987,525 | |||||||||
| Worley Claims Services, Senior Secured Initial Term Loan (First Lien), 5.91% (Libor + 4.00%), maturity 6/3/26(i) | 498,747 | 494,694 | 498,747 | |||||||||
| Chemicals, Plastics & Rubber | ||||||||||||
| Plaskolite, Senior Secured Initial Term Loan (First Lien), 6.16% (Libor + 4.25%), maturity 12/15/25 | 3,960,000 | 3,896,852 | 3,920,400 | |||||||||
| Transcendia, Senior Secured 2017 Refinancing Term Loan (First Lien), 5.41% (Libor + 3.50%), maturity 5/30/24 | 3,427,599 | 3,413,966 | 3,341,909 | |||||||||
| Universal Fiber Systems, Senior Secured Initial Term Loan (First Lien), 6.66% (Libor + 4.75%), maturity 10/4/21 | 2,811,462 | 2,806,249 | 2,741,176 | |||||||||
| Spectrum Plastics, Senior Secured Closing Date Term Loan (First Lien), 5.16% (Libor + 3.25%), maturity 1/31/25 | 2,682,225 | 2,691,463 | 2,615,169 | |||||||||
| Unifrax, Senior Secured USD Term Loan (First Lien), 5.66% (Libor + 3.75%), maturity 12/12/25(i) | 2,476,241 | 2,454,997 | 2,286,895 | |||||||||
| Q Holding, Senior Secured Term B Loan (2019), 6.91% (Libor + 5.00%), maturity 12/29/23 | 1,995,000 | 1,985,388 | 1,985,025 | |||||||||
| Boyd Corp, Senior Secured Initial Loan (Second Lien), 8.66% (Libor + 6.75%), maturity 9/6/26 | 2,000,000 | 2,002,217 | 1,985,000 | |||||||||
| DuBois Chemicals 2019, Senior Secured Term Loan (Second Lien), 10.41% (Libor + 8.50%), maturity 9/30/27 | 2,000,000 | 1,950,862 | 1,985,000 | |||||||||
| Borchers, Senior Secured Term Loan, 6.41% (Libor + 4.50%), maturity 11/1/24 | 1,910,136 | 1,905,332 | 1,900,585 | |||||||||
| Zep, Senior Secured Initial Term Loan (First Lien), 5.91% (Libor + 4.00%), maturity 8/12/24 | 1,956,225 | 1,954,251 | 1,584,542 | |||||||||
| DuBois Chemicals 2019, Senior Secured Term Loan B (First Lien), 6.41% (Libor + 4.50%), maturity 9/30/26 | 1,560,865 | 1,516,107 | 1,549,159 | |||||||||
| Spartech, Senior Secured Term Loan, 6.91% (Libor + 5.00%), maturity 10/17/25 | 1,000,000 | 985,134 | 992,500 | |||||||||
| Vantage Specialty Chemicals, Senior Secured Closing Date Term Loan (First Lien), 5.41% (Libor + 3.50%), maturity 10/28/24 | 987,406 | 970,460 | 967,657 | |||||||||
| Prince Minerals, Senior Secured Initial Term Loan (First Lien), 5.41% (Libor + 3.50%), maturity 3/31/25(i) | 982,500 | 978,584 | 892,145 | |||||||||
| Services: Consumer | ||||||||||||
| CIBT Holdings, Senior Secured Initial Term Loan (First Lien), 5.66% (Libor + 3.75%), maturity 6/3/24 | 5,424,266 | 5,407,341 | 5,370,023 | |||||||||
| A Place For Mom, Senior Secured Term Loan, 5.66% (Libor + 3.75%), maturity 8/10/24 | 2,666,144 | 2,665,484 | 2,599,490 | |||||||||
| Weld North, Senior Secured Initial Term Loan, 6.16% (Libor + 4.25%), maturity 2/15/25 | 2,463,674 | 2,441,530 | 2,463,674 | |||||||||
| Cambium Learning, Senior Secured Initial Term Loan (First Lien), 6.41% (Libor + 4.50%), maturity 12/18/25 | 2,475,000 | 2,365,058 | 2,462,625 | |||||||||
| Smart Start, Senior Secured Initial Term Loan (First Lien), 6.41% (Libor + 4.50%), maturity 2/21/22 | 2,417,625 | 2,417,625 | 2,399,493 | |||||||||
| Mister Car Wash, Senior Secured Initial Term Loan (First Lien), 5.41% (Libor + 3.50%), maturity 5/14/26(i) | 1,990,000 | 1,985,439 | 2,002,726 | |||||||||
| SMG, Senior Secured Initial Term Loan (First Lien), 4.91% (Libor + 3.00%), maturity 1/23/25(i) | 1,976,118 | 1,963,737 | 1,976,118 | |||||||||
| Valet Living, Senior Secured Initial Term Loan, 5.91% (Libor + 4.00%), maturity 9/28/25 | 1,983,718 | 1,979,195 | 1,973,800 | |||||||||
| LegalShield, Senior Secured Initial Term Loan (First Lien), 5.16% (Libor + 3.25%), maturity 5/1/25 | 1,940,510 | 1,927,273 | 1,935,659 | |||||||||
| Ned Stevens, Senior Secured Term A Loan, 7.66% (Libor + 5.75%), maturity 9/30/25(j) | 1,603,824 | 1,572,794 | 1,591,795 | |||||||||
| Spring Education, Senior Secured Initial Term Loan (First Lien), 6.16% (Libor + 4.25%), maturity 7/30/25 | 987,500 | 985,450 | 982,563 | |||||||||
| Ned Stevens, Senior Secured Revolver, 6.66% (Libor + 4.75%), maturity 9/30/25(j) | - | (2,614 | ) | - | ||||||||
| Aerospace & Defense | ||||||||||||
| CPI International, Senior Secured TL, 6.66% (Libor + 4.75%), maturity 7/26/24 | 4,000,000 | 3,960,000 | 3,970,000 | |||||||||
| StandardAero, Senior Secured Initial Term B-1 Loan, 5.91% (Libor + 4.00%), maturity 4/6/26(i) | 3,567,981 | 3,556,378 | 3,599,650 | |||||||||
| StandardAero, Senior Secured Initial Term B-2 Loan, 5.91% (Libor + 4.00%), maturity 4/6/26(i) | 1,918,269 | 1,912,031 | 1,935,296 | |||||||||
| Consolidated Precision Products, Senior Secured Initial Term Loan (Second Lien), 9.66% (Libor + 7.75%), maturity 4/30/26 | 1,500,000 | 1,514,877 | 1,485,000 | |||||||||
| Tronair, Senior Secured Initial Term Loan (First Lien), 6.66% (Libor + 4.75%), maturity 9/8/23 | 1,459,899 | 1,453,639 | 1,427,051 | |||||||||
| Consolidated Precision Products, Senior Secured Initial Term Loan (First Lien), 5.66% (Libor + 3.75%), maturity 4/30/25(i) | 497,481 | 495,124 | 494,358 | |||||||||
| Banking, Finance, Insurance & Real Estate | ||||||||||||
| American Beacon Advisors, Senior Secured Tranche C Term Loan (Second Lien), 9.41% (Libor + 7.50%), maturity 4/30/23 | 2,000,000 | 2,000,000 | 1,995,000 | |||||||||
| Kestra Financial, Senior Secured Initial Term Loan, 6.16% (Libor + 4.25%), maturity 6/3/26 | 1,995,000 | 1,976,368 | 1,990,013 | |||||||||
| Integro Insurance Brokers, Senior Secured Initial Term Loan (First Lien), 7.66% (Libor + 5.75%), maturity 10/31/22 | 1,989,457 | 1,951,565 | 1,939,721 | |||||||||
| Advisor Group, Senior Secured Initial Term B Loan, 6.91% (Libor + 5.00%), maturity 7/31/26(i) | 1,490,625 | 1,465,245 | 1,478,349 | |||||||||
| EPIC Insurance, Senior Secured Initial Term Loan (First Lien), 6.16% (Libor + 4.25%), maturity 9/6/24 | 1,470,000 | 1,467,280 | 1,458,975 | |||||||||
| AmeriLife Group, Senior Secured Initial Term Loan (First Lien), 6.41% (Libor + 4.50%), maturity 6/12/26 | 978,070 | 973,369 | 970,735 | |||||||||
| Aperio, Senior Secured Loan, 6.91% (Libor + 5.00%), maturity 10/25/24 | 933,889 | 929,619 | 933,889 | |||||||||
| Consumer Goods: Non-durable | ||||||||||||
| Manna Pro, Senior Secured Term Loan, 7.91% (Libor + 6.00%), maturity 12/8/23 | 3,438,750 | 3,399,412 | 3,412,959 | |||||||||
| Augusta Sportswear Group, Senior Secured Initial Term Loan, 6.41% (Libor + 4.50%), maturity 10/26/23 | 2,228,517 | 2,214,540 | 2,211,804 | |||||||||
| Badger Sportswear, Senior Secured Initial Term Loan (First Lien), 6.91% (Libor + 5.00%), maturity 9/11/23 | 1,906,766 | 1,895,349 | 1,873,398 | |||||||||
| Varsity Brands, Senior Secured Initial Term Loan (First Lien), 5.41% (Libor + 3.50%), maturity 12/16/24(i) | 987,418 | 993,636 | 973,861 | |||||||||
The accompanying notes are an integral part of these financial statements.
| 80 |
Audax Credit BDC Inc.
Schedules of Investments (Continued)
As of December 31, 2019
(Expressed in U.S. Dollars)
| Portfolio Investments (a) (b) (c) (d) (e) (f) | Par | Cost | Value | |||||||||
| BANK LOANS: NON-CONTROL/NON-AFFILIATE INVESTMENTS(h) (Continued): | ||||||||||||
| Containers, Packaging & Glass | ||||||||||||
| ProAmpac, Senior Secured Initial Term Loan (First Lien), 5.41% (Libor + 3.50%), maturity 11/20/23(i) | $ | 3,000,535 | $ | 3,017,391 | $ | 2,972,870 | ||||||
| Anchor Packaging, Senior Secured Initial Term Loan (First Lien), 5.91% (Libor + 4.00%), maturity 7/18/26 | 1,995,000 | 1,985,448 | 1,995,000 | |||||||||
| Tank Holding, Senior Secured Initial Term Loan (First Lien), 5.91% (Libor + 4.00%), maturity 3/26/26(i) | 997,500 | 993,032 | 1,003,416 | |||||||||
| Pregis Corporation, Senior Secured Initial Term Loan (First Lien), 5.91% (Libor + 4.00%), maturity 7/31/26 | 1,000,000 | 997,605 | 995,000 | |||||||||
| TricorBraun, Senior Secured Closing Date Term Loan (First Lien), 5.66% (Libor + 3.75%), maturity 11/30/23(i) | 494,901 | 494,901 | 491,978 | |||||||||
| Alpha Packaging, Senior Secured Tranche B-1 Term Loan, 6.16% (Libor + 4.25%), maturity 5/12/20 | 488,837 | 488,275 | 483,338 | |||||||||
| Capital Equipment | ||||||||||||
| MW Industries, Senior Secured 2018 New Term Loan (First Lien), 5.66% (Libor + 3.75%), maturity 9/30/24 | 2,443,750 | 2,443,750 | 2,419,313 | |||||||||
| BAS, Senior Secured Repricing Term Loan, 5.66% (Libor + 3.75%), maturity 5/21/24 | 1,969,661 | 1,971,159 | 1,959,812 | |||||||||
| Edward Don, Senior Secured Initial Term Loan, 6.16% (Libor + 4.25%), maturity 7/2/25 | 1,478,769 | 1,472,799 | 1,452,890 | |||||||||
| Cole-Parmer, Senior Secured Closing Date Term Loan (First Lien), 6.16% (Libor + 4.25%), maturity 11/4/26 | 1,000,000 | 995,111 | 992,500 | |||||||||
| Excelitas, Senior Secured Initial USD Term Loan (First Lien), 5.41% (Libor + 3.50%), maturity 12/2/24 | 493,703 | 497,366 | 490,000 | |||||||||
| TriMark, Senior Secured Initial Term Loan (First Lien), 5.41% (Libor + 3.50%), maturity 8/28/24(i) | 491,207 | 492,665 | 406,376 | |||||||||
| Wholesale | ||||||||||||
| Carlisle FoodService, Senior Secured Initial Term Loan (First Lien), 4.91% (Libor + 3.00%), maturity 3/20/25 | 3,935,671 | 3,936,089 | 3,906,153 | |||||||||
| PetroChoice, Senior Secured Initial Term Loan (First Lien), 6.91% (Libor + 5.00%), maturity 8/19/22 | 1,915,184 | 1,893,658 | 1,891,245 | |||||||||
| ABB Optical, Senior Secured Initial Term Loan (First Lien), 6.91% (Libor + 5.00%), maturity 6/15/23 | 1,454,906 | 1,452,426 | 1,422,170 | |||||||||
| Transportation: Cargo | ||||||||||||
| Odyssey Logistics & Technology , Senior Secured New Term Loan (First Lien), 5.91% (Libor + 4.00%), maturity 10/12/24 | 3,615,344 | 3,611,340 | 3,588,229 | |||||||||
| Transplace, Senior Secured Closing Date Term Loan (First Lien), 5.66% (Libor + 3.75%), maturity 10/7/24(i) | 2,466,458 | 2,459,768 | 2,460,292 | |||||||||
| Capstone Logistics, Senior Secured Term Loan (First Lien), 6.41% (Libor + 4.50%), maturity 10/7/21 | 1,161,707 | 1,161,868 | 1,144,282 | |||||||||
| Construction & Building | ||||||||||||
| PlayPower, Senior Secured Initial Term Loan, 7.41% (Libor + 5.50%), maturity 5/8/26 | 1,934,722 | 1,934,722 | 1,920,212 | |||||||||
| Tangent, Senior Secured Closing Date Term Loan (First Lien), 6.66% (Libor + 4.75%), maturity 11/30/24 | 1,496,238 | 1,480,815 | 1,488,757 | |||||||||
| DiversiTech Corporation, Senior Secured Tranche B-1 Term Loan (First Lien), 4.91% (Libor + 3.00%), maturity 6/3/24 | 1,474,832 | 1,462,983 | 1,460,084 | |||||||||
| PlayCore, Senior Secured Initial Term Loan (First Lien), 5.66% (Libor + 3.75%), maturity 9/30/24(i) | 976,912 | 975,059 | 964,701 | |||||||||
| CHI Overhead Doors, Senior Secured Initial Term Loan (First Lien), 5.16% (Libor + 3.25%), maturity 7/29/22(i) | 628,442 | 623,246 | 630,799 | |||||||||
| Hoffman Southwest, Senior Secured Initial Term Loan, 6.41% (Libor + 4.50%), maturity 8/14/23 | 527,876 | 523,556 | 525,237 | |||||||||
| Automotive | ||||||||||||
| Mavis, Senior Secured Closing Date Term Loan (First Lien), 5.16% (Libor + 3.25%), maturity 3/20/25(i) | 3,592,566 | 3,578,510 | 3,516,090 | |||||||||
| Truck Hero, Senior Secured Initial Term Loan (Second Lien), 10.16% (Libor + 8.25%), maturity 4/21/25 | 1,800,000 | 1,798,507 | 1,795,500 | |||||||||
| Safe Fleet, Senior Secured Tranche B-1 Term Loan (First Lien), 5.66% (Libor + 3.75%), maturity 2/3/25 | 987,500 | 963,545 | 982,563 | |||||||||
| Media: Advertising, Printing & Publishing | ||||||||||||
| Ansira, Unitranche, 7.66% (Libor + 5.75%), maturity 12/20/22 | 1,905,523 | 1,893,460 | 1,872,177 | |||||||||
| Northstar, Senior Secured Term Loan, 8.16% (Libor + 6.25%), maturity 6/7/22 | 1,449,510 | 1,449,510 | 1,438,639 | |||||||||
| Imagine! Print Solutions, Senior Secured Term B-1 Loan (First Lien), 6.66% (Libor + 4.75%), maturity 6/21/22 | 1,458,750 | 1,451,152 | 1,035,712 | |||||||||
| Vestcom International, Senior Secured L/C Collaterilized, 5.91% (Libor + 4.00%), maturity 12/19/23 | 783,878 | 786,703 | 777,999 | |||||||||
| Forest Products & Paper | ||||||||||||
| Hoffmaster Group, Senior Secured Tranche B-1 Term Loan (First Lien), 5.91% (Libor + 4.00%), maturity 11/21/23 | 2,927,277 | 2,915,319 | 2,898,005 | |||||||||
| Loparex, Senior Secured Initial Term Loan (First Lien), 6.41% (Libor + 4.50%), maturity 7/31/26 | 1,496,250 | 1,481,906 | 1,481,288 | |||||||||
| Beverage, Food & Tobacco | ||||||||||||
| Sovos Brands, Senior Secured Initial Term Loan (2018), 6.91% (Libor + 5.00%), maturity 11/20/25 | 1,980,000 | 1,962,677 | 1,960,200 | |||||||||
| Kettle Cuisine, Senior Secured Initial Term Loan (First Lien) , 5.66% (Libor + 3.75%), maturity 8/25/25 | 1,975,000 | 1,966,820 | 1,970,063 | |||||||||
| Hotel, Gaming & Leisure | ||||||||||||
| On Location, Senior Secured Second Amendment Term Loan, 6.91% (Libor + 5.00%), maturity 9/29/21 | 2,396,566 | 2,384,489 | 2,384,584 | |||||||||
| Auto Europe, Senior Secured Initial Dollar Term Loan, 6.91% (Libor + 5.00%), maturity 10/21/23 | 1,119,231 | 1,110,756 | 1,119,231 | |||||||||
| Consumer Goods: Durable | ||||||||||||
| Strategic Partners, Senior Secured Initial Term Loan, 5.66% (Libor + 3.75%), maturity 6/30/23 | 2,309,428 | 2,306,211 | 2,309,428 | |||||||||
| Retail | ||||||||||||
| Grocery Outlet, Senior Secured 2019 Term Loan (First Lien), 5.41% (Libor + 3.50%), maturity 10/22/25(i) | 1,269,483 | 1,266,905 | 1,286,070 | |||||||||
| Metals & Mining | ||||||||||||
| Dynatect, Senior Secured Term B Loan, 6.41% (Libor + 4.50%), maturity 9/30/22 | 997,579 | 990,633 | 987,604 | |||||||||
| Health Care Equipment & Services | ||||||||||||
| MyEyeDr, Senior Secured Initial Term Loan (First Lien), 6.16% (Libor + 4.25%), maturity 8/31/26(i) | 525,311 | 519,256 | 526,851 | |||||||||
| Total Bank Loans | $ | 331,601,425 | $ | 330,155,654 | ||||||||
The accompanying notes are an integral part of these financial statements.
| 81 |
Audax Credit BDC Inc.
Schedules of Investments (Continued)
As of December 31, 2019
(Expressed in U.S. Dollars)
| Portfolio Investments (a) (b) (c) (d) (e) (f) | Par | Cost | Value | |||||||||
| EQUITY AND PREFERRED SHARES: NON-CONTROL/NON-AFFILIATE INVESTMENTS- (0.2%)(g)(h): | ||||||||||||
| Services: Business | ||||||||||||
| DBi Services, Class A-1 Preferred Units (800.53 units)(k) | $ | 800,535 | $ | 400,267 | ||||||||
| DBi Services, Class B Common Shares (169,362.31 shares)(l)(m) | - | - | ||||||||||
| Services: Consumer | ||||||||||||
| Ned Stevens, Class B Common Units (261,438 Common B units, Fair value of $261,438)(f)(j)(m)(n)(o) | 261,438 | 261,438 | ||||||||||
| Healthcare & Pharmaceuticals | ||||||||||||
| Alpaca, Class A Units (33,300.04 Class A Units, Fair value of $57,552)(f)(i)(j)(m)(o)(p) | 58,608 | 57,552 | ||||||||||
| Total Equity and Preferred Shares | $ | 1,120,581 | $ | 719,257 | ||||||||
| Total Portfolio Investments(q) | $ | 332,722,006 | $ | 330,874,911 | ||||||||
| (a) | All companies are located in the United States of America, unless otherwise noted. |
| (b) | Interest rate percentages represent actual interest rates which are indexed from then 30-day London Interbank Offered Rate ("LIBOR") unless otherwise noted. LIBOR rates are subject to interest rate floors which can vary based on the contractual agreement with the borrower. Due dates represent the contractual maturity date. |
| (c) | All loans are income-producing, unless otherwise noted. |
| (d) | All investments are qualifying assets under Section 55(a) of the Investment Company Act of 1940, as amended (the "1940 Act") unless otherwise noted. |
| (e) | All investments are exempt from registration under the Securities Act of 1933 (the “Securities Act”), and may be deemed to be “restricted securities” under the Securities Act. |
| (f) | Unless indicated otherwise, all of our investments are valued using Level 3 inputs within the FASB Accounting Standard Codification (“ASC”) Topic 820, “Fair Value Measurements and Disclosures” (“ASC 820”) fair value hierarchy. Refer to Note 3 – Investments in the accompanying Notes to Financial Statements for additional information. |
| (g) | Percentages are calculated using fair value of investments over net assets. |
| (h) | As defined in 1940 Act, the Company is not deemed to be an “Affiliated Person” of or “Control” this portfolio company because it neither owns 5% or more of the portfolio company’s outstanding voting securities nor has the power to exercise control over the management or policies of such portfolio company (including through a management agreement). |
| (i) | Investment was valued using Level 2 inputs within the ASC 820 fair value hierarchy. Refer to Note 3 – Investments in the accompanying Notes to Financial Statements for additional information. |
| (j) | Three of our affiliated funds, Audax Direct Lending Solutions Fund - A, L.P., Audax Direct Lending Solutions Fund - C, L.P., and Audax Direct Lending Solutions Fund - D, L.P., " 'co-invested with us in this portfolio company pursuant to an exemptive order granted by the U.S. Securities and Exchange Commission. |
| (k) | Represents an investment owned by APD Dbi Preferred, Inc., a holding company for the investment in DBi. |
| (l) | Represents an investment owned by APD Dbi Common, Inc., a holding company for the investment in DBi. |
| (m) | Investment is non-income producing. |
| (n) | Represents an investment in APD NS Equity, L.P., a holding company, made through an affiliated equity aggregator vehicle. |
| (o) | Other net assets of $0 at the aggregator levels are included in the fair value of the investments when using the net asset value as a practical expedient. |
| (p) | Represents an investment in APD ALP Equity, L.P., a holding company, made through an affiliated equity aggregator vehicle. |
| (q) | At December 31, 2019, the cost of investments for income tax purposes was $332,722,006 the gross unrealized depreciation for federal tax purposes was $2,951,506, the gross unrealized appreciation for federal income tax purposes was $1,104,411, and the net unrealized depreciation was $1,847,095. |
The accompanying notes are an integral part of these financial statements.
| 82 |
Audax Credit BDC Inc.
Schedules of Investments
As of December 31, 2018
(Expressed in U.S. Dollars)
| Portfolio Investments (a) (b) (c) (d) (e) (f) | Par | Cost | Value | |||||||||
| NON-CONTROL/NON-AFFILIATE INVESTMENTS - (99.0%)(g)(h): | ||||||||||||
| Healthcare & Pharmaceuticals | ||||||||||||
| Radiology Partners, Senior Secured Term B Loan (First Lien), 7.05% (Libor + 4.25%), maturity 7/9/25(i) | $ | 3,990,000 | $ | 3,952,085 | $ | 4,019,924 | ||||||
| Young, Senior Secured Initial Term Loan (First Lien), 6.80% (Libor + 4.00%), maturity 11/7/24(i) | 3,902,369 | 3,890,558 | 3,921,880 | |||||||||
| Beaver-Visitec, Senior Secured Term B Loan, 6.80% (Libor + 4.00%), maturity 8/21/23(i) | 3,914,044 | 3,914,043 | 3,914,043 | |||||||||
| Specialty Care, Senior Secured Initial Term Loan (First Lien), 6.55% (Libor + 3.75%), maturity 9/1/23 | 3,377,066 | 3,381,533 | 3,351,737 | |||||||||
| Zest Dental, Senior Secured Initial Term Loan (First Lien), 6.30% (Libor + 3.50%), maturity 3/14/25 | 3,367,138 | 3,394,604 | 3,333,466 | |||||||||
| Physicians Endoscopy, Senior Secured Initial Term Loan (First Lien), 7.05% (Libor + 4.25%), maturity 8/18/23 | 2,936,340 | 2,913,237 | 2,884,954 | |||||||||
| MedRisk, Senior Secured Initial Term Loan (First Lien), 5.55% (Libor + 2.75%), maturity 12/27/24 | 2,475,000 | 2,481,109 | 2,462,624 | |||||||||
| Eating Recovery Center, Senior Secured Initial Term Loan (First Lien), 7.30% (Libor + 4.50%), maturity 9/23/24 | 2,465,213 | 2,443,320 | 2,452,887 | |||||||||
| Upstream Rehabilitation, Senior Secured Initial Term Loan, 7.05% (Libor + 4.25%), maturity 1/3/24 | 2,411,880 | 2,409,690 | 2,405,850 | |||||||||
| OB Hospitalist Group, Senior Secured Term Loan (First Lien), 6.80% (Libor + 4.00%), maturity 8/1/24 | 2,363,660 | 2,350,839 | 2,363,660 | |||||||||
| Avalign Technologies, Senior Secured Term Loan B, 7.30% (Libor + 4.50%), maturity 12/19/25(i) | 2,000,000 | 1,980,000 | 1,980,000 | |||||||||
| CareCentrix, Senior Secured Initial Term Loan, 7.30% (Libor + 4.50%), maturity 4/3/25 | 1,962,500 | 1,953,489 | 1,957,594 | |||||||||
| Premise Health, Senior Secured Initial Term Loan (First Lien), 6.55% (Libor + 3.75%), maturity 7/10/25(i) | 1,848,316 | 1,858,011 | 1,859,868 | |||||||||
| Veritext, Senior Secured Initial Term Loan (First Lien), 6.55% (Libor + 3.75%), maturity 8/1/25(i) | 1,459,924 | 1,460,860 | 1,463,574 | |||||||||
| MedRisk, Senior Secured Initial Loan (Second Lien), 9.55% (Libor + 6.75%), maturity 12/29/25 | 1,100,000 | 1,089,000 | 1,091,750 | |||||||||
| Packaging Coordinators, Senior Secured Initial Term Loan (First Lien), 6.80% (Libor + 4.00%), maturity 6/30/23(i) | 994,898 | 1,002,071 | 992,411 | |||||||||
| Aegis Sciences, Senior Secured Initial Term Loan (2018) (First Lien), 8.30% (Libor + 5.50%), maturity 5/9/25 | 997,500 | 983,581 | 990,019 | |||||||||
| Veritext, Senior Secured Initial Term Loan (Second Lien), 9.80% (Libor + 7.00%), maturity 7/31/26 | 1,000,000 | 995,138 | 990,000 | |||||||||
| Alcami, Senior Secured Initial Term Loan (First Lien), 7.05% (Libor + 4.25%), maturity 7/14/25 | 997,500 | 992,739 | 982,538 | |||||||||
| U.S. Renal Care, Senior Secured Initial Term Loan (First Lien), 7.05% (Libor + 4.25%), maturity 12/30/22(i) | 993,613 | 989,751 | 980,199 | |||||||||
| ATI Physical Therapy, Senior Secured Initial Term Loan (First Lien), 6.30% (Libor + 3.50%), maturity 5/10/23 | 931,577 | 937,752 | 919,932 | |||||||||
| Dermatologists of Central States, Senior Secured Term Loan, 9.30% (Libor + 6.50%), maturity 4/20/22 | 895,940 | 887,937 | 891,460 | |||||||||
| Specialty Care, Senior Secured Initial Term Loan (Second Lien), 11.05% (Libor + 8.25%), maturity 9/1/24 | 850,000 | 842,238 | 843,625 | |||||||||
| RMP & MedA/Rx, Senior Secured Term Loan, 7.55% (Libor + 4.75%), maturity 3/2/22 | 467,243 | 465,637 | 466,075 | |||||||||
| High Tech Industries | ||||||||||||
| Navicure, Senior Secured Initial Term Loan (First Lien), 6.55% (Libor + 3.75%), maturity 11/1/24 | 3,466,241 | 3,455,194 | 3,457,575 | |||||||||
| Syncsort, Senior Secured 2018 Refinancing Term Loan (First Lien), 7.30% (Libor + 4.50%), maturity 8/16/24(i) | 3,456,338 | 3,427,046 | 3,452,017 | |||||||||
| Masergy, Senior Secured Initial Loan (Second Lien), 10.30% (Libor + 7.50%), maturity 12/16/24 | 3,428,571 | 3,418,552 | 3,402,857 | |||||||||
| Sparta, Senior Secured New Term Loan (First Lien), 6.30% (Libor + 3.50%), maturity 8/21/24 | 3,456,250 | 3,458,349 | 3,387,125 | |||||||||
| Barracuda, Senior Secured Term Loan (First Lien), 6.05% (Libor + 3.25%), maturity 2/12/25(i) | 2,985,000 | 3,003,618 | 2,950,673 | |||||||||
| Infogroup, Senior Secured Term Loan (First Lien), 7.80% (Libor + 5.00%), maturity 4/3/23 | 2,949,962 | 2,918,814 | 2,935,213 | |||||||||
| McAfee, Senior Secured Term B USD Loan, 6.55% (Libor + 3.75%), maturity 9/30/24(i) | 2,893,438 | 2,906,309 | 2,881,864 | |||||||||
| HelpSystems, Senior Secured Term Loan (First Lien), 6.55% (Libor + 3.75%), maturity 3/28/25 | 2,487,500 | 2,485,229 | 2,468,844 | |||||||||
| Intermedia , Senior Secured New Term Loan (First Lien), 8.80% (Libor + 6.00%), maturity 7/21/25 | 2,000,000 | 1,980,887 | 1,995,000 | |||||||||
| Flexera Software, Senior Secured Initial Term Loan (First Lien), 6.05% (Libor + 3.25%), maturity 2/26/25(i) | 1,985,000 | 1,990,262 | 1,962,173 | |||||||||
| Bomgar, Senior Secured Initial Term Loan (First Lien), 6.80% (Libor + 4.00%), maturity 4/18/25 | 1,741,250 | 1,753,357 | 1,732,544 | |||||||||
| GlobalLogic, Senior Secured Initial Term Loan, 6.05% (Libor + 3.25%), maturity 8/1/25(i) | 1,745,625 | 1,735,985 | 1,725,987 | |||||||||
| Idera, Senior Secured Initial Term Loan (First Lien), 7.30% (Libor + 4.50%), maturity 6/28/24 | 1,665,545 | 1,667,150 | 1,665,545 | |||||||||
| SciQuest, Senior Secured Term Loan, 6.80% (Libor + 4.00%), maturity 12/28/24 | 1,488,750 | 1,482,127 | 1,488,750 | |||||||||
| ECi Software Solutions, Senior Secured Initial Term Loan, 7.05% (Libor + 4.25%), maturity 9/27/24(i) | 1,486,237 | 1,474,659 | 1,482,522 | |||||||||
| Compusearch Software Systems, Senior Secured Initial Term Loan, 7.05% (Libor + 4.25%), maturity 5/7/21 | 1,474,211 | 1,473,229 | 1,466,840 | |||||||||
| Navex Global, Senior Secured Initial Term Loan (First Lien), 6.05% (Libor + 3.25%), maturity 9/5/25(i) | 1,496,250 | 1,479,928 | 1,455,103 | |||||||||
| Corsair, Senior Secured Term Loan (First Lien), 7.05% (Libor + 4.25%), maturity 8/28/24 | 992,683 | 988,177 | 982,756 | |||||||||
| Global Knowledge, Senior Secured Initial Term Loan (Second Lien), 13.05% (Libor + 10.25%), maturity 1/20/22 | 1,000,000 | 993,585 | 975,000 | |||||||||
| LANDesk, Senior Secured Term Loan (First Lien), 7.05% (Libor + 4.25%), maturity 1/20/24(i) | 988,129 | 977,504 | 958,979 | |||||||||
| Community Brands, Senior Secured Initial Term Loan (First Lien), 6.80% (Libor + 4.00%), maturity 12/2/22 | 798,373 | 793,856 | 794,381 | |||||||||
| Masergy, Senior Secured 2017 Replacement Term Loan (First Lien), 6.05% (Libor + 3.25%), maturity 12/15/23 | 490,000 | 488,150 | 486,325 | |||||||||
| MultiPlan, Senior Secured Initial Term Loan, 5.55% (Libor + 2.75%), maturity 6/7/23(i) | 500,000 | 483,750 | 485,650 | |||||||||
| Endurance Int'l Group, Senior Secured Refinancing Loan (2018), 6.55% (Libor + 3.75%), maturity 2/9/23(i) | 443,365 | 442,430 | 437,823 | |||||||||
| Services: Business | ||||||||||||
| CoAdvantage, Senior Secured Term Loan (First Lien), 7.30% (Libor + 4.50%), maturity 10/1/23(i) | 3,955,050 | 3,955,050 | 3,915,500 | |||||||||
| RevSpring, Senior Secured Initial Term Loan (First Lien), 7.05% (Libor + 4.25%), maturity 10/11/25(i) | 3,500,000 | 3,496,396 | 3,491,250 | |||||||||
| Fleetwash, Senior Secured Initial Term Loan, 7.55% (Libor + 4.75%), maturity 10/1/24 | 2,992,500 | 2,963,427 | 2,977,538 | |||||||||
| Sterling Backcheck, Senior Secured Initial Term Loan (First Lien), 6.30% (Libor + 3.50%), maturity 6/19/24 | 2,923,903 | 2,923,903 | 2,891,009 | |||||||||
| Systems Maintenance Services, Senior Secured Initial Term Loan (First Lien), 7.80% (Libor + 5.00%), maturity 10/30/23 | 2,940,000 | 2,940,000 | 2,499,000 | |||||||||
| HireRight, Senior Secured Initial Term Loan (Second Lien), 10.05% (Libor + 7.25%), maturity 7/10/26 | 2,500,000 | 2,476,095 | 2,481,250 | |||||||||
| Kellermeyer Bergensons Services, Senior Secured 2018 Replacement Term Loan (First Lien), 7.55% (Libor + 4.75%), maturity 10/29/21(i) | 2,318,897 | 2,309,135 | 2,313,099 | |||||||||
| First Advantage, Senior Secured Term Loan (First Lien), 8.05% (Libor + 5.25%), maturity 6/30/22 | 2,000,000 | 1,991,806 | 1,985,000 | |||||||||
| Newport Group, Senior Secured Initial Term Loan (First Lien), 6.55% (Libor + 3.75%), maturity 9/12/25 | 1,995,000 | 1,985,318 | 1,980,038 | |||||||||
| Vistage, Senior Secured Term B Loan (First Lien), 6.80% (Libor + 4.00%), maturity 2/10/25 | 1,985,000 | 1,980,809 | 1,980,038 | |||||||||
| Allied Universal, Senior Secured Incremental Term Loan (First Lien), 7.05% (Libor + 4.25%), maturity 7/28/22 | 2,000,000 | 2,000,000 | 1,977,500 | |||||||||
| DBi Services, Senior Secured Term B Loan, 8.05% (Libor + 5.25%), maturity 8/1/21 | 1,977,444 | 1,963,482 | 1,720,376 | |||||||||
| OSG Billing Services, Senior Secured Term B Loan (First Lien), 7.05% (Libor + 4.25%), maturity 3/27/24 | 1,489,391 | 1,483,770 | 1,478,221 | |||||||||
| Livingston, Senior Secured Refinancing Term B-3 Loan (First Lien), 8.55% (Libor + 5.75%), maturity 3/20/20 (j) | 1,485,000 | 1,486,788 | 1,468,294 | |||||||||
| Eliassen Group, Senior Secured Term Loan B, 7.30% (Libor + 4.50%), maturity 11/5/24 | 1,000,000 | 995,057 | 992,500 | |||||||||
| Service Logic, Senior Secured Initial Term Loan (First Lien), 7.05% (Libor + 4.25%), maturity 7/31/23(i) | 990,005 | 986,031 | 990,005 | |||||||||
| Equian, Senior Secured 2018 Incremental Term Loan, 6.05% (Libor + 3.25%), maturity 5/20/24(i) | 993,709 | 997,137 | 976,816 | |||||||||
| Livingston, Senior Secured Initial Term Loan (Second Lien), 11.05% (Libor + 8.25%), maturity 4/17/20 (i)(j) | 616,000 | 597,520 | 597,520 | |||||||||
| DBi Services, Senior Secured Super Priority Term Loan, 15.00% (Libor + 15.00%), maturity 2/1/20(i) | 144,000 | 144,000 | 144,000 | |||||||||
| Chemicals, Plastics & Rubber | ||||||||||||
| Plaskolite, Senior Secured Initial Term Loan (First Lien), 7.05% (Libor + 4.25%), maturity 12/15/25(i) | 3,500,000 | 3,430,000 | 3,482,500 | |||||||||
| Transcendia, Senior Secured 2017 Refinancing Term Loan (First Lien), 6.30% (Libor + 3.50%), maturity 5/30/24(i) | 2,962,575 | 2,962,667 | 2,969,981 | |||||||||
The accompanying notes are an integral part of these financial statements.
| 83 |
Audax Credit BDC Inc.
Schedules of Investments (Continued)
As of December 31, 2018
(Expressed in U.S. Dollars)
| Portfolio Investments (a) (b) (c) (d) (e) (f) | Par | Cost | Value | |||||||||
| NON-CONTROL/NON-AFFILIATE INVESTMENTS(h) (Continued): | ||||||||||||
| Chemicals, Plastics & Rubber (continued): | ||||||||||||
| Universal Fiber Systems, Senior Secured Initial Term Loan (First Lien), 7.55% (Libor + 4.75%), maturity 10/4/21 | $ | 2,864,310 | $ | 2,856,324 | $ | 2,828,506 | ||||||
| Spectrum Plastics, Senior Secured Closing Date Term Loan (First Lien), 6.05% (Libor + 3.25%), maturity 1/31/25 | 2,709,525 | 2,720,231 | 2,662,108 | |||||||||
| Boyd Corp, Senior Secured Initial Loan (Second Lien), 9.55% (Libor + 6.75%), maturity 9/6/26(i) | 2,000,000 | 2,002,455 | 2,000,000 | |||||||||
| Unifrax, Senior Secured USD Term Loan (First Lien), 6.55% (Libor + 3.75%), maturity 12/12/25(i) | 2,000,000 | 1,990,000 | 1,992,500 | |||||||||
| Borchers, Senior Secured Term Loan, 7.30% (Libor + 4.50%), maturity 11/1/24 | 1,969,937 | 1,964,072 | 1,960,088 | |||||||||
| Zep, Senior Secured Initial Term Loan (First Lien), 6.80% (Libor + 4.00%), maturity 8/12/24 | 1,976,237 | 1,973,888 | 1,946,594 | |||||||||
| DuBois, Senior Secured Term Loan (First Lien), 6.05% (Libor + 3.25%), maturity 3/15/24(i) | 1,488,898 | 1,490,117 | 1,492,620 | |||||||||
| DuBois, Senior Secured Term Loan (Second Lien), 10.80% (Libor + 8.00%), maturity 3/15/25 | 1,500,000 | 1,485,490 | 1,483,125 | |||||||||
| Houghton International, Senior Secured Term Loan (Second Lien), 11.30% (Libor + 8.50%), maturity 12/21/20 | 1,000,000 | 1,000,000 | 995,000 | |||||||||
| Invictus, Senior Secured Initial Term Loan (First Lien), 5.80% (Libor + 3.00%), maturity 3/28/25(i) | 997,487 | 1,004,912 | 983,549 | |||||||||
| Prince Minerals, Senior Secured Initial Term Loan (First Lien), 6.30% (Libor + 3.50%), maturity 3/31/25 | 992,500 | 987,925 | 980,094 | |||||||||
| Vantage Specialty Chemicals, Senior Secured Closing Date Term Loan (First Lien), 6.30% (Libor + 3.50%), maturity 10/28/24(i) | 997,481 | 977,531 | 977,531 | |||||||||
| Boyd Corp, Senior Secured Initial Term Loan (First Lien), 6.30% (Libor + 3.50%), maturity 9/6/25(i) | 997,500 | 980,044 | 962,588 | |||||||||
| Services: Consumer | ||||||||||||
| A Place For Mom, Senior Secured Term Loan, 6.55% (Libor + 3.75%), maturity 8/10/24(i) | 2,693,419 | 2,692,552 | 2,693,419 | |||||||||
| Smart Start, Senior Secured Initial Term Loan (First Lien), 7.30% (Libor + 4.50%), maturity 2/21/22(i) | 2,442,485 | 2,442,485 | 2,436,379 | |||||||||
| Cambium Learning, Senior Secured Initial Term Loan (First Lien), 7.30% (Libor + 4.50%), maturity 12/18/25(i) | 2,500,000 | 2,375,000 | 2,375,000 | |||||||||
| CIBT Holdings, Senior Secured Initial Term Loan (First Lien), 6.55% (Libor + 3.75%), maturity 6/3/24 | 1,979,900 | 1,995,160 | 1,960,101 | |||||||||
| SMG, Senior Secured Initial Term Loan (First Lien), 5.80% (Libor + 3.00%), maturity 1/23/25(i) | 1,496,231 | 1,489,971 | 1,499,972 | |||||||||
| Weld North, Senior Secured Initial Term Loan, 7.05% (Libor + 4.25%), maturity 2/15/25 | 1,488,750 | 1,475,327 | 1,485,028 | |||||||||
| Valet Living, Senior Secured Initial Term Loan, 6.80% (Libor + 4.00%), maturity 9/28/25(i) | 997,500 | 995,073 | 1,004,981 | |||||||||
| Mister Car Wash, Senior Secured Term Loan, 6.05% (Libor + 3.25%), maturity 8/20/21(i) | 994,801 | 1,001,543 | 994,801 | |||||||||
| Spring Education, Senior Secured Initial Term Loan (First Lien), 7.05% (Libor + 4.25%), maturity 7/30/25 | 997,500 | 995,113 | 992,513 | |||||||||
| LegalShield, Senior Secured Initial Term Loan (First Lien), 5.80% (Libor + 3.00%), maturity 5/1/25(i) | 500,000 | 500,000 | 500,000 | |||||||||
| Banking, Finance, Insurance & Real Estate | ||||||||||||
| Integro Insurance Brokers, Senior Secured Initial Term Loan (First Lien), 8.55% (Libor + 5.75%), maturity 10/31/22 | 2,910,854 | 2,838,756 | 2,881,746 | |||||||||
| Inst. Shareholder Services, Senior Secured Initial Term Loan (First Lien), 6.55% (Libor + 3.75%), maturity 10/16/24(i) | 2,475,521 | 2,470,128 | 2,469,332 | |||||||||
| American Beacon Advisors, Senior Secured Tranche C Term Loan (Second Lien), 10.30% (Libor + 7.50%), maturity 4/30/23 | 2,000,000 | 2,000,000 | 2,000,000 | |||||||||
| AmeriLife Group, Senior Secured Initial Term Loan (First Lien), 7.55% (Libor + 4.75%), maturity 7/10/22 | 1,892,041 | 1,876,407 | 1,882,581 | |||||||||
| EPIC Insurance, Senior Secured Initial Term Loan (First Lien), 7.05% (Libor + 4.25%), maturity 9/6/24 | 1,485,000 | 1,481,748 | 1,477,575 | |||||||||
| Aperio, Senior Secured Loan, 7.80% (Libor + 5.00%), maturity 10/25/24(i) | 1,000,000 | 995,000 | 995,000 | |||||||||
| Integrity Marketing Group, Senior Secured Term Loan, 7.05% (Libor + 4.25%), maturity 11/28/25(i) | 421,260 | 418,774 | 419,154 | |||||||||
| Transportation: Cargo | ||||||||||||
| Odyssey Logistics & Technology , Senior Secured New Term Loan (First Lien), 6.80% (Libor + 4.00%), maturity 10/12/24(i) | 3,967,544 | 3,962,584 | 3,947,706 | |||||||||
| Transplace, Senior Secured Closing Date Term Loan (First Lien), 6.55% (Libor + 3.75%), maturity 10/7/24(i) | 2,982,487 | 2,972,987 | 2,967,575 | |||||||||
| Capstone Logistics, Senior Secured Term Loan (First Lien), 7.30% (Libor + 4.50%), maturity 10/7/21 | 1,237,631 | 1,237,865 | 1,228,348 | |||||||||
| GlobalTranz, Senior Secured Term Loan (First Lien), 7.05% (Libor + 4.25%), maturity 6/29/25 | 997,500 | 996,510 | 990,019 | |||||||||
| Wholesale | ||||||||||||
| Carlisle FoodService, Senior Secured Initial Term Loan (First Lien), 5.80% (Libor + 3.00%), maturity 3/20/25 | 3,239,325 | 3,239,674 | 3,206,932 | |||||||||
| Ohio Transmission, Senior Secured Initial Term Loan, 7.05% (Libor + 4.25%), maturity 10/2/21 | 1,944,545 | 1,934,714 | 1,944,545 | |||||||||
| PetroChoice, Senior Secured Initial Term Loan (First Lien), 7.80% (Libor + 5.00%), maturity 8/19/22 | 1,935,184 | 1,906,108 | 1,915,833 | |||||||||
| ABB Optical, Senior Secured Initial Term Loan (First Lien), 7.80% (Libor + 5.00%), maturity 6/15/23 | 1,469,943 | 1,465,859 | 1,451,569 | |||||||||
| Consumer Goods: Non-durable | ||||||||||||
| Manna Pro, Senior Secured Term Loan, 8.80% (Libor + 6.00%), maturity 12/8/23(i) | 3,243,333 | 3,197,312 | 3,194,683 | |||||||||
| Badger Sportswear, Senior Secured Initial Term Loan (First Lien), 7.30% (Libor + 4.50%), maturity 9/11/23 | 1,954,707 | 1,940,509 | 1,944,933 | |||||||||
| Augusta Sportswear Group, Senior Secured Initial Term Loan, 7.30% (Libor + 4.50%), maturity 10/26/23 | 1,812,658 | 1,798,262 | 1,790,000 | |||||||||
| Varsity Brands, Senior Secured Initial Term Loan (First Lien), 6.30% (Libor + 3.50%), maturity 12/16/24(i) | 997,484 | 1,004,750 | 985,015 | |||||||||
| Capital Equipment | ||||||||||||
| MW Industries, Senior Secured 2018 New Term Loan (First Lien), 6.30% (Libor + 3.50%), maturity 9/30/24(i) | 2,468,750 | 2,468,750 | 2,414,900 | |||||||||
| Edward Don, Senior Secured Initial Term Loan, 7.05% (Libor + 4.25%), maturity 7/2/25 | 1,995,000 | 1,985,498 | 1,975,050 | |||||||||
| BAS, Senior Secured Repricing Term Loan, 6.55% (Libor + 3.75%), maturity 5/21/24(i) | 1,488,680 | 1,489,497 | 1,494,262 | |||||||||
| Excelitas, Senior Secured Initial USD Term Loan (First Lien), 6.30% (Libor + 3.50%), maturity 12/2/24(i) | 498,741 | 503,059 | 501,234 | |||||||||
| TriMark, Senior Secured Initial Term Loan (First Lien), 6.30% (Libor + 3.50%), maturity 8/28/24(i) | 496,232 | 497,969 | 456,857 | |||||||||
| United Flexible, Senior Secured Term Loan, 7.55% (Libor + 4.75%), maturity 2/16/21 | 414,596 | 412,054 | 414,596 | |||||||||
| Construction & Building | ||||||||||||
| PlayPower, Senior Secured Initial Term Loan (First Lien), 7.55% (Libor + 4.75%), maturity 6/23/21 | 1,949,495 | 1,938,816 | 1,949,495 | |||||||||
| PlayPower, Senior Secured Initial Term Loan (Second Lien), 11.55% (Libor + 8.75%), maturity 6/23/22 | 1,000,000 | 994,051 | 1,000,000 | |||||||||
| CHI Overhead Doors, Senior Secured Initial Term Loan (First Lien), 6.05% (Libor + 3.25%), maturity 7/29/22(i) | 1,496,145 | 1,480,497 | 1,501,755 | |||||||||
| DiversiTech Corporation, Senior Secured Tranche B-1 Term Loan (First Lien), 5.80% (Libor + 3.00%), maturity 6/3/24 | 989,953 | 989,953 | 982,529 | |||||||||
| PlayCore, Senior Secured Initial Term Loan (First Lien), 6.55% (Libor + 3.75%), maturity 9/30/24 | 986,906 | 984,757 | 977,037 | |||||||||
| Automotive | ||||||||||||
| Mavis, Senior Secured Closing Date Term Loan (First Lien), 6.05% (Libor + 3.25%), maturity 3/20/25 | 3,504,018 | 3,488,084 | 3,468,978 | |||||||||
| Truck Hero, Senior Secured Initial Term Loan (Second Lien), 11.05% (Libor + 8.25%), maturity 4/21/25 | 1,800,000 | 1,798,295 | 1,782,000 | |||||||||
| Safe Fleet, Senior Secured Tranche B-1 Term Loan (First Lien), 6.55% (Libor + 3.75%), maturity 2/3/25(i) | 997,500 | 970,069 | 970,069 | |||||||||
The accompanying notes are an integral part of these financial statements.
| 84 |
Audax Credit BDC Inc.
Schedules of Investments (Continued)
As of December 31, 2018
(Expressed in U.S. Dollars)
| Portfolio Investments (a) (b) (c) (d) (e) (f) | Par | Cost | Value | |||||||||
| NON-CONTROL/NON-AFFILIATE INVESTMENTS(h) (Continued): | ||||||||||||
| Aerospace & Defense | ||||||||||||
| StandardAero, Senior Secured Initial Term Loan, 6.55% (Libor + 3.75%), maturity 7/7/22(i) | $ | 2,971,912 | $ | 2,987,349 | $ | 2,971,912 | ||||||
| Consolidated Precision Products, Senior Secured Initial Term Loan (Second Lien), 10.55% (Libor + 7.75%), maturity 4/30/26(i) | 1,500,000 | 1,516,576 | 1,503,750 | |||||||||
| Tronair, Senior Secured Initial Term Loan (First Lien), 7.55% (Libor + 4.75%), maturity 9/8/23 | 1,471,187 | 1,463,261 | 1,434,407 | |||||||||
| Beverage, Food & Tobacco | ||||||||||||
| Sovos Brands, Senior Secured Initial Term Loan (2018), 7.80% (Libor + 5.00%), maturity 11/20/25(i) | 2,000,000 | 1,980,206 | 1,980,000 | |||||||||
| Kettle Cuisine, Senior Secured Initial Term Loan (First Lien) , 6.55% (Libor + 3.75%), maturity 8/25/25 | 1,995,000 | 1,985,383 | 1,972,556 | |||||||||
| Lipari, Senior Secured Term Loan A, 7.30% (Libor + 4.50%), maturity 10/1/22(i) | 1,957,180 | 1,949,755 | 1,957,180 | |||||||||
| Containers, Packaging & Glass | ||||||||||||
| ProAmpac, Senior Secured Initial Term Loan (First Lien), 6.30% (Libor + 3.50%), maturity 11/20/23(i) | 3,461,013 | 3,484,861 | 3,383,140 | |||||||||
| Pregis Corporation, Senior Secured Term Loan (First Lien), 6.30% (Libor + 3.50%), maturity 5/20/21(i) | 1,732,054 | 1,738,637 | 1,712,135 | |||||||||
| Alpha Packaging, Senior Secured Tranche B-1 Term Loan, 7.05% (Libor + 4.25%), maturity 5/12/20 | 493,837 | 492,994 | 491,368 | |||||||||
| Media: Advertising, Printing & Publishing | ||||||||||||
| Ansira, Senior Secured Initial Term Loan, 8.55% (Libor + 5.75%), maturity 12/20/22(i) | 1,877,875 | 1,863,012 | 1,882,570 | |||||||||
| Northstar, Senior Secured Term Loan, 9.05% (Libor + 6.25%), maturity 6/7/22 | 1,534,360 | 1,534,360 | 1,515,180 | |||||||||
| Imagine! Print Solutions, Senior Secured Term B-1 Loan (First Lien), 7.55% (Libor + 4.75%), maturity 6/21/22(i) | 1,473,750 | 1,463,068 | 1,429,537 | |||||||||
| Vestcom International, Senior Secured L/C Collaterilized, 6.80% (Libor + 4.00%), maturity 12/19/23 | 796,874 | 800,335 | 787,909 | |||||||||
| Hotel, Gaming & Leisure | ||||||||||||
| On Location, Senior Secured Second Amendment Term Loan, 8.30% (Libor + 5.50%), maturity 9/29/21 | 1,949,969 | 1,931,313 | 1,920,719 | |||||||||
| Auto Europe, Senior Secured Initial Dollar Term Loan, 7.80% (Libor + 5.00%), maturity 10/21/23 | 1,286,538 | 1,275,932 | 1,283,322 | |||||||||
| Forest Products & Paper | ||||||||||||
| Hoffmaster Group, Senior Secured Tranche B-1 Term Loan (First Lien), 6.80% (Libor + 4.00%), maturity 11/21/23(i) | 2,957,455 | 2,942,751 | 2,947,992 | |||||||||
| Retail | ||||||||||||
| Grocery Outlet, Senior Secured Initial Term Loan (First Lien), 6.55% (Libor + 3.75%), maturity 10/22/25(i) | 2,000,000 | 1,995,111 | 2,002,500 | |||||||||
| Albertson's, Senior Secured 2018 Term B-7 Loan, 5.80% (Libor + 3.00%), maturity 11/17/25(i) | 500,000 | 496,293 | 491,250 | |||||||||
| Consumer Goods: Durable | ||||||||||||
| Strategic Partners, Senior Secured Initial Term Loan, 6.55% (Libor + 3.75%), maturity 6/30/23(i) | 2,332,933 | 2,328,833 | 2,344,598 | |||||||||
| Total Portfolio Investments(k) | $ | 266,280,299 | $ | 264,662,881 | ||||||||
| (a) | All companies are located in the United States of America, unless otherwise noted. |
| (b) | Interest rate percentages represent actual interest rates which are indexed from then 30-day London Interbank Offered Rate ("LIBOR") unless otherwise noted. LIBOR rates are subject to interest rate floors which can vary based on the contractual agreement with the borrower. Due dates represent the contractual maturity date. |
| (c) | All loans are income-producing, unless otherwise noted. |
| (d) | All investments are qualifying assets under Section 55(a) of the Investment Company Act of 1940, as amended (the "1940 Act") unless otherwise noted. |
| (e) | All loans are restricted, unless otherwise noted. |
| (f) | Unless indicated otherwise, all of our investments are valued using Level 3 inputs within the FASB Accounting Standard Codification (“ASC”) Topic 820, “Fair Value Measurements and Disclosures” (“ASC 820”) fair value hierarchy. Refer to Note 3 – Investments in the accompanying Notes to Financial Statements for additional information. |
| (g) | Percentages are calculated using fair value of investments over net assets. |
| (h) | As defined in 1940 Act, the Company is not deemed to be an “Affiliated Person” of or “Control” this portfolio company because it neither owns 5% or more of the portfolio company’s outstanding voting securities nor has the power to exercise control over the management or policies of such portfolio company (including through a management agreement). |
| (i) | Investment was valued using Level 2 inputs within the ASC 820 fair value hierarchy. Refer to Note 3 – Investments in the accompanying Notes to Financial Statements for additional information. |
| (j) | The borrower for Livingston, Livingston International Inc., is located in Canada. |
| (k) | At December 31, 2018, the cost of investments for income tax purposes was $266,280,299 the gross unrealized depreciation for federal tax purposes was $2,140,935, the gross unrealized appreciation for federal income tax purposes was $523,517, and the net unrealized depreciation was $1,617,418. |
The accompanying notes are an integral part of these financial statements.
| 85 |
Audax
Credit BDC Inc.
Notes to Financial Statements
December 31, 2019
(Expressed in U.S. Dollars)
Note 1. Organization
Audax Credit BDC Inc. (the “Company”) is a Delaware corporation that was formed on January 29, 2015. The Company is an externally managed, closed-end, non-diversified management investment company that has elected to be treated as a business development company (“BDC”) under the Investment Company Act of 1940, as amended (the “1940 Act”). In addition, effective with the Company’s taxable year ended December 31, 2015, the Company has elected to be treated for federal income tax purposes as a regulated investment company (“RIC”) under Subchapter M of the U.S. Internal Revenue Code of 1986, as amended (the “Code”).
The Company commenced business operations on July 8, 2015, the date on which the Company made its first investment. The Company has been formed for the purpose of investing primarily in the debt of leveraged, non-investment grade middle market companies, with the principal objective of generating income and capital appreciation. The Company’s investment strategy is to invest primarily in first lien senior secured loans and selectively in second lien loans to middle market companies. During the period prior to July 8, 2015, the Company was a development stage company, as defined in Paragraph 915-10-05, Development Stage Entity, of the Financial Accounting Standards Board’s (“FASB’s”) Accounting Standards Codification, as amended (“ASC”). During this time, the Company was devoting substantially all of its efforts to establishing its business and its planned principal operations had not commenced. All losses incurred during the period prior to July 8, 2015 have been considered a part of the Company’s development stage activities.
Audax Management Company (NY), LLC (the “Adviser”) is the investment adviser of the Company. The Adviser is registered as an investment adviser with the U.S. Securities and Exchange Commission (the “SEC”) under the Investment Advisers Act of 1940, as amended.
Note 2. Significant Accounting Policies
Basis of Presentation
As an investment company, the accompanying financial statements of the Company are prepared in accordance with the investment company accounting and reporting guidance of ASC Topic 946, “Financial Services – Investment Companies,” as amended, which incorporates the requirements for reporting on Form 10-K and Article 6 of Regulation S-X under the Securities Exchange Act of 1934, as amended, as well as accounting principles generally accepted in the United States of America (“GAAP”). The accompanying financial statements and related notes present the results of activity of the Company for the years ended December 31, 2019, 2018, and 2017.
Use of Estimates
The preparation of financial statements in conformity with GAAP requires management of the Company to make estimates and assumptions that may affect the reported amounts and disclosures in the financial statements. Changes in the economic environment, financial markets and any other parameters used in determining these estimates could cause actual results to differ and these differences could be material.
Cash and Cash Equivalents
Cash and cash equivalents are stated at fair value. The Company considers all highly liquid investments purchased with maturities of three months or less and money market mutual funds to be cash equivalents. No cash equivalent balances were held at December 31, 2019 and 2018. The cash was not subject to any restrictions on withdrawal.
| 86 |
Expenses
The Company is responsible for investment expenses, legal expenses, auditing fees and other expenses related to the Company’s operations. Such fees and expenses, including expenses initially incurred by the Adviser, may be reimbursed by the Company.
Investment Valuation Policy
The Company conducts the valuation of the Company’s investments, pursuant to which the Company’s net asset value is determined, at all times consistent with GAAP and the 1940 Act. The Company’s Board of Directors, with the assistance of the Audit Committee, determines the fair value of the Company’s investments, for investments with a public market and for investments with no readily available public market, on at least a quarterly basis, in accordance with the terms of ASC Topic 820, “Fair Value Measurement and Disclosures,” (“ASC 820”). The Company’s valuation procedures are set forth in more detail below.
ASC 820 defines fair value as “the price that would be received to sell an asset or paid to transfer a liability in an orderly transaction between market participants at the measurement date.” Fair value is a market-based measurement, not an entity-specific measurement. For some assets and liabilities, observable market transactions or market information might be available. For other assets and liabilities, observable market transactions and market information might not be available. However, the objective of a fair value measurement in both cases is the same – to estimate the price when an orderly transaction to sell the asset or transfer the liability would take place between market participants at the measurement date under current market conditions (that is, an exit price at the measurement date from the perspective of a market participant that holds the asset or owes the liability).
ASC 820 establishes a hierarchal disclosure framework which ranks the observability of inputs used in measuring financial instruments at fair value. The observability of inputs is impacted by a number of factors, including the type of financial instruments and their specific characteristics. Financial instruments with readily available quoted prices, or for which fair value can be measured from quoted prices in active markets, generally will have a higher degree of market price observability and a lesser degree of judgment applied in determining fair value.
The three-level hierarchy for fair value measurement is defined as follows:
| Level 1 — | Inputs to the valuation methodology are quoted prices available in active markets for identical financial instruments as of the measurement date. The types of financial instruments in this category include unrestricted securities, including equities and derivatives, listed in active markets. The Company does not adjust the quoted price for these instruments, even in situations where the Company holds a large position, and a sale could reasonably be expected to impact the quoted price. |
| Level 2 — | Inputs to the valuation methodology are quoted prices in markets that are not active or for which all significant inputs are either directly or indirectly observable as of the measurement date. The types of financial instruments in this category include less liquid and restricted securities listed in active markets, securities traded in markets that are not active, government and agency securities, and certain over-the-counter derivatives where the fair value is based on observable inputs. |
| Level 3 — | Inputs to the valuation methodology are unobservable and significant to the overall fair value measurement, and include situations where there is little, if any, market activity for the investment. The inputs into the determination of fair value require significant management judgment or estimation. The types of financial instruments in this category include investments in privately held entities, non-investment grade residual interests in securitizations, collateralized loan obligations, and certain over-the-counter derivatives where the fair value is based on unobservable inputs. |
In certain cases, the inputs used to measure fair value may fall into different levels of the fair value hierarchy. In such cases, the determination of which category within the fair value hierarchy is appropriate for any given financial instrument is based on the lowest level of input that is significant to the fair value measurement. Assessment of the significance of a particular input to the fair value measurement in its entirety requires judgment and considers factors specific to the financial instrument.
| 87 |
Pursuant to the framework set forth above, the Company values securities traded in active markets on the measurement date by multiplying the exchange closing price of such traded securities/instruments by the quantity of shares or amount of the instrument held. The Company may also obtain quotes with respect to certain of its investments from pricing services, brokers or dealers’ quotes, or counterparty marks in order to value liquid assets that are not traded in active markets.
Pricing services aggregate, evaluate and report pricing from a variety of sources including observed trades of identical or similar securities, broker or dealer quotes, model-based valuations and internal fundamental analysis and research. When doing so, the Company determines whether the quote obtained is sufficient in accordance with GAAP to determine the fair value of the security. If determined adequate, the Company uses the quote obtained.
Securities that are illiquid or for which the pricing source does not provide a valuation or methodology or provides a valuation or methodology that, in the judgment of the Company’s Board of Directors, does not represent fair value, are each valued as of the measurement date using all techniques appropriate under the circumstances and for which sufficient data are available. These valuation techniques vary by investment but include comparable public market valuations, comparable precedent transaction valuations and discounted cash flow analyses. The process used to determine the applicable value is as follows: (i) each portfolio company or investment is initially valued by the investment professionals of the Adviser responsible for the portfolio investment using a standardized template designed to approximate fair market value based on observable market inputs and updated credit statistics and unobservable inputs; (ii) preliminary valuation conclusions are documented and discussed with the Company’s senior management and members of the Company’s Adviser’s valuation team; (iii) the Company’s Audit Committee reviews the assessments of the Adviser and provides the Company’s Board of Directors with recommendations with respect to the fair value of the investments in the Company’s portfolio; and (iv) the Company’s Board of Directors discusses the valuation recommendations of the Company’s Audit Committee and determines the fair value of the investments in the Company’s portfolio in good faith based on the input of the Adviser and in accordance with the Company’s valuation policy.
The Company’s Audit Committee’s recommendation of fair value is generally based on its assessment of the following factors, as relevant:
| · | the nature and realizable value of any collateral; |
| · | call features, put features and other relevant terms of debt; |
| · | the portfolio company’s ability to make payments; |
| · | the portfolio company’s actual and expected earnings and discounted cash flow; |
| · | prevailing interest rates for like securities and expected volatility in future interest rates; |
| · | the markets in which the portfolio company does business and recent economic and/or market events; and |
| · | comparisons to publicly traded securities. |
Investment performance data utilized are the most recently available as of the measurement date, which in many cases may reflect up to a one quarter lag in information.
| 88 |
Securities for which market quotations are not readily available or for which a pricing source is not sufficient may include the following:
| · | private placements and restricted securities that do not have an active trading market; |
| · | securities whose trading has been suspended or for which market quotes are no longer available; |
| · | debt securities that have recently gone into default and for which there is no current market; |
| · | securities whose prices are stale; and |
| · | securities affected by significant events. |
The Company’s Board of Directors is responsible for the determination, in good faith, of the fair value of the Company’s portfolio investments.
Determination of fair value involves subjective judgments and estimates. Accordingly, these notes to the Company’s financial statements express the uncertainty with respect to the possible effect of such valuations, and any change in such valuations, on the Company’s financial statements.
Security transactions are recorded on the trade date (the date the order to buy or sell is executed or, in the case of privately issued securities, the closing date, which is when all terms of the transactions have been defined).
Realized gains and losses on investments are determined based on the identified cost method.
Refer to Note 3 — Investments for additional information regarding fair value measurements and the Company’s application of ASC 820.
Interest Income Recognition
Interest income, adjusted for amortization of premium, acquisition costs, and amendment fees and the accretion of original issue discount (“OID”), are recorded on an accrual basis to the extent that such amounts are expected to be collected. Generally, when a loan becomes 120 days or more past due, or if the Company’s qualitative assessment indicates that the debtor is unable to service its debt or other obligations, the Company will place the loan on non-accrual status and cease recognizing interest income on that loan for financial reporting purposes until the borrower has demonstrated the ability and intent to pay contractual amounts due. However, the Company will remain contractually entitled to this interest. Interest payments received on non-accrual loans are restored to accrual status when past due principal and interest are paid and, in management’s judgment, are likely to remain current or, due to a restructuring, the interest income is deemed to be collectible.
The Company currently holds loans in the portfolio that contain OID and expects to hold loans in the future that contain payment-in-kind (“PIK”) provisions. The Company recognizes OID for loans originally issued at a discount and recognizes the income over the life of the obligation based on an effective yield calculation. PIK interest, computed at the contractual rate specified in a loan agreement, is added to the principal balance of a loan and recorded as income over the life of the obligation. Therefore, the actual collection of PIK income may be deferred until the time of debt principal repayment. To maintain the ability to be taxed as a RIC, the Company may need to pay out of both OID and PIK non-cash income amounts in the form of distributions, even though the Company has not yet collected the cash on either.
As of December 31, 2019, the Company held 162 investments in loans with OID. The Company accrued OID income of $245,353 for the year ended December 31, 2019. The unamortized balance of OID investments as of December 31, 2019, totaled $1,733,632. As of December 31, 2018, the Company held 130 investments in loans with OID. The Company accrued OID income of $138,588 for the year ended December 31, 2018. The unamortized balance of OID investments as of December 31, 2018, totaled $1,038,045.
| 89 |
As of December 31, 2019, the Company held two investments had a PIK interest component. The Company did not hold any investments with a PIK interest component as of December 31, 2018. During the year ended December 31, 2019, the Company accrued PIK income in the amount of $91,960. The Company did not accrue PIK income during the years ended December 31, 2018 and 2017.
As of December 31, 2019 and 2018, the Company held $5,506,217 and $17,715,145 cash and cash equivalents, respectively. For the years ended December 31, 2019, 2018, and 2017, the Company earned $145,127, $141,063, and $110,905, respectively, of interest income related to cash, which is included in other interest income within the accompanying statement of operations.
Other Income Recognition
The Company generally records prepayment fees upon receipt of cash or as soon as the Company becomes aware of the prepayment.
Dividend income on equity investments is accrued to the extent that such amounts are expected to be collected and if the Company has the option to collect such amounts in cash.
Prepayment fees and dividend income are both accrued in other income in the accompanying statements of operations.
The Company accrued $71,864 of other income for the year ended December 31, 2019 related to amendment fees. The Company accrued $92,059 of other income for the year ended December 31, 2018 related to amendment fees. The Company accrued $117,413 of other income for the year ended December 31, 2017 related to amendment fees.
New Accounting Pronouncements
In August 2018, the FASB issued Accounting Standards Update 2018-13, Fair Value Measurement (Topic 820) - Disclosure Framework - Changes to the Disclosure Requirements for Fair Value Measurement ("ASU 2018-13") which introduces new fair value disclosure requirements as well as eliminates and modifies certain existing fair value disclosure requirements. ASU 2018-13 would be effective for fiscal years beginning after December 15, 2019, and interim periods within those fiscal years; however, management has elected to early adopt ASU 2018-13 effective with the current reporting period.
Note 3. Investments
Fair Value
In accordance with ASC 820, the Company’s investments’ fair value is determined to be the price that would be received for an investment in a current sale, assuming an orderly transaction between willing market participants on the measurement date. This fair value definition focuses on exit price in the principal, or most advantageous, market and prioritizes, within a measurement of fair value, the use of market-based inputs over entity-specific inputs. ASC 820 also establishes the three-level hierarchy for fair value measurements based upon the transparency of inputs to the valuation of a financial instrument as of the measurement date as described in Note–2 – Significant Accounting Policies.
As of December 31, 2019, $249,452,590 of the Company’s investments were valued using unobservable inputs, and $81,422,321 were valued using observable inputs. During the year ended December 31, 2019, $61,204,686 transferred into Level 3 due to a decrease in observable prices in the market and $14,565,516 out of Level 3 due to price transparency.
As of December 31, 2018, $142,020,074 of the Company’s investments were valued using unobservable inputs, and $122,642,807 were valued using observable inputs. During the year ended December 31, 2018, $32,513,543 transferred into Level 3 due to a decrease in observable prices in the market and $9,008,246 of out of Level 3 due to price transparency.
| 90 |
The following table presents the Company’s investments carried at fair value as of December 31, 2019 and 2018, by caption on the Company’s accompanying statements of assets and liabilities and by security type.
| Assets at Fair Value as of December 31, 2019 | ||||||||||||||||
| Level 1 | Level 2 | Level 3 | Total | |||||||||||||
| First lien debt | $ | - | $ | 81,422,321 | $ | 227,392,535 | $ | 308,814,856 | ||||||||
| Second lien debt | - | - | 21,340,798 | 21,340,798 | ||||||||||||
| Equity and Preferred Shares | - | - | 719,257 | 719,257 | ||||||||||||
| Total | $ | - | $ | 81,422,321 | $ | 249,452,590 | $ | 330,874,911 | ||||||||
| Assets at Fair Value as of December 31, 2018 | ||||||||||||||||
| Level 1 | Level 2 | Level 3 | Total | |||||||||||||
| First lien debt | $ | - | $ | 118,541,537 | $ | 124,975,467 | $ | 243,517,004 | ||||||||
| Second lien debt | 4,101,270 | 17,044,607 | 21,145,877 | |||||||||||||
| Total | $ | - | $ | 122,642,807 | $ | 142,020,074 | $ | 264,662,881 | ||||||||
In accordance with ASC 820, the following table provides quantitative information about the Level 3 fair value measurements of the Company’s investments as of December 31, 2019. The weighted average calculations in the table below are based on the fair value balances for all debt related calculations for the particular input.
| As of December 31, 2019 | ||||||||||||||
| Fair | Valuation | Unobservable | Weighted | |||||||||||
| Value | Technique | Inputs (1) | Range (2) | Average (3) | ||||||||||
| First lien debt | $ | 224,772,281 | Matrix Pricing | Senior Leverage | 2.33x - 7.55x | 4.89 | x | |||||||
| Total Leverage | 3.10x - 9.79x | 6.07 | x | |||||||||||
| Interest Coverage | 1.14x - 4.80x | 2.10 | x | |||||||||||
| Debt Service Coverage | 0.93x - 3.68x | 1.76 | x | |||||||||||
| TEV Coverage | 1.27x - 5.70x | 2.42 | x | |||||||||||
| Liquidity | 5.75% - 587.90% | 141.43 | % | |||||||||||
| Spread Comparison | 275bps - 650bps | 435 | bps | |||||||||||
| Second lien debt | 20,071,929 | Matrix Pricing | Senior Leverage | 4.60x - 7.06x | 5.87 | x | ||||||||
| Total Leverage | 4.60x - 7.06x | 5.88 | x | |||||||||||
| Interest Coverage | 1.54x - 3.21x | 2.17 | x | |||||||||||
| Debt Service Coverage | 1.38x - 2.86x | 1.89 | x | |||||||||||
| TEV Coverage | 1.52x - 2.44x | 1.98 | x | |||||||||||
| Liquidity | 52.00% - 347.60% | 149.91 | % | |||||||||||
| Spread Comparison | 675bps - 1025bps | 764 | bps | |||||||||||
| Total | $ | 244,844,210 | ||||||||||||
| (1) | For any portfolio company, the unobservable input "Liquidity" is a fraction, expressed as a percentage, the numerator of which is the sum of the company's undrawn revolving credit facility capacity plus cash, and the denominator of which is the total amount that may be borrowed under the company's revolving credit facility. The unobservable input "Spread Comparison" is a comparison of the spread over LIBOR for each investment to the spread over LIBOR for general leveraged loan transactions. |
| (2) | Each range represents the variance of outputs from calculating each statistic for each portfolio company within a specific credit seniority. The range may be a single data point when there is only one company represented in a specific credit seniority. |
| (3) | Inputs are weighted based on the fair value of the investments included in the range. |
| 91 |
The table above does not include $4,608,380 of debt, equity and preferred shares which management values using other unobservable inputs, such as earnings before interest, taxes, depreciation and amortization (“EBITDA”) and EBITDA multiples, as well as other qualitative information, including company specific information.
In accordance with ASC 820, the following table provides quantitative information about the Level 3 fair value measurements of the Company’s investments as of December 31, 2018. The weighted average calculations in the table below are based on the fair value balances for all debt related calculations for the particular input.
| Fair | Valuation | Unobservable | Weighted | |||||||||||
| Value | Technique | Inputs (1) | Range (2) | Average (3) | ||||||||||
| First lien debt | $ | 120,756,091 | Matrix Pricing | Senior Leverage | 1.98x - 6.39x | 4.67 | x | |||||||
| Total Leverage | 2.48x - 8.79x | 5.97 | x | |||||||||||
| Interest Coverage | 1.21x - 4.33x | 2.12 | x | |||||||||||
| Debt Service Coverage | 1.04x - 2.82x | 1.73 | x | |||||||||||
| TEV Coverage | 1.31x - 4.84x | 2.45 | x | |||||||||||
| Liquidity | 8.64% - 608.88% | 142.62 | % | |||||||||||
| Spread Comparison | 275bps - 650bps | 427 | bps | |||||||||||
| 4,219,376 | Market Analysis | Senior Leverage | 5.05x - 8.14x | 6.88 | x | |||||||||
| Total Leverage | 5.76x - 10.80x | 8.74 | x | |||||||||||
| Interest Coverage | 0.95x - 2.17x | 1.45 | x | |||||||||||
| Debt Service Coverage | 0.87x - 1.78x | 1.24 | x | |||||||||||
| TEV Coverage | 1.11x - 2.04x | 1.49 | x | |||||||||||
| Liquidity | 63.01% - 89.50% | 78.70 | % | |||||||||||
| Spread Comparison | 500bps - 525bps | 510 | bps | |||||||||||
| Second lien debt | 17,044,607 | Matrix Pricing | Senior Leverage | 4.25x - 7.05x | 6.05 | x | ||||||||
| Total Leverage | 4.25x - 7.05x | 6.05 | x | |||||||||||
| Interest Coverage | 1.42x - 3.48x | 2.07 | x | |||||||||||
| Debt Service Coverage | 1.01x - 3.10x | 1.75 | x | |||||||||||
| TEV Coverage | 1.28x - 2.17x | 1.65 | x | |||||||||||
| Liquidity | 18.96% - 283.00% | 136.11 | % | |||||||||||
| Spread Comparison | 675bps - 1025bps | 783 | bps | |||||||||||
| Total | $ | 142,020,074 | ||||||||||||
| (1) | For any portfolio company, the unobservable input "Liquidity" is a fraction, expressed as a percentage, the numerator of which is the sum of the company's undrawn revolving credit facility capacity plus cash, and the denominator of which is the total amount that may be borrowed under the company's revolving credit facility. The unobservable input "Spread Comparison" is a comparison of the spread over LIBOR for each investment to the spread over LIBOR for general leveraged loan transactions. |
| (2) | Each range represents the variance of outputs from calculating each statistic for each portfolio company within a specific credit seniority. The range may be a single data point when there is only one company represented in a specific credit seniority. |
| (3) | Inputs are weighted based on the fair value of the investments included in the range. |
Fair value measurements can be sensitive to changes in one or more of the valuation inputs. Changes in market yields, discounts rates, leverage, or EBITDA multiples (or revenue or revenue multiples), each in isolation, may change the fair value of certain of the Company’s investments. Generally, an increase or decrease in market yields, discount rates or leverage or a decrease in EBITDA or EBITDA multiples (or revenue or revenue multiples) may result in a corresponding decrease or increase, respectively, in the fair value of certain of the Company’s investments.
The following tables provide the changes in fair value, broken out by security type, during the year ended December 31, 2019 and 2018 for all investments for which the Company determines fair value using unobservable (Level 3) factors.
| 92 |
| Year Ended December 31, 2019 | First lien debt | Second lien debt | Equity and Preferred Shares | Total | ||||||||||||
| Fair Value as of December 31, 2018 | $ | 124,975,467 | $ | 17,044,607 | $ | - | $ | 142,020,074 | ||||||||
| Transfers into Level 3 | 57,700,936 | 3,503,750 | - | 61,204,686 | ||||||||||||
| Transfers out of Level 3 | (14,565,516 | ) | - | - | (14,565,516 | ) | ||||||||||
| Total gains: | ||||||||||||||||
| Net realized (loss) gain(a) | (732,990 | ) | 18,297 | - | (714,693 | ) | ||||||||||
| Net unrealized (depreciation) appreciation(b) | (260,725 | ) | 119,029 | (401,324 | ) | (543,020 | ) | |||||||||
| New investments, repayments and settlements:(c) | ||||||||||||||||
| Purchases | 89,522,682 | 4,142,231 | 1,120,581 | 94,785,494 | ||||||||||||
| Settlements/repayments | (26,644,027 | ) | (3,500,000 | ) | - | (30,144,027 | ) | |||||||||
| Net amortization of premiums, PIK, discounts and fees | 303,448 | 12,884 | - | 316,332 | ||||||||||||
| Sales | (2,906,740 | ) | - | - | (2,906,740 | ) | ||||||||||
| Fair Value as of December 31, 2019 | $ | 227,392,535 | $ | 21,340,798 | $ | 719,257 | $ | 249,452,590 | ||||||||
(a) Included in net realized gain on the accompanying Statement of Operations for the year ended December 31, 2019.
(b) Included in net change in unrealized depreciation on the accompanying Statement of Operations for the year ended December 31, 2019.
(c) Includes increases in the cost basis of investments resulting from portfolio investments, the amortization of discounts, and PIK, as well as decreases in the costs basis of investments resulting from principal repayments or sales, the amortization of premiums and acquisition costs and other cost-basis adjustments.
| Year Ended December 31, 2018 | First lien debt | Second lien debt | Total | |||||||||
| Fair Value as of December 31, 2017 | $ | 64,377,922 | $ | 15,716,499 | $ | 80,094,421 | ||||||
| Transfers into Level 3 | 31,508,543 | 1,005,000 | 32,513,543 | |||||||||
| Transfers out of Level 3 | (9,008,246 | ) | - | (9,008,246 | ) | |||||||
| Total gains: | ||||||||||||
| Net realized gain(a) | 59,521 | 52,823 | 112,344 | |||||||||
| Net unrealized depreciation(b) | (1,111,659 | ) | (18,146 | ) | (1,129,805 | ) | ||||||
| New investments, repayments and settlements:(c) | ||||||||||||
| Purchases | 65,728,583 | 6,885,500 | 72,614,083 | |||||||||
| Settlements/repayments | (25,778,099 | ) | (6,606,429 | ) | (32,384,528 | ) | ||||||
| Net amortization of premiums, discounts and fees | 92,989 | 9,360 | 102,349 | |||||||||
| Sales | (894,087 | ) | - | (894,087 | ) | |||||||
| Fair Value as of December 31, 2018 | $ | 124,975,467 | $ | 17,044,607 | $ | 142,020,074 | ||||||
(a) Included in net realized gain on the accompanying Statement of Operations for the year ended December 31, 2018.
(b) Included in net change in unrealized depreciation on the accompanying Statement of Operations for the year ended December 31, 2018.
(c) Includes increases in the cost basis of investments resulting from portfolio investments, the amortization of discounts, and PIK, as well as decreases in the costs basis of investments resulting from principal repayments or sales, the amortization of premiums and acquisition costs and other cost-basis adjustments.
The change in unrealized value attributable to investments still held at December 31, 2019 and 2018 $(1,209,117) and $(1,294,378), respectively.
Transfers between levels of the fair value hierarchy are reported at the beginning of the reporting period in which they occur. For the years ended December 31, 2019 and 2018, transfers from Level 2 to Level 3 were primarily due to increased or decreased price transparency.
| 93 |
Investment Activities
The Company held a total of 176 syndicated investments with an aggregate fair value of $330,874,911 as of December 31, 2019. During the year ended December 31, 2019, the Company invested in 164 new syndicated investments for a combined $112,937,320 and in existing investments for a combined $21,529,819. The Company also received $58,594,377 in repayments from investments and $9,096,342 from investments sold during the period.
The Company held a total of 144 syndicated investments with an aggregate fair value of $264,662,881 as of December 31, 2018. During the year ended December 31, 2018, the Company invested in 89 new syndicated investments for a combined $146,482,757 and in existing investments for a combined $19,567,815. The Company also received $83,013,696 in repayments from investments and $1,520,433 from investments sold during the period.
Investment Concentrations
As of December 31, 2019, the Company’s investment portfolio consisted of investments in 164 companies located in 33 states across 22 different industries, with an aggregate fair value of $330,874,911. The five largest investments at fair value as of December 31, 2019 totaled $21,465,158, or 7.16% of the Company’s total investment portfolio as of such date. As of December 31, 2019, the Company’s average investment by obligor was $2,028,793 at cost.
As of December 31, 2018, the Company’s investment portfolio consisted of investments in 135 companies located in 34 states across 20 different industries, with an aggregate fair value of $264,662,881. The five largest investments at fair value as of December 31, 2018 totaled $19,719,053, or 7.45% of the Company’s total investment portfolio as of such date. As of December 31, 2018, the Company’s average investment by obligor was $1,927,447 at cost.
The following table outlines the Company’s investments by security type as of December 31, 2019 and 2018:
| December 31, 2019 | December 31, 2018 | |||||||||||||||||||||||||||||||
| Cost | Percentage of Total Investments |
Fair Value | Percentage of Total Investments |
Cost | Percentage of Total Investments |
Fair Value | Percentage of Total Investments |
|||||||||||||||||||||||||
| First lien debt | $ | 310,257,401 | 93.25 | % | $ | 308,814,856 | 93.33 | % | $ | 245,071,304 | 92.04 | % | $ | 243,517,004 | 92.01 | % | ||||||||||||||||
| Second lien debt | 21,344,024 | 6.41 | % | 21,340,798 | 6.46 | % | 21,208,995 | 7.96 | % | 21,145,877 | 7.99 | % | ||||||||||||||||||||
| Total Debt Investments | 331,601,425 | 99.66 | % | 330,155,654 | 99.79 | % | 266,280,299 | 100.00 | % | 264,662,881 | 100.00 | % | ||||||||||||||||||||
| Equity and Preferred Shares | 1,120,581 | 0.34 | % | 719,257 | 0.21 | % | - | 0.00 | % | - | 0.00 | % | ||||||||||||||||||||
| Total Equity Investments | 1,120,581 | 0.34 | % | 719,257 | 0.21 | % | - | 0.00 | % | - | 0.00 | % | ||||||||||||||||||||
| Total Investments | $ | 332,722,006 | 100.00 | % | $ | 330,874,911 | 100.00 | % | $ | 266,280,299 | 100.00 | % | $ | 264,662,881 | 100.00 | % | ||||||||||||||||
| 94 |
Investments at fair value consisted of the following industry classifications as of December 31, 2019 and 2018:
| December 31, 2019 | December 31, 2018 | |||||||||||||||
| Industry | Fair Value | Percentage of Total Investments | Fair Value | Percentage of Total Investments | ||||||||||||
| Healthcare & Pharmaceuticals | $ | 76,108,451 | 23.00 | % | $ | 47,520,070 | 17.95 | % | ||||||||
| High Tech Industries | 58,327,844 | 17.63 | 45,031,546 | 17.01 | ||||||||||||
| Services: Business | 44,376,771 | 13.41 | 36,858,954 | 13.93 | ||||||||||||
| Chemicals, Plastics & Rubber | 28,747,162 | 8.69 | 27,716,784 | 10.47 | ||||||||||||
| Services: Consumer | 25,757,966 | 7.78 | 15,942,194 | 6.02 | ||||||||||||
| Aerospace & Defense | 12,911,355 | 3.90 | 5,910,069 | 2.23 | ||||||||||||
| Banking, Finance, Insurance & Real Estate | 10,766,682 | 3.25 | 12,125,388 | 4.58 | ||||||||||||
| Consumer Goods: Non-durable | 8,472,022 | 2.56 | 7,914,631 | 2.99 | ||||||||||||
| Containers, Packaging & Glass | 7,941,602 | 2.40 | 5,586,643 | 2.11 | ||||||||||||
| Capital Equipment | 7,720,891 | 2.33 | 7,256,899 | 2.74 | ||||||||||||
| Wholesale | 7,219,568 | 2.18 | 8,518,879 | 3.22 | ||||||||||||
| Transportation: Cargo | 7,192,803 | 2.17 | 9,133,648 | 3.45 | ||||||||||||
| Construction & Building | 6,989,790 | 2.11 | 6,410,816 | 2.42 | ||||||||||||
| Automotive | 6,294,153 | 1.90 | 6,221,047 | 2.35 | ||||||||||||
| Media: Advertising, Printing & Publishing | 5,124,527 | 1.55 | 5,615,196 | 2.12 | ||||||||||||
| Forest Products & Paper | 4,379,293 | 1.32 | 2,947,992 | 1.12 | ||||||||||||
| Beverage, Food & Tobacco | 3,930,263 | 1.19 | 5,909,736 | 2.23 | ||||||||||||
| Hotel, Gaming & Leisure | 3,503,815 | 1.06 | 3,204,041 | 1.21 | ||||||||||||
| Consumer Goods: Durable | 2,309,428 | 0.70 | 2,344,598 | 0.90 | ||||||||||||
| Retail | 1,286,070 | 0.39 | 2,493,750 | 0.95 | ||||||||||||
| Metals & Mining | 987,604 | 0.31 | - | - | ||||||||||||
| Health Care Equipment & Services | 526,851 | 0.17 | - | - | ||||||||||||
| $ | 330,874,911 | 100.00 | % | $ | 264,662,881 | 100.00 | % | |||||||||
Investments at fair value were included in the following geographic regions of the United States as of December 31, 2019 and 2018:
| December 31, 2019 | December 31, 2018 | |||||||||||||||
| Geographic Region | Fair Value | Percentage of Total Investments | Fair Value | Percentage of Total Investments | ||||||||||||
| Northeast | $ | 87,146,010 | 26.34 | % | $ | 61,537,340 | 23.25 | % | ||||||||
| Midwest | 68,357,102 | 20.66 | 63,396,284 | 23.95 | ||||||||||||
| West | 52,320,288 | 15.81 | 40,497,635 | 15.30 | ||||||||||||
| Southwest | 42,469,487 | 12.84 | 27,587,594 | 10.42 | ||||||||||||
| Southeast | 35,674,150 | 10.78 | 36,204,672 | 13.68 | ||||||||||||
| East | 39,053,575 | 11.80 | 25,540,011 | 9.65 | ||||||||||||
| Northwest | 4,083,800 | 1.23 | 4,639,772 | 1.75 | ||||||||||||
| South | 1,770,499 | 0.54 | 3,193,759 | 1.21 | ||||||||||||
| Other (a) | - | - | 2,065,814 | 0.79 | ||||||||||||
| Total Investments | $ | 330,874,911 | 100.00 | % | $ | 264,662,881 | 100.00 | % | ||||||||
(a) The borrower for Livingston, Livingston International Inc., is located in Canada.
The geographic region indicates the location of the headquarters of the Company’s portfolio companies. A portfolio company may have a number of other business locations in other geographic regions.
| 95 |
Investment Principal Repayments
The following table summarizes the contractual principal repayments and maturity of the Company’s investment portfolio by fiscal year, assuming no voluntary prepayments, as of December 31, 2019:
| For the Fiscal Years Ending December 31: | Amount | |||
| 2020 | $ | 4,059,981 | ||
| 2021 | 12,187,413 | |||
| 2022 | 25,888,690 | |||
| 2023 | 44,906,817 | |||
| 2024 | 86,131,371 | |||
| Thereafter | 160,160,785 | |||
| Total contractual repayments | 333,335,057 | |||
| Adjustments to cost basis on debt investments(a) | (1,733,632 | ) | ||
| Total Cost Basis of Debt Investments Held at December 31, 2019: | $ | 331,601,425 | ||
(a) Adjustment to cost basis related to unamortized balance of OID investments.
Note 4. Related Party Transactions
Investment Advisory Agreement
The Company has entered into an investment advisory agreement (the “Investment Advisory Agreement”) with the Adviser. In accordance with the Investment Advisory Agreement, the Company pays the Adviser certain fees as compensation for its services, such fees consisting of a base management fee and an incentive fee (the “Incentive Fee”). The services the Adviser provides to the Company, subject to the overall supervision of the Company’s Board of Directors, include managing the day-to-day operations of, and providing investment services to, the Company. The Company also entered into a management fee waiver agreement with the Adviser (the “Waiver Agreement”), which the Company or the Adviser may terminate upon 60 days’ prior written notice.
Management Fee
The base management fee is calculated at an annual rate of 1.0% of the Company’s average gross assets including cash and any temporary investments in cash-equivalents, including U.S. government securities and other high-quality investment grade debt investments that mature in 12 months or less from the date of investment, payable quarterly in arrears on a calendar quarter basis.
Pursuant to the Waiver Agreement, the Adviser has agreed to waive the right to receive the base management fee to the extent necessary so that the base management fee payable under the Investment Advisory Agreement equals, and is calculated in the same manner as if, the base management fee otherwise payable by the Company were calculated at an annual rate equal to 0.65% (instead of an annual rate of 1.00%).
For the year ended December 31, 2019, the Company recorded base management fees $3,243,496 and waivers to the base management fees of $1,135,224, as set forth within the accompanying statements of operations. For the year ended December 31, 2018, the Company recorded base management fees $2,446,249 and waivers to the base management fees of $856,187, as set forth within the accompanying statements of operations. For the year ended December 31, 2017, the Company recorded base management fees $1,798,651 and waivers to the base management fees of $629,527, as set forth within the accompanying statements of operations.
| 96 |
Incentive Fee
The Incentive Fee has two parts, as follows: one is calculated and payable quarterly in arrears based on the Company’s pre-incentive fee net investment income for the immediately preceding calendar quarter. For this purpose, pre-incentive fee net investment income means interest income, dividend income and any other income (including any other fees (other than fees for providing managerial assistance), such as commitment, origination, structuring, diligence and consulting fees or other fees that the Company receives from portfolio companies) accrued during the calendar quarter, minus the Company’s operating expenses accrued for the quarter (including the base management fee, expenses payable under the Administration Agreement and any interest expense on any credit facilities or outstanding debt and dividends paid on any issued and outstanding preferred stock, but excluding the Incentive Fee).
The Company determines pre-incentive fee net investment income in accordance with GAAP, including, in the case of investments with a deferred interest feature, such as debt instruments with PIK interest, OID securities and accrued income that the Company has not yet received in cash. Pre-incentive fee net investment income does not include any realized capital gains, computed net of all realized capital losses or unrealized capital appreciation or depreciation. Pre-incentive fee net investment income, expressed as a rate of return on the value of the Company’s net assets at the end of the immediately preceding calendar quarter, is compared to a hurdle of 1.0% per quarter (4.0% annualized). The Company determines its average gross assets during each fiscal quarter and calculates the base management fee payable with respect to such amount at the end of each fiscal quarter. As a result, a portion of the Company’s net investment income is included in its gross assets for the period between the date on which such income is earned and the date on which such income is distributed. Therefore, the Company’s net investment income used to calculate part of the Incentive Fee is also included in the amount of the Company’s gross assets used to calculate the 1.0% annual base management fee. The Company pays its Adviser an Incentive Fee with respect to its pre-incentive fee net investment income in each calendar quarter as follows:
| · | no amount is paid on the income-portion of the Incentive Fee in any calendar quarter in which the Company’s pre-incentive fee net investment income does not exceed the hurdle of 1.0% (4.0% annualized); |
| · | 100% of the Company’s pre-incentive fee net investment income with respect to that portion of such pre-incentive fee net investment income, if any, that exceeds the hurdle rate but is less than 1.1765 % in any calendar quarter (4.706% annualized). The Company refers to this portion of its pre-incentive fee net investment income (which exceeds the hurdle rate but is less than 1.1765%) as the “catch-up” provision. The catch-up is meant to provide the Company’s Adviser with 15.0% of the pre-incentive fee net investment income as if a hurdle rate did not apply if net investment income exceeds 1.1765% in any calendar quarter (4.706% annualized); and |
| · | 15.0% of the amount of the Company’s pre-incentive fee net investment income, if any, that exceeds 1.1765% in any calendar quarter (4.706% annualized) is payable to the Company’s Adviser. |
Pursuant to the Waiver Agreement, the Adviser has agreed to waive its right to receive the Incentive Fee on pre-incentive fee net investment income to the extent necessary so that such Incentive Fee equals, and is calculated in the same manner as, the corresponding Incentive Fee on pre-incentive fee net investment income, if such Incentive Fee (i) were calculated based upon the Adviser receiving 10.0% (instead of 15.0%) of the applicable pre-incentive fee net investment income and (ii) did not include any “catch-up” feature in favor of the Adviser.
The second part of the Incentive Fee is determined and payable in arrears as of the end of each calendar year (or upon termination of the Investment Advisory Agreement, as of the termination date), and equals 15.0% of the Company’s realized capital gains, if any, on a cumulative basis from June 16, 2015, the effective date of the Registration Statement, through the end of each calendar year, computed net of all realized capital losses and unrealized capital depreciation on a cumulative basis, less the aggregate amount of any previously paid capital gain Incentive Fees with respect to each of the investments in the Company’s portfolio.
| 97 |
Pursuant to the Waiver Agreement, the Adviser has agreed to waive the right to receive the Incentive Fee on capital gains to the extent necessary so that such portion of the Incentive Fee equals, and is calculated in the same manner as, the corresponding Incentive Fee on capital gains, if such portion of the Incentive Fee were calculated based upon the Adviser receiving 10.0% (instead of 15.0%).
In addition, pursuant to the Waiver Agreement, the Adviser has agreed to waive the right to receive both components of the Incentive Fee to the extent necessary so that it does not receive Incentive Fees which are attributable to income and gains of the Company that exceed an annualized rate of 12.0% in any calendar quarter.
The waivers from the Adviser will remain effective until terminated earlier by either party on 60 days’ prior to written notice.
For the year ended December 31, 2019, the Company recorded incentive fees related to net investment income of $2,620,312. Offsetting the incentive fees were waivers of the incentive fess related to net investment income of $2,115,919, as set forth within the accompanying statements of operations. For the year ended December 31, 2018, the Company recorded incentive fees related to net investment income of $1,938,059. Offsetting the incentive fees were waivers of the incentive fess related to net investment income of $1,577,318, as set forth within the accompanying statements of operations. For the year ended December 31, 2017, the Company recorded incentive fees related to net investment income of $1,072,081. Offsetting the incentive fees were waivers of the incentive fess related to net investment income of $949,774, as set forth within the accompanying statements of operations.
For the years ended December 31, 2019 and 2018, the Company did not record any incentive fees related to capital gains. For the year ended December 31, 2017, the Company recorded incentive fees related to capital gains of $37,286. Offsetting the incentive fees were waivers of the incentive fess related capital gains of $12,429, as set forth within the accompanying statements of operations.
Administrative Fee
The Company has also entered into an administration agreement (the “Administration Agreement”) with Audax Management Company, LLC (the “Administrator”) under which the Administrator provides administrative services to the Company. Under the Administration Agreement, the Administrator performs, or oversees the performance of administrative services necessary for the operation of the Company, which include being responsible for the financial records which the Company is required to maintain and prepare reports filed with the SEC. In addition, the Administrator assists in determining and publishing the Company’s net asset value, oversees the preparation and filing of the Company’s tax returns and the printing and dissemination of reports to the Company’s stockholders, and generally oversees the payment of the Company’s expenses and the performance of administrative and professional services rendered to the Company by others. The Company reimburses the Administrator for its allocable portion of the costs and expenses incurred by the Administrator for overhead in performance by the Administrator of its duties under the Administration Agreement, including the cost of facilities, office equipment and the Company’s allocable portion of cost of compensation and related expenses of its Chief Financial Officer and Chief Compliance Officer and their respective staffs, as well as any costs and expenses incurred by the Administrator relating to any administrative or operating services provided by the Administrator to the Company. Such costs are reflected as an administrative fee in the accompanying statements of operations.
The Company has also entered into a fee waiver agreement with the Administrator, pursuant to which the Administrator may waive, in whole or in part, its entitlement to receive reimbursements from the Company.
For each of the years ended December 31, 2019, 2018 and 2017, the Company recorded administrative fees of $265,000, as set forth within the accompanying statements of operations.
| 98 |
Related Party Fees
Fees due to related parties as of December 31, 2019 and 2018 on the Company’s accompanying statements of assets and liabilities were as follows:
| December 31, 2019 | December 31, 2018 | |||||||
| Net base management fee due to Adviser | $ | 569,600 | $ | 424,873 | ||||
| Net incentive fee due to Adviser | 118,536 | 111,041 | ||||||
| Total fees due to Adviser, net of waivers | 688,136 | 535,914 | ||||||
| Fee due to Administrator, net of waivers | 66,250 | 66,250 | ||||||
| Total Related Party Fees Due | $ | 754,386 | $ | 602,164 | ||||
(a) Expenses paid on behalf of the Company by the Adviser
Other Agreements
The Company may invest alongside other clients of the Adviser and its affiliates in certain circumstances where doing so is consistent with applicable law, SEC staff interpretations and the terms of the Company’s exemptive relief.
| Note 5. | Net Increase in Net Assets Resulting from Operations Per Share of Common Stock: |
The following table sets forth the computation of basic and diluted net increase in net assets resulting from operations per weighted average share of Company’s common stock for the years ended December 31, 2019, 2018, and 2017:
| Year Ended December 31, 2019 | Year Ended December 31, 2018 | Year Ended December 31, 2017 | ||||||||||
| Numerator for basic and diluted net increase in net assets resulting from operations per common share | $ | 16,060,580 | $ | 11,229,774 | $ | 7,741,286 | ||||||
| Denominator for basic and diluted weighted average common shares | 32,672,328 | 24,340,035 | 18,080,178 | |||||||||
| Basic and diluted net increase in net assets resulting from operations per common share | $ | 0.49 | $ | 0.46 | $ | 0.43 | ||||||
| Note 6. | Income Tax |
The Company has elected to be regulated as a BDC under the 1940 Act, as well as elected to be treated as a RIC under Subchapter M of the Code. As a RIC, the Company generally is not subject to corporate-level U.S. federal income taxes on any ordinary income or capital gains that it timely distributes as dividends for U.S. federal income tax purposes to its stockholders. To qualify to be treated as a RIC, the Company is required to meet certain source of income and asset diversification requirements, and to timely distribute dividends out of assets legally available for distributions to its stockholders of an amount generally equal to at least 90% of the sum of its net ordinary income and net short-term capital gains in excess of net long-term capital losses, if any (i.e., “investment company taxable income,” determined without regard to any deduction for dividends paid), for each taxable year. The amount to be paid out as distributions to the Company’s stockholders is determined by the Company’s Board of Directors and is based on management’s estimate of the fiscal year earnings. Based on that estimate, the Company intends to make the requisite distributions to its stockholders, which will generally relieve the Company from corporate-level U.S. federal income taxes. Although the Company currently intends to distribute its net capital gains (i.e., net long-term capital gains in excess of net short-term capital losses), if any, recognized in respect of each taxable year as dividends out of the Company’s assets legally available for distribution, the Company in the future may decide to retain for investment and be subject to entity-level income tax on such net capital gains. Additionally, depending on the level of taxable income earned in a taxable year, the Company may choose to carry forward taxable income in excess of current year distributions into the next taxable year and incur a 4% excise tax on such income, as required. To the extent that the Company determines that its estimated current year annual taxable income will be in excess of estimated current year distributions, the Company will accrue an excise tax, if any, on estimated excess taxable income as such excess taxable income is earned.
| 99 |
The Company had aggregate distributions declared and paid to its shareholders for the year ended December 31, 2019 of $17,084,202, or $0.52 per share. The tax character of the distributions declared and paid represented $16,941,968 from ordinary income, and $142,234 from tax return of capital. The Company had aggregate distributions declared and paid to its shareholders for the year ended December 31, 2018 of $13,002,172, or $0.52 per share. The tax character of the distributions declared and paid represented $12,537,786 from ordinary income, $450,049 capital gains, and $14,337 from tax return of capital.
GAAP require adjustments to certain components of net assets to reflect permanent differences between financial and tax reporting. These adjustments have no effect on net asset value per share. For the year ended December 31, 2019 and 2018, the Company recorded the following adjustments for permanent book to tax differences to reflect their tax characteristics. The adjustments only change the classification in net assets in the statements of assets and liabilities. During the year ended December 31, 2019 and 2018, the Company reclassified for book purposes amounts arising from permanent book/tax differences primarily related to distribution redesignations and return of capital distributions.
Year Ended 2019 | Year Ended 2018 | |||||||
| Capital in excess of par value | (1,583 | ) | $ | (355 | ) | |||
| Accumulated net investment income | (49,515 | ) | 22,066 | |||||
| Accumulated net realized gain (loss) | 51,098 | (21,711 | ) | |||||
At December 31, 2019 and 2018, the components of distributable taxable earnings as detailed below differ from the amounts reflected in the Company’s statements of assets and liabilities by temporary book/tax differences primarily arising from amortization of organizational expenditures.
As of December 31, 2019 | As of December 31, 2018 | |||||||
| Other temporary book/tax differences | $ | (213,307 | ) | $ | (233,622 | ) | ||
| Net tax basis unrealized (depreciation) appreciation | (1,847,095 | ) | (1,617,418 | ) | ||||
| Accumulated net realized loss | (670,443 | ) | - | |||||
| Components of tax distributable (deficit) earnings at period end | $ | (2,730,845 | ) | $ | (1,851,040 | ) | ||
Certain losses incurred by the Company after October 31 of a taxable year are deemed to arise on the first business day of the Company’s next taxable year. The Company did not incur such losses after October 31 of the Company’s taxable year ended December 31, 2019.
Capital losses are generally eligible to be carried forward indefinitely, and retain their status as short-term or long-term in the manner originally incurred by the Company. As of December 31, 2019, the Company has long-term capital loss carryforward of $670,443. The Company has evaluated tax positions it has taken, expects to take, or that are otherwise relevant to the Company for purposes of determining whether any relevant tax positions would “more-likely-than-not” be sustained by the applicable tax authority in accordance with ASC Topic 740, “Income Taxes,” as modified by ASC Topic 946. The Company has analyzed such tax positions and has concluded that no unrecognized tax benefits should be recorded for uncertain tax positions for taxable years that may be open. The Company is not aware of any tax positions for which it is reasonably possible that the total amounts of unrecognized tax benefits will change materially in the next twelve months. The Company’s U.S. federal tax returns for fiscal years 2015, 2016, and 2017 remain subject to examination by the Internal Revenue Service. The Company records tax positions that are not deemed to meet a more-likely-than-not threshold as tax expenses as well as any applicable penalties or interest associated with such positions. During each of the years ended December 31, 2019, 2018, and 2017, no tax expense or any related interest or penalties were incurred.
| 100 |
| Note 7. | Equity |
On June 23, 2015, an investor made a $140,000,000 capital commitment to the Company. On December 2, 2016, the same investor made an additional capital commitment of $50,000,000. On December 7, 2017, the same investor made an additional capital commitment of $100,000,000. On March 22, 2019, the same investor made an additional capital commitment of $40,000,000. On September 23, 2019, the same investor made an additional capital commitment of $30,000,000. As of December 31, 2019, $25,000,000 of total capital commitments remained unfunded by the Company’s investors.
The number of Shares issued and outstanding as of December 31, 2019 and 2018, were 35,109,246 and 28,269,649, respectively.
The following table summarizes activity in the number of Shares during the years ended December 31, 2019 and 2018:
| Common stock shares in issue | ||||||||
| Year Ended December 31, 2019 | Year Ended December 31, 2018 | |||||||
| Shares in issue, beginning of period | 28,269,649 | 21,988,238 | ||||||
| Common stock issued ($65,000,000 and $60,000,000, respectively ) | 6,839,591 | 6,281,406 | ||||||
| Issuance of common shares in connection with dividend reinvestment plan ($60 and $57, respectively) | 6 | 6 | ||||||
| Shares in issue, end of period | 35,109,246 | 28,269,649 | ||||||
The following table details the activity of Stockholders’ Equity for the years ended December 31, 2019 and 2018:
| Year Ended December 31, 2019 | Common Stock | Capital in Excess of Par Value | Total Distributable (Loss) Earnings | Total Stockholders' Equity | ||||||||||||
| Balance as of December 31, 2018 | $ | 28,270 | $ | 269,246,005 | $ | (1,851,040 | ) | $ | 267,423,235 | |||||||
| Net investment income | - | - | 16,962,283 | 16,962,283 | ||||||||||||
| Net realized loss from investment transactions | - | - | (672,026 | ) | (672,026 | ) | ||||||||||
| Net change in unrealized depreciation on investments | - | - | (229,677 | ) | (229,677 | ) | ||||||||||
| Issuance of shares | 6,840 | 64,993,160 | - | 65,000,000 | ||||||||||||
| Distributions to Stockholders | - | (143,817 | ) | (16,940,385 | ) | (17,084,202 | ) | |||||||||
| Reinvested Dividends | - | 60 | - | 60 | ||||||||||||
| Balance as of December 31, 2019 | $ | 35,110 | $ | 334,095,408 | $ | (2,730,845 | ) | $ | 331,399,673 | |||||||
| 101 |
| Year Ended December 31, 2018 | Common Stock | Capital in Excess of Par Value | Total Distributable (Loss) Earnings | Total Stockholders' Equity | ||||||||||||
| Balance as of December 31, 2017 | $ | 21,989 | $ | 209,266,921 | $ | (93,334 | ) | $ | 209,195,576 | |||||||
| Net investment income | - | - | 12,558,101 | 12,558,101 | ||||||||||||
| Net realized gains from investment transactions | - | - | 449,694 | 449,694 | ||||||||||||
| Net change in unrealized appreciation on investments | - | - | (1,778,021 | ) | (1,778,021 | ) | ||||||||||
| Issuance of shares | 6,281 | 59,993,719 | - | 60,000,000 | ||||||||||||
| Distributions to Stockholders | - | (14,692 | ) | (12,987,480 | ) | (13,002,172 | ) | |||||||||
| Reinvested Dividends | - | 57 | - | 57 | ||||||||||||
| Balance as of December 31, 2018 | $ | 28,270 | $ | 269,246,005 | $ | (1,851,040 | ) | $ | 267,423,235 | |||||||
| Year Ended December 31, 2017 | Common Stock | Capital in Excess of Par Value | Total Distributable (Loss) Earnings | Total Stockholders' Equity | ||||||||||||
| Balance as of December 31, 2016 | $ | 17,832 | $ | 169,483,511 | $ | 868,318 | $ | 170,369,661 | ||||||||
| Net investment income | - | - | 8,026,282 | 8,026,282 | ||||||||||||
| Net realized gains from investment transactions | - | - | 696,970 | 696,970 | ||||||||||||
| Net change in unrealized depreciation on investments | - | - | (981,966 | ) | (981,966 | ) | ||||||||||
| Issuance of shares | 4,157 | 39,995,843 | - | 40,000,000 | ||||||||||||
| Distributions to Stockholders | - | (212,483 | ) | (8,702,938 | ) | (8,915,421 | ) | |||||||||
| Reinvested Dividends | - | 50 | - | 50 | ||||||||||||
| Balance as of December 31, 2017 | $ | 21,989 | $ | 209,266,921 | $ | (93,334 | ) | $ | 209,195,576 | |||||||
Note 8. Commitments and Contingencies
The Company may enter into certain credit agreements that include loan commitments where all or a portion of such commitment may be unfunded. The Company is generally obligated to fund the unfunded loan commitments at the borrowers’ discretion. Funded portions of credit agreements are presented on the accompanying schedule of investments. Unfunded loan commitments and funded portions of credit agreements are fair valued and unrealized appreciation or depreciation, if any, have been included in the accompanying statements of assets and liabilities and statements of operations.
The following table summarizes the Company’s significant contractual payment obligations as of December 31, 2019 and December 31, 2018:
| Investment | Industry | December 31, 2019 | December 31, 2018 | |||||||
| Advarra, Senior Secured Initial Revolving Loan (First Lien), 6.16% (Libor + 4.25%), maturity 7/9/26(j) | Healthcare & Pharmaceuticals | $ | 761,905 | $ | - | |||||
| EverCommerce, Senior Secured Initial Term Loan, 7.41% (Libor + 5.50%), maturity 8/23/25 | High Tech Industries | 464,713 | - | |||||||
| Anchor Packaging, Senior Secured Initial Term Loan (First Lien), 5.91% (Libor + 4.00%), maturity 7/18/26 | Containers, Packaging & Glass | 437,500 | - | |||||||
| Mavis, Senior Secured Closing Date Term Loan (First Lien), 5.16% (Libor + 3.25%), maturity 3/20/25(i) | Automotive | 345,141 | 469,764 | |||||||
| Tangent, Senior Secured Closing Date Term Loan (First Lien), 6.66% (Libor + 4.75%), maturity 11/30/24 | Construction & Building | 333,333 | - | |||||||
| Advarra, Senior Secured Initial Term Loan (First Lien), 6.16% (Libor + 4.25%), maturity 7/9/26(j) | Healthcare & Pharmaceuticals | 288,796 | - | |||||||
| DuBois Chemicals 2019, Senior Secured Term Loan B (First Lien), 6.41% (Libor + 4.50%), maturity 9/30/26 | Chemicals, Plastics & Rubber | 252,692 | - | |||||||
| Premise Health, Senior Secured Initial Term Loan (First Lien), 5.41% (Libor + 3.50%), maturity 7/10/25 | Healthcare & Pharmaceuticals | 147,052 | 147,052 | |||||||
| OEConnection, Senior Secured Initial Term Loan, 5.91% (Libor + 4.00%), maturity 9/25/26 | High Tech Industries | 142,180 | - | |||||||
| Service Logic, Senior Secured Initial Term Loan (First Lien), 6.16% (Libor + 4.25%), maturity 12/31/24 | Services: Business | 136,667 | - | |||||||
| Ned Stevens, Senior Secured Term A Loan, 7.66% (Libor + 5.75%), maturity 9/30/25(j) | Services: Consumer | 130,719 | - | |||||||
| Alpaca, Senior Secured Term Loan, 6.16% (Libor + 4.25%), maturity 4/19/24(j) | Healthcare & Pharmaceuticals | 124,637 | - | |||||||
| Mister Car Wash, Senior Secured Initial Term Loan (First Lien), 5.41% (Libor + 3.50%), maturity 5/14/26(i) | Services: Consumer | 100,000 | - | |||||||
| MyEyeDr, Senior Secured Initial Term Loan (First Lien), 6.16% (Libor + 4.25%), maturity 8/31/26(i) | Health Care Equipment & Services | 98,225 | - | |||||||
| Worley Claims Services, Senior Secured Initial Term Loan (First Lien), 5.91% (Libor + 4.00%), maturity 6/3/26(i) | Services: Business | 50,125 | - | |||||||
| Ansira, Unitranche, 7.66% (Libor + 5.75%), maturity 12/20/22 | Media: Advertising, Printing & Publishing | 38,214 | 85,171 | |||||||
| AmeriLife Group, Senior Secured Initial Term Loan (First Lien), 6.41% (Libor + 4.50%), maturity 6/12/26 | Banking, Finance, Insurance & Real Estate | 17,544 | - | |||||||
| Stepping Stones, Unitranche, 7.41% (Libor + 5.50%), maturity 12/12/24 | Healthcare & Pharmaceuticals | 9,519 | - | |||||||
| Carlisle FoodService, Senior Secured Initial Term Loan (First Lien), 4.91% (Libor + 3.00%), maturity 3/20/25 | Wholesale | - | 736,196 | |||||||
| GlobalLogic, Senior Secured Initial Term Loan, 6.05% (Libor + 3.25%), maturity 8/1/25 | High Tech Industries | - | 250,000 | |||||||
| Community Brands, Senior Secured Initial Term Loan (First Lien), 5.91% (Libor + 4.00%), maturity 12/2/22 | High Tech Industries | - | 194,963 | |||||||
| Veritext, Senior Secured Initial Term Loan (First Lien), 6.55% (Libor + 3.75%), maturity 8/1/25 | Healthcare & Pharmaceuticals | - | 166,833 | |||||||
| Dermatologists of Central States, Senior Secured Term Loan, 9.30% (Libor + 6.50%), maturity 4/20/22 | Healthcare & Pharmaceuticals | - | 91,116 | |||||||
| Integrity Marketing Group, Senior Secured Term Loan, 7.05% (Libor + 4.25%), maturity 11/28/25 | Banking, Finance, Insurance & Real Estate | - | 78,740 | |||||||
| Eating Recovery Center, Senior Secured Initial Term Loan (First Lien), 7.30% (Libor + 4.50%), maturity 9/23/24 | Healthcare & Pharmaceuticals | - | 5,682 | |||||||
| $ | 3,878,962 | $ | 2,225,517 | |||||||
| 102 |
Unfunded commitments represent all amounts unfunded as of December 31, 2019 and 2018. These amounts may or may not be funded to the borrowing party now or in the future.
Note 9. Financial Highlights
| Year Ended December 31, 2019 | Year Ended December 31, 2018 | Year Ended December 31, 2017 | Year Ended December 31, 2017 | For the period January 29, 2015 (date of inception) through December 31, 2015 | ||||||||||||||||
| Per Share Data: | ||||||||||||||||||||
| Net asset value, beginning of period | $ | 9.46 | $ | 9.51 | $ | 9.55 | $ | 9.45 | $ | - | ||||||||||
| Net investment income(a) | 0.52 | 0.52 | 0.44 | 0.38 | (0.20 | ) | ||||||||||||||
| Net realized (loss) gain on investments and change in unrealized depreciation on investments(a)(b) | (0.02 | ) | (0.04 | ) | (0.02 | ) | 0.07 | (0.31 | ) | |||||||||||
| Net increase in net assets resulting from operations | $ | 50.00 | $ | 0.48 | $ | 0.42 | $ | 0.45 | $ | (0.51 | ) | |||||||||
| Effect of equity capital activity | ||||||||||||||||||||
| Equity contribution | - | - | - | - | 10.00 | |||||||||||||||
| Distributions to stockholders from net investment income | (0.52 | ) | (0.52 | ) | (0.42 | ) | (0.33 | ) | (0.02 | ) | ||||||||||
| Distributions to stockholders from capital gains(c)(i) | - | (0.01 | ) | (0.03 | ) | (0.01 | ) | - | ||||||||||||
| Distributions to stockholders from return of capital(c) | - | - | (0.01 | ) | (0.01 | ) | (0.02 | ) | ||||||||||||
| Net asset value at end of period | $ | 9.44 | $ | 9.46 | $ | 9.51 | $ | 9.55 | $ | 9.45 | ||||||||||
| Total return(d)(h) | 5.18 | % | 4.94 | % | 4.47 | % | 4.80 | % | (5.10 | )% | ||||||||||
| Shares of common stock outstanding at end of period | 35,109,246 | 28,269,649 | 21,988,238 | 28,269,649 | 10,750,799 | |||||||||||||||
| Statement of Assets and Liabilities Data: | ||||||||||||||||||||
| Net assets at end of period | $ | 331,399,673 | $ | 267,423,235 | $ | 209,195,576 | $ | 170,369,661 | $ | 101,638,501 | ||||||||||
| Average net assets(e) | 316,110,129 | 241,057,371 | 180,098,537 | 123,605,111 | 26,319,657 | |||||||||||||||
| Ratio/Supplemental Data: | ||||||||||||||||||||
| Ratio of gross expenses to average net assets-annualized(f) | 2.32 | % | 2.26 | % | 2.23 | % | 2.37 | % | 6.73 | % | ||||||||||
| Ratio of net expenses to average net assets-annualized(g) | 1.29 | % | 1.25 | % | 1.35 | % | 1.59 | % | 6.36 | % | ||||||||||
Ratio of net investment income to average net assets-annualized | 5.37 | % | 5.21 | % | 4.46 | % | 3.81 | % | (1.97 | )% | ||||||||||
| Portfolio turnover(h) | 2.91 | % | 0.66 | % | 1.92 | % | 0.96 | % | 5.16 | % | ||||||||||
(a) Based on weighted average basic per share of Common Stock data.
(b) The per share amount varies from the net realized and unrealized gain (loss) for the period because of the timing of sales of fund shares and the per share amount of realized and unrealized gains and losses at such time.
(c) For the year ended December 31, 2019, the 0.00 is due to rounding.
(d) Total return is based on the change in net asset value during the respective periods. Total return also takes into account dividends and distributions, if any, reinvested in accordance with the Company's dividend reinvestment plan.
(e) Average net assets are computed using the average balance of net assets at the end of each month of the reporting period.
(f) Ratio of gross expenses to average net assets is computed using expenses before waivers from the Adviser and Administrator.
(g) Ratio of net expenses to average net assets is computed using total expenses net of waivers from the Adviser and Administrator.
(h) The period January 29, 2015 (date of inception) through December 31, 2015 is not annualized.
(i) As of December 31, 2019, the Company has current capital loss carryforward of $670,443.
| 103 |
Note 10. Selected Quarterly Financial Data (Unaudited)
| Quarter Ended December 31, 2019 | Quarter Ended December 31, 2018 | Quarter Ended December 31, 2017 | ||||||||||
| Statement of Operations Data: | ||||||||||||
| Income | ||||||||||||
| Total investment income | $ | 5,434,922 | $ | 4,327,197 | $ | 2,876,209 | ||||||
| Expenses | ||||||||||||
| Net expense | 1,015,174 | 802,019 | 689,364 | |||||||||
| Net investment income | 4,419,748 | 3,525,178 | 2,186,845 | |||||||||
| Net realized gain on investments | 52,428 | 52,381 | 221,897 | |||||||||
| Net change in unrealized appreciation (depreciation) on investments | 249,483 | (900,688 | ) | (171,680 | ) | |||||||
| Net increase in net assets resulting from operations | $ | 4,721,659 | $ | 2,676,871 | $ | 2,237,062 | ||||||
| Per Share Data: | ||||||||||||
| Net investment income per common share - basic and diluted (a) | $ | 0.13 | $ | 0.13 | $ | 0.12 | ||||||
| Net increase in net assets resulting from operations per common share - basic and diluted (a) | 0.13 | 0.10 | 0.12 | |||||||||
| Distributions declared per common share | 0.25 | 0.27 | 0.26 | |||||||||
| Statement of Assets and Liabilities Data: | ||||||||||||
| Total assets | $ | 339,396,997 | $ | 282,945,853 | $ | 214,489,673 | ||||||
| Total liabilities | 7,997,324 | 15,522,618 | 5,294,097 | |||||||||
| Net assets | 331,399,673 | 267,423,235 | 209,195,576 | |||||||||
| Net asset value per common share | 9.44 | 9.46 | 9.51 | |||||||||
| Common shares outstanding | 35,109,246 | 28,269,649 | 21,988,238 | |||||||||
| Weighted common shares outstanding - basic and diluted | 35,092,171 | 26,253,795 | 18,816,932 | |||||||||
| Other Data: | ||||||||||||
| Number of portfolio investments | 174 | 144 | 102 | |||||||||
| Average investment amount (b) | $ | 1,912,195 | $ | 1,849,169 | $ | 1,805,643 | ||||||
| Percentage of new investments at floating rates (b) | 99.38 | % | 100.00 | % | 100.00 | % | ||||||
(a) Per share data is based on weighted average common stock outstanding for both basic and diluted.
(b) Based on cost of investments.
Note 11. Indemnification
In the normal course of business, the Company may enter into certain contracts that provide a variety of indemnities. The Company’s maximum exposure under these indemnities is unknown. The Company does not consider it necessary to record a liability in this regard.
Note 12. Subsequent Events
Subsequent to December 31, 2019 through March 17, 2020, we invested $12,603,912 at cost in 22 different portfolio companies.
On December 26, 2019, the Company delivered a capital drawdown notice to one of its investors relating to the sale of 1,588,983 shares of the Company’s Common Stock, for an aggregate offering price of $15 million. The sale closed on January 10, 2020.
The sale of Common Stock was made pursuant to a subscription agreement entered into by the Company and the investor. Under the terms of the subscription agreement, the investor is required to fund drawdowns to purchase shares of Common Stock up to the amount of its capital commitment on an as-needed basis with a minimum of 10 calendar days’ prior notice.
The issuance of the Common Stock is exempt from the registration requirements of the Securities Act pursuant to Section 4(a)(2) thereof. The Company has not engaged in general solicitation or advertising with regard to the issuance and sale of the Common Stock and has not offered securities to the public in connection with such issuance and sale.
| 104 |
ITEM 9. CHANGES IN AND DISAGREEMENTS WITH ACCOUNTANTS ON ACCOUNTING AND FINANCIAL DISCLOSURE
None.
ITEM 9A. CONTROLS AND PROCEDURES
Disclosure Controls and Procedures
As of December 31, 2019 (the end of the period covered by this annual report), our management, including our Chief Executive Officer and Chief Financial Officer, evaluated the effectiveness and design and operation of our disclosure controls and procedures. Based on that evaluation, our management, including the Chief Executive Officer and Chief Financial Officer, concluded that our disclosure controls and procedures were effective at a reasonable assurance level in timely alerting management, including the Chief Executive Officer and Chief Financial Officer, of material information about us required to be included in periodic SEC filings. However, in evaluation of the disclosure controls and procedures, management recognized that any controls and procedures, no matter how well designed and operated, can provide only reasonable assurance of achieving the desired control objectives, and management necessarily was required to apply its judgment in evaluating the cost-benefit relationship of possible controls and procedures.
Changes in Internal Control Over Financial Reporting
There have been no changes in our internal control over financial reporting, as defined in Rules 13a-15(f) and 15d-15(f) under the Exchange Act, that occurred during our most recently completed fiscal quarter that have materially affected, or are reasonably likely to materially affect, our internal control over financial reporting.
Management’s Report on Internal Control Over Financial Reporting
The management of Audax Credit BDC Inc. (“we” and “our”) is responsible for establishing and maintaining adequate internal control over financial reporting. Our internal control system is a process designed to provide reasonable assurance to our management and Board of Directors regarding the preparation and fair presentation of published financial statements.
Our internal control over financial reporting includes policies and procedures that pertain to the maintenance of records that, in reasonable detail, accurately and fairly reflect transactions recorded necessary to permit the preparation of financial statements in accordance with U.S. generally accepted accounting principles. Our policies and procedures also provide reasonable assurance that receipts and expenditures are being made only in accordance with authorizations of our management and directors, and provide reasonable assurance regarding prevention or timely detection of unauthorized acquisition, use or disposition of our assets that could have a material effect on our financial statements.
All internal control systems, no matter how well designed, have inherent limitations. Therefore, even those systems determined to be effective can provide only reasonable assurance with respect to financial statement preparation and presentation. Also, projections of any evaluation of effectiveness as to future periods are subject to the risk that controls may become inadequate because of changes in conditions, or that the degree of compliance with the policies or procedures may deteriorate.
Management assessed the effectiveness of our internal control over financial reporting as of December 31, 2019. In making this assessment, we used the criteria set forth by the Committee of Sponsoring Organizations of the Treadway Commission in Internal Control — Integrated Framework issued in 2013. Based on the assessment, management believes that, as of December 31, 2019, our internal control over financial reporting is effective based on those criteria.
| 105 |
The independent registered public accounting firm that audited our financial statements has not issued an audit report on the effectiveness of our internal control over financial reporting, due to exemptions for non-accelerated filers under the Sarbanes-Oxley Act of 2002, as amended, and for emerging growth companies under the Jumpstart Our Business Startups Act of 2012, as amended.
Not applicable.
| 106 |
We will file a definitive Proxy Statement for our 2020 Annual Meeting of Stockholders (the “ Proxy Statement”) with the SEC, pursuant to Regulation 14A, not later than 120 days after the end of our fiscal year. Accordingly, certain information required by Part III has been omitted under General Instruction G(3) to Form 10-K. Only those sections of the Proxy Statement that specifically address the items set forth herein are incorporated herein by reference.
ITEM 10. DIRECTORS, EXECUTIVE OFFICERS AND CORPORATE GOVERNANCE
The information required by Item 10 is hereby incorporated by reference from our Proxy Statement to be filed with the SEC within 120 days following the end of our fiscal year.
ITEM 11. EXECUTIVE COMPENSATION
The information required by Item 11 is hereby incorporated by reference from our Proxy Statement to be filed with the SEC within 120 days following the end of our fiscal year.
ITEM 12. SECURITY OWNERSHIP OF CERTAIN BENEFICIAL OWNERS AND MANAGEMENT AND RELATED STOCKHOLDER MATTERS
The information required by Item 12 is hereby incorporated by reference from our Proxy Statement to be filed with the SEC within 120 days following the end of our fiscal year.
ITEM 13. CERTAIN RELATIONSHIPS AND RELATED TRANSACTIONS, AND DIRECTOR INDEPENDENCE
The information required by Item 13 is hereby incorporated by reference from our Proxy Statement to be filed with the SEC within 120 days following the end of our fiscal year.
ITEM 14. PRINCIPAL ACCOUNTANT FEES AND SERVICES
The information required by Item 14 is hereby incorporated by reference from our Proxy Statement to be filed with the SEC within 120 days following the end of our fiscal year.
| 107 |
ITEM 15. EXHIBITS AND FINANCIAL STATEMENT SCHEDULES
The following documents are filed or incorporated by reference as part of this annual report:
1. Financial Statements – refer to “Item 8. Financial Statements and Supplementary Data” starting on page 69
2. No other financial statement schedules are filed herewith because (1) such schedules are not required or (2) the information has been presented in the aforementioned financial statements.
3. Exhibits
The following exhibits are filed as part of this annual report or are hereby incorporated by reference to exhibits previously filed with the SEC:
| 3.1 | Amended and Restated Certificate of Incorporation (Incorporated by reference to Exhibit 3.1 to the Registration Statement on Form 10 (File no. 000-55426), filed on April 17, 2015). |
| 3.2 | Form of Bylaws (Incorporated by reference to Exhibit 3.2 to the Registration Statement on Form 10 (File no. 000-55426), filed on April 17, 2015). |
| 4.1 | Form of Subscription Agreement (Incorporated by reference to Exhibit 4.1 to the Pre-Effective Amendment No. 1 to the Registration Statement on Form 10 (File no. 000-55426), filed on June 5, 2015). |
| 4.2* | Description of Securities. |
| 10.3 | Form of License Agreement (Incorporated by reference to Exhibit 10.3 to the Pre-Effective Amendment No. 1 to the Registration Statement on Form 10 (File no. 000-55426), filed on June 5, 2015). |
| 108 |
| 14.1 | Code of Business Conduct (Incorporated by reference to Exhibit 14.1 to the Pre-Effective Amendment No. 1 to the Registration Statement on Form 10 (File no. 000-55426), filed on June 5, 2015). |
| 14.2 | Code of Ethics (Incorporated by reference to Exhibit 99.1 to the Pre-Effective Amendment No. 1 to the Registration Statement on Form 10 (File No. 000-55426), filed on June 5, 2015). |
| 31.1* | Certification of Chief Executive Officer pursuant to Rule 13a-14(a) under the Securities Exchange Act of 1934, as amended. |
| 31.2* | Certification of Chief Financial Officer pursuant to Rule 13a-14(a) under the Securities Exchange Act of 1934, as amended. |
| 32.1* | Certification of Chief Executive Officer pursuant to 18 U.S.C. Section 1350, as adopted pursuant to Section 906 of the Sarbanes-Oxley Act of 2002, as amended (18 U.S.C. 1350). |
| 32.2* | Certification of Chief Financial Officer pursuant to 18 U.S.C. Section 1350, as adopted pursuant to Section 906 of the Sarbanes-Oxley Act of 2002, as amended (18 U.S.C. 1350). |
* Filed herewith
| 109 |
Pursuant to the requirements of the Securities Exchange Act of 1934, as amended, the registrant has duly caused thisreport to be signed on its behalf by the undersigned thereunto duly authorized.
| Audax Credit BDC Inc. | ||
| Date: March 17, 2020 | By: | /s/ Michael P. McGonigle |
| Michael P. McGonigle | ||
| Chairman of the Board of Directors, President, and Chief Executive Officer | ||
| Date: March 17, 2020 | By: | /s/ Richard T. Joseph |
| Richard T. Joseph | ||
| Chief Financial Officer and Treasurer |
Pursuant to the requirements of the Securities Exchange Act of 1934, this report has been signed below by the following persons on behalf of the registrant and in the capacities and on the dates indicated.
| Date: March 17, 2020 | By: | /s/ Michael P. McGonigle |
| Michael P. McGonigle | ||
| Chairman of the Board of Directors, President, and Chief Executive Officer (principal executive officer) |
| Date: March 17, 2020 | By: | /s/ Richard T. Joseph |
| Richard T. Joseph | ||
| Chief Financial Officer and Treasurer (principal financial and accounting officer) |
| Date: March 17, 2020 | By: | /s/ Kevin P. Magid |
| Kevin P. Magid | ||
| Director |
| Date: March 17, 2020 | By: | /s/ Patrick H. Dowling |
| Patrick H. Dowling | ||
| Director |
| Date: March 17, 2020 | By: | /s/ David G. Moyer |
| David G. Moyer | ||
| Director |
| Date: March 17, 2020 | By: | /s/ Joseph F. Nemia |
| Joseph F. Nemia | ||
| Director |