Attached files
| file | filename |
|---|---|
| EX-32.2 - EXHIBIT 32.2 - UNIVERSAL ELECTRONICS INC | a10k20191231-ex322.htm |
| EX-32.1 - EXHIBIT 32.1 - UNIVERSAL ELECTRONICS INC | a10k20191231-ex321.htm |
| EX-31.2 - EXHIBIT 31.2 - UNIVERSAL ELECTRONICS INC | a10k20191231-ex312.htm |
| EX-31.1 - EXHIBIT 31.1 - UNIVERSAL ELECTRONICS INC | a10k20191231-ex311.htm |
| EX-23.1 - EXHIBIT 23.1 - UNIVERSAL ELECTRONICS INC | a10k20191231-ex231.htm |
| EX-21.1 - EXHIBIT 21.1 - UNIVERSAL ELECTRONICS INC | a10k20191231-ex211.htm |
| EX-4.3 - EXHIBIT 4.3 - UNIVERSAL ELECTRONICS INC | a10k20191231-ex43.htm |
UNITED STATES
SECURITIES AND EXCHANGE COMMISSION
WASHINGTON, D.C. 20549
_______________________________________
FORM 10-K
FOR ANNUAL AND TRANSITION REPORTS
PURSUANT TO SECTIONS 13 OR
15(d) OF THE SECURITIES EXCHANGE ACT OF 1934
(Mark One)
ý | ANNUAL REPORT PURSUANT TO SECTION 13 OR 15(d) OF THE SECURITIES EXCHANGE ACT OF 1934 |
For the fiscal year ended December 31, 2019
OR
¨ | TRANSITION REPORT PURSUANT TO SECTION 13 OR 15(d) OF THE SECURITIES EXCHANGE ACT OF 1934 |
For the transition period from to
Commission File Number: 0-21044
_______________________________________
UNIVERSAL ELECTRONICS INC.
(Exact Name of Registrant as Specified in its Charter)
Delaware | 33-0204817 | |
(State or Other Jurisdiction of Incorporation or Organization) | (I.R.S. Employer Identification No.) | |
15147 N. Scottsdale Road, Suite H300 Scottsdale, Arizona | 85254-2494 | |
(Address of Principal Executive Offices) | (Zip Code) | |
Registrant's telephone number, including area code: (480) 530-3000
Securities registered pursuant to Section 12(b) of the Act: | ||
Title of each class | Trading Symbol(s) | Name of each exchange on which registered |
Common Stock, par value $0.01 per share | UEIC | The NASDAQ Stock Market LLC |
Securities registered pursuant to Section 12(g) of the Act:
None
_______________________________________
Indicate by check mark if whether the registrant is a well-known seasoned issuer, as defined in Rule 405 of the Securities Act. Yes ¨ No ý
Indicate by check mark if the registrant is not required to file reports pursuant to Section 13 or Section 15(d) of the Act. Yes ¨ No ý
Indicate by check mark whether the registrant (1) has filed all reports required to be filed by Section 13 or 15(d) of the Securities Exchange Act of 1934 during the preceding 12 months (or for such shorter period that the registrant was required to file such reports), and (2) has been subject to such filing requirements for the past 90 days. Yes ý No ¨
Indicate by check mark whether the registrant has submitted electronically every Interactive Data File required to be submitted pursuant to Rule 405 of Regulation S-T (§232.405 of this chapter) during the preceding 12 months (or for such shorter period that the registrant was required to submit such files). Yes ý No ¨
Indicate by check mark whether the registrant is a large accelerated filer, an accelerated filer, a non-accelerated filer, a smaller reporting company, or an emerging growth company. See the definitions of "large accelerated filer", "accelerated filer," "smaller reporting company," and "emerging growth company" in Rule 12b-2 of the Exchange Act.
Large accelerated filer | ¨ | Accelerated filer | ý |
Non-accelerated filer | ¨ | Smaller reporting company | ¨ |
Emerging growth company | ¨ | ||
If an emerging growth company, indicate by check mark if the registrant has elected not to use the extended transition period for complying with any new or revised financial accounting standards provided pursuant to Section 13(a) of the Exchange Act. ¨
Indicate by check mark whether the registrant is a shell company (as defined in Rule 12b-2 of the Exchange Act). Yes ¨ No ý
The aggregate market value of the voting and non-voting common equity held by non-affiliates of the registrant on June 28, 2019, the last business day of the registrant's most recently completed second fiscal quarter, was $369,666,251 based upon the closing sale price of the Company's common stock as reported on the NASDAQ Stock Market for that date.
On March 11, 2020, 14,014,991 shares of Common Stock, par value $.01 per share, of the registrant were outstanding.
DOCUMENTS INCORPORATED BY REFERENCE:
Portions of the registrant's notice of annual meeting of shareowners and proxy statement to be filed pursuant to Regulation 14A within 120 days after registrant's fiscal year end of December 31, 2019 are incorporated by reference into Part III of this Form 10-K. The Proxy Statement will be filed with the Securities and Exchange Commission no later than April 29, 2020.
Except as otherwise stated, the information contained in this Form 10-K is as of December 31, 2019.
UNIVERSAL ELECTRONICS INC.
Annual Report on Form 10-K
For the Fiscal Year Ended December 31, 2019
Table of Contents
Item Number | Page Number |
PART I | |
PART II | |
PART III | |
PART IV | |
PART I
ITEM 1. BUSINESS
Business of Universal Electronics Inc.
Universal Electronics Inc. ("UEI") was incorporated under the laws of Delaware in 1986 and began operations in 1987. The principal executive offices are located at 15147 N. Scottsdale Road, Suite H300, Scottsdale, Arizona 85254. As used herein, the terms "we", "us" and "our" refer to UEI and its subsidiaries unless the context indicates to the contrary.
Additional information regarding UEI may be obtained at www.uei.com. Our website address is not intended to function as a hyperlink and the information available at our website address is not incorporated by reference into this Annual Report on Form 10-K. We make our periodic and current reports, together with amendments to these reports, available on our website, free of charge, as soon as reasonably practicable after such material is electronically filed with, or furnished to, the U.S. Securities and Exchange Commission ("SEC"). The SEC maintains a website at www.sec.gov that contains the reports, proxy and other information that we file electronically with the SEC.
Business Segment
Overview
UEI designs, develops, manufactures and ships control and sensor technology solutions and a broad line of pre-programmed and universal control products, audio-video ("AV") accessories, and intelligent wireless security and smart home products that are used by the world's leading brands in the consumer electronics, subscription broadcasting, home entertainment, automation, security, hospitality and climate control markets. Our offerings include:
• | easy-to-use, pre-programmed universal infrared ("IR") and radio frequency ("RF") remote controls that are sold primarily to subscription broadcasting providers (cable, satellite and Internet Protocol television ("IPTV") and Over the Top ("OTT") services), original equipment manufacturers ("OEMs"), retailers, and private label customers; |
• | integrated circuits, on which our software and universal device control database is embedded, sold primarily to OEMs, subscription broadcasting providers, and private label customers; |
• | software, firmware and technology solutions that can enable devices such as TVs, set-top boxes, audio systems, smartphones, tablets, game controllers and other consumer electronic devices to wirelessly connect and interact with home networks and interactive services to control and deliver digital entertainment and information; |
• | intellectual property which we license primarily to OEMs, software development companies, private label customers, and subscription broadcasting providers; |
• | proprietary and standards-based RF sensors designed for residential security, safety and automation applications; |
• | wall-mount and handheld thermostat controllers and connected accessories for intelligent energy management systems, primarily to OEM customers as well as hospitality system integrators; and |
• | AV accessories sold, directly and indirectly, to consumers. |
Our business is comprised of one reportable segment.
Principal Products and Markets
Our principal markets are the subscription broadcast, consumer and mobile electronics, residential security, and hospitality markets where our customers include service providers, OEMs, international retailers, private label brands, pro-security dealers and companies in the computing industry.
We provide subscription broadcasting providers, both domestically and internationally, with our universal remote control devices and integrated circuits, on which our software and device code libraries are embedded. We also sell integrated circuits, on which our software and device control code libraries are embedded, and license our device control solutions to OEMs that manufacture televisions, digital audio and video players, streamer boxes, cable converters, satellite receivers, set-top boxes, room and central heating, ventilation and air conditioning ("HVAC") equipment, game consoles, and wireless mobile phones and tablets.
We continue to place significant emphasis on expanding our sales and marketing efforts to subscription broadcasters and OEMs in Asia, Latin America and Europe. We currently own and operate vertically integrated manufacturing and assembly factories in the People's Republic of China ("PRC"), Mexico and Brazil, which allow us the ability to produce in the regional markets and to scale our production to meet growing customer demand. We also use third-party manufacturing partners in other regions, such as The Philippines and Vietnam.
3
Leveraging our scale and expertise in low-power RF microcontrollers, we continue to pursue further penetration of the more traditional OEM consumer electronics markets as well as newer product categories in the smart home and Internet of Things ("IoT") markets such as lighting, window coverings, and bathroom controllers. Customers in these markets integrate our solutions and technology into their products to enhance their consumer lifestyle ecosystems. Growth in these markets has been driven by the increasing demand for more energy efficient homes, consumer convenience and the increasing proliferation of connected smart devices.
In 2015, we acquired Ecolink Intelligent Technology, Inc. ("Ecolink"), a leading developer of safety and security products. Ecolink provides a wide range of intelligent wireless security and automation components dedicated to redefining the home security experience. Ecolink has over 20 years of wireless engineering expertise in the home security and automation market and currently holds more than 50 related pending and issued patents. UEI’s current subscription broadcasting customers and customers in the hospitality channel are adding home security and automation to their list of service offerings. Our acquisition of Ecolink, a premise equipment supplier to this market, enables us to broaden our design expertise and product portfolio to add home security and automation sensors to our capabilities.
In 2017, we acquired Residential Control Systems, Inc. ("RCS"), a U.S.-based designer and manufacturer of energy management and control products for the residential, small commercial and hospitality markets. The acquisition of RCS allows us to expand our product offering to include smart thermostat, sensing and monitoring products and enables us to broaden our technology and design expertise in these product categories. Smart and connected thermostats are critical components of the smart home that help deliver energy-efficiency and an enhanced consumer lifestyle.
For the years ended December 31, 2019, 2018, and 2017, our sales to Comcast Corporation ("Comcast") accounted for 15.9%, 17.6%, and 23.0% of our net sales, respectively. For the year ended December 31, 2017 our sales to AT&T Inc. ("AT&T", formerly DIRECTV) and its sub-contractors collectively accounted for 11.2% of our net sales.
Our One For All® brand name of remote controls and AV accessories sold within the international retail markets accounted for 6.2%, 7.4%, and 7.1% of our total net sales for the years ended December 31, 2019, 2018, and 2017, respectively.
Intellectual Property and Technology
We hold a number of patents in the United States and abroad related to our products and technology, and have filed domestic and foreign applications for other patents that are pending. At the end of 2019, we had over 500 issued and pending United States patents related to remote control, home security, safety and automation as well as hundreds of foreign counterpart patents and applications in various territories around the world.
Our patents have remaining lives ranging from one to 18 years. We have also obtained copyright registration and claim copyright protection for certain proprietary software and libraries of our device control codes. Additionally, the names of many of our products are registered, or are being registered, as trademarks in the United States Patent and Trademark Office and in most of the other countries in which such products are sold. These registrations are valid for terms ranging up to 20 years and may be renewed as long as the trademarks continue to be used and are deemed by management to be important to our operations. While we follow the practice of obtaining patent, copyright and trademark registrations on new developments whenever advisable, in certain cases we have elected common law trade secret protection in lieu of obtaining such other protection.
A key factor in creating products and software for control of entertainment devices is our proprietary device knowledge graph. Since our beginning in 1986, we have compiled an extensive device control knowledge library that includes nearly 9,000 brands comprising over 800,000 device models across AV and smart home platforms, supported by many common smart home protocols, including IR, HDMI-CEC, Zigbee, and Home Network or Cloud Control.
This device knowledge graph is backed by our unique device fingerprinting technology which includes over 700,000 unique device fingerprints across both AV and Smart Home devices.
Our technology also includes other remote controlled home entertainment devices and home automation control modules, as well as wired Consumer Electronics Control ("CEC") and wireless Internet Protocol ("IP") control protocols commonly found on many of the latest HDMI and internet connected devices. Our proprietary software automatically detects, identifies and enables the appropriate control commands for any given home entertainment, automation and air conditioning device in the home. Our libraries are continuously updated with device control codes used in newly introduced AV and IoT devices. These control codes are captured directly from original remote control devices or from the manufacturer's written specifications to ensure the accuracy and integrity of the library. Our proprietary software and know-how permit us to offer a device control code database that is more robust and efficient than similarly priced products of our competitors.
4
Our goal is to provide universal control solutions that require minimal or no user set-up and deliver consistent and intuitive one-touch control of all connected content sources and devices. QuickSet® ("QuickSet") is a software application that is currently embedded or enabled via a cloud service, in over 550 million devices worldwide. QuickSet may be embedded in an AV device, set-top box, or other host device, or delivered as a cloud-based service to enable universal remote setup and control. QuickSet enables universal device control set-up using automated and guided on-screen instructions and a wireless two-way communication link between the remote and the QuickSet enabled device. The two-way connection allows device control code data and configuration settings to be sent to the remote control from the device and greatly simplifies the universal control set-up process and can enable other time-saving features. QuickSet utilizes data transmitted over HDMI or IP networks to automatically detect various attributes of the connected device and downloads the appropriate control codes and functions into the remote control without the need for the user to enter any additional information. The user does not need to know the brand or model number to set up the device in the remote. Any compatible new device that is connected is recognized. Consumers can quickly and easily set up their control interface to control multiple devices. Recently added QuickSet features address common consumer challenges in universal device control, such as mode confusion and input switching. With QuickSet, consumers switch easily between activities and reliably view their chosen content source with a single touch. QuickSet handles the device-specific control. A QuickSet user experience can be delivered via a tactile remote, touchscreen interface, on-screen graphical user interface or voice-enabled system. Licensees of QuickSet include service providers such as Comcast, AT&T and Dish Network Corporation; smart TV manufacturers such as Sony Corporation ("Sony") and Samsung; and leading game console manufacturers such as Microsoft Corporation on its Xbox One game system.
QuickSet Cloud is an end-to-end platform for discovery, control, and interaction with devices including rules and automation framework for a truly connected home experience. Leveraging the largest knowledge graph of devices, services are offered through QuickSet Cloud and QuickSet SDK delivery methods with edge intelligence built in and cloud scalability capabilities.
Smart devices are becoming a more prevalent part of the home entertainment experience, and UEI offers several solutions to enable entertainment device control via a smart phone, tablet, smart TV or smart speaker or digital assistant. In its smart device control solutions, UEI offers all of the elements needed for device control ranging from IR and RF controller chips to device control libraries to graphical and voice user interfaces, as well as artificial intelligence systems that deliver context aware device interactions. Designed for Android, Nevo® ("Nevo") Home is UEI's device and service discovery and control application, currently available for download at Google Play.
In 2018, UEI introduced nevo.ai, a digital assistant for the connected home with a natural language interface to allow interaction with devices within the home using QuickSet's underlying capabilities. Features are expandable through Enterprise Integration and Ecosystem of Partner Services.
In 2019, we introduced Nevo Butler, a turnkey smart home hub with nevo.ai and QuickSet pre-integrated. Offered as managed hardware with security built in from manufacturing through the life-cycle, it is capable of natively running Nevo Assistant, as well as other digital assistants.
UEI continues to evolve its hardware and software solutions by adding new features and capabilities to ensure added value. Through its cloud service platforms, QuickSet Cloud and nevo.ai, UEI began offering Interoperability As a Service with the intent of developing a recurring monthly revenue stream associated with these new offerings to its customers.
Methods of Distribution
Distribution methods for our control solutions vary depending on the sales channel. We distribute remote control devices, sensors, connected thermostats and AV accessories directly to subscription broadcasters and OEMs, both domestically and internationally. We also distribute home security sensors and connected thermostats to pro-security installers and hospitality system integrators in the United States through a network of dealers. Additionally, we sell our wireless control devices and AV accessories under the One For All® and private label brand names to retailers through our international subsidiaries and direct to retailers in key markets, such as in the United Kingdom and Germany. We utilize third-party distributors for the retail channel in countries where we do not have subsidiaries.
We have developed a broad portfolio of patented technologies and the industry's leading database of device setup and control software. We ship integrated circuits, on which our software and control code libraries are embedded and that connect to our embedded software and cloud services, directly to manufacturers for inclusion in their products. In addition, we license our software and technology to manufacturers. Licenses are delivered upon the transfer of a product master or on a per unit basis when the software or technology is used in a customer device.
We provide international consumer support to our various retail distributors primarily for our One For All® branded universal accessories through our live and automated call centers. We also make available a web-based support resource,
5
www.urcsupport.com, designed specifically for subscription broadcasters. This solution offers videos and online tools to help users easily set up their universal remote controls, and as a result reduces call volume at customer support centers.
Our 26 domestic and international subsidiaries are the following:
• | C.G. Development Ltd., established in Hong Kong; |
• | CG Mexico Remote Controls, S.R.L. de C.V., established in Mexico; |
• | Ecolink Intelligent Technology, Inc.; established under the laws of Delaware; |
• | Enson Assets Ltd., established in the British Virgin Islands; |
• | Gemstar Polyfirst Ltd., established in Hong Kong; |
• | Gemstar Technology (Qinzhou) Co. Ltd., established in the PRC; |
• | Gemstar Technology (Yangzhou) Co. Ltd., established in the PRC; |
• | Guangzhou Universal Electronics Service Co., Ltd., established in the PRC; |
• | One For All Argentina S.R.L., established in Argentina; |
• | One For All France S.A.S., established in France; |
• | One For All GmbH, established in Germany; |
• | One For All Iberia S.L., established in Spain; |
• | One For All UK Ltd., established in the United Kingdom; |
• | RCS Technology, LLC; established under the laws of Delaware; |
• | UE Japan Ltd., established in Japan; |
• | UE Korea Ltd., established in South Korea; |
• | UE Singapore Pte. Ltd., established in Singapore; |
• | UEI Cayman Inc., established in the Cayman Islands; |
• | UEI do Brasil Controles Remotos Ltda., established in Brazil; |
• | UEI Electronics Pte. Ltd., established in India; |
• | UEI Hong Kong Pte. Ltd., established in Hong Kong; |
• | Universal Electronics B.V., established in the Netherlands; |
• | Universal Electronics Italia S.R.L., established in Italy; |
• | Universal Electronics Trading Co., Ltd., established in the PRC; |
• | Universal Electronics Yangzhou Co. Ltd., established in the PRC; and |
• | Yangzhou Universal Trading Co. Ltd., established in the PRC. |
Raw Materials and Dependence on Suppliers
We utilize our own manufacturing plants and third-party manufacturers and suppliers primarily located within the PRC, Mexico, Brazil and The Philippines to produce our control and sensor products. In 2017, Texas Instruments provided 10% of our total inventory purchases. In 2018 and 2019, no single supplier provided more than 10% of our total inventory purchases.
Even though we operate two factories in the PRC and manufacturing and assembly plants in Brazil and Mexico, we continue to evaluate additional contract manufacturers and sources of supply. During 2019, we utilized multiple contract manufacturers and maintained duplicate tooling for certain of our products. Where possible we utilize standard parts and components, which are available from multiple sources.
In 2018, to avoid the U.S. government-imposed tariffs on products made in the PRC and imported into the United States, we began to move production of many of our products destined for the United States to Mexico and a third-party manufacturing partner outside of the PRC. As of December 31, 2019, this transition was substantially complete.
Our manufacturing process consists of assembly, software installation, functional testing, and quality control. We conduct operations utilizing a formal, documented quality management system to ensure that our products and services satisfy customer needs and expectations. Testing and quality control are also applied to components, parts, sub-assemblies, and systems obtained from third-party suppliers. Our factories in the PRC are certified to the ISO 14001 International Standard for environmental management systems. In addition, the manufacturing facilities in Yangzhou, PRC have also achieved ISO 45001 International Standard for safety and health management systems. We are focused on reducing the impact of our operations on the environment; and our teams continue to examine practices and processes throughout our facilities to identify opportunities for greater efficiency.
6
In addition to requiring observance to strict quality standards by our suppliers, we maintain and require our suppliers to adhere to a robust Global Supplier Code of Conduct. As part of the initial qualification and ongoing audit process, we examine a supplier’s social and environmental responsiveness in areas such as labor practice, occupational health and safety, and environmental protection. Additionally, we are committed to a conflict-free mineral supply chain.
We continually seek additional sources to reduce our dependence on our integrated circuit suppliers. To further manage our integrated system on a chip supplier dependence, we include microcontroller technology which incorporates non-volatile, reprogrammable flash memory in most of our products. Flash memory based microcontrollers have shorter lead times than microcontrollers using other memory technologies and may be reprogrammed, if necessary. This allows us flexibility to use a given component on many different products, has the added benefit of potentially reducing excess and obsolete inventory exposure and allows us to update our product functionality in the field. This diversification lessens our dependence on any one supplier and allows us to negotiate more favorable terms.
UEI is also a large consumer of low-power, RF chips and modules that are used throughout our product portfolios, including many of our remotes, sensors and thermostats.
Seasonality
Historically, our business has been influenced by the retail sales cycle, with increased sales in the second half of the year. We expect this pattern to be repeated during 2020.
See "ITEM 8. FINANCIAL STATEMENTS AND SUPPLEMENTARY DATA — Notes to Consolidated Financial Statements — Note 22" for further details regarding our quarterly results.
Competition
Our principal competitors in the subscription broadcasting market are Remote Solutions, Omni Remotes (formerly Philips Home Control Singapore PTE, Ltd.), SMK, and Ruwido. In the international retail and private label markets for wireless controls we compete primarily with Logitech and Sony, as well as various manufacturers of wireless controls in Asia. Our primary competitors in the OEM market are the OEMs themselves and various wireless control manufacturers in Asia. In home security, safety and automation, we offer universal sub-gigahertz products that are compatible with the top security panel manufacturers, such as Honeywell, GE, Tyco/DSC and 2GIG. In the Do-It-Yourself ("DIY") residential security channel, we compete with many Chinese ODMs, such as Leedarson, while in the connected smart home market we compete with the OEMs themselves as well as wireless manufacturers in North America, such as Nortek, and other original design manufacturers in Asia. We compete in our markets on the basis of product quality, features, intellectual property, local design and development expertise and customer support. We believe that we will need to continue to introduce new and innovative products and software solutions to remain competitive and to recruit and retain competent personnel to successfully accomplish our future objectives.
Engineering, Research and Development
During 2019, our engineering efforts focused on the following:
• | broadening our product portfolio; |
• | launching new embedded software solutions designed to simplify set-up and control features; |
• | modifying existing products and technologies to improve features and lower costs; |
• | formulating measures to protect our proprietary technology and general know-how; |
• | improving our control solutions software; |
• | updating our library of device codes to include codes for new features and devices introduced worldwide; |
• | creating innovative products that address consumer challenges in home entertainment control and security sensing; and |
• | optimizing our cloud platform to deliver additional features and managed services to a large installed base of customer and end-users. |
In 2018, UEI was awarded a 2017 Technical & Engineering Emmy® Award from The National Academy of Television Arts & Sciences for its work relating to voice navigation technologies for discovering and interacting with TV content. UEI was selected for its excellence in engineering and creativity that has materially affected the television viewing experience.
During 2019, our advanced engineering efforts focused on further developing our existing products, services and technologies. We released software updates to our embedded QuickSet application, and continued development initiatives around emerging RF technologies, such as RF4CE, Bluetooth, Bluetooth Smart and WiFi. We introduced Nevo Butler, as well as, enhancements to
7
UEI’s turnkey, voice-enabled smart home hub with built-in white label digital assistant with the aim of bringing voice first experiences to a large install base of devices in the home, blending entertainment control and home automation experiences, enabling interoperability across fragmented ecosystems. Additionally, we released many new advanced remote control products that incorporate voice search capabilities across a variety of our channels, as well as, several new connected thermostat platforms for OEM and security channel customers in Asia and North America.
Our personnel are involved with various industry organizations and bodies, which are in the process of setting standards for IR, RF, telephone and cable communications and networking in the home. Because of the nature of research and development ("R&D") activities, there can be no assurance that any of our R&D projects will be successfully completed or ultimately achieve commercial success.
Our expenditures on engineering, research and development were:
(In millions): | 2019 | 2018 | 2017 | |||||||||
Research and development | $ | 29.4 | $ | 23.8 | $ | 21.4 | ||||||
Engineering (1) | 8.5 | 14.1 | 11.0 | |||||||||
Total engineering, research and development | $ | 37.9 | $ | 37.9 | $ | 32.4 | ||||||
(1) | Engineering costs are included in selling, general and administrative expenses. |
Environmental Matters
Many of our products are subject to various federal, state, local and international laws governing chemical substances in products, including laws regulating the manufacturing and distribution of chemical substances and laws restricting the presence of certain substances in electronics products. We may incur substantial costs, including cleanup costs, fines and civil or criminal sanctions, third-party damages or personal injury claims, if we were to violate or become liable under environmental laws or if our products become non-compliant with environmental laws. We also face increasing complexity in our product design and procurement operations as we adjust to new and future requirements relating to the material composition of our products.
We may also face significant costs and liabilities in connection with product take-back legislation. The European Union's Waste Electrical and Electronic Equipment Directive ("WEEE") makes producers of electrical goods financially responsible for specified collection, recycling, treatment and disposal of past and future covered products. Our European subsidiaries are WEEE compliant. Similar legislation has been or may be enacted in other jurisdictions, including in the United States, Canada, Mexico, the PRC and Japan.
We believe that we have materially complied with all currently existing international and domestic federal, state and local statutes and regulations regarding environmental standards and occupational safety and health matters to which we are subject. During the years ended December 31, 2019, 2018 and 2017, the amounts incurred in complying with federal, state and local statutes and regulations pertaining to environmental standards and occupational safety and health laws and regulations did not materially affect our earnings or financial condition. However, future events, such as changes in existing laws and regulations or enforcement policies, may give rise to additional compliance costs that may have a material adverse effect upon our capital expenditures, earnings or financial condition.
We are committed to reducing and eliminating substances of concern from our products and manufacturing process. Our products distributed in the European Unions are compliant with the RoHS (Restriction of Hazardous Substances Directive 2002/95/EC) and REACH (Registration, Evaluation, Authorisation and Restriction of Chemicals) directives. In other regions, we also need to comply with our customers’ specific requirements relating to the non-use of certain hazardous substances in the products, which are typically equally or more stringent than the RoHS directive. At our manufacturing facilities, we are also committed to protecting our workers from exposure to hazardous substances under an established health and safety management system; for example, we strive to have our facilities be free of lead and the substances banned by RoHS.
We strive to extend the useful life of our products and reduce our products’ impact on the environment. For example, we deploy low energy IR-engine in some of our products which can extend battery life regardless of the protocols utilized by the product. We also offer a robust product refurbishment program to our customers where we will take back, refurbish and recycle used remote control units. Under such program, substantially all of the materials in a used remote control unit are reused or recycled; for example, used plastics and silicon are ground and reused in other products. We have also employed new master carton packing methods to increase shipping efficiency and reduce cardboard usage.
8
Employees
At December 31, 2019, we employed 4,347 employees, of which 1,035 worked in engineering and R&D, 111 in sales and marketing, 63 in consumer service and support, 2,844 in operations and warehousing and 294 in executive and administrative functions. In addition, our factories in the PRC and our Asian operations engaged an additional 4,419 staff contracted through agency agreements.
Labor unions represent approximately 46.9% of our 4,347 employees at December 31, 2019. Some unionized workers, employed in Manaus, Brazil, are represented under contract with the Sindicato dos Trabalhadores nas Industrias Metalugicas, Mecanicas e de Materiais Eletricos de Manaus. Other unionized workers, employed in Monterrey, Mexico, are represented under contract with the Sindicato Industrial de Trabajadores de Nuevo León adherido a la Federación Nacional de Sindicatos Independientes. Our business units are subject to various laws and regulations relating to their relationships with their employees. These laws and regulations are specific to the location of each business unit. We believe that our relationships with employees and their representative organizations are good.
Information About Our Executive Officers
The following table sets forth certain information concerning our executive officers on March 13, 2020:
Name | Age | Position | ||
Paul D. Arling | 57 | Chairman of the Board and Chief Executive Officer | ||
Bryan M. Hackworth | 50 | Senior Vice President and Chief Financial Officer | ||
Ramzi S. Ammari | 54 | Senior Vice President, Corporate Planning and Strategy | ||
David Chong | 58 | Executive Vice President, Asia | ||
Richard A. Firehammer, Jr. | 62 | Senior Vice President, General Counsel and Secretary | ||
Menno V. Koopmans | 44 | Senior Vice President, Global Sales | ||
Joseph E. Miketo | 63 | Senior Vice President, Operations | ||
Paul D. Arling is our Chairman and Chief Executive Officer. He joined us in May 1996 as Chief Financial Officer and was named to our Board of Directors in August 1996. He was appointed President and Chief Operating Officer in September 1998, was promoted to Chief Executive Officer in October 2000 and appointed as Chairman in July 2001. At the 2019 Annual Meeting of Stockholders, Mr. Arling was re-elected as our Chairman to serve until the 2020 Annual Meeting of Stockholders. From 1993 through May 1996, he served in various capacities at LESCO, Inc. (a manufacturer and distributor of professional turf care products). Prior to LESCO, he worked for Imperial Wallcoverings (a manufacturer and distributor of wall covering products) as Director of Planning and The Michael Allen Company (a strategic management consulting company) where he was employed as a management consultant. Mr. Arling received his Bachelor of Science and Master of Business Administration from The Wharton School of the University of Pennsylvania.
Bryan M. Hackworth is our Senior Vice President and Chief Financial Officer. He was promoted to Chief Financial Officer in August 2006. Mr. Hackworth joined us in June 2004 as Corporate Controller and subsequently assumed the role of Chief Accounting Officer in May 2005. Before joining us in 2004, he spent five years at Mars, Inc., a privately held international manufacturer and distributor of consumer products and served in several financial and strategic roles (Controller — Ice Cream Division; Strategic Planning Manager for the WHISKAS ® Brand) and various other financial management positions. Prior to joining Mars, Inc., Mr. Hackworth spent six years at Deloitte & Touche LLP as an auditor, specializing in the manufacturing and retail industries. Mr. Hackworth is a certified public accountant (inactive) in the state of California and holds a Bachelor of Arts in Economics from University of California, Irvine.
Ramzi S. Ammari is our Senior Vice President, Corporate Planning and Strategy. He joined us in June 1997 as a Project Manager and has held various positions of increasing responsibility within our organization until being named to his current position in October 2013. He has global responsibility for the company’s technology innovation roadmap; driving new product initiatives; directing and implementing strategic partnerships, joint ventures and acquisitions; and recommending new avenues for business creation. Prior to joining us, Mr. Ammari worked at Mitsubishi Consumer Electronics of America for four years as Business Planning Manager where he was responsible for introducing the first flat-screen plasma display panel television for the North America market. He received his Bachelor of Science, Engineering degree in 1989 and, subsequently, a Master of Business Administration from University of California, Irvine in 1993.
David Chong is our Executive Vice President, Asia. He is responsible for managing sales in our Asian markets. He was previously responsible for the general management of our Asia region. Mr. Chong joined us in January 2009 as Senior Vice President of Global OEM Sales. Prior to joining us, Mr. Chong served as Senior Vice President at Philips Consumer Electronics Division and
9
as the Chief Marketing Officer of the business group Philips Display (Philips TV and computer monitor business). At Philips Display, he led the re-engineering of the Product Creation, Marketing and Sales Organization to compete successfully in the LCD TV space. Prior to this, he also served as Vice President and General Manager of the Audio Video Business in Asia, Vice President and Global Business Line Manager for Audio and various senior management positions at Philips' CE Division. Mr. Chong started at Philips Research Lab in 1984 as a research scientist working in the area of VLSI design methodologies. He also served as Managing Director for Asia at InVue Security Product before joining us. Mr. Chong had his senior education in The United Kingdom, holding a Bachelor of Science in Electrical and Electronics Engineering with High Honors from University of Nottingham.
Richard A. Firehammer, Jr., Esq. is our Senior Vice President, General Counsel and Secretary. He joined us in October 1993 as General Counsel. He became our Secretary in February 1994. He was our Vice President from May 1997 until August 1998, and served as counsel to us from September 1998 until February 1999 at which time he was promoted to his current position. From November 1992 to September 1993, he was associated with the Chicago, Illinois law firm, Shefsky & Froelich, Ltd. From 1987 to 1992, he was with the law firm Vedder, Price, Kaufman & Kammholz in Chicago, Illinois. He received his Bachelor of Science in Accounting from Indiana University and a Juris Doctor degree from Whittier College School of Law. Mr. Firehammer is also a certified public accountant (inactive) in the state of California.
Menno V. Koopmans is our Senior Vice President, Global Sales. He served as Managing Director, EMEA from 2018 to August 2019 when he was promoted to his current position. From 2014 to the end of 2017, he was our Senior Vice President for subscription broadcasting business in Europe and India where he led the customer transition into smart remote controls. From 2005 until 2013, he was the head of our worldwide consumer business and our One For All® brand. Prior to joining us, Mr. Koopmans worked at Mars, Sony Europe and Royal Philips Electronics in different product, marketing and sales management roles in both fast-moving consumer goods and durable consumer goods categories. Mr. Koopmans received his Masters in Science of Business Administration from Erasmus University in Rotterdam, The Netherlands.
Joseph E. Miketo is our Senior Vice President, Operations. Mr. Miketo rejoined us in January 2019 to lead our global manufacturing and operations. He originally joined us in 2008 holding various positions, ultimately advancing to Senior Vice President of Operations by 2013. Before rejoining us in 2019, he was President/COO at Cast Nylons, a privately held manufacturer and distributor of cast nylon stock shapes and custom cast parts. From 2014 to 2017, Mr. Miketo served as CEO/President at Air Enterprises, a privately held manufacturer of specialty air handling equipment. Prior to joining us in 2008, Mr. Miketo managed all product development, manufacturing and materials planning for Ranpak, a manufacturer and distributor of machines and paper packaging materials in North America and Europe. Mr. Miketo holds a Bachelor of Science in Chemical Engineering from Rose-Hulman Institute of Technology of Terre Haute, Indiana.
ITEM 1A. RISK FACTORS
Forward-Looking Statements
We make forward-looking statements in Management's Discussion and Analysis of Financial Condition and Results of Operations and elsewhere in this report based on the beliefs and assumptions of our management and on information currently available to us. Forward-looking statements include information about our possible or assumed future results of operations, which follow under the headings "Business", "Liquidity and Capital Resources", and other statements throughout this report preceded by, followed by or that include the words "believes", "expects", "anticipates", "intends", "plans", "estimates" or similar expressions.
Any number of risks and uncertainties could cause actual results to differ materially from those we express in our forward-looking statements, including the risks and uncertainties we describe below and other factors we describe from time to time in our periodic filings with the SEC. We therefore caution you not to rely unduly on any forward-looking statement. The forward-looking statements in this report speak only as of the date of this report, and we undertake no obligation to update or revise any forward-looking statement, whether as a result of new information, future developments, or otherwise.
Risks and Uncertainties
We are subject to various risks that could materially and adversely affect our business, results of operations, cash flow, liquidity, or financial condition. You should understand that these risks could cause results to differ materially from those we express in forward-looking statements contained in this report or in other Company communications, including those we file from time to time with the SEC. Because there is no way to determine in advance whether, or to what extent, any present uncertainty will ultimately impact our business, you should give equal weight to each of the following:
10
Adverse Changes in General Business and Economic Conditions in the United States and Worldwide May Adversely Affect Our Results of Operations, Cash Flow, Liquidity or Financial Condition
Our business is sensitive to global and regional business and economic conditions. Adverse changes in such conditions in the United States and worldwide may reduce the demand for some of our products and impair the ability of those with whom we do business to satisfy their obligations to us, each of which could adversely affect our results of operations, cash flow, liquidity or financial condition. Higher inflation rates, interest rates, tax rates and unemployment rates, higher labor and healthcare costs, recessions, changing governmental policies, laws and regulations, and other economic factors could also adversely affect demand for some of our products and our results of operations, cash flow, liquidity or financial condition and that of our customers, vendors and suppliers.
A Weakening or Reversal of the General Economic Recovery in the United States and Other Countries and Regions in Which We Do Business, or the Continuation or Worsening of Economic Downturns in Other Countries and Regions, May Adversely Affect Our Results of Operations, Cash Flow, Liquidity or Financial Condition
Global economic uncertainty continues to exist. A weakening or reversal of the general economic recovery in the United States and other countries and regions in which we do business, or the continuation or worsening of economic downturns in other countries and regions, may adversely impact our net sales, the collection of accounts receivable, funding for working capital needs, expected cash flow generation from current and acquired businesses, and our investments, which may adversely impact our results of operations, cash flow, liquidity or financial condition.
We finance a portion of our sales through trade credit. Credit markets remain tight, and some customers who require financing for their businesses have not been able to obtain necessary financing. A continuation or worsening of these conditions could limit our ability to collect our accounts receivable, which could adversely affect our results of operations, cash flow, liquidity or financial condition.
We generally fund a portion of our seasonal working capital needs and obtain funding for other general corporate purposes through short-term borrowings backed by our revolving credit facility. If any of the banks in these credit and financing facilities are unable to perform on their commitments, such inability could adversely impact our cash flow, liquidity or financial condition, including our ability to obtain funding for working capital needs and other general corporate purposes.
Although we currently have available credit facilities to fund our current operating needs, we cannot be certain we will be able to replace our existing credit facilities or refinance our existing or future debt when necessary. Our cost of borrowing and ability to access the capital markets are affected not only by market conditions, but also by our debt and credit ratings assigned by the major credit rating agencies. Downgrades in these ratings will increase our cost of borrowing and could have an adverse effect on our access to these facilities which, in turn, could have a material adverse effect on our results of operations, cash flow, liquidity or financial condition.
We have goodwill and intangible assets recorded on our balance sheet. We periodically evaluate the recoverability of the carrying value of our goodwill and intangible assets whenever events or changes in circumstances indicate such value may not be recoverable. An impairment assessment involves judgment as to assumptions regarding future sales and cash flow and the impact of market conditions on those assumptions. Future events and changing market conditions may impact our assumptions and change our estimates of future sales and cash flow, resulting in us incurring substantial impairment charges, which would adversely affect our results of operations or financial condition.
Increases in the Cost of Raw Materials and Energy May Adversely Affect Our Earnings or Cash Flow
We purchase raw materials and energy for use in the manufacturing, distribution and sale of our products. Factors such as political instability, higher tariffs and adverse weather conditions, including hurricanes, and other natural disasters can disrupt raw material and fuel supplies and increase our costs. Although raw materials and energy supplies (including oil and natural gas) are generally available from various sources in sufficient quantities, unexpected shortages and increases in the cost of raw materials and energy, or any deterioration in our relationships with or the financial viability of our suppliers, may have an adverse effect on our earnings or cash flow in the event we are unable to offset higher costs in a timely manner by sufficiently decreasing our operating costs or raising the prices of our products. In recent years, some raw material and energy prices have increased, particularly silicon and plastic packaging. The cost of raw materials and energy has in the past experienced, and likely will in the future continue to experience, periods of volatility.
11
Risks Related to Doing Business in the PRC
Presently, we manufacture a majority of our products in our factories in the PRC. Additionally, many of our contract manufacturers are located in the PRC. Doing business in the PRC carries a number of risks including the following:
Changes in the policies of the PRC government may have a significant impact upon the business we may be able to conduct in the PRC and the profitability of such business.
Our business operations may be adversely affected by the current and future political environment in the PRC. The government of the PRC has exercised and continues to exercise substantial control over virtually every sector of the Chinese economy, through regulation and state ownership. Our ability to operate in the PRC may be adversely affected by changes in Chinese laws and regulations, including those relating to taxation, labor and social insurance, import and export tariffs, raw materials, environmental regulations, land use rights, property and other matters.
The PRC laws and regulations governing our current business operations are sometimes vague and uncertain. Any changes in such PRC laws and regulations may harm our business.
There are substantial uncertainties regarding the interpretation and application of PRC laws and regulations, including but not limited to the laws and regulations governing our business, or the enforcement and performance of our arrangements with customers in the event of the imposition of statutory liens, death, bankruptcy and criminal proceedings. We cannot predict what effect the interpretation of existing or new PRC laws or regulations may have on our business. If the relevant authorities find that we are in violation of PRC laws or regulations, they would have broad discretion in dealing with such a violation, including, without limitation:
• | levying fines; |
• | revoking our business and other licenses; |
• | requiring that we restructure our ownership or operations; and |
• | requiring that we discontinue any portion or all of our business. |
The fluctuation of the Chinese Yuan Renminbi may harm your investment.
Under Chinese monetary policy, the Chinese Yuan Renminbi is permitted to fluctuate within a managed band against a basket of certain foreign currencies and has resulted in increased volatility in the exchange rate the Chinese Yuan Renminbi against the U.S. Dollar. While the international reaction to the Chinese Yuan Renminbi revaluation has been positive, there remains international pressure on the PRC government to adopt an even more flexible currency policy, which may result in a further and more significant appreciation of the Chinese Yuan Renminbi against the U.S. Dollar, which could lead to higher manufacturing costs for our products.
The PRC's legal and judicial system may not adequately protect our business and operations and the rights of foreign investors.
The PRC legal and judicial system may negatively impact foreign investors, with enforcement of existing laws inconsistent. In addition, the promulgation of new laws, changes to existing laws and the pre-emption of local regulations by national laws may adversely affect foreign investors.
Availability of adequate workforce levels
Presently, the vast majority of workers at our PRC factories are obtained from third-party employment agencies. As the labor laws, social insurance and wage levels continue to grow and the workers become more sophisticated, our costs to employ these and other workers in the PRC may grow beyond that anticipated by management. While we have already experienced increases in labor rates in the PRC, as the PRC market continues to open up and grow, we may experience an increase in competition for the same workers, resulting in either an inability to attract and retain an adequate number of qualified workers or an increase in our employment costs to obtain and retain these workers.
Risks and Uncertainties Associated with Our Expansion Into and Our Operations Outside of the United States May Adversely Affect Our Results of Operations, Cash Flow, Liquidity or Financial Condition
Net external sales of our consolidated foreign subsidiaries totaled approximately 40.9%, 48.2% and 44.3% of our total consolidated net sales in 2019, 2018 and 2017, respectively. We expect that the international share of our total revenues will continue to make up a significant part of our current business and future strategic plans. Additionally, we operate factories in the PRC, Brazil and Mexico, as well as an engineering center in India. As a result, we are increasingly exposed to the challenges and risks of doing business outside the United States, which could reduce our revenues or profits, increase our costs, result in significant liabilities or sanctions, or otherwise disrupt our business. These challenges include: (1) compliance with complex and changing laws, regulations and policies of governments that may impact our operations, such as foreign ownership restrictions, import and export controls, tariffs, and trade restrictions; (2) compliance with U.S. and foreign laws that affect the activities of companies abroad, such as anti-corruption laws, competition laws, currency regulations, and laws affecting dealings with certain nations; (3) limitations
12
on our ability to repatriate non-U.S. earnings in a tax effective manner; (4) the difficulties involved in managing an organization doing business in many different countries; (5) uncertainties as to the enforceability of contract and intellectual property rights under local laws; (6) rapid changes in government policy, political or civil unrest in the Middle East and elsewhere, acts of terrorism, or the threat of international boycotts or U.S. anti-boycott legislation; and (7) currency exchange rate fluctuations.
We are also exposed to risks relating to U.S. policy with respect to companies doing business in foreign jurisdictions, particularly in light of the current U.S. presidential administration. For example, the passage of the Tax Cuts and Jobs Act (the "Tax Act") on December 22, 2017, significantly changed U.S. income tax law. In 2019, federal and state tax authorities issued additional guidance related to transition tax, GILTI, deduction for foreign-derived intangible income and GILTI, tax treatment of qualified transportation fringe benefits, timing of income recognition, cost recovery and bonus depreciation, and business interest expense limitation. This guidance generally provided additional information related to the calculation of such items that became effective in 2017 and 2018. We reviewed and applied the guidance in the period such information was published. The application of the issued guidance in 2019 did not materially change our tax expense estimated in prior years. In addition, the current U.S. presidential administration has introduced greater uncertainty with respect to future trade regulations and trade agreements. Changes in tax policy, trade regulations or trade agreements could have a material adverse effect on our business and results of operations.
Failure by Our International Operations to Comply With Anti-Corruption Laws or Trade Sanctions Could Increase Our Costs, Reduce Our Profits, Limit Our Growth, Harm Our Reputation, or Subject Us to Broader Liability
We are subject to restrictions imposed by the U.S. Foreign Corrupt Practices Act and anti-corruption laws and regulations of other countries applicable to our operations. Anti-corruption laws and regulations generally prohibit companies and their intermediaries from making improper payments to government officials or other persons in order to receive or retain business. The compliance programs, internal controls and policies we maintain and enforce to promote compliance with applicable anti-bribery and anti-corruption laws may not prevent our associates, contractors or agents from acting in ways prohibited by these laws and regulations. We are also subject to trade sanctions administered by the Office of Foreign Assets Control and the U.S. Department of Commerce. Our compliance programs and internal control policies and procedures may not prevent conduct that is prohibited under these rules. The United States may impose additional sanctions at any time against any country in which or with whom we do business. Depending on the nature of the sanctions imposed, our operations in the relevant country could be restricted or otherwise adversely affected. Any violations of anti-corruption laws and regulations or trade sanctions could result in significant civil and criminal penalties, reduce our profits, disrupt our business or damage our reputation. In addition, an imposition of further restrictions in these areas could increase our cost of operations, reduce our profits or cause us to forgo development opportunities that would otherwise support growth.
Policy Changes Affecting International Trade Could Adversely Impact the Demand for Our Products and Our Competitive Position
Due to the international scope of our operations, changes in government policies on foreign trade and investment may affect the demand for our products and services, impact the competitive position of our products or prevent us from being able to sell products in certain countries. Our business benefits from free trade agreements, such as the North American Free Trade Agreement and successor agreements, which may include the United States-Mexico-Canada Agreement, and efforts to withdraw from, or substantially modify such agreements, in addition to the implementation of more restrictive trade policies, such as more detailed inspections, higher tariffs, import or export licensing requirements, exchange controls or new barriers to entry, could have a material adverse effect on our results of operations, financial condition or cash flow and that of our customers, vendors and suppliers.
Additionally, the United Kingdom’s anticipated exit from the European Union has caused and may continue to cause significant volatility in global stock markets, currency exchange rate fluctuations and global economic uncertainty. Although it is unknown what the terms of the United Kingdom’s future relationship with the European Union will be, it is possible there will be greater restrictions on imports and exports between the United Kingdom and the European Union and increased regulatory complexities. Any of these factors could adversely impact customer demand, our relationships with customers and suppliers and our results of operations.
Fluctuations in Foreign Currency Exchange Rates or Interest Rates May Adversely Affect Our Results of Operations, Cash Flow, Liquidity or Financial Condition
Because of our international operations, we are exposed to risk associated with interest rates and value changes in foreign currencies, which may adversely affect our business. Historically, our reported net sales, earnings, cash flow and financial condition have been subjected to fluctuations in foreign exchange rates. Our exchange rate exposure is in the Argentinian Peso, Brazilian Real, British Pound, Chinese Yuan Renminbi, Euro, Hong Kong Dollar, Indian Rupee, Japanese Yen, Korean Won, Mexican Peso and Philippine Peso. While we actively manage the exposure of our foreign currency risk as part of our overall financial risk management policy, we believe we may experience losses from foreign currency exchange rate fluctuations, and such losses may adversely affect our sales, earnings, cash flow, liquidity or financial condition.
13
In addition, under the Second Amended and Restated Credit Agreement ("Second Amended Credit Agreement") with U.S. Bank National Association ("U.S. Bank"), we may elect to pay interest on the revolving line of credit ("Credit Line") based on LIBOR or a base rate as specified in the Second Amended Credit Agreement. On July 27, 2017, the Financial Conduct Authority (the authority that regulates LIBOR) announced that it intends to stop compelling banks to submit rates for the calculation of LIBOR after 2021 and it is unclear whether new methods of calculating LIBOR will be established. If LIBOR ceases to exist after 2021, a comparable or successor reference rate as approved by the parties under the Second Amended Credit Agreement will apply. The U.S. Federal Reserve, in conjunction with the Alternative Reference Rates Committee, is considering replacing U.S. Dollar LIBOR with a newly created index, calculated based on repurchase agreements backed by treasury securities. It is not possible to predict the effect of these changes, other reforms or the establishment of alternative reference rates in the United States or elsewhere. To the extent these interest rates increase, our interest expense will increase, which could adversely affect our financial condition, operating results and cash flows.
Risks Relating to Adverse Weather Conditions and Natural or Man-made Disasters, Contagious Diseases, Terrorist Activity, and War May Adversely Affect Our Business, Financial Condition and Results of Operations
Our ability, including manufacturing or distribution capabilities, and that of our suppliers, business partners and contract manufacturers, to make, move and sell products is critical to our success. From time to time, adverse weather conditions and natural disasters, as well as the potential spread of contagious diseases in locations where we or they own or operate significant operations, could cause a disruption in our third-party manufacturers' or our suppliers' production and distribution capabilities or a decline in demand for our products and services. In addition, actual or threatened war, terrorist activity, political unrest, or civil strife, such as recent events in Ukraine and Russia, the Middle East, North Korea and other geopolitical uncertainty could have a similar effect. Any one or more of these events may reduce our ability to produce or sell our products which may adversely affect our business, financial condition and results of operations, as well as require additional resources to restore our supply chain.
Dependence on Foreign Manufacturing
Although we own and operate factories in the PRC, Brazil and Mexico, third-party manufacturers located in Asia continue to manufacture a portion of our products. Our arrangements with these foreign manufacturers are subject to the risks of doing business abroad, such as tariffs, environmental and trade restrictions, intellectual property protection and enforcement, export license requirements, work stoppages, political and social instability, economic and labor conditions, foreign currency exchange rate fluctuations, changes in laws and policies (including fiscal policies), and other factors, which may have a material adverse effect on our business, results of operations and cash flows. We believe that the loss of any one or more of our manufacturers would not have a long-term material adverse effect on our business, results of operations and cash flows, because numerous other manufacturers are available to fulfill our requirements; however, the loss of any of our major third-party manufacturers may adversely affect our business, operating results, financial condition and cash flows until alternative manufacturing arrangements are secured.
Dependence upon Key Suppliers
Most of the components used in our products are available from multiple sources. However, we purchase integrated circuits, used principally in our wireless control products, from a small number of key suppliers. To reduce our dependence on our integrated circuit suppliers we continually seek additional sources. We maintain inventories of our integrated circuits, which may be used in part to mitigate, but not eliminate, delays resulting from supply interruptions.
We have identified alternative sources of supply for our integrated circuit, component parts, and finished goods needs; however, there can be no assurance that we will be able to continue to obtain these inventory purchases on a timely basis. Any extended interruption, shortage or termination in the supply of any of the components used in our products, or a reduction in their quality or reliability, or a significant increase in prices of components, would have an adverse effect on our operating results, financial position and cash flows.
Patents, Trademarks, and Copyrights
We have numerous patents, trade secrets, trademarks, trade names, and know-how that are valuable to our business. However, the procedures by which we identify, document, and file for patent, trademark, and copyright protection are based solely on engineering and management judgment, with no assurance that a specific filing will be issued, or if issued, will deliver any lasting value to us. Because of the rapid innovation of products and technologies that is characteristic of our industry, there can be no assurance that rights granted under any patent will provide competitive advantages to us or will be adequate to safeguard and maintain our proprietary rights. We further believe that our business is not materially dependent upon any single patent, trade secret, trademark, trade name, copyright, and know-how. Despite our efforts to protect such intellectual property and other proprietary information from unauthorized use or disclosure, third parties may attempt to disclose, obtain or use our intellectual property and information
14
without our authorization. Although we rely on the patent, trademark, trade secret and copyright laws of the United States and other countries to protect our intellectual property rights, the laws of some countries may not protect such rights to the same extent as the laws of the United States. Unauthorized use of our intellectual property by third parties, the failure of foreign countries to have laws to protect our intellectual property rights, or an inability to effectively enforce such rights in foreign countries could have an adverse effect on our business.
Further, some of our products include or use technology and/or components of third parties. While it may be necessary in the future to seek or renew licenses relating to various aspects of such products, we believe that, based upon past experience and industry practice, such licenses may be obtained on commercially reasonable terms; however, there can be no guarantee that such licenses may be obtained on such terms or at all. Because of technological changes in the wireless and home control industry, current extensive patent coverage, and the rapid rate of issuance of new patents, it is possible certain components of our products and business methods may unknowingly infringe upon the patents of others.
Potential for Litigation
As is typical in our industry and for the nature and kind of business in which we are engaged, from time to time various claims, charges and litigation are asserted or commenced by third parties against us or by us against third parties, arising from or related to product liability, infringement of patent or other intellectual property rights, breach of warranty, contractual relations or employee relations. The amounts claimed may be substantial, but they may not bear any reasonable relationship to the merits of the claims or the extent of any real risk of court awards assessed against us or in our favor.
Technology Changes in Wireless Control and Sensing
We currently derive substantial revenue from the sale of wireless remote controls, sensors and home automation products based on IR and RF and other technologies. Other control technologies exist or may be developed that may compete with this technology. In addition, we develop and maintain our own database of IR and RF codes. There are other IR and RF libraries offered by companies that we compete with in the marketplace. The advantage that we may have compared to our competitors is difficult to measure. In addition, if competing wireless control and sensing technology and products gain acceptance and start to be integrated into home electronics devices and home security and automation products that are currently utilizing our remote controllers and sensors, demand for our products may decrease, resulting in decreased operating results, financial condition, and cash flows.
Our Technology Development Activities May Experience Delays
We may experience technical, financial, resource or other difficulties or delays related to the further development of our technologies. Delays may have adverse financial effects and may allow competitors with comparable technology offerings to gain an advantage over us in the marketplace or in the standards setting arena. There can be no assurance that we will continue to have adequate staffing or that our development efforts will ultimately be successful. Moreover, certain of our technologies have not been fully tested in commercial use, and it is possible that they may not perform as expected. In such cases, our business, financial condition and operating results may be adversely affected, and our ability to secure new licensees and other business opportunities may be diminished.
Change in Competition and Pricing
Even with having our own factories, we will continue to rely on third-party manufacturers to build a portion of our universal wireless control products. Price is always an issue in winning and retaining business. If customers become increasingly price sensitive, new competition may arise from manufacturers who decide to go into direct competition with us or from current competitors who perform their own manufacturing. If such a trend develops, we may experience downward pressure on our pricing or lose sales, which may have a material adverse effect on our operating results, financial condition and cash flows.
Risks Related to Adverse Changes in General Business and Economic Conditions
Adverse changes in general business and economic conditions in the United States and worldwide may reduce the demand for some of our products and adversely affect our results of operations, cash flow, liquidity or financial condition. Higher inflation rates, interest rates, tax rates and unemployment rates, higher labor and health care costs, recessions, changing governmental policies, laws and regulations, increased tariffs, and other economic factors may adversely affect our results of operations, cash flow, liquidity or financial condition. Any such changes may impact our business in a number of ways, including:
Potential deferment of purchases and orders by customers and cyclical nature of portions of our business
Uncertainty about current and future global economic conditions may cause consumers, businesses and governments to defer purchases in response to tighter credit, decreased cash availability and declining consumer confidence. Accordingly, future demand for our products may differ materially from our current expectations.
15
In addition, portions of our business involve the sale of products to sectors of the economy that are cyclical in nature, particularly the retail sector. Our sales to these sectors are affected by the levels of discretionary consumer and business spending. During economic downturns, the levels of consumer and business discretionary spending in these sectors may decrease, and the recovery of these sectors may lag behind the recovery of the overall economy. This decrease in spending will likely reduce the demand for some of our products and may adversely affect our sales, earnings, cash flow or financial condition. Although many of our end markets have shown signs of stabilization and modest improvement from the recent global economic downturn, the recovery has been erratic. A worsening in these sectors may cause a reduction in the demand for some of our products and may adversely impact sales, earnings, cash flow and financial condition.
Customers' inability to obtain financing to make purchases from us and/or maintain their business
Some of our customers require substantial financing in order to fund their operations and make purchases from us. The inability of these customers to obtain sufficient credit to finance purchases of our products may adversely impact our financial results. In addition, an economic downturn could result in insolvencies for our customers, which may adversely impact our financial results.
Potential impact on trade receivables
Credit market conditions may slow our collection efforts as customers experience increased difficulty in obtaining requisite financing, leading to higher than normal accounts receivable balances and longer days sales outstanding. Continuation of these conditions may limit our ability to collect our accounts receivable, which may result in greater expense associated with collection efforts and increased bad debt expense.
Negative impact from increased financial pressures on key suppliers
Our ability to meet customers' demands depends, in part, on our ability to obtain timely and adequate delivery of quality materials, parts and components from our suppliers. Certain of our components are available only from a single source or limited sources. If certain key suppliers were to become capacity constrained or insolvent as a result of an economic downturn, it may result in a reduction or interruption in supplies or a significant increase in the price of supplies and adversely impact our financial results. In addition, credit constraints at key suppliers may result in accelerated payment of accounts payable by us, impacting our cash flow.
Potential Fluctuations in Quarterly Results
We may from time to time increase our operating expenses to fund greater levels of R&D, sales and marketing activities, development of new distribution channels, improvements in our operational and financial systems and development of our customer support capabilities, and to support our efforts to comply with various government regulations. To the extent such expenses precede or are not subsequently followed by increased revenues, our business, operating results, financial condition and cash flows will be adversely affected.
In addition, we may experience significant fluctuations in future quarterly operating results that may be caused by many other factors, including demand for our products, introduction or enhancement of products by us and our competitors, the loss or acquisition of any significant customers, market acceptance of new products, price reductions by us or our competitors, mix of distribution channels through which our products are sold, product or supply constraints, level of product returns, mix of customers and products sold, component pricing, mix of international and domestic revenues, foreign currency exchange rate fluctuations and general economic conditions. In addition, as a strategic response to changes in the competitive environment, we may from time to time make certain pricing or marketing decisions or acquisitions that may have a material adverse effect on our business, results of operations or financial condition. As a result, we believe period-to-period comparisons of our results of operations are not necessarily meaningful and should not be relied upon as an indication of future performance.
Due to all of the foregoing factors, it is possible that in some future quarters our operating results will be below the expectations of public market analysts and investors. If this happens the price of our common stock may be materially adversely affected.
Our Ability to Generate Cash Depends on Many Factors Beyond Our Control. We Also Depend on the Business of Our Subsidiaries to Satisfy Our Cash Needs
Our historical financial results have been, and we anticipate that our future financial results will be, subject to fluctuations. Our ability to generate cash is subject to general economic, financial, competitive, legislative, regulatory and other factors that are beyond our control. We cannot assure you that our business will generate sufficient cash flow from our operations or that future borrowings will be available to us in an amount sufficient to enable us to make payments of our debt, fund our other liquidity needs and make planned capital expenditures.
16
The degree to which we are currently leveraged could have important consequences for shareholders. For example, it could:
• | require us to dedicate a substantial portion of our cash flow from operations to the payment of debt service, reducing the availability of our cash flow to fund working capital, capital expenditures, acquisitions and other general corporate purposes; |
• | increase our vulnerability to adverse economic or industry conditions; |
• | limit our ability to obtain additional financing in the future to enable us to react to changes in our business; or |
• | place us at a competitive disadvantage compared to businesses in our industry that have less debt. |
A significant portion of our operations are conducted through our subsidiaries. As a result, our ability to generate sufficient cash flow for our needs is dependent on the earnings of our subsidiaries and the payment of those earnings to us in the form of dividends, loans or advances and through repayment of loans or advances from us. Our subsidiaries are separate and distinct legal entities. Our subsidiaries have no obligation to pay any amounts due on our debt or to provide us with funds to meet our cash flow needs, whether in the form of dividends, distributions, loans or other payments. In addition, any payment of dividends, loans or advances by our subsidiaries may be subject to statutory or contractual restrictions. Payments to us by our subsidiaries will also be contingent upon our subsidiaries' earnings and business considerations. Our right to receive any assets of any of our subsidiaries upon their liquidation or reorganization will be effectively subordinated to the claims of that subsidiary's creditors, including trade creditors. In addition, even if we are a creditor of any of our subsidiaries, our rights as a creditor would be subordinate to any security interest in the assets of our subsidiaries and any indebtedness of our subsidiaries senior to that held by us. Further, changes in the laws of foreign jurisdictions in which we operate may adversely affect the ability of some of our foreign subsidiaries to repatriate funds to us.
In addition, we may fund a portion of our seasonal working capital needs and obtain funding for other general corporate purposes through short-term borrowings backed by our revolving credit facility. If any of the banks in these credit and financing facilities are unable to perform on their commitments, which may adversely affect our ability to fund seasonal working capital needs and obtain funding for other general corporate purposes, our cash flow, liquidity or financial condition may be adversely impacted. Although we currently have available credit facilities to fund our current operating needs, we cannot be certain that we will be able to replace our existing credit facilities or refinance our existing or future debt when necessary. Our cost of borrowing and ability to access the capital markets are affected not only by market conditions, but also by our debt and credit ratings assigned by the major credit rating agencies. Downgrades in these ratings will increase our cost of borrowing and may have an adverse effect on our access to the capital markets, including our access to the commercial paper market. An inability to access the capital markets may have a material adverse effect on our results of operations, cash flow, liquidity or financial condition. Additionally, any failure to comply with covenants in the instruments governing our debt could result in an event of default which, if not cured or waived, would have a material adverse effect on us.
The Price of Our Common Stock is Volatile and May Decline Regardless of Our Operating Performance
Historically, we have had large fluctuations in the price of our common stock, and such fluctuations may continue. The market price for our common stock is volatile and may fluctuate significantly in response to a number of factors, most of which we cannot control, including:
• | the public's response to press releases or other public announcements by us or third parties, including our filings with the SEC and announcements relating to product and technology development, relationships with new and existing customers, litigation and other legal proceedings in which we are involved and intellectual property impacting us or our business; |
• | announcements concerning strategic transactions, such as spin-offs, joint ventures and acquisitions or divestitures; |
• | the financial projections we may provide to the public, any changes in these projections or our failure to meet these projections; |
• | changes in financial estimates or ratings by any securities analysts who follow our common stock, our failure to meet these estimates or failure of those analysts to initiate or maintain coverage of our common stock; |
• | investor perceptions as to the likelihood of achievement of near-term goals; |
• | changes in market share of significant customers; |
• | changes in operating performance and stock market valuations of other technology or content providing companies generally; and |
• | market conditions or trends in our industry or the economy as a whole. |
In the past, stockholders have instituted securities class action litigation following periods of market volatility. If we were involved in securities litigation, we may incur substantial costs and our resources and the attention of management may be diverted from our business.
17
In addition, our officers and directors periodically sell shares of our common stock which they own, many times pursuant to trading plans established under Rule 10b5-1 of the Securities Exchange Act of 1934, as amended, or the Exchange Act. Sales of shares by our officers and directors may not be indicative of their respective opinions of our performance at the time of sale or of our potential future performance. Nonetheless, the market price of our stock may be affected by such sales of shares by our officers and directors.
If Securities or Industry Analysts Fail to Continue Publishing Research About Our Business, Our Stock Price and Trading Volume May Decline
The trading market for our common stock has historically been at low volumes and is influenced by the research and reports that industry or securities analysts publish about us or our business. If one or more of these analysts cease coverage of our company or fail to publish reports on us regularly, we may lose visibility in the financial markets, which in turn may cause our stock price or trading volume to decline.
Future Sales of Our Equity May Depress the Market Price of Our Common Stock
We have several institutional stockholders that own significant blocks of our common stock. If one or more of these stockholders were to sell large portions of their holdings in a relatively short time, for liquidity or other reasons, the prevailing market price of our common stock may be negatively affected. Further, due to our historically low trading volumes, such large stockholders may not be able to sell the number of shares they wish to sell and/or in the time frame in which they wish to sell. Moreover, while such large stockholders are attempting to sell their shares, other stockholders may not be able to sell their shares at the price and time that such other stockholders desire due to the low trading volumes of our stock. Additionally, in March 2016, we issued common stock purchase warrants to Comcast to purchase up to 725,000 shares of our common stock at a price of $54.55 per share. The right to exercise the warrants is subject to vesting over three successive two-year periods (the third two-year period commenced on January 1, 2020 and ends on December 31, 2021) based on the level of purchases of goods and services from us by Comcast and its affiliates, as defined in the warrants. To the extent that the warrants vest and Comcast exercises the warrants and sells any of the shares of common stock issuable upon exercise, or the perception that such sales may occur, could adversely affect the market price and/or trading volume of our common stock. Based upon the volume of goods and services purchased by Comcast during the first and second two-year period which ended on December 31, 2017 and December 31, 2019, Comcast vested in 175,000 and 100,000 of the warrants, respectively.
Approved Stock Repurchase Programs May Not Result in a Positive Return of Capital to Stockholders
Periodically, our Board approves programs to repurchase our common stock based upon an assessment of then current value as compared to then trading ranges and investor analyst reports. Also considered in this decision is the effect any such repurchases may have on our cash balances and needs, cash flow, and short- and long-term borrowing. Our stock price has experienced substantial price volatility in the past and may continue to do so in the future. Additionally, we, the technology industry and the stock market as a whole have experienced extreme stock price and volume fluctuations that have affected stock prices in ways that may have been unrelated to our and these companies’ operating performance. Price volatility over a given period may cause the average price at which we repurchase our own stock to exceed the stock’s price at a given point in time. While we believe our stock price should reflect expectations of future growth and profitability, we also believe our stock price should reflect expectations that our share repurchase program will be fully consummated even though our share repurchase program does not obligate us to acquire any specific number of shares. If we fail to meet expectations related to future growth, profitability, share repurchases or other market expectations, our stock price may decline significantly, which could have a material adverse impact on investor confidence.
Dependence on Consumer Preference
We are susceptible to fluctuations in our business based upon consumer demand for our products. In addition, we cannot guarantee that increases in demand for our products associated with increases in the deployment of new technology will continue. We believe that our success depends on our ability to anticipate, gauge and respond to fluctuations in consumer preferences. However, it is impossible to predict with complete accuracy the occurrence and effect of fluctuations in consumer demand over a product's life cycle. Moreover, any growth in revenues that we achieve may be transitory and should not be relied upon as an indication of future performance.
Demand for Consumer Service and Support
We have continually provided domestic and international consumer service and support to our customers to add overall value and to help differentiate us from our competitors. We continually review our service and support group and are marketing our expertise in this area to other potential customers. There can be no assurance that we will be able to attract new customers in the future.
18
In addition, certain of our products have more features and are more complex than others and therefore require more end-user technical support. In some instances, we rely on distributors or dealers to provide the initial level of technical support to the end-users. We provide the second level of technical support for bug fixes and other issues at no additional charge. Therefore, as the mix of our products includes more of these complex product lines, support costs may increase, which may have an adverse effect on our business, operating results, financial condition and cash flows.
Dependence upon New Product Introduction
Our ability to remain competitive in the wireless control, AV accessory, home security and home automation markets will depend considerably upon our ability to successfully identify new product opportunities, as well as develop and introduce these products and enhancements on a timely and cost effective basis. There can be no assurance that we will be successful at developing and marketing new products or enhancing our existing products, or that these new or enhanced products will achieve consumer acceptance and, if achieved, will sustain that acceptance. In addition, there can be no assurance that products developed by others will not render our products non-competitive or obsolete or that we will be able to obtain or maintain the rights to use proprietary technologies developed by others which are incorporated in our products. Any failure to anticipate or respond adequately to technological developments and customer requirements, or any significant delays in product development or introduction, may have a material adverse effect on our operating results, financial condition and cash flows.
In addition, the introduction of new products may require significant expenditures for R&D, tooling, manufacturing processes, inventory and marketing. In order to achieve high volume production of any new product, we may have to make substantial investments in inventory and expand our production capabilities.
Dependence on Major Customers
The economic strength and weakness of our worldwide customers affect our performance. We sell our wireless control products, AV accessory products, and proprietary technologies to subscription broadcasters, OEMs, retailers and private label customers. We also supply our products to our wholly owned, non-U.S. subsidiaries and to independent foreign distributors, who in turn distribute our products worldwide.
While we generally have a broad and varied customer base, during the years ended December 31, 2019, and 2018, Comcast accounted for sales totaling more than 10% of our net sales. In addition to this customer, we have some customers that, individually, purchase a large amount of products from us. Although our broad distribution channels help to minimize the impact of the loss of any one customer, the loss of any of these large individual customers, or our inability to maintain order volume with these customers, may have an adverse effect on our sales, operating results, financial condition and cash flows.
Outsourced Labor
We continue to use outside resources to assist us in the development of some of our products and technologies. While we believe that such outside services will continue to be available to us, if they cease to be available, the development of these products and technologies may be substantially delayed, which may have a material adverse effect on our operating results, financial condition and cash flows.
Disruptions Caused by Labor Disputes or Organized Labor Activities Could Materially Harm our Business and Reputation
Currently, approximately 2,000 of our Brazil and Mexico employees are represented by labor unions. Disputes with the current labor unions or new union organizing activities could lead to production slowdowns or stoppages and make it difficult or impossible for us to meet scheduled delivery times for product shipments to some of our customers, which could result in a loss of business and material damage to our reputation. In addition, union activity and compliance with international labor standards could result in higher labor costs, which could have a material adverse effect on our financial position and results of operations.
Competition
Competition within the wireless control industry is based primarily on product availability, price, speed of delivery, ability to tailor specific solutions to customer needs, quality, and depth of product lines. Our competition is fragmented across our products, and, accordingly, we do not compete with any one company across all product lines. We compete with a variety of entities, some of which have greater financial resources. Other competitors are smaller and may be able to offer more specialized products. Our ability to remain competitive in this industry depends in part on our ability to successfully identify new product opportunities, develop and introduce new products and enhancements on a timely and cost effective basis, as well as our ability to successfully identify and enter into strategic alliances with entities doing business within the industries we serve. Competition in any of these areas may reduce our sales and adversely affect our earnings or cash flow by resulting in decreased sales volumes, reduced prices and increased costs of manufacturing, distributing and selling our products. There can be no assurance that our product offerings
19
will be, and/or will remain, competitive or that strategic alliances, if any, will achieve the type, extent, and amount of success or business that we expect them to achieve. The sales of our products and technology may not occur or grow in the manner we expect, and thus we may not recoup costs incurred in the R&D of these products as quickly as we expect, if at all.
The home security and automation industry is highly fragmented and subject to significant competition and pricing pressures. In particular, the monitored security industry providers have highly recognized brands which may drive increased awareness of their security/automation offerings rather than ours, have access to greater capital and resources than us, and may spend significantly more on advertising, marketing and promotional resources which could have a material adverse effect on our ability to drive awareness and demand for our products and services. In addition, cable and telecommunications companies have expanded into the monitored security industry and are bundling their existing offerings with monitored security services. We also face competition from DIY companies that are increasingly providing products which enable customers to self-monitor and control their environments without third-party involvement. Further, DIY providers may also offer professional monitoring with the purchase of their systems and equipment or new IoT devices and services with automated features and capabilities that may be appealing to customers. Continued pricing pressure, improvements in technology and shifts in customer preferences towards self-monitoring or DIY could adversely impact our customer base and/or pricing structure and have a material adverse effect on our business, financial condition, results of operations and cash flows.
We are Exposed to Greater Risks of Liability for Omissions or System Failures
If a customer or third party believes that he or she has suffered harm to person or property due to an actual or alleged security system failure, he or she (or their insurers) may pursue legal action against us, and the cost of defending the legal action and of any judgment against us could be substantial. In particular, because some of our products and services are intended to help protect lives and real and personal property, we may have greater exposure to litigation risks than businesses that provide other consumer and small business products and services. While our customer contracts contain a series of risk-mitigation provisions that are aimed at limiting our liability and/or limiting a claimant’s ability to pursue legal action against us, in the event of litigation with respect to such matters it is possible that these risk-mitigation provisions may be deemed not applicable or unenforceable and, regardless of the ultimate outcome, we may incur significant costs of defense that could materially and adversely affect our business, financial condition, results of operations and cash flows.
Environmental Matters
Many of our products are subject to various federal, state, local and international laws governing chemical substances in products, including laws regulating the manufacture and distribution of chemical substances and restricting the presence of certain substances in electronics products. In addition, many of these laws and regulations make producers of electrical goods responsible for collection, recycling, treatment and disposal of recovered products. As a result, we may face significant costs and liabilities in complying with these laws and any future laws and regulations or enforcement policies that may have a material adverse effect upon our operating results, financial condition, and cash flows.
Leased Property
We lease all of the properties used in our business. We can give no assurance that we will enter into new or renewal leases, or that, if entered into, the new lease terms will be similar to the existing terms or that the terms of any such new or renewal leases will not have a significant and material adverse effect on our operating results, financial condition and cash flows.
Transportation Costs and Impact of Oil Prices
We ship products from our factories and foreign manufacturers via ocean and air transport. It is sometimes difficult to forecast swings in demand or delays in production and, as a result, products may be shipped via air which is more costly than ocean shipments. We typically cannot recover the increased cost of air freight from our customers. Additionally, tariffs and other export fees may be incurred to ship products from foreign manufacturers to the customer. The inability to predict swings in demand or delays in production may increase the cost of freight which may have a material adverse effect on our product margins.
In addition, we have an exposure to oil prices in two forms. The first is in the prices of oil-based materials in our products, which are primarily the plastics and other components that we include in our finished products. The second is in the cost of delivery and freight, which would be passed on by the carriers that we use in the form of higher rates. We record freight-in as a cost of sales and freight-out in operating expenses. Rising oil prices may have an adverse effect on cost of sales and operating expenses.
20
Significant Developments From the Recent and Potential Changes in U.S. Trade Policies Could Have a Material Adverse Effect On Us
The U.S. government has indicated its intent to alter its approach to international trade policy and in some cases to renegotiate, or potentially terminate, certain existing bilateral or multi-lateral trade agreements and treaties with foreign countries. On various dates in July, August and September of 2018, the U.S. government implemented additional tariffs of 25% and 10% (increasing to 25% on January 1, 2019), on certain goods imported from the PRC. We manufacture a substantial amount of our products in the PRC and are presently subjected to these additional tariffs and will remain so until the tariff lists remains unaltered. These tariffs, and other governmental action relating to international trade agreements or policies, may adversely impact demand for our products, our costs, customers, suppliers and/or the U.S. economy or certain sectors thereof and, as a result, adversely impact our business. These additional tariffs may cause us to increase prices to our customers which may reduce demand, or, if we are unable to increase prices, result in lowering our margin on products sold. It remains unclear what the U.S. or foreign governments will or will not do with respect to tariffs, international trade agreements and policies on a short-term or long-term basis. We cannot predict future trade policy or the terms of any renegotiated trade agreements and their impacts on our business. The adoption and expansion of trade restrictions, the occurrence of a trade war, or other governmental action related to tariffs or trade agreements or policies has the potential to adversely impact demand for our products, our costs, our customers, our suppliers, and the U.S. economy, which in turn could adversely impact our business, financial condition and results of operations.
As a result of these tariffs and other governmental action, we began moving production of many of our products destined for U.S. to Mexico and a third-party manufacturing partner outside of the PRC. As of December 31, 2019, this transition was substantially complete.
Proprietary Technologies
We produce highly complex products that incorporate leading-edge technology, including hardware, firmware, and software. Firmware and software may contain bugs that may unexpectedly interfere with product operation. There can be no assurance that our testing programs will detect all defects in individual products or defects that may affect numerous shipments. The presence of defects may harm customer satisfaction, reduce sales opportunities, or increase warranty claims and/or returns. An inability to cure or repair such a defect may result in the failure of a product line, temporary or permanent withdrawal of a product or market, damage to our reputation, increased inventory costs, or product re-engineering expenses, any of which may have a material impact on our operating results, financial condition and cash flows.
Strategic Business Transactions
We have historically made strategic acquisitions of businesses in industries adjacent to our core business and will likely acquire additional businesses in the future as part of our long-term growth strategy. The success of future acquisitions depends in large part on our ability to integrate the operations and personnel of the acquired companies and manage challenges that may arise as a result of the acquisitions, particularly when the acquired businesses operate in new or foreign markets. In the event we do not successfully integrate such future acquisitions into our existing operations so as to realize the expected return on our investment, our results of operations, cash flow or financial condition could be adversely affected.
Growth Projections
Management has made projections required for the preparation of financial statements in conformity with accounting principles generally accepted in the United States ("U.S. GAAP") regarding future events and the financial performance of the Company, including those involving:
• | the benefits the Company expects as a result of the development and success of products and technologies, including new products and technologies; |
• | the benefits expected by conducting business in Asian and Latin American markets, without which, we may not be able to recover the costs we incur to enter into such markets; |
• | new contracts with new and existing customers and new market penetrations; |
• | the expected continued adoption of the Company's technologies in gaming consoles, mobile devices, and other home entertainment and control devices; |
• | the expected continued growth in digital TVs, DVRs, PVRs and overall growth in the Company's industry; |
• | the impact competitors and OTT providers may have on our business; and |
• | the effects we may experience due to current global and regional economic conditions. |
Actual events or results may be unfavorable to management's projections, which may have a material adverse effect on our projected operating results, financial condition and cash flows.
21
Additionally, we have goodwill and intangible assets recorded on our consolidated balance sheet. We periodically evaluate the recoverability of the carrying value of our goodwill and intangible assets whenever events or changes in circumstances indicate that such value may not be recoverable. Impairment assessment involves judgment as to assumptions regarding future sales and cash flows and the impact of market conditions on those assumptions. Future events and changing market conditions may impact our assumptions and may result in changes in our estimates of future sales and cash flows that may result in us incurring substantial impairment charges, which would adversely affect our results of operations or financial condition.
Market Projections and Data are Forward-looking in Nature.
Our strategy is based on our own projections and on analyst, industry observer and expert projections, which are forward-looking in nature and are inherently subject to risks and uncertainties. The validity of their and our assumptions, the timing and scope of the markets within which we compete, economic conditions, customer buying patterns, the timeliness of equipment development, pricing of products, and availability of capital for infrastructure improvements may affect these predictions. In addition, market data upon which we rely is based on third party reports that may be inaccurate. The inaccuracy of any of these projections and/or market data may adversely affect our operating results and financial condition.
Cybersecurity Issues: Security Breaches, Failure to Maintain the Integrity of and Protect Internal or Customer Data May Result in Faulty Business Decisions, Operational Inefficiencies, Damage to our Reputation and/or Subject Us to Costs, Fines, or Lawsuits
Our business requires collection, processing, and retention of large volumes of internal and sensitive and confidential customer data, including personally identifiable information of our customers in various information systems that we maintain and in those maintained by third parties with whom we contract to provide services, including in areas such as customer product servicing, human resources outsourcing, website hosting, and various forms of electronic communications. We and third parties who provide services to us also maintain personally identifiable information about our employees. The integrity and protection of that customer, employee, and company data, including proprietary information, is critical to us. If that data is inaccurate or incomplete, we may make faulty decisions. Our customers and employees also have a high expectation that we and our service providers will adequately protect their personal information. Despite the security measures we have in place, our facilities and systems, and those of the retailers, dealers, licensees and other third-party suppliers and vendors with which we do business, may be vulnerable to security breaches, cyber attacks, acts of vandalism or misconduct, computer viruses, misplaced or lost data, programming and/or human errors or other similar events. Any security breach involving the misappropriation, loss or other unauthorized disclosure of confidential customer, employee, supplier or Company information, whether caused by us, an unknown third party, or the retailers, dealers, licensees or other third-party suppliers and vendors with which we do business, could result in losses, severely damage our reputation, expose us to the risks of litigation and liability, disrupt our operations and have a material adverse effect on our business, results of operations and financial condition. As cyber security threats evolve in sophistication and become more prevalent in numerous industries worldwide, we continue to increase our sensitivity and attention to these threats, seek additional investments and resources to address these threats and enhance the security of our facilities and systems and strengthen our controls and procedures implemented to monitor and mitigate these threats. The domestic and international regulatory environment related to information security, data collection and privacy is increasingly rigorous and complex, with new and constantly changing requirements applicable to our business. Compliance with these requirements, including the European Union's General Data Protection Regulation and other domestic and international regulations, could result in additional costs and changes to our business practices.
Moreover, we rely heavily on computer systems to manage and operate our business, record and process transactions, and manage, support and communicate with our employees, customers, suppliers and other vendors. Computer systems are important to production planning, finance, company operations and customer service, among other business-critical processes. Despite efforts to prevent disruptions to our computer systems, our systems may be affected by damage or interruption from, among other causes, power outages, system failures, computer viruses and other intrusions, including cyber attacks. Computer hardware and storage equipment that is integral to efficient operations, such as email, telephone and other functionality, is concentrated in certain physical locations in the various continents in which we operate. Additionally, we rely on software applications, enterprise cloud storage systems and cloud computing services provided by third-party vendors, and our business may be adversely affected by service disruptions in or security breaches to such third-party systems.
Effectiveness of Our Internal Control Over Financial Reporting
Pursuant to Section 404 of the Sarbanes-Oxley Act of 2002, we are required to include our assessment of the effectiveness of our internal control over financial reporting in our Annual Report on Form 10-K. Furthermore, our independent registered public accounting firm is required to audit our internal control over financial reporting and separately report on whether it believes we maintain, in all material respects, effective internal control over financial reporting. Although we believe that we currently have adequate internal control procedures in place, we cannot be certain that future material changes to our internal control over financial
22
reporting will be effective. If we cannot adequately maintain the effectiveness of our internal control over financial reporting, we may be subject to sanctions or investigation by regulatory authorities, such as the SEC.
Our Governing Corporate Documents Contain, and Our Board of Directors May Implement, Antitakeover Provisions that May Deter Takeover Attempts
Our governing corporate documents, among other things, require super-majority votes in connection with certain mergers and similar transactions. In addition, our Board of Directors may, without stockholder approval, implement other anti-takeover defenses, such as a stockholder's rights plan.
Regulations Related to the Use of Conflict-Free Minerals May Increase Our Costs and Expenses, and an Inability to Certify that Our Products are Conflict-Free May Adversely Affect Customer Relationships
The Dodd-Frank Wall Street Reform and Consumer Protection Act contains provisions to improve the transparency and accountability of the use by public companies in their products of minerals mined in certain countries and to prevent the sourcing of such "conflict" minerals. As a result, the SEC enacted new annual disclosure and reporting requirements for public companies that use these minerals in their products, which apply to us. Under the final rules, we are required to conduct due diligence to determine the source of any conflict minerals used in our products and to make annual disclosures in filings with the SEC. Because our supply chain is broad-based and complex, we may not be able to easily verify the origins for all minerals used in our products. In addition, the new rules may reduce the number of suppliers who provide components and products containing conflict-free minerals and thus may increase the cost of the components used in manufacturing our products and the costs of our products to us. Any increased costs and expenses may have a material adverse impact on our financial condition and results of operations. Further, if we are unable to certify that our products are conflict free, we may face challenges with our customers, which may place us at a competitive disadvantage, and our reputation may be harmed.
We are Subject to a Wide Variety of Complex Domestic and Foreign Laws and Regulations
We are subject to a wide variety of complex domestic and foreign laws and regulations, and legal compliance risks, including securities laws, tax laws, employment and pension-related laws, competition laws, U.S. and foreign export and trading laws, and laws governing improper business practices. We are affected by new laws and regulations, and changes to existing laws and regulations, including interpretations by courts and regulators. From time to time, our Company, our operations and the industries in which we operate are being reviewed or investigated by regulators, which may lead to enforcement actions or the assertion of private litigation claims and damages.
Although we believe that we have adopted appropriate risk management and compliance programs to mitigate these risks, the global and diverse nature of our operations means that compliance risks will continue to exist. Investigations, examinations and other proceedings, the nature and outcome of which cannot be predicted, will likely arise from time to time. These investigations, examinations and other proceedings may subject us to significant liability and require us to make significant accruals or pay significant settlements, fines and penalties, which may have a material adverse effect on our results of operations, cash flow or financial condition.
We are subject to tax laws and regulations in the United States and multiple foreign jurisdictions. We are affected by changes in tax laws and regulations, as well as changes in related interpretations and other tax guidance. In the ordinary course of our business, we are subject to examinations and investigations by various tax authorities and other regulators. In addition to existing examinations and investigations, there could be additional examinations and investigations in the future, and existing examinations and investigations could be expanded.
On December 22, 2017, the Tax Act was signed into law. The Tax Act made substantial changes to then-current U.S. tax law, including a reduction in the corporate tax rate, a limitation on deductibility of interest expense, a limitation on the use of net operating losses to offset future taxable income, the allowance of immediate expensing of capital expenditures, deemed repatriation of foreign earnings and significant changes to the taxation of foreign earnings going forward. The Tax Act contains numerous, complex provisions impacting U.S. multinational companies, and we continue to review and assess the legislative language and guidance promulgated by regulators to determine the Tax Act's full impact on us. Further, we can provide no assurance our current interpretations of, and assumptions regarding, the Tax Act and any related regulations or guidance will not be reviewed or investigated by regulators in the future. As a result, the Tax Act, including any regulations or other guidance promulgated by the U.S. Internal Revenue Service or other regulators, and other tax laws could have significant effects on us, some of which could materially and adversely impact our financial condition, results of operations and cash flow.
For non-income tax risks, we estimate material loss contingencies and accrue for such loss contingencies as required by U.S. GAAP based on our assessment of contingencies where liability is deemed probable and reasonably estimable in light of the facts and circumstances known to us at a particular point in time. Subsequent developments may affect our assessment and estimates of the loss contingency. In the event the loss contingency is ultimately determined to be significantly higher than currently accrued, the
23
recording of the additional liability may result in a material adverse effect on our results of operations or financial condition for the annual or interim period during which such additional liability is accrued. In those cases where no accrual is recorded because it is not probable a liability has been incurred and cannot be reasonably estimated, any potential liability ultimately determined to be attributable to us may result in a material adverse effect on our results of operations, cash flow or financial condition for the annual or interim period during which such liability is accrued or paid. For income tax risks, we recognize tax benefits based on our assessment that a tax benefit has a greater than 50% likelihood of being sustained upon ultimate settlement with the applicable taxing authority that has full knowledge of all relevant facts. For those income tax positions where we determine there is not a greater than 50% likelihood such tax benefits will be sustained, we do not recognize a tax benefit in our financial statements. Subsequent events may cause us to change our assessment of the likelihood of sustaining a previously-recognized benefit which could result in a material adverse effect on our results of operations, cash flow or financial position for the annual or interim period during which such liability is accrued or paid.
We are Required to Comply with Numerous Complex and Increasingly Stringent Domestic and Foreign Health, Safety and Environmental Laws and Regulations, the Cost of Which is Likely to Increase
Our operations are subject to various domestic and foreign health, safety and environmental laws and regulations. These laws and regulations not only govern our current operations and products, but also impose potential liability on us for our past operations. We expect health, safety and environmental laws and regulations to impose increasingly stringent requirements upon our industry and us in the future. Our costs to comply with these laws and regulations may increase as these requirements become more stringent in the future, and these increased costs may adversely affect our results of operations, cash flow or financial condition.
Changes in Financial Accounting Standards or Policies May Affect Our Reported Financial Condition or Results of Operations
From time to time, the Financial Accounting Standards Board (the "FASB") and the SEC change their guidance governing the form and content of our external financial statements. In addition, accounting standard setters and those who interpret U.S. GAAP, such as the FASB and the SEC may change or even reverse their previous interpretations or positions with regard to how these standards should be applied. A change in accounting principles or their interpretation can have a significant effect on our reported results. In certain cases, the company may be required to apply new or revised guidance retroactively or apply existing guidance differently. For example, in May 2014, the FASB issued Accounting Standards Update ("ASU") 2014-09, "Revenue from Contracts with Customers," which impacted the timing of revenue recognition for certain new and existing contracts with customers beginning January 1, 2018. Additionally, in February 2016, the FASB issued ASU 2016-02, "Leases," which changed the accounting for leases beginning January 1, 2019. These and other potential changes in reporting standards may substantially change our reporting practices in a number of areas, including revenue recognition and recording of assets and liabilities, and affect our reported financial condition or results of operations.
ITEM 1B. UNRESOLVED STAFF COMMENTS
None.
24
ITEM 2. PROPERTIES
Our global headquarters is located in Scottsdale, Arizona. We utilize the following facilities:
Location | Purpose or Use | Square Feet | Status | ||||
Scottsdale, Arizona | Corporate headquarters, engineering, research and development | 25,106 | Leased, expires February 27, 2027 | ||||
Carlsbad, California | Engineering, research and development | 30,758 | Leased, expires November 30, 2022 | ||||
Poway, California | Engineering, research and development | 7,891 | Leased, expires November 30, 2021 | ||||
San Mateo, California | Engineering, research and development | 5,826 | Leased, expires January 31, 2023 | ||||
Santa Ana, California | Engineering, research and development | 36,184 | Leased, expires October 31, 2022 | ||||
Bangalore, India | Engineering, research and development | 21,326 | Leased, expires November 30, 2020 | ||||
Suzhou, PRC | Engineering, research and development | 5,705 | Leased, expires December 31, 2020 | ||||
Hong Kong, PRC | Asian headquarters | 12,000 | Leased, expires July 31, 2022 | ||||
Enschede, Netherlands | European headquarters and call center | 19,137 | Leased, expires February 29, 2024 | ||||
Guangzhou, PRC | Service center | 26,850 | Leased, expires April 14, 2020 | ||||
Manaus, Brazil | Manufacturing facility | 56,120 | Leased, expires August 19, 2022 | ||||
Monterrey, Mexico | Manufacturing facility | 101,571 | Leased, expires September 30, 2023 | ||||
Monterrey, Mexico | Manufacturing facility | 145,185 | Leased, expires August 31, 2025 | ||||
Qinzhou, PRC | Manufacturing facility | 321,313 | Leased, expires May 31, 2023 | ||||
Qinzhou, PRC | Manufacturing facility | 345,662 | Leased, expires February 28, 2022 | ||||
Yangzhou, PRC (1) | Manufacturing facility | 1,204,697 | Land leased, expires July 31, 2055 | ||||
Yangzhou, PRC | Manufacturing facility | 77,888 | Leased, expires October 31, 2025 | ||||
(1) | Private ownership of land in mainland PRC is not allowed. All land in the PRC is owned by the government and cannot be sold to any individual or entity. These facilities were developed on land which we lease from the PRC government. |
In addition to the facilities listed above, we lease space in various international locations, primarily for use as sales offices.
Upon expiration of our facilities leases, we believe we will obtain lease agreements under similar terms; however, there can be no assurance that we will receive similar terms or that any offer to renew will be accepted.
See "ITEM 8. FINANCIAL STATEMENTS AND SUPPLEMENTARY DATA — Notes to Consolidated Financial Statements — Note 12" for additional information regarding our obligations under leases.
ITEM 3. LEGAL PROCEEDINGS
We are subject to lawsuits arising out of the conduct of our business. The discussion of our litigation matters in "ITEM 8. FINANCIAL STATEMENTS AND SUPPLEMENTARY DATA — Notes to Consolidated Financial Statements — Note 13" is incorporated by reference.
ITEM 4. MINE SAFETY DISCLOSURES
Not applicable.
25
PART II
ITEM 5. MARKET FOR REGISTRANT'S COMMON EQUITY, RELATED STOCKHOLDER MATTERS AND ISSUER PURCHASES OF EQUITY SECURITIES
Our common stock trades on the NASDAQ Global Select Market under the symbol UEIC. Our stockholders of record on March 11, 2020 numbered 141. We have never paid cash dividends on our common stock, nor do we currently intend to pay any cash dividends on our common stock in the foreseeable future. We intend to retain our earnings, if any, for the future operation and expansion of our business.
Purchases of Equity Securities
The following table sets forth, for the fourth quarter, our total stock repurchases, average price paid per share and the maximum number of shares that may yet be purchased on the open market under our plans or programs:
Period | Total Number of Shares Purchased (1) | Weighted Average Price Paid per Share | Total Number of Shares Purchased as Part of Publicly Announced Plans or Programs | Total Dollar Value of Shares Purchased as Part of Publicly Announced Plans or Programs (2) | Maximum Dollar Value of Shares that May Yet Be Purchased Under the Plans or Programs (3) | |||||||||||||
October 1, 2019 - October 31, 2019 | — | $ | — | — | $ | — | $ | 3,934,261 | ||||||||||
November 1, 2019 - November 30, 2019 | 2,212 | 57.94 | — | — | 3,934,261 | |||||||||||||
December 1, 2019 - December 31, 2019 | 1,125 | 52.21 | — | — | 3,934,261 | |||||||||||||
Total | 3,337 | $ | 56.01 | — | $ | — | ||||||||||||
(1) | The repurchases in November and December represent common shares of the Company that were owned and tendered by employees to satisfy tax withholding obligations in connection with the vesting of restricted shares. |
(2) | Amounts in this column reflect the weighted average price paid for shares purchased under our share repurchase authorizations, inclusive of commissions paid to brokers. |
(3) | On October 30, 2018, our Board of Directors approved a repurchase plan authorizing the repurchase of up to $5.0 million of our common stock ("2018 Plan"). On December 31, 2019, we had $3.9 million of authorized repurchases remaining under the 2018 Plan. On March 10, 2020, our Board of Directors replaced the 2018 Plan with a new repurchase plan authorizing the repurchase of up to 300,000 shares. We may utilize various methods to effect the repurchases, which may include open market repurchases, negotiated block transactions, accelerated share repurchases or open market solicitations for shares, some of which may be effected through Rule 10b5-1 plans. The timing and amount of future repurchases, if any, will depend upon several factors, including market and business conditions, and such repurchases may be discontinued at any time. |
Equity Compensation Plans
Information regarding our equity compensation plans is incorporated by reference to "ITEM 12. SECURITY OWNERSHIP OF CERTAIN BENEFICIAL OWNERS AND MANAGEMENT AND RELATED STOCKHOLDER MATTERS" under the caption "Equity Compensation Plan Information" and "ITEM 8. FINANCIAL STATEMENTS AND SUPPLEMENTARY DATA — Notes to Consolidated Financial Statements — Note 15".
26
Performance Chart
The following graph and table compares the cumulative total stockholder return with respect to our common stock versus the cumulative total return of the Standard & Poor's Small Cap 600 (the "S&P Small Cap 600"), the NASDAQ Composite Index, and the Peer Group Index for the five-year period ended December 31, 2019. The comparison assumes that $100 was invested on December 31, 2014 in each of our common stock, S&P Small Cap 600, the NASDAQ Composite Index, and the Peer Group Index and that all dividends were reinvested. We have not paid any dividends and, therefore, our cumulative total return calculation is based solely upon stock price appreciation and not upon reinvestment of dividends. The graph and table depicts year-end values based on actual market value increases and decreases relative to the initial investment of $100, based on information provided for each calendar year by the NASDAQ Stock Market and the New York Stock Exchange.
The comparisons in the graph and table below are based on historical data and are not intended to forecast the possible future performance of our common stock.
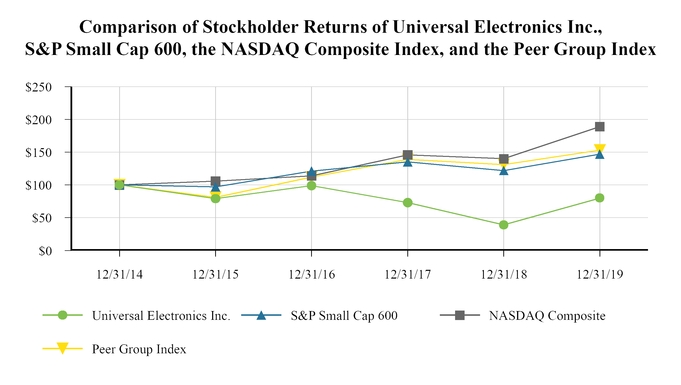
12/31/2014 | 12/31/2015 | 12/31/2016 | 12/31/2017 | 12/31/2018 | 12/31/2019 | ||||||||||||||||||
Universal Electronics Inc. | $ | 100 | $ | 79 | $ | 99 | $ | 73 | $ | 39 | $ | 80 | |||||||||||
S&P Small Cap 600 | $ | 100 | $ | 97 | $ | 121 | $ | 135 | $ | 122 | $ | 147 | |||||||||||
NASDAQ Composite Index | $ | 100 | $ | 106 | $ | 114 | $ | 146 | $ | 140 | $ | 189 | |||||||||||
Peer Group Index (1) | $ | 100 | $ | 81 | $ | 112 | $ | 139 | $ | 131 | $ | 153 | |||||||||||
(1) | Companies in the Peer Group Index are as follows: TiVo Corporation (formerly Rovi Corporation), Logitech International, Dolby Laboratories, Inc., and VOXX International Corp. |
The information presented above is as of December 31, 2014 through December 31, 2019. This information should not be deemed to be "soliciting material" or to be "filed" with the SEC or subject to the liabilities of Section 18 of the Exchange Act nor should this information be incorporated by reference into any prior or future filings under the Exchange Act, except to the extent that we specifically incorporate it by reference into a filing.
27
ITEM 6. SELECTED CONSOLIDATED FINANCIAL DATA
The information below is not necessarily indicative of the results of future operations and should be read in conjunction with "ITEM 7. MANAGEMENT’S DISCUSSION AND ANALYSIS OF FINANCIAL CONDITION AND RESULTS OF OPERATIONS", and the Consolidated Financial Statements and notes thereto included in "ITEM 8. FINANCIAL STATEMENTS AND SUPPLEMENTARY DATA", of this Form 10-K, which are incorporated herein by reference, in order to further understand the factors that may affect the comparability of the financial data presented below.
Year Ended December 31, | |||||||||||||||||||
(In thousands, except per share data) | 2019 | 2018 | 2017 | 2016 | 2015 | ||||||||||||||
Net sales | $ | 753,477 | $ | 680,241 | $ | 695,790 | $ | 651,371 | $ | 602,833 | |||||||||
Operating income (loss) | $ | 15,315 | $ | (1,665 | ) | $ | 10,670 | $ | 25,397 | $ | 35,919 | ||||||||
Net income (loss) attributable to Universal Electronics Inc. | $ | 3,630 | $ | 11,924 | $ | (10,323 | ) | $ | 20,354 | $ | 29,174 | ||||||||
Earnings (loss) per share attributable to Universal Electronics Inc.: | |||||||||||||||||||
Basic | $ | 0.26 | $ | 0.85 | $ | (0.72 | ) | $ | 1.41 | $ | 1.91 | ||||||||
Diluted | $ | 0.26 | $ | 0.85 | $ | (0.72 | ) | $ | 1.38 | $ | 1.88 | ||||||||
Shares used in computing earnings (loss) per share: | |||||||||||||||||||
Basic | 13,879 | 13,948 | 14,351 | 14,465 | 15,248 | ||||||||||||||
Diluted | 14,109 | 14,060 | 14,351 | 14,764 | 15,542 | ||||||||||||||
Cash dividends declared per common share | — | — | — | — | — | ||||||||||||||
Gross profit | 22.6 | % | 20.8 | % | 23.8 | % | 25.2 | % | 27.7 | % | |||||||||
Operating expenses as a % of net sales | 20.6 | % | 21.1 | % | 22.3 | % | 21.3 | % | 21.8 | % | |||||||||
Operating margin (deficit) | 2.0 | % | (0.2 | )% | 1.5 | % | 3.9 | % | 5.9 | % | |||||||||
Net income (loss) as a % of net sales | 0.5 | % | 1.8 | % | (1.5 | )% | 3.1 | % | 4.8 | % | |||||||||
Return on average assets | 0.6 | % | 2.0 | % | (1.8 | )% | 4.0 | % | 6.1 | % | |||||||||
December 31, | |||||||||||||||||||
(In thousands, except per share data) | 2019 | 2018 | 2017 | 2016 | 2015 | ||||||||||||||
Working capital | $ | 112,296 | $ | 100,597 | $ | 74,362 | $ | 108,291 | $ | 100,200 | |||||||||
Ratio of current assets to current liabilities | 1.4 | 1.4 | 1.2 | 1.5 | 1.5 | ||||||||||||||
Total assets | $ | 564,159 | $ | 555,596 | $ | 608,430 | $ | 521,036 | $ | 495,220 | |||||||||
Cash and cash equivalents | $ | 74,302 | $ | 53,207 | $ | 62,438 | $ | 50,611 | $ | 52,966 | |||||||||
Line of credit | $ | 68,000 | $ | 101,500 | $ | 138,000 | $ | 49,987 | $ | 50,000 | |||||||||
Stockholders’ equity | $ | 274,399 | $ | 262,960 | $ | 253,549 | $ | 280,510 | $ | 257,908 | |||||||||
Book value per share (1) | $ | 19.68 | $ | 19.03 | $ | 18.04 | $ | 19.28 | $ | 17.97 | |||||||||
Ratio of liabilities to liabilities and stockholders’ equity | 51.4 | % | 52.7 | % | 58.3 | % | 46.2 | % | 47.9 | % | |||||||||
(1) | Book value per share is defined as stockholders’ equity divided by common shares issued less treasury stock. |
The comparability of information for 2019, 2018, 2017 and 2016 compared to previous years is affected by the acquisitions of the net assets of Ecolink during the third quarter of 2015 and RCS during the second quarter of 2017. See "ITEM 8. FINANCIAL STATEMENTS AND SUPPLEMENTARY DATA - Notes to Consolidated Financial Statements - Note 21" for further information.
28
ITEM 7. MANAGEMENT'S DISCUSSION AND ANALYSIS OF FINANCIAL CONDITION AND RESULTS OF OPERATIONS
We generally discuss 2019 and 2018 items and year-to-year comparisons between 2019 and 2018 in the section that follows. Discussions of 2017 items and year-to-year comparisons between 2018 and 2017 that are not included in this Annual Report on Form 10-K may be found in "Management's Discussion and Analysis of Financial Condition and Results of Operations" in Part II, Item 7 of our Annual Report on Form 10-K for the year ended December 31, 2018, filed with the SEC on March 15, 2019.
The following discussion should be read in conjunction with the Consolidated Financial Statements and the related notes that appear elsewhere in this document.
Overview
We design, develop, manufacture and ship control and sensor technology solutions and a broad line of pre-programmed and universal control products, audio-video ("AV") accessories, and intelligent wireless security and smart home products that are used by the world's leading brands in the consumer electronics, subscription broadcasting, home entertainment, automation, security, hospitality and climate control markets. Our offerings include:
• | easy-to-use, pre-programmed universal infrared ("IR") and radio frequency ("RF") remote controls that are sold primarily to subscription broadcasting providers (cable, satellite and Internet Protocol television ("IPTV") and Over the Top services), original equipment manufacturers ("OEMs"), retailers, and private label customers; |
• | integrated circuits, on which our software and universal device control database is embedded, sold primarily to OEMs, subscription broadcasting providers, and private label customers; |
• | software, firmware and technology solutions that can enable devices such as TVs, set-top boxes, audio systems, smartphones, tablets, game controllers and other consumer electronic devices to wirelessly connect and interact with home networks and interactive services to control and deliver digital entertainment and information; |
• | intellectual property which we license primarily to OEMs, software development companies, private label customers, and subscription broadcasting providers; |
• | proprietary and standards-based RF sensors designed for residential security, safety and automation applications; |
• | wall-mount and handheld thermostat controllers and connected accessories for intelligent energy management systems, primarily to OEM customers as well as hospitality system integrators; and |
• | AV accessories sold, directly and indirectly, to consumers. |
Since our beginning in 1986, we have compiled an extensive device control knowledge library that includes nearly 9,000 brands comprising over 800,000 device models across AV and smart home platforms, supported by many common smart home protocols, including IR, HDMI-CEC, Zigbee, and Home Network or Cloud Control.
This device knowledge graph is backed by our unique device fingerprinting technology which includes over 700,000 unique device fingerprints across both AV and smart home devices.
Our technology also includes other remote controlled home entertainment devices and home automation control modules, as well as wired Consumer Electronics Control ("CEC") and wireless Internet Protocol ("IP") control protocols commonly found on many of the latest HDMI and internet connected devices. Our proprietary software automatically detects, identifies and enables the appropriate control commands for any given home entertainment, automation and air conditioning device in the home. Our libraries are continuously updated with device control codes used in newly introduced AV and Internet of Things ("IOT") devices. These control codes are captured directly from original remote control devices or from the manufacturer's written specifications to ensure the accuracy and integrity of the library. Our proprietary software and know-how permit us to offer a device control code database that is more robust and efficient than similarly priced products of our competitors.
We operate as one business segment. We have 2 domestic subsidiaries and 24 international subsidiaries located in Argentina, Brazil, British Virgin Islands, Cayman Islands, France, Germany, Hong Kong (3), India, Italy, Japan, Korea, Mexico, the Netherlands, People's Republic of China (the "PRC") (6), Singapore, Spain and the United Kingdom.
To recap our results for 2019:
• | Net sales increased 10.8% to $753.5 million in 2019 from $680.2 million in 2018. |
• | Our gross profit percentage increased to 22.6% in 2019 from 20.8% in 2018. |
• | Operating expenses, as a percent of sales, decreased to 20.6% in 2019 from 21.1% in 2018. |
• | Operating income increased to $15.3 million in 2019 from an operating loss of $1.7 million in 2018, and our operating margin percentage increased to 2.0% in 2019, compared to an operating deficit of 0.2% in 2018. |
29
• | Our effective tax rate increased to 65.1% in 2019 from 54.4% in 2018. |
Our strategic business objectives for 2020 include the following:
• | continue to develop and market the advanced remote control products and technologies our customer base is adopting; |
• | continue to broaden our home control and home automation product offerings; |
• | further penetrate international subscription broadcasting markets; |
• | acquire new customers in historically strong regions; |
• | increase our share with existing customers; and |
• | continue to seek acquisitions or strategic partners that complement and strengthen our existing business. |
We intend for the following discussion of our financial condition and results of operations to provide information that will assist in understanding our consolidated financial statements, the changes in certain key items in those financial statements from period to period, and the primary factors that accounted for those changes, as well as how certain accounting principles, policies and estimates affect our consolidated financial statements.
Critical Accounting Policies and Estimates
The preparation of financial statements in conformity with accounting principles generally accepted in the United States ("U.S. GAAP") requires us to make estimates and judgments that affect the reported amounts of assets and liabilities, disclosure of contingent assets and liabilities at the date of the financial statements and the reported amounts of revenues and expenses during the reporting period. On an ongoing basis, we evaluate our estimates and judgments, including those related to revenue recognition, allowances for doubtful accounts, inventory valuation, impairment of long-lived assets, intangible assets and goodwill, business combinations, income taxes, stock-based compensation expense and performance-based common stock warrants. Actual results may differ from these judgments and estimates, and they may be adjusted as more information becomes available. Any adjustment may be significant and may have a material impact on our consolidated financial position or results of operations.
An accounting policy is deemed to be critical if it requires an accounting estimate to be made based on assumptions about matters that are highly uncertain at the time the estimate is made, if different estimates reasonably may have been used, or if changes in the estimate that are reasonably likely to occur may materially impact the financial statements. Management believes the following critical accounting policies affect our more significant judgments and estimates used in the preparation of our consolidated financial statements. In addition to the accounting policies mentioned below, see "ITEM 8. FINANCIAL STATEMENTS AND SUPPLEMENTARY DATA — Notes to Consolidated Financial Statements — Note 2" for other significant accounting policies.
Revenue recognition
Revenue is recognized when control of a good or service is transferred to a customer. Control is considered to be transferred when the customer has the ability to direct the use of and obtain substantially all of the remaining benefits of that good or service. Revenues are generated from manufacturing and delivering universal control, sensing and automation products and AV accessories, which are sold through multiple channels, and licensing intellectual property that is embedded in these products or licensed to others for use in their products.
Revenue - Product revenue is generated through manufacturing and delivering universal control, sensing and automation products and AV accessories, which are sold through multiple channels. Our performance obligations are satisfied over time or at a point in time, depending on the nature of the product. Our contracts have an anticipated duration of less than a year and consideration may be variable based on indeterminate volumes.
Revenue is recognized over time when our performance creates an asset with no alternative use to us (custom products) and we have an enforceable right to payment for performance completed to date, including a reasonable margin, through a contractual commitment from the customer. Custom products are those products for which we are unable to redirect the asset to another customer in the foreseeable future without significant rework. The method for measuring progress towards satisfying a performance obligation for a custom product is based on the costs incurred to date (cost-to-cost method). We believe that the costs associated with production are most closely aligned with the revenue associated with those products.
We recognize revenue at a point in time if the criteria for recognizing revenue over time are not met, the title of the goods has transferred and we have a present right to payment.
A provision is recorded for estimated sales returns and allowances and is deducted from gross sales to arrive at net sales in the period the related revenue is recorded. These estimates are based on historical sales returns and allowances, analysis of credit memo data and other known factors. Actual returns and claims in any future period are inherently uncertain and thus may differ from our estimates. If actual or expected future returns and claims are significantly greater or lower than the reserves that we have established, we will record a reduction or increase to net revenue in the period in which we make such a determination.
30
We license our intellectual property including our patented technologies and database of control codes. We record license revenue for per-unit based licenses when our customers manufacture or ship a product incorporating our intellectual property and we have a present right to payment. We record revenue upon delivery of intellectual property for fixed up-front fee licenses or if the contract contains a minimum guarantee. Tiered royalties are recorded on a straight-line basis according to the forecasted per-unit fees taking into account the pricing tiers.
Contract assets - Contract assets represent the value of revenue recognized over time for which we have not yet invoiced the customer. Generally, we invoice the customer within 90 days of revenue recognition.
Contract liabilities - A contract liability is recorded when consideration is received from a customer prior to fully satisfying a performance obligation in a contract. Our contract liabilities primarily consist of cash received in advance for non-recurring engineering and tooling services. These contract liabilities will be recognized as revenues when control of the related product or service is transferred to the customer.
Other performance obligations - Payment terms are typically on open credit terms consistent with industry practice and do not have significant financing components. We accrue for discounts and rebates based on historical experience and our expectations regarding future sales to our customers. Accruals for discounts and rebates are recorded as a reduction to sales in the same period as the related revenue. Changes in such accruals may be required if future rebates and incentives differ from our estimates.
Trade accounts receivable are recorded at the invoiced amount and do not bear interest. Sales allowances are recognized as reductions of gross accounts receivable to arrive at accounts receivable, net if the sales allowances are distributed in customer account credits.
We present all non-income government-assessed taxes (sales, use and value added taxes) collected from our customers and remitted to governmental agencies on a net basis (excluded from revenue) in our financial statements. The government-assessed taxes are recorded in our consolidated balance sheets until they are remitted to the government agency.
Adoption of revenue recognition standard - On January 1, 2018, we adopted Accounting Standards Update ("ASU") 2014-09, "Revenue from Contracts with Customers," and all related amendments. The guidance provides a single, comprehensive revenue recognition model for all contracts with customers and supersedes most existing revenue recognition guidance. The primary impact to our revenue recognition policies resulting from this standard relates to the timing of revenue recognition for products which are customized for a specific customer. Results for reporting periods beginning after January 1, 2018 are presented under the new standard while prior periods have not been adjusted.
Allowance for Doubtful Accounts
We maintain an allowance for doubtful accounts for estimated losses resulting from the inability of our customers to make payments for products sold or services rendered. The allowance for doubtful accounts is estimated based on a variety of factors, including credit reviews, historical experience, length of time receivables are past due, current economic trends and changes in customer payment behavior. We also record specific provisions for individual accounts when we become aware of a customer's inability to meet its financial obligations to us, such as in the case of bankruptcy filings or deterioration in the customer's operating results or financial position. Our historical reserves have been sufficient to cover losses from uncollectible accounts. However, because we cannot predict future changes in the financial stability of our customers, actual future losses from uncollectible accounts may differ from our estimates and may have a material effect on our consolidated financial position, results of operations and cash flows.
Inventories
Our finished good, component part, and raw material inventories are valued at the lower of cost or net realizable value. Cost is determined using the first-in, first-out method. We write down our inventory for the estimated difference between cost and estimated net realizable value based upon our best estimates of future demand and market conditions. We carry inventory in amounts necessary to satisfy our customers' inventory requirements on a timely basis. We continually monitor our inventory status to control inventory levels and write down any excess or obsolete inventories on hand. If actual market conditions become less favorable than those projected by management, additional inventory write-downs may be required, which may have a material impact on our financial statements. Such circumstances may include, but are not limited to, the development of new competing technology that impedes the marketability of our products or the occurrence of significant price decreases in our raw material or component parts, such as integrated circuits. Each percentage point change in the ratio of excess and obsolete inventory reserve to inventory would impact cost of sales by approximately $1.6 million.
31
Valuation of Long-Lived Assets and Intangible Assets
We assess long-lived and intangible assets for impairment whenever events or changes in circumstances indicate that their carrying value may not be recoverable. Factors considered important which may trigger an impairment review, if significant, include the following:
• | underperformance relative to historical or projected future operating results; |
• | changes in the manner of use of the assets; |
• | changes in the strategy of our overall business; |
• | negative industry or economic trends; |
• | a decline in our stock price for a sustained period; and |
• | a variance between our market capitalization relative to net book value. |
If the carrying value of the asset is larger than its projected undiscounted future cash flows, the asset is impaired. The impairment is measured as the difference between the net book value of the asset and the asset's estimated fair value. Fair value is estimated utilizing the asset's projected discounted future cash flows. In assessing fair value, we must make assumptions regarding estimated future cash flows, the discount rate and other factors.
Goodwill
We evaluate the carrying value of goodwill on December 31 of each year and between annual evaluations if events occur or circumstances change that would more likely than not reduce the fair value of the reporting unit below its carrying amount. Such circumstances may include, but are not limited to: (1) a significant adverse change in legal factors or in business climate, (2) unanticipated competition or (3) an adverse action or assessment by a regulator.
Effective in the year ended December 31, 2019, we perform our annual impairment test using a qualitative assessment weighing the relative impact of factors that are specific to our single reporting unit as well as industry and macroeconomic factors. Based on the qualitative assessment performed, considering the aggregation of the relevant factors, we concluded that it is not more likely than not that the fair value of our single reporting unit is less than the carrying value. Therefore, performing a quantitative impairment test was unnecessary.
Certain future events and circumstances, including adverse changes in general business and economic conditions in the United States and worldwide and changes in consumer behavior could result in changes to our assumptions and judgments used in the goodwill impairment tests. A downward revision of these assumptions could cause the fair value of the reporting unit to fall below its respective carrying values and a noncash impairment charge would be required. Such a charge may have a material effect on the Consolidated Statements of Operations and Consolidated Balance Sheet.
Business Combinations
We allocate the purchase price of acquired businesses to the tangible and intangible assets and the liabilities assumed based on their estimated fair values on the acquisition date. The excess of the purchase price over the fair value of net assets acquired is recorded as goodwill. We engage independent third-party appraisal firms to assist us in determining the fair values of assets acquired and liabilities assumed. Such valuations require management to make significant fair value estimates and assumptions, especially with respect to intangible assets and contingent consideration. Management estimates the fair value of certain intangible assets and contingent consideration by utilizing the following (but not limited to):
• | future cash flow from customer contracts, customer lists, distribution agreements, acquired developed technologies, trademarks, trade names and patents; |
• | expected costs to complete development of in-process technology into commercially viable products and cash flows from the products once they are completed; |
• | brand awareness and market position as well as assumptions regarding the period of time the brand will continue to be used in our product portfolio; and |
• | discount rates utilized in discounted cash flow models. |
In those circumstances where an acquisition involves a contingent consideration arrangement, we recognize a liability equal to the fair value of the contingent payments we expect to make as of the acquisition date. We re-measure this liability at each reporting period and record changes in the fair value within operating expenses. Increases or decreases in the fair value of the contingent consideration liability can result from changes in discount periods and rates, as well as changes in the timing and amount of earnings estimates or in the timing or likelihood of achieving earnings-based milestones.
32
Our estimates are based upon assumptions believed to be reasonable; however, unanticipated events or circumstances may occur which may affect the accuracy of our fair value estimates, including assumptions regarding industry economic factors and business strategies.
Results of operations and cash flows of acquired businesses are included in our operating results from the date of acquisition.
Income Taxes
We calculate our current and deferred tax provisions based on estimates and assumptions that may differ from the actual results reflected in our income tax returns filed during the subsequent year. We record adjustments based on filed returns when we have identified and finalized them, which is generally in the third and fourth quarters of the subsequent year.
We recognize deferred tax assets and liabilities for the expected tax consequences of temporary differences between the tax basis of assets and liabilities and their reported amounts using enacted tax rates in effect for the year in which we expect the differences to reverse. We record a valuation allowance to reduce the deferred tax assets to the amount that we are more likely than not to realize. We have considered future market growth, forecasted earnings and tax rates, future taxable income, the mix of earnings in the jurisdictions in which we operate and prudent tax planning strategies in determining the need for a valuation allowance. In the event we were to determine that we would not be able to realize all or part of our net deferred tax assets in the future, we would increase the valuation allowance and make a corresponding charge to earnings in the period in which we make such determination. Likewise, if we later determine that we are more likely than not to realize the net deferred tax assets, we would reverse the applicable portion of the previously provided valuation allowance. In order for us to realize our deferred tax assets we must be able to generate sufficient taxable income in the tax jurisdictions in which the deferred tax assets are located.
Our cash balances are held in numerous locations throughout the world. The majority of our cash is held outside of the United States and may be repatriated to the United States but, under current law, may be subject to state income taxes and foreign withholding taxes. Additionally, repatriation of some foreign balances is restricted by local laws. We have provided for the state income tax and foreign withholding tax liabilities on these amounts for financial statement purposes.
We are subject to income taxes in the United States and foreign countries, and we are subject to routine corporate income tax audits in many of these jurisdictions. We believe that our tax return positions are fully supported, but tax authorities are likely to challenge certain positions, which may not be fully sustained. Our income tax expense includes amounts intended to satisfy income tax assessments that result from these challenges in accordance with the accounting for uncertainty in income taxes prescribed by U.S. GAAP. Determining the income tax expense for these potential assessments and recording the related assets and liabilities requires management judgments and estimates.
We maintain reserves for uncertain tax positions, including related interest and penalties. We review our reserves quarterly, and we may adjust such reserves due to proposed assessments by tax authorities, changes in facts and circumstances, issuance of new regulations or new case law, previously unavailable information obtained during the course of an examination, negotiations between tax authorities of different countries concerning our transfer prices, execution of advanced pricing agreements, resolution with respect to individual audit issues, the resolution of entire audits, or the expiration of statutes of limitations. The amounts ultimately paid upon resolution of audits may be materially different from the amounts previously included in our income tax expense and, therefore, may have a material impact on our operating results, financial position and cash flows.
Stock-Based Compensation
We recognize the grant date fair value of stock-based compensation awards as expense in proportion to vesting during the requisite service period, which ranges from one to four years. Forfeitures of stock-based awards are accounted for as they occur.
We determine the fair value of restricted stock awards utilizing the average of the high and low trading prices of our common shares on the date they were granted.
The fair value of stock options granted to employees and directors is determined utilizing the Black-Scholes option pricing model. The assumptions utilized in the Black-Scholes model include the risk-free interest rate, expected volatility, expected life in years and dividend yield. The risk-free interest rate over the expected term is equal to the prevailing U.S. Treasury note rate over the same period. Expected volatility is determined utilizing historical volatility over a period of time equal to the expected life of the stock option. Expected life is computed utilizing historical exercise patterns and post-vesting behavior. The dividend yield is assumed to be zero since we have not historically declared dividends and do not have any plans to declare dividends in the future.
33
Performance-Based Common Stock Warrants
The measurement date for performance-based common stock warrants is the date on which the warrants vest. We recognize the fair value of performance-based common stock warrants as a reduction to net sales ratably as the warrants vest based on the projected number of warrants that will vest, the proportion of the performance criteria achieved by the customer within the period relative to the total performance required (aggregate purchase levels) for the warrants to vest and the then-current fair value of the related unvested warrants. If we do not have a reliable forecast of future purchases to be made by the customer by which to estimate the number of warrants that will vest, then the maximum number of potential warrants is assumed until such time that a reliable forecast of future purchases is available. To the extent that our projections change in the future as to the number of warrants that will vest, a cumulative catch-up adjustment will be recorded in the period in which our estimates change.
The fair value of performance-based common stock warrants is determined utilizing the Black-Scholes option pricing model. The assumptions utilized in the Black-Scholes model include the price of our common stock, the risk-free interest rate, expected volatility, expected life in years and dividend yield. The price of our common stock is equal to the average of the high and low trade prices of our common stock on the measurement date. The risk-free interest rate over the expected life is equal to the prevailing U.S. Treasury note rate over the same period. Expected volatility is determined utilizing historical volatility over a period of time equal to the expected life of the warrant. Expected life is equal to the remaining contractual term of the warrant. The dividend yield is assumed to be zero since we have not historically declared dividends and do not have any plans to declare dividends in the future.
Results of Operations
The following table sets forth our results of operations expressed as a percentage of net sales for the periods indicated.
Year Ended December 31, | |||||
2019 | 2018 | ||||
Net sales | 100.0 | % | 100.0 | % | |
Cost of sales | 77.4 | 79.2 | |||
Gross profit | 22.6 | 20.8 | |||
Research and development expenses | 3.9 | 3.5 | |||
Selling, general and administrative expenses | 16.7 | 17.5 | |||
Operating income (loss) | 2.0 | (0.2 | ) | ||
Interest income (expense), net | (0.5 | ) | (0.7 | ) | |
Gain on sale of Guangzhou factory | — | 5.4 | |||
Other income (expense), net | (0.1 | ) | (0.6 | ) | |
Income before provision for income taxes | 1.4 | 3.9 | |||
Provision for income taxes | 0.9 | 2.1 | |||
Net income (loss) | 0.5 | % | 1.8 | % | |
Year Ended December 31, 2019 ("2019") Compared to Year Ended December 31, 2018 ("2018")
Net sales. Net sales for 2019 were $753.5 million, an increase of 10.8% compared to $680.2 million in 2018. The increase in net sales was primarily due to the recent launches of higher end platforms by existing customers in the subscription broadcasting channel, a newly acquired customer and continued strength in home automation.
Gross profit. Gross profit in 2019 was $170.2 million compared to $141.8 million in 2018. Gross profit as a percent of sales increased to 22.6% in 2019 from 20.8% in 2018. The gross profit percentage was favorably impacted by product mix as small- to medium-sized subscription broadcasters launched advanced platforms; an increase in royalty revenue as certain consumer electronic companies are embedding our technology in their devices; lower raw material costs during 2019; and foreign currency as the U.S. Dollar strengthened by approximately 400 basis points versus the Chinese Yuan Renminbi. The gross profit percentage was unfavorably impacted by higher U.S. tariffs on many of our products that are manufactured in the PRC and imported into the U.S. In an effort to mitigate the effect of the increased tariffs, we transitioned the production of many of our goods destined for the U.S. market from our PRC factories to our factory in Mexico. In connection with this transition, which began in the fourth quarter of 2018, we incurred costs related to the movement of materials, duplicative labor efforts and indirect costs including unabsorbed duplicative overhead.
34
Research and development ("R&D") expenses. R&D expenses increased 23.5% to $29.4 million in 2019 from $23.8 million in 2018 primarily due to our continued investment in the development of new products that enhance the user experience in home entertainment and home automation.
Selling, general and administrative ("SG&A") expenses. SG&A expenses increased 4.9% to $125.5 million in 2019 from $119.7 million in 2018, primarily due to increases in incentive compensation expense and an increase in contingent consideration recorded in connection with our acquisition of the net assets of Ecolink Intelligent Technology, Inc. ("Ecolink"). Partially offsetting these increases was payroll expense, which decreased as a result of our ongoing corporate restructuring initiatives.
Interest income (expense), net. Net interest expense was $3.9 million in 2019 compared to $4.7 million in 2018. This decrease was a result of a lower average quarterly loan balance.
Gain on sale of Guangzhou factory. In June 2018, we completed the sale of our Guangzhou manufacturing facility in exchange for cash proceeds of $51.3 million, resulting in a pre-tax gain of $37.0 million.
Other income (expense), net. Net other expense was $1.0 million in 2019 compared to $4.5 million in 2018. This change was driven primarily by both a decline in foreign currency losses associated with fluctuations in the Chinese Yuan Renminbi versus the U.S. Dollar and foreign currency gains associated with fluctuations in the Brazilian Real versus the U.S. Dollar in 2019.
Income tax expense. Income tax expense was $6.8 million in 2019 compared to $14.2 million in 2018. Our effective tax rate was 65.1% in 2019 compared to 54.4% in 2018. Our effective tax rate was higher than normal in 2018 as a result of the recording of an $8.1 million valuation allowance against U.S. federal and state deferred tax assets. In 2019, the U.S. incurred a loss and, because of the valuation allowance, was not able to benefit the loss resulting in an elevated tax rate.
Liquidity and Capital Resources
Sources and Uses of Cash
(In thousands) | Year Ended December 31, 2019 | Increase (Decrease) | Year Ended December 31, 2018 | ||||||||
Cash provided by operating activities | $ | 85,257 | $ | 72,402 | $ | 12,855 | |||||
Cash provided by (used for) investing activities | (23,968 | ) | (47,543 | ) | 23,575 | ||||||
Cash provided by (used for) financing activities | (39,231 | ) | 14,087 | (53,318 | ) | ||||||
Effect of exchange rate changes on cash, cash equivalents and restricted cash | (963 | ) | (3,719 | ) | 2,756 | ||||||
Net increase (decrease) in cash, cash equivalents and restricted cash | $ | 21,095 | $ | 35,227 | $ | (14,132 | ) | ||||
December 31, 2019 | Increase (Decrease) | December 31, 2018 | |||||||||
Cash and cash equivalents | $ | 74,302 | $ | 21,095 | $ | 53,207 | |||||
Working capital | 112,296 | 11,699 | 100,597 | ||||||||
Net cash provided by operating activities increased $72.4 million in 2019 compared to 2018, primarily due to the net impact of the gain on sale of the Guangzhou factory and changes in working capital associated with accounts receivable and accounts payable. Accounts receivable and contract assets produced cash inflows of $17.2 million in 2019 compared to $5.5 million in 2018 largely due to a decrease in days sales outstanding from 71 days at December 31, 2018 to 64 days at December 31, 2019. Accounts payable and accrued liabilities produced net cash inflows of $14.2 million during 2019 compared to cash outflows of $7.4 million in 2018, largely as a result of timing of payments. Our inventory turns remained relatively consistent with 3.3 turns at December 31, 2018 compared to 3.2 turns at December 31, 2019.
Net cash used for investing activities during 2019 was $24.0 million compared to net cash provided by investing activities of $23.6 million during 2018. In 2019, acquisitions of property, plant and equipment were $21.3 million which reflects a normalized level of spending. In 2018, we received net cash proceeds of $46.2 million for the sale of our Guangzhou factory, which was completed in June 2018, which was partially offset by acquisitions of property, plant and equipment of $20.1 million.
Net cash used for financing activities was $39.2 million during 2019 compared to net cash used for financing activities of $53.3 million during 2018. The primary drivers of our cash flows from financing activities in 2019 and 2018 were borrowings and
35
repayments on our line of credit and repurchases of shares of our common stock on the open market. Net payments on our line of credit were $33.5 million and $36.5 million in 2019 and 2018, respectively.
During 2019, we purchased 57,740 shares of our common stock at a cost of $1.9 million compared to 413,585 shares at a cost of $13.8 million during 2018. We hold repurchased shares as treasury stock and they are available for reissue. Presently, we have no plans to distribute these shares, although we may change these plans if necessary to fulfill our ongoing business objectives. See "ITEM 8. FINANCIAL STATEMENTS AND SUPPLEMENTARY DATA - Notes to Consolidated Financial Statements - Note 14" for further information regarding our share repurchase programs.
Contractual Obligations
The following table summarizes our contractual obligations and the effect these obligations are expected to have on our liquidity and cash flow in future periods.
Payments Due by Period | |||||||||||||||||||
(In thousands) | Total | Less than 1 year | 1 - 3 years | 4 - 5 years | After 5 years | ||||||||||||||
Operating lease obligations | $ | 25,362 | $ | 6,739 | $ | 11,941 | $ | 4,384 | $ | 2,298 | |||||||||
Purchase obligations(1) | 2,698 | 2,698 | — | — | — | ||||||||||||||
Contingent consideration (2) | 9,777 | 5,428 | 4,349 | — | — | ||||||||||||||
Total contractual obligations | $ | 37,837 | $ | 14,865 | $ | 16,290 | $ | 4,384 | $ | 2,298 | |||||||||
(1) | Purchase obligations primarily consist of contractual payments to purchase property, plant and equipment. |
(2) | Contingent consideration consists of contingent payments related to our purchases of the net assets of Ecolink and Residential Control Systems, Inc. ("RCS"). |
Liquidity
Historically, we have utilized cash provided from operations as our primary source of liquidity, as internally generated cash flows have been sufficient to support our business operations, capital expenditures and discretionary share repurchases. More recently, we have utilized our revolving line of credit to fund an increased level of share repurchases and our acquisitions of the net assets of Ecolink and RCS. We anticipate that we will continue to utilize both cash flows from operations and our revolving line of credit to support ongoing business operations, capital expenditures and future discretionary share repurchases. We believe our current cash balances, anticipated cash flow to be generated from operations and available borrowing resources will be sufficient to cover expected cash outlays during the next twelve months; however, because our cash is located in various jurisdictions throughout the world, we may at times need to increase borrowing from our revolving line of credit or take on additional debt until we are able to transfer cash among our various entities.
Our liquidity is subject to various risks including the market risks identified in "ITEM 7A. QUANTITATIVE AND QUALITATIVE DISCLOSURES ABOUT MARKET RISK".
December 31, | |||||||
2019 | 2018 | ||||||
Cash and cash equivalents | $ | 74,302 | $ | 53,207 | |||
Available borrowing resources | 54,300 | 28,500 | |||||
Our cash balances are held in numerous locations throughout the world. The majority of our cash is held outside of the United States and may be repatriated to the United States but, under current law, may be subject to state income taxes and foreign withholding taxes. Additionally, repatriation of some foreign balances is restricted by local laws. We have provided for the state income tax and the foreign withholding tax liabilities on these amounts for financial statement purposes.
On December 31, 2019, we had $16.8 million, $13.7 million, $21.7 million, $9.1 million and $13.0 million of cash and cash equivalents in the United States, the PRC, Asia (excluding the PRC), Europe, and South America, respectively. We attempt to mitigate our exposure to liquidity, credit and other relevant risks by placing our cash and cash equivalents with financial institutions we believe are high quality.
On November 1, 2019, we extended the term of our Second Amended and Restated Credit Agreement ("Second Amended Credit Agreement") with U.S. Bank National Association ("U.S. Bank") to November 1, 2021. The Second Amended Credit Agreement
36
provided for a $130.0 million Credit Line through June 30, 2019 and a $125.0 million Credit Line thereafter and through its expiration date. The Credit Line may be used for working capital and other general corporate purposes including acquisitions, share repurchases and capital expenditures. Amounts available for borrowing under the Credit Line are reduced by the balance of any outstanding letters of credit, of which there were $2.7 million at December 31, 2019.
All obligations under the Credit Line are secured by substantially all of our U.S. personal property and tangible and intangible assets as well as 65% of our ownership interest in Enson Assets Limited, our wholly-owned subsidiary which controls our manufacturing factories in the PRC.
Under the Second Amended Credit Agreement, we may elect to pay interest on the Credit Line based on LIBOR plus an applicable margin (varying from 1.25% to 1.75%) or base rate (based on the prime rate of U.S. Bank or as otherwise specified in the Second Amended Credit Agreement) plus an applicable margin (varying from 0.00% to 0.50% ). The applicable margins are calculated quarterly and vary based on our cash flow leverage ratio as set forth in the Second Amended Credit Agreement. The interest rate in effect at December 31, 2019 was 3.03%. There are no commitment fees or unused line fees under the Second Amended Credit Agreement.
The Second Amended Credit Agreement includes financial covenants requiring a minimum fixed charge coverage ratio and a maximum cash flow leverage ratio. In addition, the Second Amended Credit Agreement contains other customary affirmative and negative covenants and events of default. As of December 31, 2019, we were in compliance with the covenants and conditions of the Second Amended Credit Agreement.
At December 31, 2019, we had an outstanding balance of $68.0 million on our Credit Line and $54.3 million of availability.
Off-Balance Sheet Arrangements
We do not participate in any off-balance sheet arrangements.
Recent Accounting Pronouncements
See "ITEM 8. FINANCIAL STATEMENTS AND SUPPLEMENTARY DATA — Notes to Consolidated Financial Statements — Note 2" for a discussion of recent accounting pronouncements.
ITEM 7A. QUANTITATIVE AND QUALITATIVE DISCLOSURES ABOUT MARKET RISK
We are exposed to various market risks, including interest rate and foreign currency exchange rate fluctuations. We have established policies, procedures and internal processes governing our management of these risks and the use of financial instruments to mitigate our risk exposure.
Interest Rate Risk
We are exposed to interest rate risk related to our debt. From time to time we borrow amounts on our Credit Line for working capital and other liquidity needs. Under the Second Amended Credit Agreement, we may elect to pay interest on outstanding borrowings on our Credit Line based on LIBOR or a base rate (based on the prime rate of U.S. Bank) plus an applicable margin as defined in the Second Amended Credit Agreement. Accordingly, changes in interest rates would impact our results of operations in future periods. A 100 basis point increase in interest rates would have an approximately $0.5 million annual impact on net income based on our outstanding Credit Line balance at December 31, 2019.
We cannot make any assurances that we will not need to borrow additional amounts in the future or that funds will be extended to us under comparable terms or at all. If funding is not available to us at a time when we need to borrow, we would have to use our cash reserves, including potentially repatriating cash from foreign jurisdictions, which may have a material adverse effect on our operating results, financial position and cash flows.
Foreign Currency Exchange Rate Risk
At December 31, 2019, we had wholly-owned subsidiaries in Argentina, Brazil, the British Virgin Islands, Cayman Islands, France, Germany, Hong Kong, India, Italy, Japan, Korea, Mexico, the Netherlands, the PRC, Singapore, Spain and the United Kingdom. We are exposed to foreign currency exchange rate risk inherent in our sales commitments, anticipated sales, anticipated purchases, operating expenses, assets and liabilities denominated in currencies other than the U.S. Dollar. The most significant foreign currencies to our operations are the Chinese Yuan Renminbi, Euro, British Pound, Argentinian Peso, Mexican Peso, Brazilian Real, Indian Rupee, Philippine Peso and Japanese Yen. Our most significant foreign currency exposure is to the Chinese Yuan Renminbi as this is the functional currency of our PRC-based factories where the majority of our products are manufactured. If the Chinese Yuan Renminbi were to strengthen against the U.S. Dollar, our manufacturing costs would increase. We are generally a net payor of the Euro, Mexican Peso, Indian Rupee, Philippine Peso and Japanese Yen and therefore benefit from a stronger U.S.
37
Dollar and are adversely affected by a weaker U.S. Dollar relative to the foreign currency. For the British Pound, Argentinian Peso and Brazilian Real, we are generally a net receiver of the foreign currency and therefore benefit from a weaker U.S. Dollar and are adversely affected by a stronger U.S. Dollar relative to the foreign currency. Even where we are a net receiver, a weaker U.S. Dollar may adversely affect certain expense figures taken alone.
From time to time, we enter into foreign currency exchange agreements to manage the foreign currency exchange rate risks inherent in our forecasted income and cash flows denominated in foreign currencies. The terms of these foreign currency exchange agreements normally last less than nine months. We recognize the gains and losses on these foreign currency contracts in the same period as the remeasurement losses and gains of the related foreign currency-denominated exposures.
It is difficult to estimate the impact of fluctuations on reported income, as it depends on the opening and closing rates, the average net balance sheet positions held in a foreign currency and the amount of income generated in local currency. We routinely forecast what these balance sheet positions and income generated in local currency may be and we take steps to minimize exposure as we deem appropriate. Alternatively, we may choose not to hedge the foreign currency risk associated with our foreign currency exposures, primarily if such exposure acts as a natural foreign currency hedge for other offsetting amounts denominated in the same currency or the currency is difficult or too expensive to hedge. We do not enter into any derivative transactions for speculative purposes.
The sensitivity of earnings and cash flows to variability in exchange rates is assessed by applying an approximate range of potential rate fluctuations to our assets, obligations and projected results of operations denominated in foreign currency with all other variables held constant. The analysis includes all of our foreign currency contracts offset by the underlying exposures. Based on our overall foreign currency rate exposure at December 31, 2019, we believe that movements in foreign currency rates may have a material effect on our financial position and results of operations. We estimate that if the exchange rates for the Chinese Yuan Renminbi, Euro, British Pound, Argentinian Peso, Mexican Peso, Brazilian Real, Indian Rupee, Philippine Peso and Japanese Yen relative to the U.S. Dollar fluctuate 10% from December 31, 2019, net income in the first quarter of 2020 would fluctuate by approximately $10.1 million.
38
ITEM 8. FINANCIAL STATEMENTS AND SUPPLEMENTARY DATA
INDEX TO CONSOLIDATED FINANCIAL STATEMENTS
Page | |
All schedules are omitted because they are not applicable or the required information is shown in the consolidated financial statements or notes thereto.
39
REPORT OF INDEPENDENT REGISTERED PUBLIC ACCOUNTING FIRM
Board of Directors and Stockholders
Universal Electronics Inc.
Opinion on the financial statements
We have audited the accompanying consolidated balance sheets of Universal Electronics Inc. (a Delaware corporation) (the "Company") as of December 31, 2019 and 2018, the related consolidated statements of operations, comprehensive income (loss), changes in stockholders’ equity, and cash flows for each of the three years in the period ended December 31, 2019, and the related notes (collectively referred to as the "financial statements"). In our opinion, the financial statements present fairly, in all material respects, the financial position of the Company as of December 31, 2019 and 2018, and the results of its operations and its cash flows for each of the three years in the period ended December 31, 2019, in conformity with accounting principles generally accepted in the United States of America.
We also have audited, in accordance with the standards of the Public Company Accounting Oversight Board (United States) ("PCAOB"), the Company’s internal control over financial reporting as of December 31, 2019, based on criteria established in the 2013 Internal Control-Integrated Framework issued by the Committee of Sponsoring Organizations of the Treadway Commission (COSO), and our report dated March 13, 2020 expressed an unqualified opinion.
Change in Accounting Principle
As discussed in Note 2 to the financial statements, the Company has changed its method of accounting for leases in 2019 due to the adoption of ASC 842, Leases.
Basis for opinion
These financial statements are the responsibility of the Company’s management. Our responsibility is to express an opinion on the Company’s financial statements based on our audits. We are a public accounting firm registered with the PCAOB and are required to be independent with respect to the Company in accordance with the U.S. federal securities laws and the applicable rules and regulations of the Securities and Exchange Commission and the PCAOB.
We conducted our audits in accordance with the standards of the PCAOB. Those standards require that we plan and perform the audit to obtain reasonable assurance about whether the financial statements are free of material misstatement, whether due to error or fraud. Our audits included performing procedures to assess the risks of material misstatement of the financial statements, whether due to error or fraud, and performing procedures that respond to those risks. Such procedures included examining, on a test basis, evidence supporting the amounts and disclosures in the financial statements. Our audits also included evaluating the accounting principles used and significant estimates made by management, as well as evaluating the overall presentation of the financial statements. We believe that our audits provide a reasonable basis for our opinion.
/s/ GRANT THORNTON LLP
We have served as the Company’s auditor since 2005.
Los Angeles, California
March 13, 2020
40
UNIVERSAL ELECTRONICS INC.
CONSOLIDATED BALANCE SHEETS
(In thousands, except share-related data)
December 31, 2019 | December 31, 2018 | ||||||
ASSETS | |||||||
Current assets: | |||||||
Cash and cash equivalents | $ | 74,302 | $ | 53,207 | |||
Accounts receivable, net | 139,198 | 144,689 | |||||
Contract assets | 12,579 | 25,572 | |||||
Inventories, net | 145,135 | 144,350 | |||||
Prepaid expenses and other current assets | 6,733 | 11,638 | |||||
Income tax receivable | 805 | 997 | |||||
Total current assets | 378,752 | 380,453 | |||||
Property, plant and equipment, net | 90,732 | 95,840 | |||||
Goodwill | 48,447 | 48,485 | |||||
Intangible assets, net | 19,830 | 24,370 | |||||
Operating lease right-of-use assets | 19,826 | — | |||||
Deferred income taxes | 4,409 | 1,833 | |||||
Other assets | 2,163 | 4,615 | |||||
Total assets | $ | 564,159 | $ | 555,596 | |||
LIABILITIES AND STOCKHOLDERS' EQUITY | |||||||
Current liabilities: | |||||||
Accounts payable | $ | 102,588 | $ | 107,282 | |||
Line of credit | 68,000 | 101,500 | |||||
Accrued compensation | 43,668 | 33,965 | |||||
Accrued sales discounts, rebates and royalties | 9,766 | 9,574 | |||||
Accrued income taxes | 6,989 | 3,524 | |||||
Other accrued liabilities | 35,445 | 24,011 | |||||
Total current liabilities | 266,456 | 279,856 | |||||
Long-term liabilities: | |||||||
Operating lease obligations | 15,639 | — | |||||
Long-term contingent consideration | 4,349 | 8,435 | |||||
Deferred income taxes | 1,703 | 930 | |||||
Income tax payable | 1,600 | 1,647 | |||||
Other long-term liabilities | 13 | 1,768 | |||||
Total liabilities | 289,760 | 292,636 | |||||
Commitments and contingencies | |||||||
Stockholders' equity: | |||||||
Preferred stock, $0.01 par value, 5,000,000 shares authorized; none issued or outstanding | — | — | |||||
Common stock, $0.01 par value, 50,000,000 shares authorized; 24,118,088 and 23,932,703 shares issued on December 31, 2019 and 2018, respectively | 241 | 239 | |||||
Paid-in capital | 288,338 | 276,103 | |||||
Treasury stock, at cost, 10,174,199 and 10,116,459 shares on December 31, 2019 and 2018, respectively | (277,817 | ) | (275,889 | ) | |||
Accumulated other comprehensive income (loss) | (22,781 | ) | (20,281 | ) | |||
Retained earnings | 286,418 | 282,788 | |||||
Total stockholders' equity | 274,399 | 262,960 | |||||
Total liabilities and stockholders' equity | $ | 564,159 | $ | 555,596 | |||
See Note 5 for further information concerning our purchases from related party vendors.
The accompanying notes are an integral part of these consolidated financial statements.
41
UNIVERSAL ELECTRONICS INC.
CONSOLIDATED STATEMENTS OF OPERATIONS
(In thousands, except per share amounts)
Year Ended December 31, | |||||||||||
2019 | 2018 | 2017 | |||||||||
Net sales | $ | 753,477 | $ | 680,241 | $ | 695,790 | |||||
Cost of sales | 583,274 | 538,437 | 530,083 | ||||||||
Gross profit | 170,203 | 141,804 | 165,707 | ||||||||
Research and development expenses | 29,412 | 23,815 | 21,416 | ||||||||
Factory transition restructuring charges | — | — | 6,145 | ||||||||
Selling, general and administrative expenses | 125,476 | 119,654 | 127,476 | ||||||||
Operating income (loss) | 15,315 | (1,665 | ) | 10,670 | |||||||
Interest income (expense), net | (3,918 | ) | (4,690 | ) | (2,534 | ) | |||||
Gain on sale of Guangzhou factory | — | 36,978 | — | ||||||||
Other income (expense), net | (995 | ) | (4,457 | ) | (848 | ) | |||||
Income before provision for income taxes | 10,402 | 26,166 | 7,288 | ||||||||
Provision for income taxes | 6,772 | 14,242 | 17,611 | ||||||||
Net income (loss) | $ | 3,630 | $ | 11,924 | $ | (10,323 | ) | ||||
Earnings (loss) per share: | |||||||||||
Basic | $ | 0.26 | $ | 0.85 | $ | (0.72 | ) | ||||
Diluted | $ | 0.26 | $ | 0.85 | $ | (0.72 | ) | ||||
Shares used in computing earnings (loss) per share: | |||||||||||
Basic | 13,879 | 13,948 | 14,351 | ||||||||
Diluted | 14,109 | 14,060 | 14,351 | ||||||||
See Note 5 for further information concerning our purchases from related party vendors.
The accompanying notes are an integral part of these consolidated financial statements.
42
UNIVERSAL ELECTRONICS INC.
CONSOLIDATED COMPREHENSIVE INCOME (LOSS) STATEMENTS
(In thousands)
Year Ended December 31, | |||||||||||
2019 | 2018 | 2017 | |||||||||
Net income (loss) | $ | 3,630 | $ | 11,924 | $ | (10,323 | ) | ||||
Other comprehensive income (loss): | |||||||||||
Change in foreign currency translation adjustment | (2,500 | ) | (3,682 | ) | 6,222 | ||||||
Comprehensive income (loss) | $ | 1,130 | $ | 8,242 | $ | (4,101 | ) | ||||
See Note 5 for further information concerning our purchases from related party vendors.
The accompanying notes are an integral part of these consolidated financial statements.
43
UNIVERSAL ELECTRONICS INC.
CONSOLIDATED STATEMENTS OF STOCKHOLDERS’ EQUITY
(In thousands)
Common Stock Issued | Common Stock in Treasury | Paid-in Capital | Accumulated Other Comprehensive Income (Loss) | Retained Earnings | Totals | ||||||||||||||||||||||||
Shares | Amount | Shares | Amount | ||||||||||||||||||||||||||
Balance at January 1, 2017 | 23,575 | $ | 236 | (9,023 | ) | $ | (222,980 | ) | $ | 250,481 | $ | (22,821 | ) | $ | 277,103 | $ | 282,019 | ||||||||||||
Net loss | (10,323 | ) | (10,323 | ) | |||||||||||||||||||||||||
Currency translation adjustment | 6,222 | 6,222 | |||||||||||||||||||||||||||
Shares issued for employee benefit plan and compensation | 99 | 1 | 647 | 648 | |||||||||||||||||||||||||
Purchase of treasury shares | (680 | ) | (39,085 | ) | (39,085 | ) | |||||||||||||||||||||||
Stock options exercised | 56 | 1 | 1,441 | 1,442 | |||||||||||||||||||||||||
Shares issued to directors | 30 | — | — | — | |||||||||||||||||||||||||
Employee and director stock-based compensation | 11,943 | 11,943 | |||||||||||||||||||||||||||
Performance-based common stock warrants | 683 | 683 | |||||||||||||||||||||||||||
Balance at December 31, 2017 | 23,760 | 238 | (9,703 | ) | (262,065 | ) | 265,195 | (16,599 | ) | 266,780 | 253,549 | ||||||||||||||||||
Impact to retained earnings from adoption of ASU 2016-09 | 4,084 | 4,084 | |||||||||||||||||||||||||||
Balance at January 1, 2018 | 23,760 | 238 | (9,703 | ) | (262,065 | ) | 265,195 | (16,599 | ) | 270,864 | 257,633 | ||||||||||||||||||
Net income | 11,924 | 11,924 | |||||||||||||||||||||||||||
Currency translation adjustment | (3,682 | ) | (3,682 | ) | |||||||||||||||||||||||||
Shares issued for employee benefit plan and compensation | 108 | 1 | 1,061 | 1,062 | |||||||||||||||||||||||||
Purchase of treasury shares | (413 | ) | (13,824 | ) | (13,824 | ) | |||||||||||||||||||||||
Stock options exercised | 35 | — | 864 | 864 | |||||||||||||||||||||||||
Shares issued to directors | 30 | — | — | — | |||||||||||||||||||||||||
Employee and director stock-based compensation | 8,820 | 8,820 | |||||||||||||||||||||||||||
Performance-based common stock warrants | 163 | 163 | |||||||||||||||||||||||||||
Balance at December 31, 2018 | 23,933 | 239 | (10,116 | ) | (275,889 | ) | 276,103 | (20,281 | ) | 282,788 | 262,960 | ||||||||||||||||||
Net income | 3,630 | 3,630 | |||||||||||||||||||||||||||
Currency translation adjustment | (2,500 | ) | (2,500 | ) | |||||||||||||||||||||||||
Shares issued for employee benefit plan and compensation | 133 | 2 | 945 | 947 | |||||||||||||||||||||||||
Purchase of treasury shares | (58 | ) | (1,928 | ) | (1,928 | ) | |||||||||||||||||||||||
Stock options exercised | 22 | — | 448 | 448 | |||||||||||||||||||||||||
Shares issued to directors | 30 | — | — | — | |||||||||||||||||||||||||
Employee and director stock-based compensation | 8,845 | 8,845 | |||||||||||||||||||||||||||
Performance-based common stock warrants | 1,997 | 1,997 | |||||||||||||||||||||||||||
Balance at December 31, 2019 | 24,118 | $ | 241 | (10,174 | ) | $ | (277,817 | ) | $ | 288,338 | $ | (22,781 | ) | $ | 286,418 | $ | 274,399 | ||||||||||||
See Note 5 for further information concerning our purchases from related party vendors.
The accompanying notes are an integral part of these consolidated financial statements.
44
UNIVERSAL ELECTRONICS INC.
CONSOLIDATED STATEMENTS OF CASH FLOWS
(In thousands)
Year Ended December 31, | |||||||||||
2019 | 2018 | 2017 | |||||||||
Cash provided by operating activities: | |||||||||||
Net income (loss) | $ | 3,630 | $ | 11,924 | $ | (10,323 | ) | ||||
Adjustments to reconcile net income (loss) to net cash provided by operating activities: | |||||||||||
Depreciation and amortization | 31,926 | 33,602 | 31,312 | ||||||||
Provision for doubtful accounts | 441 | 305 | 166 | ||||||||
Gain on sale of Guangzhou factory | — | (36,978 | ) | — | |||||||
Deferred income taxes | (1,779 | ) | 3,967 | 7,597 | |||||||
Shares issued for employee benefit plan | 947 | 1,062 | 648 | ||||||||
Employee and director stock-based compensation | 8,845 | 8,820 | 11,943 | ||||||||
Performance-based common stock warrants | 1,997 | 163 | 683 | ||||||||
Impairment of long-term assets | 1,506 | 4,907 | 4,100 | ||||||||
Changes in operating assets and liabilities: | |||||||||||
Accounts receivable and contract assets | 17,203 | 5,455 | (22,192 | ) | |||||||
Inventories | (1,914 | ) | (11,215 | ) | (25,797 | ) | |||||
Prepaid expenses and other assets | 4,648 | (587 | ) | (4,477 | ) | ||||||
Accounts payable and accrued liabilities | 14,233 | (7,386 | ) | 10,970 | |||||||
Accrued income taxes | 3,574 | (1,184 | ) | 4,535 | |||||||
Net cash provided by operating activities | 85,257 | 12,855 | 9,165 | ||||||||
Cash provided by (used for) investing activities: | |||||||||||
Proceeds from sale of Guangzhou factory | — | 51,291 | — | ||||||||
Acquisitions of property, plant and equipment | (21,313 | ) | (20,142 | ) | (40,384 | ) | |||||
Refund of deposit received toward sale of Guangzhou factory | — | (5,053 | ) | — | |||||||
Acquisitions of intangible assets | (2,655 | ) | (2,521 | ) | (1,949 | ) | |||||
Acquisition of net assets of Residential Control Systems, Inc. | — | — | (8,894 | ) | |||||||
Net cash provided by (used for) investing activities | (23,968 | ) | 23,575 | (51,227 | ) | ||||||
Cash provided by (used for) financing activities: | |||||||||||
Borrowings under line of credit | 72,500 | 68,000 | 157,000 | ||||||||
Repayments on line of credit | (106,000 | ) | (104,500 | ) | (68,987 | ) | |||||
Proceeds from stock options exercised | 448 | 864 | 1,442 | ||||||||
Treasury stock purchased | (1,928 | ) | (13,824 | ) | (39,085 | ) | |||||
Contingent consideration payments in connection with business combinations | (4,251 | ) | (3,858 | ) | — | ||||||
Net cash provided by (used for) financing activities | (39,231 | ) | (53,318 | ) | 50,370 | ||||||
Effect of exchange rate changes on cash, cash equivalents and restricted cash | (963 | ) | 2,756 | (803 | ) | ||||||
Net increase (decrease) in cash, cash equivalents and restricted cash | 21,095 | (14,132 | ) | 7,505 | |||||||
Cash, cash equivalents and restricted cash at beginning of year | 53,207 | 67,339 | 59,834 | ||||||||
Cash, cash equivalents and restricted cash at end of period | $ | 74,302 | $ | 53,207 | $ | 67,339 | |||||
Supplemental cash flow information: | |||||||||||
Income taxes paid | $ | 7,275 | $ | 7,658 | $ | 8,280 | |||||
Interest paid | $ | 4,403 | $ | 4,981 | $ | 2,751 | |||||
The accompanying notes are an integral part of these consolidated financial statements.
45
UNIVERSAL ELECTRONICS INC.
NOTES TO CONSOLIDATED FINANCIAL STATEMENTS
DECEMBER 31, 2019
Note 1 — Description of Business
Universal Electronics Inc. ("UEI"), based in Scottsdale, Arizona, designs, develops, manufactures and ships control and sensor technology solutions and a broad line of pre-programmed and universal control products, audio-video ("AV") accessories, and intelligent wireless security and smart home products that are used by the world's leading brands in the consumer electronics, subscription broadcasting, home entertainment, automation, security, hospitality and climate control markets. In addition, over the past 34 years, we have developed a broad portfolio of patented technologies and a database of home connectivity software that we license to our customers, including many leading Fortune 500 companies.
Our principal markets are the subscription broadcast, consumer and mobile electronics, residential security and hospitality markets where our customers include service providers, original equipment manufacturers ("OEMs"), international retailers, private label brands, pro-security dealers and companies in the computing industry. We sell directly to our customers and, for retail, we also sell through distributors throughout the world under the One For All® brand name.
We provide subscription broadcasting providers, both domestically and internationally, with our universal remote control devices and integrated circuits, on which our software and device code libraries are embedded. We also sell integrated circuits, on which our software and device control code libraries are embedded, and license our device control solutions to OEMs that manufacture televisions, digital audio and video players, streamer boxes, cable converters, satellite receivers, set-top boxes, room and central heating, ventilation and air conditioning equipment, game consoles, and wireless mobile phones and tablets.
As used herein, the terms "we", "us" and "our" refer to Universal Electronics Inc. and its subsidiaries unless the context indicates to the contrary.
Note 2 — Summary of Significant Accounting Policies
Principles of Consolidation
The consolidated financial statements include our accounts and those of our wholly-owned subsidiaries. All intercompany accounts and transactions have been eliminated in the consolidated financial statements.
Reclassifications
Certain prior period amounts in the accompanying consolidated financial statements have been reclassified to conform to the current year presentation. These reclassifications did not have a material effect on our previously reported consolidated balance sheets, net income or stockholders' equity.
Reportable Segment
An operating segment, in part, is a component of an enterprise whose operating results are regularly reviewed by the chief operating decision maker to make decisions about resources to be allocated to the segment and assess its performance. Operating segments may be aggregated only to a limited extent. Our chief operating decision maker, the Chief Executive Officer, reviews financial information presented on a consolidated basis, accompanied by disaggregated information about revenues for purposes of making operating decisions and assessing financial performance. Accordingly, we only have a single operating and reportable segment.
Estimates and Assumptions
The preparation of financial statements in conformity with accounting principles generally accepted in the United States of America ("U.S. GAAP") requires us to make estimates and assumptions that affect the reported amounts of assets and liabilities, disclosure of contingent assets and liabilities at the date of the financial statements, and the reported amounts of revenues and expenses during the reporting period. On an on-going basis, we evaluate our estimates and assumptions, including those related to revenue recognition, allowances for doubtful accounts, inventory valuation, impairment of long-lived assets, intangible assets and goodwill, business combinations, income taxes, stock-based compensation expense and performance-based common stock warrants. Actual results may differ from these assumptions and estimates, and they may be adjusted as more information becomes available. Any adjustment may be material.
Revenue Recognition
Revenue is recognized when control of a good or service is transferred to a customer. Control is considered to be transferred when the customer has the ability to direct the use of and obtain substantially all of the remaining benefits of that good or service.
46
Revenues are generated from manufacturing and delivering universal control, sensing and automation products and AV accessories, which are sold through multiple channels, and licensing intellectual property that is embedded in these products or licensed to others for use in their products.
Revenue - Product revenue is generated through manufacturing and delivering universal control, sensing and automation products and AV accessories, which are sold through multiple channels. Our performance obligations are satisfied over time or at a point in time, depending on the nature of the product. Our contracts have an anticipated duration of less than a year and consideration may be variable based on indeterminate volumes.
Revenue is recognized over time when our performance creates an asset with no alternative use to us (custom products) and we have an enforceable right to payment for performance completed to date, including a reasonable margin, through a contractual commitment from the customer. Custom products are those products for which we are unable to redirect the asset to another customer in the foreseeable future without significant rework. The method for measuring progress towards satisfying a performance obligation for a custom product is based on the costs incurred to date (cost-to-cost method). We believe that the costs associated with production are most closely aligned with the revenue associated with those products.
We recognize revenue at a point in time if the criteria for recognizing revenue over time are not met, the title of the goods has transferred and we have a present right to payment.
A provision is recorded for estimated sales returns and allowances and is deducted from gross sales to arrive at net sales in the period the related revenue is recorded. These estimates are based on historical sales returns and allowances, analysis of credit memo data and other known factors. Actual returns and claims in any future period are inherently uncertain and thus may differ from our estimates. If actual or expected future returns and claims are significantly greater or lower than the reserves that we have established, we will record a reduction or increase to net revenue in the period in which we make such a determination.
We license our intellectual property including our patented technologies and database of control codes. We record license revenue for per-unit based licenses when our customers manufacture or ship a product incorporating our intellectual property and we have a present right to payment. We record revenue upon delivery of intellectual property for fixed up-front fee licenses or if the contract contains a minimum guarantee. Tiered royalties are recorded on a straight-line basis according to the forecasted per-unit fees taking into account the pricing tiers.
Contract assets - Contract assets represent the value of revenue recognized over time for which we have not yet invoiced the customer. Generally, we invoice the customer within 90 days of revenue recognition.
Contract liabilities - A contract liability is recorded when consideration is received from a customer prior to fully satisfying a performance obligation in a contract. Our contract liabilities primarily consist of cash received in advance for non-recurring engineering and tooling services. These contract liabilities will be recognized as revenues when control of the related product or service is transferred to the customer. See Note 11 for further information concerning contract liabilities.
Other performance obligations - Payment terms are typically on open credit terms consistent with industry practice and do not have significant financing components. We accrue for discounts and rebates based on historical experience and our expectations regarding future sales to our customers. Accruals for discounts and rebates are recorded as a reduction to sales in the same period as the related revenue. Such discounts were $15.9 million and $14.6 million at December 31, 2019 and 2018, respectively. Changes in such accruals may be required if future rebates and incentives differ from our estimates.
Trade accounts receivable are recorded at the invoiced amount and do not bear interest. Sales allowances are recognized as reductions of gross accounts receivable to arrive at accounts receivable, net if the sales allowances are distributed in customer account credits. See Note 4 for further information concerning our sales allowances.
We present all non-income government-assessed taxes (sales, use and value added taxes) collected from our customers and remitted to governmental agencies on a net basis (excluded from revenue) in our financial statements. The government-assessed taxes are recorded in our consolidated balance sheets until they are remitted to the government agency.
Adoption of revenue recognition standard - On January 1, 2018, we adopted Accounting Standards Update ("ASU") 2014-09, "Revenue from Contracts with Customers," and all related amendments. The guidance provides a single, comprehensive revenue recognition model for all contracts with customers and supersedes most existing revenue recognition guidance. The primary impact to our revenue recognition policies resulting from this standard relates to the timing of revenue recognition for products which are customized for a specific customer. Results for reporting periods beginning after January 1, 2018 are presented under the new standard while prior periods have not been adjusted. We applied the modified retrospective method of adoption with the
47
cumulative effect of the initial adoption of $4.1 million reflected as an adjustment to the opening balance of retained earnings as of January 1, 2018.
Income Taxes
Income tax expense includes U.S. and foreign income taxes. We account for income taxes using the liability method. We record deferred tax assets and deferred tax liabilities on our balance sheet for expected future tax consequences of events recognized in our financial statements in a different period than our tax return using enacted tax rates that will be in effect when these differences reverse. We record a valuation allowance to reduce net deferred tax assets if we determine that it is more likely than not that the deferred tax assets will not be realized. A current tax asset or liability is recognized for the estimated taxes refundable or payable for the current year.
Accounting standards prescribe a recognition threshold and a measurement attribute for the financial statement recognition and measurement of positions taken or expected to be taken in a tax return. For those benefits to be recognized, a tax position must be more likely than not to be sustained upon examination by taxing authorities, or else a full reserve is established against the tax asset or a liability is recorded. A "more likely than not" tax position is measured as the largest amount of benefit that is greater than fifty percent likely of being realized upon ultimate settlement. See Note 9 for further information concerning income taxes.
Research and Development
Research and development costs are expensed as incurred and consist primarily of salaries, employee benefits, supplies and materials.
Advertising
Advertising costs are expensed as incurred. Advertising expense totaled $0.9 million, $1.3 million, and $1.1 million for the years ended December 31, 2019, 2018 and 2017, respectively.
Shipping and Handling Fees and Costs
We include shipping and handling fees billed to customers in net sales. Shipping and handling costs associated with in-bound freight are recorded in cost of goods sold. Other shipping and handling costs are included in selling, general and administrative expenses. Shipping and handling fees and costs totaled $13.2 million, $12.2 million and $12.2 million for the years ended December 31, 2019, 2018 and 2017, respectively.
Stock-Based Compensation
We recognize the grant date fair value of stock-based compensation awards as expense in proportion to vesting during the requisite service period, which ranges from one to four years. Forfeitures of stock-based awards are accounted for as they occur.
We determine the fair value of restricted stock awards utilizing the average of the high and low trading prices of our common shares on the date they were granted.
The fair value of stock options granted to employees and directors is determined utilizing the Black-Scholes option pricing model. The assumptions utilized in the Black-Scholes model include the risk-free interest rate, expected volatility, expected life in years and dividend yield. The risk-free interest rate over the expected term is equal to the prevailing U.S. Treasury note rate over the same period. Expected volatility is determined utilizing historical volatility over a period of time equal to the expected life of the stock option. Expected life is computed utilizing historical exercise patterns and post-vesting behavior. The dividend yield is assumed to be zero since we have not historically declared dividends and do not have any plans to declare dividends in the future. See Note 15 for further information regarding stock-based compensation.
Performance-Based Common Stock Warrants
The measurement date for performance-based common stock warrants is the date on which the warrants vest. We recognize the fair value of performance-based common stock warrants as a reduction to net sales ratably as the warrants vest based on the projected number of warrants that will vest, the proportion of the performance criteria achieved by the customer within the period relative to the total performance required (aggregate purchase levels) for the warrants to vest and the then-current fair value of the related unvested warrants. If we do not have a reliable forecast of future purchases to be made by the customer by which to estimate the number of warrants that will vest, then the maximum number of potential warrants is assumed until such time that a reliable
48
forecast of future purchases is available. To the extent that our projections change in the future as to the number of warrants that will vest, a cumulative catch-up adjustment will be recorded in the period in which our estimates change.
The fair value of performance-based common stock warrants is determined utilizing the Black-Scholes option pricing model. The assumptions utilized in the Black-Scholes model include the price of our common stock, the risk-free interest rate, expected volatility, expected life in years and dividend yield. The price of our common stock is equal to the average of the high and low trade prices of our common stock on the measurement date. The risk-free interest rate over the expected life is equal to the prevailing U.S. Treasury note rate over the same period. Expected volatility is determined utilizing historical volatility over a period of time equal to the expected life of the warrant. Expected life is equal to the remaining contractual term of the warrant. The dividend yield is assumed to be zero since we have not historically declared dividends and do not have any plans to declare dividends in the future. See Note 16 for further information regarding performance-based common stock warrants.
Foreign Currency Translation and Foreign Currency Transactions
We use the U.S. Dollar as our functional currency for financial reporting purposes. The functional currency for most of our foreign subsidiaries is their local currency. The translation of foreign currencies into U.S. Dollars is performed for balance sheet accounts using exchange rates in effect at the balance sheet dates and for revenue and expense accounts using the average exchange rate during each period. The gains and losses resulting from the translation are included in the foreign currency translation adjustment account, a component of accumulated other comprehensive income in stockholders' equity, and are excluded from net income. The portions of intercompany accounts receivable and accounts payable that are intended for settlement are translated at exchange rates in effect at the balance sheet date. Our intercompany foreign investments and long-term debt that are not intended for settlement are translated using historical exchange rates.
Transaction gains and losses generated by the effect of changes in foreign currency exchange rates on recorded assets and liabilities denominated in a currency different than the functional currency of the applicable entity are recorded in other income (expense), net. See Note 17 for further information concerning transaction gains and losses.
Earnings Per Share
Basic earnings per share is computed by dividing net income available to common stockholders by the weighted average number of common shares outstanding during the period. Diluted earnings per share is computed by dividing net income by the weighted average number of common shares and dilutive potential common shares, including the dilutive effect of stock options, restricted stock and common stock warrants, outstanding during the period. Dilutive potential common shares for all periods presented are computed utilizing the treasury stock method; however, dilutive potential common shares are excluded where their inclusion would be anti-dilutive.
Financial Instruments
Our financial instruments consist primarily of cash and cash equivalents, accounts receivable, accounts payable, accrued liabilities and debt. The carrying value of our financial instruments approximates fair value as a result of their short maturities. See Notes 3, 4, 8, 10, and 11 for further information concerning our financial instruments.
Cash and Cash Equivalents
Cash and cash equivalents include cash accounts and all investments purchased with initial maturities of three months or less. Domestically we generally maintain balances in excess of federally insured limits. We attempt to mitigate our exposure to liquidity, credit and other relevant risks by placing our cash and cash equivalents with financial institutions we believe are high quality. These financial institutions are located in many different geographic regions. As part of our cash and risk management processes, we perform periodic evaluations of the relative credit standing of our financial institutions. We have not sustained credit losses from instruments held at financial institutions. See Note 3 for further information concerning cash and cash equivalents.
Allowance for Doubtful Accounts
We maintain an allowance for doubtful accounts for estimated losses resulting from the inability of our customers to make payments for products sold or services rendered. The allowance for doubtful accounts is based on a variety of factors, including credit reviews, historical experience, length of time receivables are past due, current economic trends and changes in customer payment behavior.
49
We also record specific provisions for individual accounts when we become aware of a customer's inability to meet its financial obligations to us, such as in the case of bankruptcy filings or deterioration in the customer's operating results or financial position. If circumstances related to a customer change, our estimates of the recoverability of the receivables would be further adjusted.
See Note 4 for further information concerning our allowance for doubtful accounts.
Inventories
Inventories consist of remote controls, wireless sensors and AV accessories as well as the related component parts and raw materials. Inventoriable costs include materials, labor, freight-in and manufacturing overhead related to the purchase and production of inventories. We value our inventories at the lower of cost or net realizable value. Cost is determined using the first-in, first-out method. We attempt to carry inventories in amounts necessary to satisfy our customer requirements on a timely basis. See Note 5 for further information concerning our inventories and suppliers.
Product innovations and technological advances may shorten a given product's life cycle. We continually monitor our inventories to identify any excess or obsolete items on hand. We write down our inventories for estimated excess and obsolescence in an amount equal to the difference between the cost of the inventories and estimated net realizable value. These estimates are based upon management's judgment about future demand and market conditions.
Property, Plant, and Equipment
Property, plant, and equipment are recorded at cost. The cost of property, plant, and equipment includes the purchase price of the asset and all expenditures necessary to prepare the asset for its intended use. We capitalize additions and improvements and expense maintenance and repairs as incurred.
We capitalize certain internal and external costs incurred to acquire or create internal use software, principally related to software coding, designing system interfaces and installation and testing of the software.
For financial reporting purposes, depreciation is calculated using the straight-line method over the estimated useful lives of the respective assets. When assets are retired or otherwise disposed of, the cost and accumulated depreciation are removed from the appropriate accounts and any gain or loss is included as a component of depreciation expense.
Estimated useful lives are as follows:
Buildings | 25-33 Years |
Tooling and equipment | 2-7 Years |
Computer equipment | 3-5 Years |
Software | 3-7 Years |
Furniture and fixtures | 5-8 Years |
Leasehold and building improvements | Lesser of lease term or useful life (approximately 2 to 10 years) |
See Note 6 for further information concerning our property, plant, and equipment.
Leases
We adopted ASU 2016-02, "Leases," and all related amendments as of January 1, 2019.
We determine if an arrangement is a lease at inception and determine the classification of the lease, as either operating or finance, at commencement. Operating leases are included in operating lease right-of-use ("ROU") assets, other accrued liabilities and long-term operating lease obligations on our consolidated balance sheets. We presently do not have any finance leases.
ROU assets represent our right to use an underlying asset for the lease term and lease liabilities represent our obligation to make lease payments arising from the lease. Operating lease ROU assets and liabilities are recognized at the commencement date of the lease based on the present value of lease payments over the lease term. As most of our leases do not provide an implicit rate, we use our incremental borrowing rate based on the information available at the commencement date, including the lease term, in determining the present value of lease payments. Operating lease ROU assets also factor in any lease payments made, initial direct costs and lease incentives received. Our lease terms may include options to extend or terminate the lease when it is reasonably certain that we will exercise that option. Some of our leases include options to extend with a range of three to five years with up
50
to two extensions at the then current market rate. Lease expense for lease payments is recognized on a straight-line basis over the lease term.
Leases with an initial term of twelve months or less are not recorded on the balance sheet and are recognized on a straight-line basis over the lease term. If applicable, we combine lease and non-lease components, which primarily relate to ancillary expenses associated with real estate leases such as common area maintenance charges and management fees.
See Note 12 for further information concerning our leases.
Goodwill
We record the excess purchase price of net tangible and intangible assets acquired over their estimated fair value as goodwill. We evaluate the carrying value of goodwill on December 31 of each year and between annual evaluations if events occur or circumstances change that may reduce the fair value of the reporting unit below its carrying amount. Such circumstances may include, but are not limited to: (1) a significant adverse change in legal factors or in business climate, (2) unanticipated competition, or (3) an adverse action or assessment by a regulator.
Effective in the year ended December 31, 2019, we perform our annual impairment test using a qualitative assessment weighing the relative impact of factors that are specific to our single reporting unit as well as industry and macroeconomic factors. Based on the qualitative assessment performed, considering the aggregation of the relevant factors, we concluded that it is not more likely than not that the fair value of our single reporting unit is less than the carrying value. Therefore, performing a quantitative impairment test was unnecessary.
See Note 7 for further information concerning goodwill.
Long-Lived and Intangible Assets Impairment
Intangible assets consist of distribution rights, patents, trademarks and trade names, developed and core technologies, capitalized software development costs and customer relationships. Capitalized amounts related to patents represent external legal costs for the application, maintenance and extension of the useful life of patents. Intangible assets are amortized using the straight-line method over their estimated period of benefit, ranging from two to 15 years.
We assess the impairment of long-lived assets and intangible assets whenever events or changes in circumstances indicate that the carrying value may not be recoverable. Factors considered important which may trigger an impairment review include the following: (1) significant underperformance relative to historical or projected future operating results; (2) significant changes in the manner or use of the assets or strategy for the overall business; (3) significant negative industry or economic trends; and (4) a significant decline in our stock price for a sustained period.
We conduct an impairment review when we determine that the carrying value of a long-lived or intangible asset may not be recoverable based upon the existence of one or more of the above indicators of impairment. The asset is impaired if its carrying value exceeds the sum of the undiscounted cash flows expected to result from the use and eventual disposition of the asset. In assessing recoverability, we make assumptions regarding estimated future cash flows and other factors.
An impairment loss is the amount by which the carrying value of an asset exceeds its fair value. We estimate fair value utilizing the projected discounted cash flow method and a discount rate determined by our management to be commensurate with the risk inherent in our current business model. When calculating fair value, we make assumptions regarding estimated future cash flows, discount rates and other factors.
See Notes 6 for further information concerning long-lived assets. See Note 7 for further information concerning intangible assets.
Business Combinations
We allocate the purchase price of acquired businesses to the tangible and intangible assets and the liabilities assumed based on their estimated fair values on the acquisition date. The excess of the purchase price over the fair value of net assets acquired is recorded as goodwill. We engage independent third-party appraisal firms to assist us in determining the fair values of assets acquired and liabilities assumed. Such valuations require management to make significant fair value estimates and assumptions, especially with respect to intangible assets and contingent consideration. Management estimates the fair value of certain intangible assets and contingent consideration by utilizing the following (but not limited to):
• | future cash flow from customer contracts, customer lists, distribution agreements, acquired developed technologies, trademarks, trade names and patents; |
51
• | expected costs to complete development of in-process technology into commercially viable products and cash flows from the products once they are completed; |
• | brand awareness and market position as well as assumptions regarding the period of time the brand will continue to be used in our product portfolio; and |
• | discount rates utilized in discounted cash flow models. |
In those circumstances where an acquisition involves a contingent consideration arrangement, we recognize a liability equal to the fair value of the contingent payments we expect to make as of the acquisition date. We re-measure this liability at each reporting period and record changes in the fair value within operating expenses. Increases or decreases in the fair value of the contingent consideration liability can result from changes in discount periods and rates, as well as changes in the timing and amount of earnings estimates or in the timing or likelihood of achieving earnings-based milestones. Contingent consideration is recorded in other accrued liabilities and long-term contingent consideration in our consolidated balance sheets.
Results of operations and cash flows of acquired businesses are included in our operating results from the date of acquisition.
See Note 21 for further information concerning business combinations.
Derivatives
Our foreign currency exposures are primarily concentrated in the Argentinian Peso, Brazilian Real, British Pound, Chinese Yuan Renminbi, Euro, Indian Rupee, Japanese Yen, Mexican Peso and Philippine Peso. We periodically enter into foreign currency exchange contracts with terms normally lasting less than nine months to protect against the adverse effects that exchange-rate fluctuations may have on our foreign currency-denominated receivables, payables, cash flows and reported income. We do not enter into financial instruments for speculation or trading purposes.
The derivatives we enter into have not qualified for hedge accounting. The gains and losses on both the derivatives and the foreign currency-denominated balances are recorded as foreign exchange transaction gains or losses and are classified in other income (expense), net. Derivatives are recorded on the balance sheet at fair value. The estimated fair value of derivative financial instruments represents the amount required to enter into similar offsetting contracts with similar remaining maturities based on quoted market prices. See Note 19 for further information concerning derivatives.
Fair-Value Measurements
We measure fair value using the framework established by the Financial Accounting Standards Board ("FASB") for fair value measurements and disclosures. This framework requires fair value to be determined based on the exchange price that would be received for an asset or paid to transfer a liability (an exit price) in the principal or most advantageous market for the asset or liability in an orderly transaction between market participants.
The valuation techniques are based upon observable and unobservable inputs. Observable or market inputs reflect market data obtained from independent sources. Unobservable inputs require management to make certain assumptions and judgments based on the best information available. Observable inputs are the preferred data source. These two types of inputs result in the following fair value hierarchy:
Level 1: | Quoted prices (unadjusted) for identical instruments in active markets. |
Level 2: | Quoted prices for similar instruments in active markets, quoted prices for identical or similar instruments in markets that are not active, and model-based valuation techniques for which all significant assumptions are observable in the market or can be corroborated by observable market data for substantially the full term of the assets or liabilities. |
Level 3: | Prices or valuations that require management inputs that are both significant to the fair value measurement and unobservable. |
Recently Adopted Accounting Pronouncements
In February 2016, the FASB issued ASU 2016-02 (with amendments issued in 2018), which changes the accounting for leases and requires expanded disclosures about leasing activities. This new guidance also requires lessees to recognize a ROU asset and a lease liability at the commencement date for all leases with terms greater than twelve months. Accounting by lessors is largely unchanged. ASU 2016-02 is effective for fiscal periods beginning after December 15, 2018. We adopted ASU 2016-02 on January 1, 2019 using the modified retrospective optional transition method. Thus, the standard was applied starting January 1, 2019 and prior periods were not restated.
52
We applied the package of practical expedients permitted under the transition guidance. As a result, we did not reassess the identification, classification and initial direct costs of leases commencing before the effective date. We also applied the practical expedient to not separate lease and non-lease components to all new leases as well as leases commencing before the effective date.
Upon adoption, ASU 2016-02 resulted in the recognition of lease ROU assets, accrued liabilities and long-term liabilities related to operating leases of $20.7 million, $3.3 million and $17.0 million, respectively. In addition, assets and liabilities totaling $2.5 million and $2.3 million, respectively, were reclassified into the opening ROU asset balance. The adoption of ASU 2016-02 did not result in any cumulative-effect adjustment to the opening balance of retained earnings and did not have any impact on our results of operations, cash flows or debt covenants. See Note 12 for additional information.
Other Accounting Pronouncements
In June 2018, the FASB issued ASU 2018-07, "Improvements to Non-employee Share-Based Payment Accounting." This guidance expands the scope of Topic 718 "Compensation - Stock Compensation" to include share-based payment transactions for acquiring goods and services from non-employees, but excludes awards granted in conjunction with selling goods or services to a customer as part of a contract accounted for under ASC 606, "Revenue from Contracts with Customers." The adoption of ASU 2018-07 did not have a material impact on our consolidated financial statements.
In August 2018, the FASB issued ASU 2018-15, "Customer’s Accounting for Implementation Costs Incurred in a Cloud Computing Arrangement That Is a Service Contract," which amends ASC 350-40, "Intangibles - Goodwill and Other - Internal-Use Software." The ASU aligns the requirements for capitalizing implementation costs incurred in a hosting arrangement that is a service contract with the requirements for capitalizing implementation costs incurred to develop or obtain internal-use software and requires the capitalized implementation costs to be expensed over the term of the hosting arrangement. The accounting for the service element of a hosting arrangement that is a service contract is not affected. ASU 2018-15 is effective for fiscal periods beginning after December 15, 2019, and interim periods within those fiscal years. The adoption of ASU 2018-15, effective January 1, 2019, did not have a material impact on our consolidated financial statements.
Recent Accounting Updates Not Yet Effective
In December 2019, the FASB issued ASU 2019-12, "Simplifying the Accounting for Income Taxes." This guidance, among other provisions, eliminates certain exceptions to existing guidance related to the approach for intraperiod tax allocation, the methodology for calculating income taxes in an interim period and the recognition of deferred tax liabilities for outside basis differences. This guidance also requires an entity to reflect the effect of an enacted change in tax laws or rates in its effective income tax rate in the first interim period that includes the enactment date of the new legislation, aligning the timing of recognition of the effects from enacted tax law changes on the effective income tax rate with the effects on deferred income tax assets and liabilities. Under existing guidance, an entity recognizes the effects of the enacted tax law change on the effective income tax rate in the period that includes the effective date of the tax law. ASU 2019-12 is effective for interim and annual periods beginning after December 15, 2020, with early adoption permitted. We are currently evaluating the impact of this guidance.
In June 2016, the FASB issued ASU 2016-13, "Measurement of Credit Losses on Financial Instruments." This guidance updates existing guidance for measuring and recording credit losses on financial assets measured at amortized cost by replacing the "incurred loss" model with an "expected loss" model. Accordingly, these financial assets will be presented at the net amount expected to be collected. ASU 2016-13 is effective for fiscal years beginning after December 15, 2019. Early adoption is permitted. We do not expect the adoption of ASU 2016-13 will have a material impact on our consolidated financial statements.
In January 2017, the FASB issued ASU 2017-04, "Simplifying the Test for Goodwill Impairment." This guidance simplifies how an entity is required to test goodwill for impairment by eliminating Step 2 from the goodwill impairment test. Instead, if the carrying amount of a reporting unit exceeds its fair value, an impairment loss will be recognized in an amount equal to that excess, limited to the total amount of goodwill allocated to the reporting unit. ASU 2017-04 is effective for fiscal periods beginning after December 31, 2019. Early adoption is permitted. We do not expect the adoption of ASU 2017-04 to have a material impact on our consolidated financial statements.
53
Note 3 — Cash and Cash Equivalents
Cash and cash equivalents were held in the following geographic regions:
December 31, | |||||||
(In thousands) | 2019 | 2018 | |||||
United States | $ | 16,751 | $ | 1,156 | |||
People's Republic of China ("PRC") | 13,700 | 20,885 | |||||
Asia (excluding the PRC) | 21,691 | 2,398 | |||||
Europe | 9,081 | 19,907 | |||||
South America | 13,079 | 8,861 | |||||
Total cash and cash equivalents | $ | 74,302 | $ | 53,207 | |||
Note 4 — Revenue and Accounts Receivable, Net
Revenue Details
The pattern of revenue recognition was as follows:
Year Ended December 31, | |||||||
(In thousands) | 2019 | 2018 | |||||
Goods and services transferred at a point in time | $ | 558,361 | $ | 577,085 | |||
Goods and services transferred over time | 195,116 | 103,156 | |||||
Net sales | $ | 753,477 | $ | 680,241 | |||
Our net sales to external customers by geographic area were as follows:
Year Ended December 31, | |||||||||||
(In thousands) | 2019 | 2018 | 2017 | ||||||||
United States | $ | 407,291 | $ | 315,214 | $ | 345,838 | |||||
Asia (excluding PRC) | 104,324 | 124,657 | 104,668 | ||||||||
People’s Republic of China | 83,677 | 91,446 | 83,036 | ||||||||
Europe | 94,491 | 85,228 | 79,183 | ||||||||
Latin America | 30,006 | 30,954 | 54,113 | ||||||||
Other | 33,688 | 32,742 | 28,952 | ||||||||
Total net sales | $ | 753,477 | $ | 680,241 | $ | 695,790 | |||||
Specific identification of the customer billing location was the basis used for attributing revenues from external customers to geographic areas.
Net sales to the following customers totaled more than 10% of our net sales:
Year Ended December 31, | ||||||||||||||||||||
2019 | 2018 | 2017 | ||||||||||||||||||
$ (thousands) | % of Net Sales | $ (thousands) | % of Net Sales | $ (thousands) | % of Net Sales | |||||||||||||||
Comcast Corporation | $ | 119,561 | 15.9 | % | $ | 119,809 | 17.6 | % | $ | 159,829 | 23.0 | % | ||||||||
AT&T Inc. | — | (1) | — | (1) | — | (1) | — | (1) | 77,888 | 11.2 | ||||||||||
(1) Sales associated with this customer did not total more than 10% of our net sales for the indicated period.
54
Accounts Receivable, Net
Accounts receivable, net were as follows:
December 31, | |||||||
(In thousands) | 2019 | 2018 | |||||
Trade receivables, gross | $ | 130,888 | $ | 133,774 | |||
Allowance for doubtful accounts | (1,492 | ) | (1,121 | ) | |||
Allowance for sales returns | (623 | ) | (731 | ) | |||
Net trade receivables | 128,773 | 131,922 | |||||
Other | 10,425 | 12,767 | |||||
Accounts receivable, net | $ | 139,198 | $ | 144,689 | |||
Allowance for Doubtful Accounts
Changes in the allowance for doubtful accounts were as follows:
(In thousands) | Year Ended December 31, | ||||||||||
2019 | 2018 | 2017 | |||||||||
Balance at beginning of period | $ | 1,121 | $ | 1,064 | $ | 904 | |||||
Additions to costs and expenses | 441 | 305 | 166 | ||||||||
(Write-offs)/Foreign exchange effects | (70 | ) | (248 | ) | (6 | ) | |||||
Balance at end of period | $ | 1,492 | $ | 1,121 | $ | 1,064 | |||||
Trade receivables associated with these significant customers that totaled more than 10% of our accounts receivable, net were as follows:
December 31, | |||||||||||
2019 | 2018 | ||||||||||
$ (thousands) | % of Accounts Receivable, Net | $ (thousands) | % of Accounts Receivable, Net | ||||||||
Dish Network Corporation | 14,677 | 10.5 | % | — | (1) | — | (1) | ||||
(1) Trade receivables associated with this customer did not total more than 10% of our accounts receivable, net for the indicated period.
Note 5 — Inventories, Net and Significant Suppliers
Inventories, net were as follows:
December 31, | |||||||
(In thousands) | 2019 | 2018 | |||||
Raw materials | $ | 61,220 | $ | 68,834 | |||
Components | 25,239 | 25,071 | |||||
Work in process | 1,526 | 5,577 | |||||
Finished goods | 68,175 | 50,006 | |||||
Reserve for excess and obsolete inventory | (11,025 | ) | (5,138 | ) | |||
Inventories, net | $ | 145,135 | $ | 144,350 | |||
55
Reserve for Excess and Obsolete Inventory
Changes in the reserve for excess and obsolete inventory were as follows:
Year Ended December 31, | |||||||||||
(In thousands) | 2019 | 2018 | 2017 | ||||||||
Balance at beginning of period | $ | 5,138 | $ | 4,288 | $ | 4,205 | |||||
Additions charged to costs and expenses | 12,792 | 6,702 | 3,685 | ||||||||
Sell through (1) | (1,500 | ) | (1,825 | ) | (1,242 | ) | |||||
(Write-offs)/Foreign exchange effects | (5,405 | ) | (4,027 | ) | (2,360 | ) | |||||
Balance at end of period | $ | 11,025 | $ | 5,138 | $ | 4,288 | |||||
(1) | These amounts represent the reversal of reserves associated with inventory items that were sold during the period. |
Significant Suppliers
We purchase integrated circuits, components and finished goods from multiple sources. Purchases from the following supplier totaled more than 10% of our total inventory purchases:
Year Ended December 31, | ||||||||||||||||
2019 | 2018 | 2017 | ||||||||||||||
$ (thousands) | % of Total Inventory Purchases | $ (thousands) | % of Total Inventory Purchases | $ (thousands) | % of Total Inventory Purchases | |||||||||||
Texas Instruments | — | (1) | — | (1) | — | (1) | — | (1) | $ | 42,058 | 10.0 | % | ||||
(1) Purchases associated with this supplier did not total more than 10% of our total inventory purchases for the indicated period.
Accounts payable from our supplier, Zhejiang Zhen You Electronics Co. Ltd., totaled $11.4 million or 11.1% of our accounts payable balance at December 31, 2019.
Related Party Supplier
During the years ended December 31, 2018 and 2017, we purchased certain printed circuit board assemblies from a related party supplier. The supplier was considered a related party for financial reporting purposes because our Senior Vice President of Strategic Operations owned 40% of this supplier. In the second quarter of 2018, our Senior Vice President sold his interest in this supplier, and thus this supplier is no longer considered a related party.
Total inventory purchases made from this supplier while it was a related party were $1.1 million and $5.2 million during the twelve months ended December 31, 2018, and 2017, respectively.
56
Note 6 — Property, Plant, and Equipment, Net
Property, plant, and equipment, net were as follows:
December 31, | |||||||
(In thousands) | 2019 | 2018 | |||||
Buildings | $ | 18,570 | $ | 18,799 | |||
Machinery and equipment | 94,274 | 87,700 | |||||
Tooling | 32,267 | 29,575 | |||||
Leasehold and building improvements | 37,527 | 34,486 | |||||
Software | 25,910 | 25,406 | |||||
Furniture and fixtures | 3,905 | 2,572 | |||||
Computer equipment | 9,935 | 8,551 | |||||
222,388 | 207,089 | ||||||
Accumulated depreciation | (135,254 | ) | (116,805 | ) | |||
87,134 | 90,284 | ||||||
Construction in progress | 3,598 | 5,556 | |||||
Total property, plant, and equipment, net | $ | 90,732 | $ | 95,840 | |||
Depreciation expense was $24.7 million, $26.4 million and $24.4 million for the years ended December 31, 2019, 2018, and 2017, respectively.
The net book value of property, plant and equipment located within the PRC was $61.7 million and $76.4 million on December 31, 2019 and 2018, respectively. The net book value of property, plant and equipment located in Mexico was $13.6 million and $3.3 million on December 31, 2019 and 2018, respectively.
During the year ended December 31, 2018, we incurred $2.9 million in impairment on tooling and equipment as a result of the transition of manufacturing operations between our PRC-based manufacturing facilities following the closure of our Guangzhou factory, which was sold in 2018. We incurred an additional $0.1 million and $2.0 million of impairment on factory equipment during the years ended December 31, 2019 and 2018, respectively, as a result of the transition of certain manufacturing operations out of the PRC in response to tariffs enacted in the U.S. in 2018 on certain products manufactured in the PRC and imported into the U.S. These impairment charges, aggregating to $0.1 million and $4.9 million, are recorded within cost of goods sold for the year ended December 31, 2019 and 2018, respectively.
Construction in progress was as follows:
December 31, | |||||||
(In thousands) | 2019 | 2018 | |||||
Machinery and equipment | 1,428 | 2,444 | |||||
Tooling | 759 | 1,581 | |||||
Leasehold and building improvements | 574 | 675 | |||||
Software | 518 | 352 | |||||
Other | 319 | 504 | |||||
Total construction in progress | $ | 3,598 | $ | 5,556 | |||
We expect that most of the assets under construction will be placed into service during the first six months of 2020. We will begin to depreciate the cost of these assets under construction once they are placed into service.
57
Long-lived tangible assets by geographic area were as follows:
December 31, | |||||||
(In thousands) | 2019 | 2018 | |||||
United States | $ | 13,016 | $ | 14,504 | |||
People's Republic of China | 62,148 | 79,382 | |||||
Mexico | 13,673 | 3,362 | |||||
All other countries | 4,058 | 3,207 | |||||
Total long-lived tangible assets | $ | 92,895 | $ | 100,455 | |||
Note 7 — Goodwill and Intangible Assets, Net
Goodwill
Changes in the carrying amount of goodwill were as follows:
(In thousands) | |||
Balance at December 31, 2017 | $ | 48,651 | |
Foreign exchange effects | (166 | ) | |
Balance at December 31, 2018 | 48,485 | ||
Foreign exchange effects | (38 | ) | |
Balance at December 31, 2019 | $ | 48,447 | |
We conducted annual goodwill impairment reviews on December 31, 2019, 2018, and 2017. Based on the analysis performed, we determined that our goodwill was not impaired.
Intangible Assets, Net
The components of intangible assets, net were as follows:
December 31, | |||||||||||||||||||||||
2019 | 2018 | ||||||||||||||||||||||
(In thousands) | Gross (1) | Accumulated Amortization (1) | Net (1) | Gross (1) | Accumulated Amortization (1) | Net (1) | |||||||||||||||||
Distribution rights (10 years) | $ | 322 | $ | (210 | ) | $ | 112 | $ | 329 | $ | (188 | ) | $ | 141 | |||||||||
Patents (10 years) | 16,587 | (6,491 | ) | 10,096 | 14,560 | (5,704 | ) | 8,856 | |||||||||||||||
Trademarks and trade names (10 years) | 2,785 | (2,205 | ) | 580 | 2,786 | (1,900 | ) | 886 | |||||||||||||||
Developed and core technology (5-15 years) | 12,480 | (10,016 | ) | 2,464 | 12,560 | (8,087 | ) | 4,473 | |||||||||||||||
Capitalized software development costs (2 years) | — | — | — | 155 | — | 155 | |||||||||||||||||
Customer relationships (10-15 years) | 32,534 | (25,956 | ) | 6,578 | 32,534 | (22,675 | ) | 9,859 | |||||||||||||||
Total intangible assets, net | $ | 64,708 | $ | (44,878 | ) | $ | 19,830 | $ | 62,924 | $ | (38,554 | ) | $ | 24,370 | |||||||||
(1) | This table excludes the gross value of fully amortized intangible assets totaling $7.4 million and $7.1 million on December 31, 2019 and 2018, respectively. |
58
Amortization expense is recorded in selling, general and administrative expenses, except amortization expense related to capitalized software development costs, which is recorded in cost of sales. Amortization expense by statement of operations caption was as follows:
Year Ended December 31, | |||||||||||
(In thousands) | 2019 | 2018 | 2017 | ||||||||
Cost of sales | $ | — | $ | 103 | $ | 184 | |||||
Selling, general and administrative expenses | 7,192 | 7,081 | 6,772 | ||||||||
Total amortization expense | $ | 7,192 | $ | 7,184 | $ | 6,956 | |||||
Estimated future annual amortization expense related to our intangible assets at December 31, 2019, is as follows:
(In thousands) | |||
2020 | $ | 6,101 | |
2021 | 2,531 | ||
2022 | 2,500 | ||
2023 | 2,354 | ||
2024 | 1,774 | ||
Thereafter | 4,570 | ||
Total | $ | 19,830 | |
The remaining weighted average amortization period of our intangible assets is 5.3 years.
Note 8 — Line of Credit
On November 1, 2019, we extended the term of our Second Amended and Restated Credit Agreement ("Second Amended Credit Agreement") with U.S. Bank National Association ("U.S. Bank") to November 1, 2021. The Second Amended Credit Agreement provided for a $130.0 million revolving line of credit ("Credit Line") through June 30, 2019 and a $125.0 million Credit Line thereafter and through its expiration date. The Credit Line may be used for working capital and other general corporate purposes including acquisitions, share repurchases and capital expenditures. Amounts available for borrowing under the Credit Line are reduced by the balance of any outstanding letters of credit, of which there were $2.7 million at December 31, 2019.
All obligations under the Credit Line are secured by substantially all of our U.S. personal property and tangible and intangible assets as well as 65% of our ownership interest in Enson Assets Limited, our wholly-owned subsidiary which controls our manufacturing factories in the PRC.
Under the Second Amended Credit Agreement, we may elect to pay interest on the Credit Line based on LIBOR plus an applicable margin (varying from 1.25% to 1.75%) or base rate (based on the prime rate of U.S. Bank or as otherwise specified in the Second Amended Credit Agreement) plus an applicable margin (varying from 0.00% to 0.50% ). The applicable margins are calculated quarterly and vary based on our cash flow leverage ratio as set forth in the Second Amended Credit Agreement. The interest rate in effect at December 31, 2019 was 3.03%. There are no commitment fees or unused line fees under the Second Amended Credit Agreement.
The Second Amended Credit Agreement includes financial covenants requiring a minimum fixed charge coverage ratio and a maximum cash flow leverage ratio. In addition, the Second Amended Credit Agreement contains other customary affirmative and negative covenants and events of default. As of December 31, 2019, we were in compliance with the covenants and conditions of the Second Amended Credit Agreement.
At December 31, 2019, we had $68.0 million outstanding under the Credit Line. Our total interest expense on borrowings was $4.3 million, $5.0 million and $2.7 million during the years ended December 31, 2019, 2018 and 2017, respectively.
59
Note 9 — Income Taxes
In 2019, 2018 and 2017, pre-tax income (loss) was attributed to the following jurisdictions:
Year Ended December 31, | |||||||||||
(In thousands) | 2019 | 2018 | 2017 | ||||||||
Domestic operations | $ | (28,929 | ) | $ | (28,482 | ) | $ | (12,852 | ) | ||
Foreign operations | 39,331 | 54,648 | 20,140 | ||||||||
Total | $ | 10,402 | $ | 26,166 | $ | 7,288 | |||||
The provision for income taxes charged to operations was as follows:
Year Ended December 31, | |||||||||||
(In thousands) | 2019 | 2018 | 2017 | ||||||||
Current tax expense: | |||||||||||
U.S. federal | $ | (188 | ) | $ | (1,074 | ) | $ | 3,406 | |||
State and local | 82 | 83 | 72 | ||||||||
Foreign | 8,217 | 10,829 | 8,304 | ||||||||
Total current | 8,111 | 9,838 | 11,782 | ||||||||
Deferred tax (benefit) expense: | |||||||||||
U.S. federal | — | 3,961 | 9,495 | ||||||||
State and local | — | 1,930 | (369 | ) | |||||||
Foreign | (1,339 | ) | (1,487 | ) | (3,297 | ) | |||||
Total deferred | (1,339 | ) | 4,404 | 5,829 | |||||||
Total provision for income taxes | $ | 6,772 | $ | 14,242 | $ | 17,611 | |||||
60
Net deferred tax assets were comprised of the following:
December 31, | |||||||
(In thousands) | 2019 | 2018 | |||||
Deferred tax assets: | |||||||
Inventory reserves | $ | 2,887 | $ | 1,428 | |||
Capitalized research costs | — | 22 | |||||
Capitalized inventory costs | 3,156 | 1,541 | |||||
Net operating losses | 2,644 | 2,810 | |||||
Acquired tangible assets | 71 | 1,204 | |||||
Accrued liabilities | 4,070 | 1,090 | |||||
Income tax credits | 11,800 | 10,020 | |||||
Operating lease obligations | 7,878 | — | |||||
Stock-based compensation | 4,018 | 3,181 | |||||
Amortization of intangible assets | 2,169 | 1,135 | |||||
Total deferred tax assets | 38,693 | 22,431 | |||||
Deferred tax liabilities: | |||||||
Depreciation | 426 | 661 | |||||
Allowance for doubtful accounts | (270 | ) | (739 | ) | |||
Right of use assets | (7,480 | ) | — | ||||
Other | (3,866 | ) | (4,189 | ) | |||
Total deferred tax liabilities | (11,190 | ) | (4,267 | ) | |||
Net deferred tax assets before valuation allowance | 27,503 | 18,164 | |||||
Less: Valuation allowance | (24,797 | ) | (17,261 | ) | |||
Net deferred tax assets | $ | 2,706 | $ | 903 | |||
61
The provision for income taxes differs from the amount of income tax determined by applying the applicable U.S. statutory federal income tax rate to pre-tax income from operations as a result of the following:
Year Ended December 31, | |||||||||||
(In thousands) | 2019 | 2018 | 2017 | ||||||||
Tax provision at statutory U.S. rate | $ | 2,185 | $ | 5,495 | $ | 2,551 | |||||
Increase (decrease) in tax provision resulting from: | |||||||||||
State and local taxes, net | (1,903 | ) | (1,792 | ) | (733 | ) | |||||
Foreign tax rate differential | (1,810 | ) | (2,079 | ) | (296 | ) | |||||
Foreign undistributed earnings, net of credits | 1,181 | 5,329 | 14,211 | ||||||||
Nondeductible items | 1,236 | 1,197 | 891 | ||||||||
Federal research and development credits | (884 | ) | (713 | ) | (620 | ) | |||||
Non-territorial income | (1,806 | ) | (1,079 | ) | (1,517 | ) | |||||
Withholding tax | 1,082 | 5,454 | 1,078 | ||||||||
Uncertain tax positions | (294 | ) | (159 | ) | 1,344 | ||||||
Stock-based compensation | 262 | 213 | 479 | ||||||||
Federal tax rate change | (412 | ) | 466 | 686 | |||||||
Valuation allowance | 7,524 | 8,057 | 149 | ||||||||
Foreign permanent benefit | (856 | ) | (7,077 | ) | (451 | ) | |||||
Provision to return | 584 | — | — | ||||||||
Other | 683 | 930 | (161 | ) | |||||||
Tax provision | $ | 6,772 | $ | 14,242 | $ | 17,611 | |||||
At December 31, 2019, we had federal and state Research and Experimentation ("R&E") income tax credit carryforwards of $1.5 million and $10.2 million, respectively. The federal R&E income tax credits begin expiring in 2038. The state R&E income tax credits do not have an expiration date.
At December 31, 2019, we had state and foreign net operating loss carryforwards of $26.2 million and $3.3 million, respectively. The state and foreign carryforwards begin to expire in 2026 and 2023, respectively.
At December 31, 2019, we assessed the realizability of our deferred tax assets by considering whether it is "more likely than not" some portion or all of the deferred tax assets will not be realized. The ultimate realization of deferred tax assets is dependent upon the generation of future taxable income during the periods in which those temporary differences become deductible. We considered taxable income in carryback years, the scheduled reversal of deferred tax liabilities, tax planning strategies and projected future taxable income in making this assessment. Due to uncertainties surrounding the realization of some of our deferred tax assets, we established a valuation allowance against certain deferred tax assets. Our historic valuation allowance primarily relates to state R&E income tax credits generated during the prior years and current year. We had cumulative operating losses for the three years ended in 2019 for our U.S. operations and state operations and accordingly, have provided a full valuation allowance on our U.S. federal and state deferred tax assets of $5.8 million and $1.0 million, respectively, as we have determined that it is more likely than not that the tax benefits will not be realized in the future. Additionally, we recorded a valuation allowance of $0.3 million at December 31, 2019 related to certain deferred tax assets in our Argentina office due to sustained losses in that jurisdiction. If and when recognized, the tax benefits relating to any reversal of valuation allowance will be recorded as a reduction of income tax expense. The valuation allowance increased by $7.5 million and $8.5 million during the years ended December 31, 2019 and 2018, respectively.
Uncertain Tax Positions
At December 31, 2019 and 2018, we had unrecognized tax benefits of approximately $4.3 million and $4.6 million, respectively, including interest and penalties. In accordance with accounting guidance, we have elected to classify interest and penalties as components of tax expense. Interest and penalties were $0.2 million, $0.5 million, and $0.5 million for the years ended December 31, 2019, 2018 and 2017, respectively. Interest and penalties are included in the unrecognized tax benefits.
62
Changes to our gross unrecognized tax benefits were as follows:
Year Ended December 31, | |||||||||||
(In thousands) | 2019 | 2018 | 2017 | ||||||||
Balance at beginning of period | $ | 4,040 | $ | 5,081 | $ | 3,622 | |||||
Additions as a result of tax provisions taken during the current year | 473 | 702 | 1,489 | ||||||||
Foreign currency translation | (100 | ) | (51 | ) | 90 | ||||||
Lapse in statute of limitations | (92 | ) | (80 | ) | (141 | ) | |||||
Settlements | (227 | ) | (1,612 | ) | — | ||||||
Other | — | — | 21 | ||||||||
Balance at end of period | $ | 4,094 | $ | 4,040 | $ | 5,081 | |||||
Approximately $4.3 million, $4.3 million and $5.3 million of the total amount of unrecognized tax benefits at December 31, 2019, 2018 and 2017, respectively, if not for the state R&E income tax credit valuation allowance, would affect the annual effective tax rate, if recognized. We are unaware of any positions for which it is reasonably possible that the total amounts of unrecognized tax benefits will significantly increase within the next twelve months. We anticipate a decrease in unrecognized tax benefits of approximately $0.2 million within the next twelve months based on federal, state, and foreign statute expirations in various jurisdictions. We have classified uncertain tax positions as non-current income tax liabilities unless expected to be paid within one year.
We file income tax returns in the U.S. federal jurisdiction and in various state and foreign jurisdictions. As of December 31, 2019, the open statutes of limitations for our significant tax jurisdictions are as follows: federal for 2016 through 2018, state for 2015 through 2018, and non-U.S. for 2013 through 2018.
U.S. Tax Cuts and Jobs Act
The Tax Cuts and Jobs Act (the "Tax Act") was enacted in the U.S. on December 22, 2017. The Tax Act reduced the U.S. federal corporate income tax rate to 21% from 35%, required companies to pay a one-time transition tax on earnings of certain foreign subsidiaries that were previously tax deferred and created new taxes on certain foreign-sourced earnings. In 2017 and the first nine months of 2018, we recorded provisional amounts for certain enactment-date effects of the Tax Act by applying the guidance in SEC Staff Accounting Bulletin No. 118 because we had not yet completed our enactment-date accounting for these effects. In 2018 and 2017, we recorded tax expense related to the enactment-date effects of the Tax Act that included recording the one-time transition tax liability related to undistributed earnings of certain foreign subsidiaries that were not previously taxed, adjusting deferred tax assets and liabilities and recognizing the effects of provisionally electing to account for Global Intangible Low-Taxed Income ("GILTI") as a period cost. The changes to 2017 enactment-date provisional amounts decreased tax expense in 2018 by an insignificant amount.
In 2019, federal and state tax authorities issued additional guidance related to transition tax, GILTI, deduction for foreign-derived intangible income and GILTI, tax treatment of qualified transportation fringe benefits, timing of income recognition, cost recovery and bonus depreciation, and business interest expense limitation. This guidance generally provided additional information related to the calculation of such items that became effective in 2017 and 2018. We reviewed and applied the guidance in the period such information was published. The application of the issued guidance in 2019 did not materially change our tax expense estimated in prior years.
SAB 118 Measurement Period
We applied the guidance in SAB 118 when accounting for the enactment-date effects of the Act in 2017 and throughout 2018. At December 31, 2017, we had not completed our accounting for all of the enactment-date income tax effects of the Tax Act under ASC 740, "Income Taxes," for the following aspects: remeasurement of deferred tax assets and liabilities, one-time transition tax, and tax on GILTI. At December 31, 2018, we had completed our accounting for all of the enactment-date income tax effects of the Tax Act.
Transition Tax
The one-time transition tax is based on our total post-1986 earnings and profits, the tax on which we previously deferred from U.S. income taxes under U.S. law. We recorded a provisional amount for our one-time transition tax liability for each of our foreign subsidiaries, resulting in a transition tax liability of $2.2 million at December 31, 2017. Upon further analyses of the Tax Act and
63
Notices and regulations issued and proposed by the U.S. Department of the Treasury and the Internal Revenue Service, we finalized our calculations of the transition tax liability during 2018. We decreased our December 31, 2017 provisional amount by an immaterial amount, which is included as a component of income tax expense during the year ended December 31, 2018. We have elected to pay our transition tax over the eight-year period provided in the Tax Act. As of December 31, 2019, the remaining balance of our transition tax obligation was $1.1 million, which will be paid over the next five years.
Deferred Tax Assets and Liabilities
As of December 31, 2017, we remeasured certain deferred tax assets and liabilities based on the rates at which they were expected to reverse in the future (which was generally 21%), by recording a provisional amount of $2.3 million. Upon further analysis of certain aspects of the Tax Act and refinement of our calculations during the year ended December 31, 2018, we adjusted our provisional amount by $0.3 million, which is included as a component of income tax expense.
GILTI
The Tax Act subjects a U.S. shareholder to tax on GILTI earned by certain foreign subsidiaries. The FASB Staff Q&A, Topic 740, No. 5, "Accounting for Global Intangible Low-Taxed Income," states that an entity can make an accounting policy election to either recognize deferred taxes for temporary basis differences expected to reverse as GILTI in future years or to provide for the tax expense related to GILTI in the year the tax is incurred as a period expense only. Because we were evaluating the provision of GILTI as of December 31, 2017, we recorded no GILTI-related deferred amounts in 2017. We have elected to account for GILTI in the year the tax is incurred.
Indefinite Reinvestment Assertion
Beginning in 2018, the Tax Act generally provides a 100% federal deduction for dividends received from foreign subsidiaries. Nevertheless, companies must still apply the guidance of ASC Topic 740 to account for the tax consequences of outside basis differences and other tax impacts of their investments in non-U.S. subsidiaries, including potential foreign withholding taxes on distributions. Historically, the undistributed earnings of our foreign subsidiaries were considered to be indefinitely reinvested. Previously, no provision for U.S. federal and state income taxes or foreign withholding taxes had been provided on U.S. earnings. In 2018, we changed our assertion, and provided a $1.2 million deferred tax liability related to state tax and foreign tax withholding liabilities on future distributions. In 2019, the deferred tax liability related to state tax and foreign tax withholding liabilities on future distributions increased to $1.7 million.
Note 10 — Accrued Compensation
The components of accrued compensation were as follows:
December 31, | |||||||
(In thousands) | 2019 | 2018 | |||||
Accrued social insurance (1) | $ | 16,588 | $ | 16,735 | |||
Accrued salary/wages | 7,465 | 8,783 | |||||
Accrued vacation/holiday | 2,766 | 2,954 | |||||
Accrued bonus | 13,965 | 2,361 | |||||
Accrued commission | 1,283 | 1,432 | |||||
Other accrued compensation | 1,601 | 1,700 | |||||
Total accrued compensation | $ | 43,668 | $ | 33,965 | |||
(1) | PRC employers are required by law to remit the applicable social insurance payments to their local government. Social insurance is comprised of various components such as pension, medical insurance, job injury insurance, unemployment insurance, and a housing assistance fund, and is administered in a manner similar to social security in the United States. This amount represents our estimate of the amounts due to the PRC government for social insurance on December 31, 2019 and 2018. |
64
Note 11 — Other Accrued Liabilities
The components of other accrued liabilities were as follows:
December 31, | |||||||
(In thousands) | 2019 | 2018 | |||||
Contract liabilities | $ | 1,840 | $ | 2,592 | |||
Duties | 3,731 | 4,865 | |||||
Freight and handling fees | 3,769 | 3,217 | |||||
Operating lease obligations | 4,903 | — | |||||
Product warranty claim costs | 1,514 | 276 | |||||
Professional fees | 2,833 | 1,930 | |||||
Sales taxes and VAT | 3,926 | 1,050 | |||||
Short-term contingent consideration | 5,428 | 4,190 | |||||
Other | 7,501 | 5,891 | |||||
Total other accrued liabilities | $ | 35,445 | $ | 24,011 | |||
Note 12 — Leases
We have entered into various operating lease agreements for automobiles, offices and manufacturing facilities throughout the world. At December 31, 2019, our operating leases had remaining lease terms of up to 41 years.
Rent expense under the Company's operating leases during the years ended December 31, 2018 and 2017, prior to our adoption of the new lease guidance on January 1, 2019, was $4.9 million and $4.2 million, respectively.
Lease balances within our consolidated balance sheet were as follows:
(In thousands) | December 31, 2019 | ||
Assets: | |||
Operating lease right-of-use assets | $ | 19,826 | |
Liabilities: | |||
Other accrued liabilities | $ | 4,903 | |
Long-term operating lease obligations | 15,639 | ||
Total lease liabilities | $ | 20,542 | |
We recorded an impairment of a ROU asset of $0.8 million during the fourth quarter of the year ended December 31, 2019. This impairment is associated with the disposal of our call center in Euclid, Ohio.
Operating lease expense, including variable lease costs, which are insignificant to the total, and short-term lease costs, and operating lease cash flows and supplemental cash flow information were as follows. Short-term lease costs were approximately $1.3 million during the year ended December 31, 2019.
(In thousands) | Year Ended December 31, 2019 | ||
Cost of sales | $ | 1,945 | |
Selling, general and administrative expenses | 4,389 | ||
Total operating lease expense | $ | 6,334 | |
Operating cash outflows from operating leases | $ | 6,617 | |
Operating lease right-of-use assets obtained in exchange for lease obligations | $ | 4,302 | |
65
The weighted average remaining lease liability term and the weighted average discount rate were as follows:
December 31, 2019 | ||
Weighted average lease liability term (in years) | 4.30 | |
Weighted average discount rate | 4.50 | % |
The following table reconciles the undiscounted cash flows for each of the first five years and thereafter to the operating lease liabilities recognized in our consolidated balance sheet at December 31, 2019. The reconciliation excludes short-term leases that are not recorded on the balance sheet.
(In thousands) | December 31, 2019 | ||
2020 | $ | 5,800 | |
2021 | 6,120 | ||
2022 | 5,103 | ||
2023 | 2,331 | ||
2024 | 1,341 | ||
Thereafter | 2,041 | ||
Total lease payments | 22,736 | ||
Less: imputed interest | (2,194 | ) | |
Total lease liabilities | $ | 20,542 | |
As of December 31, 2019, we have one operating lease that has not yet commenced with the total initial lease liability of approximately $1.6 million with a five-year term, which is not reflected within the maturity schedule above. Our future minimum lease obligations under non-cancelable operating leases as of December 31, 2018 were comparable to the undiscounted lease payments included in the table above.
Non-level Rents and Lease Incentives
Some of our leases are subject to rent escalations. Prior to the adoption of the new lease guidance on January 1, 2019, for these leases, we recognized rent expense for the total contractual obligation utilizing the straight-line method over the lease term, ranging from 48 months to 125 months. At December 31, 2018, the related short-term liability was recorded in other accrued liabilities and the related long term liability was recorded in other long-term liabilities. The total liability related to rent escalations was $1.1 million at December 31, 2018.
At December 31, 2018, the lease agreements for our offices in Santa Ana, California and Scottsdale, Arizona contained allowances for moving expenses and tenant improvements aggregating $1.8 million. These moving and tenant improvement allowances were recorded within other accrued liabilities and other long-term liabilities, depending on the short-term or long-term nature, and were being amortized as a reduction of rent expense over the related lease term.
Rental Costs During Construction
Rental costs associated with operating leases incurred during a construction period were expensed for the years ended December 31, 2019, 2018 and 2017.
Prepaid Land Lease
We operate one factory within the PRC on which the land is leased from the government as of December 31, 2019. This land lease was prepaid to the PRC government at the time our subsidiary occupied the land. We have obtained a land-use right certificate for the land pertaining to this factory.
The factory is located in the city of Yangzhou in the Jiangsu province. The remaining net book value of this operating lease ROU was $2.4 million at December 31, 2019, and is amortized on a straight-line basis over the remaining term of approximately 39 years. The buildings located on this land had a net book value of $17.1 million at December 31, 2019 and is being depreciated over a remaining weighted average period of 20 years.
66
Prior to adoption of the new lease guidance on January 1, 2019, the remaining net book value of this prepaid land lease was included within prepaid expenses and other current assets and other assets, depending on the short-term or long-term nature.
Note 13 — Commitments and Contingencies
Indemnifications
We indemnify our directors and officers to the maximum extent permitted under the laws of the state of Delaware and we have entered into indemnification agreements with each of our directors and executive officers. In addition, we insure our individual directors and officers against certain claims and attorney’s fees and related expenses incurred in connection with the defense of such claims. The amounts and types of coverage may vary from period to period as dictated by market conditions. Management is not aware of any matters that require indemnification of its officers or directors.
Fair Price Provisions and Other Anti-Takeover Measures
Our Restated Certificate of Incorporation, as amended, contains certain provisions restricting business combinations with interested stockholders under certain circumstances and imposing higher voting requirements for the approval of certain transactions ("fair price" provisions). Any of these provisions may delay or prevent a change in control.
The "fair price" provisions require that holders of at least two-thirds of our outstanding shares of voting stock approve certain business combinations and significant transactions with interested stockholders.
Product Warranties
Changes in the liability for product warranty claim costs were as follows:
Year Ended December 31, | |||||||||||
(In thousands) | 2019 | 2018 | 2017 | ||||||||
Balance at beginning of period | $ | 276 | $ | 339 | $ | 134 | |||||
Accruals for warranties issued during the period | 1,742 | 787 | 312 | ||||||||
Settlements (in cash or in kind) during the period | (504 | ) | (850 | ) | (107 | ) | |||||
Balance at end of period | $ | 1,514 | $ | 276 | $ | 339 | |||||
Sale of Guangzhou Factory
On September 26, 2016, we entered into an agreement to sell our Guangzhou manufacturing facility for RMB 320 million. In accordance with the terms of the agreement, the buyer deposited 10% of the purchase price into an escrow account upon the execution of the agreement. In April 2018, we and the buyer mutually agreed to terminate the sale. The mutually agreed termination took effect immediately with no incremental penalty or costs to either party. In connection with this termination, the deposit was returned to the buyer.
On April 23, 2018, we entered into a new agreement to sell our Guangzhou manufacturing facility to a second buyer for RMB 339 million (approximately $51.4 million based on exchange rates in effect at the time of closing). On April 26, 2018, the second buyer paid to us a deposit of RMB 34 million (approximately $5.1 million based on exchange rates in effect at the time of closing), which under the terms of the agreement was nonrefundable. Upon receipt by the Governmental Agency of the second buyer’s application of approval of transfer, the second buyer was to pay to us RMB 237 million (approximately $35.8 million based on exchange rates in effect at the time of closing). Additionally, within two days after the second payment was made to us, the second buyer was to deposit the remaining consideration of RMB 68 million (approximately $10.3 million based on exchange rates in effect at the time of closing) into escrow, which was to be released to us upon the closing of the sale. Per the terms of the agreement, the sale was to be completed no later than June 30, 2018. On June 26, 2018, all conditions to closing were satisfied and the sale was completed, resulting in a pre-tax gain of $37.0 million ($32.1 million, net of income taxes).
67
Other Restructuring Activities
In the fourth quarter of 2018, we implemented a plan to relocate our corporate office from Santa Ana, California to Scottsdale, Arizona and to relocate our Asian engineering leadership, supply chain and customer support functions from Hong Kong to our other facilities in the PRC. In connection with these restructuring activities, we incurred severance costs of $0.4 million and $0.9 million during the year ended December 31, 2019 and 2018, respectively, which are included within selling, general and administrative expenses.
Litigation
On or about June 10, 2015, FM Marketing GmbH ("FMH") and Ruwido Austria GmbH ("Ruwido") filed a Summons in Summary Proceedings in Belgium court against one of our subsidiaries, Universal Electronics BV ("UEBV"), and one of its customers, Telenet N.V. ("Telenet"), claiming that one of the products UEBV supplied to Telenet violates two design patents and one utility patent owned by FMH and/or Ruwido. By this summons, FMH and Ruwido sought to enjoin Telenet and UEBV from continued distribution and use of the product at issue. After the September 29, 2015 hearing, the court issued its ruling in our and Telenet’s favor, rejecting FMH and Ruwido’s request entirely. On October 22, 2015, Ruwido filed its notice of appeal to this ruling. On September 16, 2019, the appellate court ruled in our favor concluding that our original product did not infringe Ruwido's design rights. Ruwido subsequently filed an appeal of this decision with the Belgium Supreme Court. Our brief in opposition to Ruwido's appeal has been submitted and we are waiting to learn if the Supreme Court will hear Ruwido's appeal.
In addition, Ruwido appealed the lower court's ruling against it with respect to its claims of infringement and unfair competition. Briefing is to be completed by the end of April 2020 and in May 2020 the court will set a date for oral hearing which we expect to be sometime in late 2020.
Subsequent to the Court's ruling in September 2017 that our second product could not be added to the first case on the merits, Ruwido filed a separate case on the merits with respect to this second product, claiming that it too infringes the same patent at issue in the first suit. We have denied these claims. Presently, the oral hearing on the merits with respect to this matter is set for April 7, 2020.
In September 2015, UEBV filed an Opposition with the EPO seeking to invalidate the one utility patent asserted against UEBV and Telenet by Ruwido. The hearing on this opposition was held in July 2017. During this hearing the panel requested additional information. We have assembled this additional information and the final hearing was scheduled for January 29, 2019. The EPO held this hearing on January 29 and 30, 2019 and revoked Ruwido's patent as originally filed. The EPO, however, maintained the patent in an amended form with a much narrower claim. On August 23, 2019, the EPO issued its written opinion. Both UEBV and Ruwido have appealed the EPO's decision and briefing is due by May 13, 2020.
On September 5, 2018, we filed a lawsuit against Roku, Inc. ("Roku") in the United States District Court, Central District of California (Universal Electronics Inc. v. Roku, Inc.) alleging that Roku is willfully infringing nine of our patents that are in four patent families related to remote control set-up and touchscreen remotes. On December 5, 2018, we amended our complaint to add additional details supporting our infringement and willfulness allegations. We have alleged that this complaint relates to multiple Roku streaming players and components therefore and certain universal control devices, including but not limited to the Roku App, Roku TV, Roku Express, Roku Streaming Stick, Roku Ultra, Roku Premiere, Roku 4, Roku 3, Roku 2, Roku Enhanced Remote and any other Roku product that provides for the remote control of an external device such as a TV, audiovisual receiver, sound bar or Roku TV Wireless Speakers. Roku has answered our complaint with a general denial. In September and October, 2019, Roku filed Inter Party Review ("IPR") requests with the Patent Trial and Appeals Board (the "PTAB") on the nine patents at issue in this case, seeking to invalidate our patents. We will vigorously defend against the IPRs. As a further result of Roku filing the IPRs, the Court has stayed the underlying patent lawsuit pending the resolution of IPRs. We have filed our responses to Roku's IPR requests. We expect to learn if the PTAB will institute the IPRs or any of them during the second quarter of 2020.
There are no other material pending legal proceedings to which we or any of our subsidiaries is a party or of which our respective property is the subject. However, as is typical in our industry and to the nature and kind of business in which we are engaged, from time to time, various claims, charges and litigation are asserted or commenced by third parties against us or by us against third parties arising from or related to product liability, infringement of patent or other intellectual property rights, breach of warranty, contractual relations, or employee relations. The amounts claimed may be substantial but may not bear any reasonable relationship to the merits of the claims or the extent of any real risk of court awards assessed against us or in our favor. However, no assurances can be made as to the outcome of any of these matters, nor can we estimate the range of potential losses to us. In our opinion, final judgments, if any, which might be rendered against us in potential or pending litigation would not have a material adverse effect on our consolidated financial condition, results of operations, or cash flows. Moreover, we believe that our products do not infringe any third parties' patents or other intellectual property rights.
68
We maintain directors' and officers' liability insurance which insures our individual directors and officers against certain claims, as well as attorney's fees and related expenses incurred in connection with the defense of such claims.
Defined Benefit Plan
Our subsidiary in India maintains a defined benefit pension plan ("India Plan") for local employees, which is consistent with local statutes and practices. The pension plan was adequately funded on December 31, 2019 based on its latest actuarial report. The India Plan has an independent external manager that advises us of the appropriate funding contribution requirements to which we comply. At December 31, 2019, approximately 49 percent of our India subsidiary employees had qualified for eligibility. An individual must be employed by our India subsidiary for a minimum of five years before becoming eligible. Upon the termination, resignation or retirement of an eligible employee, we are liable to pay the employee an amount equal to 15 days salary for each full year of service completed. The total amount of liability outstanding at December 31, 2019 and 2018 for the India Plan was not material. During the years ended December 31, 2019, 2018, and 2017, the net periodic benefit costs were also not material.
Note 14 — Treasury Stock
From time to time, our Board of Directors authorizes management to repurchase shares of our issued and outstanding common stock on the open market. On October 30, 2018, our Board approved an adjustment to the amount of common stock that we could purchase under our existing repurchase plan to an amount not to exceed $5.0 million of our common stock ("2018 Plan"). As of December 31, 2019, we had $3.9 million of authorized repurchases remaining under the 2018 Plan. On March 10, 2020, our Board of Directors replaced the 2018 Plan with a new repurchase plan authorizing the repurchase of up to 300,000 shares. We may utilize various methods to effect the repurchases, which may include open market repurchases, negotiated block transactions, accelerated share repurchases or open market solicitations for shares, some of which may be effected through Rule 10b5-1 plans. The timing and amount of future repurchases, if any, will depend upon several factors, including market and business conditions, and such repurchases may be discontinued at any time.
Repurchased shares of our common stock were as follows:
Year Ended December 31, | |||||||||||
(In thousands) | 2019 | 2018 | 2017 | ||||||||
Shares repurchased | 58 | 413 | 680 | ||||||||
Cost of shares repurchased | $ | 1,928 | $ | 13,824 | $ | 39,085 | |||||
Repurchased shares are recorded as shares held in treasury at cost. We hold these shares for future use as management and the Board of Directors deem appropriate.
69
Note 15 — Stock-Based Compensation
Stock-based compensation expense for each employee and director is presented in the same statement of operations caption as their cash compensation. Stock-based compensation expense by statement of operations caption and the related income tax benefit were as follows:
Year Ended December 31, | |||||||||||
(In thousands) | 2019 | 2018 | 2017 | ||||||||
Cost of sales | $ | 139 | $ | 84 | $ | 71 | |||||
Research and development expenses | 1,096 | 744 | 551 | ||||||||
Selling, general and administrative expenses: | |||||||||||
Employees | 6,431 | 6,491 | 7,368 | ||||||||
Outside directors | 1,179 | 1,501 | 3,953 | ||||||||
Total employee and director stock-based compensation expense | $ | 8,845 | $ | 8,820 | $ | 11,943 | |||||
Income tax benefit | $ | 1,877 | $ | 1,870 | $ | 2,954 | |||||
Stock Options
The assumptions we utilized in the Black-Scholes option pricing model and the resulting weighted average fair value of stock option grants were the following:
Year Ended December 31, | |||||||||||
2019 | 2018 | 2017 | |||||||||
Weighted average fair value of grants | $ | 11.51 | $ | 14.26 | $ | 19.61 | |||||
Risk-free interest rate | 2.38 | % | 2.51 | % | 1.75 | % | |||||
Expected volatility | 41.73 | % | 33.09 | % | 34.25 | % | |||||
Expected life in years | 4.60 | 4.53 | 4.52 | ||||||||
Stock option activity was as follows:
2019 | 2018 | 2017 | ||||||||||||||||||||||||||||||||||||
Number of Options (in 000's) | Weighted-Average Exercise Price | Weighted-Average Remaining Contractual Term (in years) | Aggregate Intrinsic Value (in 000's) | Number of Options (in 000's) | Weighted-Average Exercise Price | Weighted-Average Remaining Contractual Term (in years) | Aggregate Intrinsic Value (in 000's) | Number of Options (in 000's) | Weighted-Average Exercise Price | Weighted-Average Remaining Contractual Term (in years) | Aggregate Intrinsic Value (in 000's) | |||||||||||||||||||||||||||
Outstanding at beginning of the year | 597 | $ | 44.27 | 520 | $ | 42.56 | 652 | $ | 39.27 | |||||||||||||||||||||||||||||
Granted | 170 | 30.08 | 119 | 44.95 | 92 | 62.70 | ||||||||||||||||||||||||||||||||
Exercised | (22 | ) | 20.34 | $ | 569 | (35 | ) | 24.67 | $ | 744 | (56 | ) | 25.72 | $ | 2,140 | |||||||||||||||||||||||
Forfeited/canceled/expired | — | — | (7 | ) | 27.74 | (168 | ) | 46.44 | ||||||||||||||||||||||||||||||
Outstanding at end of the year (1) | 745 | $ | 41.73 | 3.97 | $ | 9,798 | 597 | $ | 44.27 | 4.08 | $ | 758 | 520 | $ | 42.56 | 4.25 | $ | 5,607 | ||||||||||||||||||||
Vested and expected to vest at the end of the year (1) | 745 | $ | 41.73 | 3.97 | $ | 9,798 | 597 | $ | 44.27 | 4.08 | $ | 758 | 520 | $ | 42.56 | 4.25 | $ | 5,607 | ||||||||||||||||||||
Exercisable at the end of the year (1) | 517 | $ | 44.95 | 3.01 | $ | 5,636 | 430 | $ | 42.30 | 3.43 | $ | 758 | 381 | $ | 36.39 | 3.72 | $ | 5,607 | ||||||||||||||||||||
(1) | The aggregate intrinsic value represents the total pre-tax value (the difference between our closing stock price on the last trading day of 2019, 2018, and 2017 and the exercise price, multiplied by the number of in-the-money options) that would have been received by the option holders had they all exercised their options on December 31, 2019, 2018, and 2017. This amount will change based on the fair market value of our stock. |
Cash received from option exercises for the years ended December 31, 2019, 2018, and 2017 was $0.4 million, $0.9 million, and $1.4 million, respectively. The actual tax benefit realized from option exercises was $0.01 million, $0.2 million and $0.7 million for the years ended December 31, 2019, 2018, and 2017, respectively.
70
Significant option groups outstanding at December 31, 2019 and the related weighted average exercise price and life information were as follows:
Options Outstanding | Options Exercisable | |||||||||||||||
Range of Exercise Prices | Number Outstanding (in 000’s) | Weighted-Average Remaining Contractual Term (in years) | Weighted-Average Exercise Price | Number Exercisable (in 000’s) | Weighted-Average Exercise Price | |||||||||||
$19.25 to $27.07 | 263 | 4.72 | $ | 23.83 | 112 | $ | 19.49 | |||||||||
$35.28 to $44.95 | 200 | 3.50 | 41.04 | 150 | 39.75 | |||||||||||
$51.38 to $65.54 | 282 | 3.62 | 58.85 | 255 | 59.21 | |||||||||||
745 | 3.97 | $ | 41.73 | 517 | $ | 44.95 | ||||||||||
As of December 31, 2019, we expect to recognize $2.2 million of total unrecognized pre-tax stock-based compensation expense related to non-vested stock options over a remaining weighted-average life of 1.9 years.
On February 12, 2020, certain executive employees were granted 108,755 stock options in connection with the 2019 annual review cycle. The options were granted as part of long-term incentive compensation to assist us in meeting our performance and retention objectives and are subject to a three-year vesting period (33.33% on February 12, 2021 and 8.33% each quarter thereafter). The total grant date fair value of these awards was $1.9 million.
Restricted Stock
Non-vested restricted stock award activity was as follows:
2019 | 2018 | 2017 | ||||||||||||||||||
Shares (in 000’s) | Weighted-Average Grant Date Fair Value | Shares (in 000’s) | Weighted-Average Grant Date Fair Value | Shares (in 000’s) | Weighted-Average Grant Date Fair Value | |||||||||||||||
Non-vested at beginning of the year | 204 | $ | 49.23 | 162 | $ | 61.19 | 153 | $ | 57.43 | |||||||||||
Granted | 268 | 30.67 | 167 | 42.65 | 133 | 64.14 | ||||||||||||||
Vested | (141 | ) | 47.26 | (109 | ) | 56.16 | (119 | ) | 59.67 | |||||||||||
Forfeited | (21 | ) | 35.78 | (16 | ) | 54.16 | (5 | ) | 60.11 | |||||||||||
Non-vested at end of the year | 310 | $ | 34.99 | 204 | $ | 49.23 | 162 | $ | 61.19 | |||||||||||
As of December 31, 2019, we expect to recognize $7.2 million of total unrecognized pre-tax stock-based compensation expense related to non-vested restricted stock awards over a weighted-average life of 1.7 years.
On February 12, 2020, certain executive employees were granted 41,695 restricted stock awards in connection with the 2019 annual review cycle. These awards were granted as part of long-term incentive compensation to assist us in meeting our performance and retention objectives and are subject to a three-year vesting period (33.33% on February 12, 2021 and 8.33% each quarter thereafter). The total grant date fair value of these awards was $1.9 million.
Stock Incentive Plans
Our active stock-based incentive plans include those adopted in 2003, 2006, 2010, 2014 and 2018 ("Stock Incentive Plans"). Under the Stock Incentive Plans, we may grant stock options, stock appreciation rights, restricted stock units, performance stock units, or any combination thereof for a period of ten years from the approval date of each respective plan, unless the plan is terminated by resolution of our Board of Directors. No stock appreciation rights or performance stock units have been awarded under our Stock Incentive Plans. Only directors and employees meeting certain employment qualifications are eligible to receive stock-based awards.
The grant price of stock option and restricted stock awards granted under our Stock Incentive Plans is the average of the high and low trades of our stock on the grant date. We prohibit the re-pricing or backdating of stock options. Our stock options become exercisable in various proportions over a three- or four-year time frame. Stock options have a maximum ten-year term. Restricted stock awards vest in various proportions over a one- to three-year time period.
71
Detailed information regarding our active Stock Incentive Plans was as follows at December 31, 2019:
Name | Approval Date | Initial Shares Available for Grant Under the Plan | Remaining Shares Available for Grant Under the Plan | Outstanding Shares Granted Under the Plan | |||||||
2003 Stock Incentive Plan | 6/18/2003 | 1,000,000 | — | 14,391 | |||||||
2006 Stock Incentive Plan | 6/13/2006 | 1,000,000 | — | 28,945 | |||||||
2010 Stock Incentive Plan | 6/15/2010 | 1,000,000 | — | 198,971 | |||||||
2014 Stock Incentive Plan | 6/12/2014 | 1,100,000 | — | 413,333 | |||||||
2018 Equity and Incentive Compensation Plan | 6/4/2018 | 1,000,000 | 544,092 | 399,726 | |||||||
544,092 | 1,055,366 | ||||||||||
Note 16 — Performance-Based Common Stock Warrants
On March 9, 2016, we issued common stock purchase warrants to Comcast Corporation ("Comcast") to purchase up to 725,000 shares of our common stock at a price of $54.55 per share. The right to exercise the warrants is subject to vesting over three successive two-year periods (with the first two-year period commencing on January 1, 2016) based on the level of purchases of goods and services from us by Comcast and its affiliates, as defined in the warrants. The table below presents the purchase levels and number of warrants that will vest in each period based upon achieving these purchase levels.
Incremental Warrants That Will Vest | ||||||||
Aggregate Level of Purchases by Comcast and Affiliates | January 1, 2016 - December 31, 2017 | January 1, 2018 - December 31, 2019 | January 1, 2020 - December 31, 2021 | |||||
$260 million | 100,000 | 100,000 | 75,000 | |||||
$300 million | 75,000 | 75,000 | 75,000 | |||||
$340 million | 75,000 | 75,000 | 75,000 | |||||
Maximum Potential Warrants Earned by Comcast | 250,000 | 250,000 | 225,000 | |||||
If total aggregate purchases by Comcast and its affiliates are below $260 million in any of the two-year periods above, no warrants will vest related to that two-year period. If total aggregate purchases of goods and services by Comcast and its affiliates had exceeded $340 million during either the first or second two-year period, the amount of any such excess would count towards aggregate purchases in the following two-year period. This threshold was not met in either the first or second two-year period. At December 31, 2019, 275,000 vested warrants were outstanding. To fully vest in the rights to purchase all of the remaining unearned 225,000 underlying shares, Comcast and its affiliates must purchase an aggregate of $340 million in goods and services from us during the period January 1, 2020 through December 31, 2021.
Any and all warrants that vest will expire on January 1, 2023. The warrants provide for certain adjustments that may be made to the exercise price and the number of shares issuable upon exercise due to customary anti-dilution provisions. Additionally, in connection with the common stock purchase warrants, we have also entered into a registration rights agreement with Comcast under which Comcast may from time to time request that we register the shares of common stock underlying vested warrants with the SEC.
Because the warrants contain performance criteria under which Comcast must achieve specified aggregate purchase levels for the warrants to vest, as detailed above, the measurement date for the warrants is the date on which the warrants vest. For the two-year period ended December 31, 2017, Comcast earned and vested in 175,000 out of the maximum potential 250,000 warrants. For the two-year period ended December 31, 2019, Comcast earned and vested in 100,000 out of the maximum potential 250,000 warrants.
72
The assumptions we utilized in the Black-Scholes option pricing model and the resulting weighted average fair value of the warrants were the following:
Year Ended December 31, | |||||
2019 | 2018 | ||||
Fair value | $21.60 | $3.45 | |||
Price of Universal Electronics Inc. common stock | $58.01 | $24.81 | |||
Risk-free interest rate | 1.65 | % | 2.49 | % | |
Expected volatility | 48.90 | % | 43.16 | % | |
Expected life in years | 3.13 | 4.00 | |||
The impact to net sales recorded in connection with the warrants and the related income tax benefit was as follows:
Year Ended December 31, | |||||||||||
(in thousands) | 2019 | 2018 | 2017 | ||||||||
Reduction to net sales | $ | 1,997 | $ | 163 | $ | 683 | |||||
Income tax benefit | 498 | 41 | 255 | ||||||||
We estimate the number of warrants that will vest based on projected future purchases that will be made by Comcast and its affiliates. These estimates may increase or decrease based on actual future purchases. The aggregate unrecognized estimated fair value of unvested warrants at December 31, 2019 was $3.9 million.
Note 17 — Other Income (Expense), Net
Other income (expense), net consisted of the following:
Year Ended December 31, | |||||||||||
(In thousands) | 2019 | 2018 | 2017 | ||||||||
Net gain (loss) on foreign currency exchange contracts (1) | $ | (62 | ) | $ | 545 | $ | (3,603 | ) | |||
Net gain (loss) on foreign currency exchange transactions | (870 | ) | (4,987 | ) | 2,174 | ||||||
Other income (expense) | (63 | ) | (15 | ) | 581 | ||||||
Other income (expense), net | $ | (995 | ) | $ | (4,457 | ) | $ | (848 | ) | ||
(1) | This represents the gains (losses) incurred on foreign currency hedging derivatives. See Note 19 for further information concerning our foreign currency exchange contracts. |
73
Note 18 — Earnings (Loss) Per Share
Earnings (loss) per share was calculated as follows:
Year Ended December 31, | |||||||||||
(In thousands, except per-share amounts) | 2019 | 2018 | 2017 | ||||||||
BASIC | |||||||||||
Net income (loss) | $ | 3,630 | $ | 11,924 | $ | (10,323 | ) | ||||
Weighted-average common shares outstanding | 13,879 | 13,948 | 14,351 | ||||||||
Basic earnings (loss) per share | $ | 0.26 | $ | 0.85 | $ | (0.72 | ) | ||||
DILUTED | |||||||||||
Net income (loss) | $ | 3,630 | $ | 11,924 | $ | (10,323 | ) | ||||
Weighted-average common shares outstanding for basic | 13,879 | 13,948 | 14,351 | ||||||||
Dilutive effect of stock options, restricted stock and common stock warrants | 230 | 112 | — | ||||||||
Weighted-average common shares outstanding on a diluted basis | 14,109 | 14,060 | 14,351 | ||||||||
Diluted earnings (loss) per share | $ | 0.26 | $ | 0.85 | $ | (0.72 | ) | ||||
The following number of stock options, shares of restricted stock and common stock warrants were excluded from the computation of diluted earnings (loss) per common share as their inclusion would have been anti-dilutive:
Year Ended December 31, | ||||||||
(In thousands) | 2019 | 2018 | 2017 | |||||
Stock options | 371 | 390 | 648 | |||||
Restricted stock awards | 67 | 118 | 221 | |||||
Performance-based warrants | 188 | 175 | 69 | |||||
Note 19 — Derivatives
The following table sets forth the total net fair value of derivatives:
December 31, 2019 | December 31, 2018 | |||||||||||||||||||||||||||||||
Fair Value Measurement Using | Total Balance | Fair Value Measurement Using | Total Balance | |||||||||||||||||||||||||||||
(In thousands) | Level 1 | Level 2 | Level 3 | Level 1 | Level 2 | Level 3 | ||||||||||||||||||||||||||
Foreign currency exchange contracts | $ | — | $ | (172 | ) | $ | — | $ | (172 | ) | $ | — | $ | (249 | ) | $ | — | $ | (249 | ) | ||||||||||||
We held foreign currency exchange contracts which resulted in a net pre-tax loss of $0.1 million, a net pre-tax gain of $0.5 million, and a net pre-tax loss of $3.6 million for the years ended December 31, 2019, 2018, and 2017, respectively. See Note 17 for further information concerning our foreign currency exchange contracts.
74
Details of foreign currency exchange contracts held were as follows:
Date Held | Currency | Position Held | Notional Value (in millions) | Forward Rate | Unrealized Gain/(Loss) Recorded at Balance Sheet Date (in thousands)(1) | Settlement Date | ||||||||||
December 31, 2019 | USD/Chinese Yuan Renminbi | USD | $ | 35.0 | 6.9867 | $ | 100 | January 23, 2020 | ||||||||
December 31, 2019 | USD/Brazilian Real | USD | $ | 0.5 | 4.0560 | $ | (6 | ) | January 24, 2020 | |||||||
December 31, 2019 | USD/Euro | USD | $ | 28.0 | 1.1133 | $ | (253 | ) | January 24, 2020 | |||||||
December 31, 2019 | USD/Brazilian Real | USD | $ | 0.7 | 4.0870 | $ | (13 | ) | January 24, 2020 | |||||||
December 31, 2018 | USD/Euro | USD | $ | 20.0 | 1.1421 | $ | (97 | ) | January 25, 2019 | |||||||
December 31, 2018 | USD/Chinese Yuan Renminbi | USD | $ | 27.0 | 6.8969 | $ | (116 | ) | January 25, 2019 | |||||||
December 31, 2018 | USD/Chinese Yuan Renminbi | USD | $ | 5.0 | 6.9245 | $ | (41 | ) | January 25, 2019 | |||||||
December 31, 2018 | USD/Brazilian Real | USD | $ | 1.0 | 3.8651 | $ | 5 | January 25, 2019 | ||||||||
(1) | Unrealized gains on foreign currency exchange contracts are recorded in prepaid expenses and other current assets. Unrealized losses on foreign currency exchange contracts are recorded in other accrued liabilities. |
Note 20 — Employee Benefit Plans
We maintain a retirement and profit sharing plan under Section 401(k) of the Internal Revenue Code for all of our domestic employees that meet certain qualifications. Participants in the plan may elect to contribute up to the maximum allowed by law. We match 50% of the participants’ contributions up to 15% of their gross salary in the form of newly issued shares of our common stock. We may also make other discretionary contributions to the plan. We recorded $0.9 million, $1.1 million and $0.6 million of expense for company contributions for the years ended December 31, 2019, 2018, and 2017, respectively.
Note 21 — Business Combinations
On April 6, 2017, we acquired substantially all of the net assets of Residential Control Systems, Inc. ("RCS"), a U.S.-based designer and manufacturer of energy management and control products for the residential, small commercial and hospitality markets. The purchase price of $12.6 million was comprised of $8.9 million in cash and $3.7 million of contingent consideration. Additionally, we incurred $0.1 million in acquisition costs, consisting primarily of accounting related expenses, which are included within selling, general and administrative expenses for the year ended December 31, 2017. The acquisition of these assets allows us to expand our product offering of home sensing, monitoring and control solutions to include smart thermostat, sensing and monitoring products previously sold and marketed by RCS.
Our consolidated statements of operations for the years ended December 31, 2019, 2018 and 2017 include net sales of $3.9 million, $5.1 million, and $3.5 million, respectively; and net losses of $2.4 million, $0.2 million, and $0.4 million, respectively, attributable to RCS.
Contingent Consideration
We are required to make additional earnout payments of up to $10.0 million upon the achievement of certain operating income levels attributable to RCS over the period commencing on the acquisition date through June 30, 2022. The amount of contingent consideration is calculated at the end of each calendar year and is based on the agreed upon percentage of operating income as defined in the Asset Purchase Agreement (the "APA"). Operating income is calculated using certain revenues, costs and expenses directly attributable to RCS as specified in the APA. At the acquisition date, the value of earnout contingent consideration was estimated using a valuation methodology based on projections of future operating income calculated in accordance with the APA.
75
Such projections were then discounted using an average discount rate of 24.8% to reflect the risk in achieving the projected operating income levels as well as the time value of money. The fair value measurement of the earnout contingent consideration was based primarily on significant inputs not observable in an active market and thus represents a Level 3 measurement as defined under U.S. GAAP. At December 31, 2018, the fair value of the earnout contingent consideration attributable to RCS was $0.7 million. During the year ended December 31, 2019, the fair value of earnout contingent consideration attributable to RCS decreased $0.5 million to $0.2 million. Changes in the fair value of earnout contingent consideration primarily reflect adjustments to the timing and amount of payments as well as the related accretion driven by the time value of money. These adjustments are recorded within selling, general and administrative expenses. At December 31, 2019, the fair value of earnout contingent consideration attributable to RCS is presented within long-term contingent consideration in our consolidated balance sheet.
Pro Forma Results (Unaudited)
The unaudited pro forma financial information presents the combined results of our operations and the operations of RCS as if the RCS acquisition had occurred on January 1, 2017. This unaudited pro forma financial information is not intended to represent or be indicative of the consolidated results of operations that would have been achieved had the acquisition actually been completed as of January 1, 2017, and should not be taken as a projection of the future consolidated results of our operations.
For the year ended December 31, 2017, pro forma net sales were $696.4 million; pro forma net loss was $10.5 million; pro forma basic and diluted loss per share was $0.73.
For purposes of determining pro forma net loss, adjustments were made, as follows, to derive the information presented above. The pro forma net loss assumes that amortization of acquired intangible assets began at January 1, 2017 rather than on April 6, 2017. The result is a net increase in amortization expense of $25 thousand for the year ended December 31, 2017. Additionally, acquisition costs totaling $0.1 million are excluded from pro forma net loss. All adjustments have been made net of their related tax effects.
Note 22 — Quarterly Financial Data (Unaudited)
Summarized quarterly financial data is as follows:
2019 | |||||||||||||||
(In thousands, except per share amounts) | March 31, | June 30, | September 30, | December 31, | |||||||||||
Net sales | $ | 184,163 | $ | 193,896 | $ | 200,724 | $ | 174,694 | |||||||
Gross profit | 39,874 | 33,993 | 46,479 | 49,857 | |||||||||||
Operating income (loss) | 1,663 | (3,926 | ) | 6,127 | 11,451 | ||||||||||
Net income (loss) | (1,005 | ) | (5,061 | ) | 2,669 | 7,027 | |||||||||
Earnings (loss) per share (1): | |||||||||||||||
Basic | $ | (0.07 | ) | $ | (0.37 | ) | $ | 0.19 | $ | 0.50 | |||||
Diluted | $ | (0.07 | ) | $ | (0.37 | ) | $ | 0.19 | $ | 0.49 | |||||
76
2018 | |||||||||||||||
(In thousands, except per share amounts) | March 31, | June 30, | September 30, | December 31, | |||||||||||
Net sales | $ | 164,698 | $ | 162,523 | $ | 182,717 | $ | 170,303 | |||||||
Gross profit | 37,202 | 26,759 | 40,316 | 37,527 | |||||||||||
Operating income (loss) | 904 | (9,870 | ) | 4,729 | 2,572 | ||||||||||
Net income (loss) | (587 | ) | 22,659 | 959 | (11,107 | ) | |||||||||
Earnings (loss) per share (1): | |||||||||||||||
Basic | $ | (0.04 | ) | $ | 1.61 | $ | 0.07 | $ | (0.80 | ) | |||||
Diluted | $ | (0.04 | ) | $ | 1.60 | $ | 0.07 | $ | (0.80 | ) | |||||
(1) | The earnings per common share calculations for each of the quarters were based upon the weighted average number of shares and share equivalents outstanding during each period, and the sum of the quarters may not be equal to the full year earnings per share amounts. |
77
ITEM 9. CHANGES IN AND DISAGREEMENTS WITH ACCOUNTANTS ON ACCOUNTING AND FINANCIAL DISCLOSURE
None.
ITEM 9A. CONTROLS AND PROCEDURES
Disclosure Controls and Procedures
Exchange Act Rule 13a-15(e) defines "disclosure controls and procedures" to mean controls and procedures of a company that are designed to ensure that information required to be disclosed by the company in the reports that it files or submits under the Exchange Act is recorded, processed, summarized and reported, within the time periods specified in the SEC’s rules and forms. The definition further states that disclosure controls and procedures include, without limitation, controls and procedures designed to ensure that the information required to be disclosed by a company in the reports that it files or submits under the Exchange Act is accumulated and communicated to the company’s management, including its principal executive and principal financial officers, or persons performing similar functions, as appropriate to allow timely decisions regarding required disclosure.
An evaluation was performed under the supervision and with the participation of our management, including our principal executive and principal financial officers, of the effectiveness of the design and operation of our disclosure controls and procedures as of the end of the period covered by this report. Based on that evaluation, our principal executive and principal financial officers have concluded that our disclosure controls and procedures were effective, as of the end of the period covered by this report, to provide reasonable assurance that information required to be disclosed by us in reports that we file or submit under the Exchange Act is recorded, processed, summarized and reported within the time periods specified in SEC rules and forms and is accumulated and communicated to our management to allow timely decisions regarding required disclosures.
Management’s Annual Report on Internal Control Over Financial Reporting
Management is responsible for establishing and maintaining adequate internal control over financial reporting, as such term is defined in Exchange Act Rule 13a-15(f). Our internal control over financial reporting is a process designed to provide reasonable assurance regarding the reliability of financial reporting and preparation of financial statements for external purposes in accordance with U.S. GAAP. Because of inherent limitations, internal control over financial reporting may not prevent or detect misstatements. Also, projections of any evaluation of effectiveness to future periods are subject to the risk that controls may become inadequate because of changes in conditions, or that the degree of compliance with the policies or procedures may deteriorate.
Under the supervision and with the participation of our management, including our principal executive and principal financial officers, we evaluated the effectiveness of our internal control over financial reporting based on the 2013 Internal Control-Integrated Framework issued by the Committee of Sponsoring Organizations of the Treadway Commission ("COSO") in Internal Control Integrated Framework. Based on our evaluation under this framework, our management concluded that our internal control over financial reporting was effective as of December 31, 2019.
The effectiveness of our internal control over financial reporting as of December 31, 2019 has been audited by Grant Thornton LLP, an independent registered public accounting firm, as stated in its attestation report which is included herein.
Changes in Internal Control Over Financial Reporting
There have been no changes in our internal control over financial reporting during the fourth quarter of 2019 that have materially affected, or are reasonably likely to affect, our internal control over financial reporting.
78
REPORT OF INDEPENDENT REGISTERED PUBLIC ACCOUNTING FIRM
Board of Directors and Stockholders
Universal Electronics Inc.
Opinion on internal control over financial reporting
We have audited the internal control over financial reporting of Universal Electronics Inc. (a Delaware corporation) (the "Company") as of December 31, 2019, based on criteria established in the 2013 Internal Control-Integrated Framework issued by the Committee of Sponsoring Organizations of the Treadway Commission (COSO). In our opinion, the Company maintained, in all material respects, effective internal control over financial reporting as of December 31, 2019, based on criteria established in the 2013 Internal Control-Integrated Framework issued by COSO.
We also have audited, in accordance with the standards of the Public Company Accounting Oversight Board (United States) ("PCAOB"), the consolidated financial statements of the Company as of and for the year ended December 31, 2019, and our report dated March 13, 2020 expressed an unqualified opinion on those financial statements.
Basis for opinion
The Company’s management is responsible for maintaining effective internal control over financial reporting and for its assessment of the effectiveness of internal control over financial reporting, included in the accompanying Management’s Annual Report on Internal Control Over Financial Reporting ("Management’s Report"). Our responsibility is to express an opinion on the Company’s internal control over financial reporting based on our audit. We are a public accounting firm registered with the PCAOB and are required to be independent with respect to the Company in accordance with the U.S. federal securities laws and the applicable rules and regulations of the Securities and Exchange Commission and the PCAOB.
We conducted our audit in accordance with the standards of the PCAOB. Those standards require that we plan and perform the audit to obtain reasonable assurance about whether effective internal control over financial reporting was maintained in all material respects. Our audit included obtaining an understanding of internal control over financial reporting, assessing the risk that a material weakness exists, testing and evaluating the design and operating effectiveness of internal control based on the assessed risk, and performing such other procedures as we considered necessary in the circumstances. We believe that our audit provides a reasonable basis for our opinion.
Definition and limitations of internal control over financial reporting
A company’s internal control over financial reporting is a process designed to provide reasonable assurance regarding the reliability of financial reporting and the preparation of financial statements for external purposes in accordance with generally accepted accounting principles. A company’s internal control over financial reporting includes those policies and procedures that (1) pertain to the maintenance of records that, in reasonable detail, accurately and fairly reflect the transactions and dispositions of the assets of the company; (2) provide reasonable assurance that transactions are recorded as necessary to permit preparation of financial statements in accordance with generally accepted accounting principles, and that receipts and expenditures of the company are being made only in accordance with authorizations of management and directors of the company; and (3) provide reasonable assurance regarding prevention or timely detection of unauthorized acquisition, use, or disposition of the company’s assets that could have a material effect on the financial statements.
Because of its inherent limitations, internal control over financial reporting may not prevent or detect misstatements. Also, projections of any evaluation of effectiveness to future periods are subject to the risk that controls may become inadequate because of changes in conditions, or that the degree of compliance with the policies or procedures may deteriorate.
/s/ GRANT THORNTON LLP
Los Angeles, California
March 13, 2020
79
ITEM 9B. OTHER INFORMATION
None.
PART III
ITEM 10. DIRECTORS, EXECUTIVE OFFICERS, AND CORPORATE GOVERNANCE
Information required by Item 401 of Regulation S-K with respect to our directors will be contained in and is hereby incorporated by reference to our definitive Proxy Statement for our 2020 Annual Meeting of Stockholders to be filed pursuant to Regulation 14A promulgated by the Securities and Exchange Commission under the Exchange Act. Information regarding executive officers of the Company is set forth in Part I of this Form 10-K.
Code of Conduct. We have adopted a code of conduct that applies to all of our employees, including without limitation our principal executive officer, principal financial officer and principal accounting officer. A copy of the Code of Conduct is included as Exhibit 14.1 to our Annual Report on Form 10-K for the year ended December 31, 2003 filed on March 14, 2004 (File No. 0-21044). The Code of Conduct is also available on our website, www.uei.com under the caption "Corporate Governance" on the Investor page. We will post on our website information regarding any amendment to, or waiver from, any provision of the Code of Conduct that applies to our principal executive officer, principal financial officer or principal accounting officer.
Information required by Items 407(c)(3), (d)(4) and (d)(5) of Regulation S-K will be contained in and is hereby incorporated by reference to our definitive Proxy Statement for our 2020 Annual Meeting of Stockholders to be filed pursuant to Regulation 14A promulgated by the Securities and Exchange Commission under the Exchange Act.
ITEM 11. EXECUTIVE COMPENSATION
Information required by Items 402 and 407(e)(4) and (e)(5) of Regulation S-K will be contained in and is hereby incorporated by reference to our definitive Proxy Statement for our 2020 Annual Meeting of Stockholders to be filed pursuant to Regulation 14A promulgated by the SEC under the Exchange Act.
ITEM 12. SECURITY OWNERSHIP OF CERTAIN BENEFICIAL OWNERS AND MANAGEMENT AND RELATED STOCKHOLDER MATTERS
Information required by Item 403 of Regulation S-K will be contained in and is hereby incorporated by reference to our definitive Proxy Statement for our 2020 Annual Meeting of Stockholders to be filed pursuant to Regulation 14A promulgated by the SEC under the Exchange Act.
The following summarizes our equity compensation plans at December 31, 2019:
Equity Compensation Plan Information
(a) | (b) | (c) | ||||||||
Plan Category | Number of Securities to be issued upon exercise of outstanding options, warrants and rights | Weighted-average exercise price of outstanding options, warrants and rights | Number of securities remaining available for future issuance under equity compensation plans (excluding securities reflected in column (a)) | |||||||
Equity compensation plans approved by security holders | 745,403 | $ | 41.73 | 544,092 | ||||||
Equity compensation plans not approved by security holders | — | — | — | |||||||
Total | 745,403 | $ | 41.73 | 544,092 | ||||||
See "ITEM 8. FINANCIAL STATEMENTS AND SUPPLEMENTARY DATA- Notes to Consolidated Financial Statements - Note 15" for a description of each of our stock incentive plans.
80
ITEM 13. CERTAIN RELATIONSHIPS AND RELATED TRANSACTIONS
Information required by Items 404 and 407(a) of Regulation S-K will be contained in and is hereby incorporated by reference to our definitive Proxy Statement for our 2020 Annual Meeting of Stockholders to be filed pursuant to Regulation 14A promulgated by the SEC under the Exchange Act.
ITEM 14. PRINCIPAL ACCOUNTANT FEES AND SERVICES
Information required by this item will be contained in and is hereby incorporated by reference to our definitive Proxy Statement for our 2020 Annual Meeting of Stockholders to be filed pursuant to Regulation 14A promulgated by the SEC under the Exchange Act.
PART IV
ITEM 15. EXHIBITS, FINANCIAL STATEMENT SCHEDULES
(1) | Financial Statements |
We include this portion of ITEM 15 under ITEM 8 of this Report on Form 10-K.
(2) | Financial Statement Schedules |
We include the financial statement schedules required by the applicable accounting regulations of the SEC in the notes to our consolidated financial statements and incorporate that information in this ITEM 15 by reference.
(3) | Exhibits |
Any stockholder who would like a copy of any of the exhibits listed on the Exhibit Index in this Report may obtain one from us upon request at a charge that reflects the reproduction cost of such Exhibits. Requests should be made to the Secretary, 15147 N. Scottsdale Road, Suite H300, Scottsdale, Arizona 85254.
81
Exhibit Number | Document Description |
3.1 | Restated Certificate of Incorporation of Universal Electronics Inc., as amended (incorporated by reference to Exhibit 3.1 to the Company's Form S-1 Registration filed on or about December 24, 1992 (File No. 33-56358)) (paper file) |
3.2 | Certificate of Amendment to Restated Certificate of Incorporation of Universal Electronics Inc. (incorporated by reference to Exhibit 3.3 to the Company's Annual Report on Form 10-K for the year ended December 31, 1995 filed on April 1, 1996 (File No. 0-21044)) (paper file) |
3.3 | |
3.4 | |
4.1 | Article Eighth of our Restated Certificate of Incorporation, as amended, contains certain provisions restricting business combinations with interested stockholders under certain circumstances and imposing higher voting requirements for the approval of certain transactions unless the transaction has been approved by two-thirds of the disinterested directors or fair price provisions have been met. (incorporated by reference to Exhibit 3.3 to the Company's Annual Report on Form 10-K for the year ended December 31, 1995 filed on April 1, 1996 (File No. 0-21044)) (paper file) |
4.2 | |
4.3 | |
*10.1 | |
*10.2 | Form of Amendment to Salary Continuation Agreement by and between Universal Electronics Inc. and certain employees (incorporated by reference to Exhibit 10.26 to the Company's Annual Report on Form 10-K for the year ended December 31, 1997, filed on March 30, 1998 (File No. 0-21044)) (paper file) |
*10.3 | Form of Salary Continuation Agreement by and between Universal Electronics Inc. and certain employees (incorporated by reference to Exhibit 10.39 to the Company's Annual Report on Form 10-K for the year ended December 31, 1999 filed on March 30, 2000 (File No. 0-21044)) (paper file) |
*10.4 | Form of Stock Option Agreement by and between Universal Electronics Inc. and certain employees used in connection with options granted to the employees pursuant to the Universal Electronics Inc. 1999A Nonqualified Stock Plan (incorporated by reference to Exhibit 10.43 to the Company's Annual Report on Form 10-K for the year ended December 31, 1999 filed on March 30, 2000 (File No. 0-21044)) (paper file) |
*10.5 | |
*10.6 | |
*10.7 | Form of First Amendment to Executive Officer Employment Agreement dated October 21, 2005 by and between Universal Electronics Inc. and Paul D. Arling (incorporated by reference to Exhibit 10.24 to the Company's Annual Report on Form 10-K for the year ended December 31, 2005 filed on March 16, 2006 (File No. 0-21044)) (paper file) |
*10.8 | |
10.9 | |
*10.10 | |
82
Exhibit Number | Document Description |
*10.11 | |
10.12 | |
10.13 | |
*10.14 | |
*10.15 | |
*10.16 | |
*10.17 | |
10.18 | |
10.19 | |
*10.20 | |
*10.21 | |
*10.22 | |
*10.23 | |
*10.24 | |
10.25 | |
*10.26 | |
10.27 | |
83
Exhibit Number | Document Description |
10.28 | |
10.29 | |
10.30 | |
10.31 | |
10.32 | |
10.33 | |
*10.34 | |
14.1 | |
21.1 | |
23.1 | |
24.1 | |
31.1 | |
31.2 | |
32.1 | |
32.2 | |
101.INS | XBRL Instance Document |
101.SCH | XBRL Taxonomy Extension Schema Document |
101.CAL | XBRL Taxonomy Extension Calculation Linkbase Document |
101.DEF | XBRL Taxonomy Extension Linkbase Document |
101.LAB | XBRL Taxonomy Extension Label Linkbase Document |
101.PRE | XBRL Taxonomy Extension Presentation Linkbase Document |
* | Management contract or compensation plan or arrangement identified pursuant to Items 15(a)(3) and 15(c) of Form 10-K. |
ITEM 16. FORM 10-K SUMMARY
None.
84
SIGNATURES
Pursuant to the requirement of Section 13 or 15(d) of the Securities Exchange Act of 1934, the registrant has duly caused this report to be signed on its behalf by the undersigned, thereunto duly authorized, in the City of Scottsdale, State of Arizona.
UNIVERSAL ELECTRONICS INC. | ||
By: | /s/ Paul D. Arling | |
Paul D. Arling | ||
Chairman and Chief Executive Officer | ||
Date: | March 13, 2020 | |
POWER OF ATTORNEY
Each person whose signature appears below constitutes and appoints Paul D. Arling and Bryan M. Hackworth as true and lawful attorneys-in-fact and agents, each acting alone, with full powers of substitution, for him and in his name, place and stead, in any and all capacities, to sign any and all amendments to this Annual Report on Form 10-K, and to file the same, with all exhibits thereto and other documents in connection therewith, with the Securities and Exchange Commission, granting unto said attorneys-in-fact and agents, each acting alone, full power and authority to do and perform each and every act and thing requisite and necessary to be done in and about the premises, as fully for all intents and purposes as he might or may do in person, thereby ratifying and confirming all that said attorneys-in-fact and agents, each acting alone, or his substitutes, may lawfully do or cause to be done by virtue hereof.
Pursuant to the requirements of the Securities Exchange Act of 1934, this report has been signed below by the following persons on behalf of the registrant and in the capacities and on the dates indicated.
NAME & TITLE | SIGNATURE | DATE | ||
Paul D. Arling Chairman and Chief Executive Officer (principal executive officer) | /s/ Paul D. Arling | March 13, 2020 | ||
Bryan M. Hackworth Chief Financial Officer (principal financial officer and principal accounting officer) | /s/ Bryan M. Hackworth | March 13, 2020 | ||
Satjiv S. Chahil Director | /s/ Satjiv S. Chahil | March 13, 2020 | ||
Sue Ann R. Hamilton Director | /s/ Sue Ann R. Hamilton | March 13, 2020 | ||
William C. Mulligan Director | /s/ William C. Mulligan | March 13, 2020 | ||
J. C. Sparkman Director | /s/ J.C. Sparkman | March 13, 2020 | ||
Gregory P. Stapleton Director | /s/ Gregory P. Stapleton | March 13, 2020 | ||
Carl E. Vogel Director | /s/ Carl E. Vogel | March 13, 2020 | ||
Edward K. Zinser Director | /s/ Edward K. Zinser | March 13, 2020 | ||
85